Article

Battery State-of-Health Evaluation for Roadside Energy Storage Systems in Electric Transportation

1
College of Transportation Engineering, Chang’an University, Xi’an 710064, China
2
Chang’an Dublin International College of Transportation, Chang’an University, Xi’an 710064, China
3
Department of Civil and Environmental Engineering, University of Waterloo, Waterloo, ON N2L 3G1, Canada
*
Authors to whom correspondence should be addressed.
Future Transp. 2023, 3(4), 1310-1325; https://doi.org/10.3390/futuretransp3040072
Submission received: 13 August 2023 / Revised: 29 September 2023 / Accepted: 24 November 2023 / Published: 30 November 2023
(This article belongs to the Topic Low Carbon Energy in Transportation)

Abstract

:
Battery health assessments are essential for roadside energy storage systems that facilitate electric transportation. This paper uses the samples from the charging and discharging data of the base station and the power station under different working conditions at different working hours and at different temperatures to demonstrate the decay of the battery health of a roadside energy storage system under different cycles. In this paper, for the first time, the predicted state-of-health values are obtained by extracting the characteristic quantities affecting the battery health based on three indicators: the internal resistance, the rate of change of voltage, and the change of temperature. Data on state of health are clustered by K-Means, GMM, K-Means++ and divided into high, medium, and low levels. Using a comparison of the three methods, GMM clustering appears to be the best at reflecting the charging and discharging capacity of the battery.

1. Introduction

Unlike gasoline-powered vehicles, electric vehicles (EVs) significantly reduce greenhouse gas emissions and the energy costs of driving [1]. With the advantages in energy and environmental sustainability, EVs have kept strong growth and are shaping the future of transportation towards electric transportation. However, further growth in the field of electric vehicles also faces many technical and market challenges. One of the biggest challenges is that EVs have a much shorter driving range than traditional fuel vehicles due to the limited capacity of the on-board batteries. Furthermore, in the current cities and the network of inter-city transportation, the number of charging infrastructures is much smaller than the fuel stations of traditional vehicles. Both contribute to the range anxiety that EV drivers are suffering from [2]. Range anxiety forces EV drivers to consider the impact of the maximum distance allowed by EVs on travel space when making travel plans. This has changed the individual travel choice behavior of EV drivers to a certain extent. To relieve the driving range anxiety in electric transportation, roadside energy storage systems have emerged as a potential solution [3].
An assembly of roadside energy storage systems brings the benefits of saving the energy generated from wind and solar sources, alleviating range anxiety caused by insufficient power, facilitating charging at any time by placing energy storage facilities on the roadside, and reducing the pressure of electricity consumption in service areas [4]. Because solar and wind energy are sustainable and renewable and do not cause pollution to the environment, smart power stations integrated with wind and luminous energy to solve the problem of electricity consumption were advocated [5]. The establishment of smart power stations integrated with wind and luminous energy can significantly reduce the emissions of carbon dioxide and other greenhouse gases. By taking advantage of the complementary characteristics of wind and solar energy, a relatively stable total output can be achieved. The system has high power supply stability and reliability. It can also reduce the capacity demand for energy storage batteries and obtain better economic benefits while ensuring the same power supply [6]. The utilization of renewable energy has been growing worldwide in recent decades. It was shown that wind energy is less stable than solar energy and wind energy mainly takes the form of grid-connected large-scale wind power stations. To solve the power supply problem of residential areas, an alternative scheme of wind/diesel power stations is generally adopted. The Dutch controllers for photovoltaic power plants have reached a specialized level of production and the technical performance has greatly improved. The charging efficiency can be increased by 30% compared to the normal controller when the battery loses power and the light intensity is weak [7]. As part of the cooperation between China and Japan in the development and utilization of new energy, NEDO has installed 14 sets of independently operated photovoltaic centralized power stations [8]. In these projects, an energy storage system (ESS) on the roadside that consists of a multi-cell battery system helps to store renewable energies, and an accurate battery performance evaluation is essential for energy storage management and control [9].
Figure 1 shows the components of an energy storage power station. It can be seen from the figure that the solar photovoltaic panel and the high-voltage power grid transmit the collected electric energy to the power conversion system (PCS) in the form of alternating current and direct current. Through the rectifier inside the energy storage converter, the alternating current is transmitted to the user’s household load, the direct current is transmitted to the energy storage system and the battery cluster (rack), and the current change data in the energy storage converter is transmitted to the control platform. Then, the control platform controls the converter based on the received data, and the energy storage system meets its charging requirements according to the battery status of the electric vehicle.
In roadside ESSs, the thermal and electric behavior of the batteries is key to ensuring safety. The battery state of charging (SOC) and state of health (SOH) are important parameters in order to measure the performance of the battery. Accurate SOC and SOH estimation improves the efficiency of the control and maintenance actions. The SOC and SOH describe battery health from the micro to the macro level [10].
The SOH of a battery refers to its overall health condition, including the extent of capacity degradation and performance deterioration during its usage. Research on battery SOH aims to better assess battery life and performance, providing accurate information for battery management systems. Currently, research on battery SOH mainly focuses on the following aspects: capacity degradation models, health assessment algorithms, diagnosis and monitoring systems, and battery management system (BMS) optimization. This paper mainly focuses on health assessment algorithms.
The SOH assessment algorithms can be categorized into model-fitting- and data-driven-based methods. The model-fitting-based methods include internal resistance and open-circuit voltage analysis as well as electrochemical impedance spectroscopy [11], reflected in a set of complex nonlinear equations based on empirical knowledge. The Gaussian process regression models can be used for SOH evaluation. The semi-empirical method integrated the degrading of these parameters. Wei et al. presented an estimation method that combined Dempster–Shafer’s theory and the Bayesian Monte Carlo method [12]. Differential voltage analysis (DVA) was used to derive time-related aging behavior in a quantitative manner. The Kalman filter and Bayesian filtering methods are used to update parameters for each cycle [13]. Due to the complex nature of the aging mechanisms, a single model may not be enough to capture the complex degradation process. Furthermore, in real applications, it is difficult to measure the battery capacity because of the incomplete discharge and charging process. Moreover, the pre-knowledge of battery chemistry or dynamics is difficult to obtain.
Using deep learning or machine learning techniques, data-driven methods do not need explicit mathematical models to obtain information about battery voltage, current, and charge capacity during a partial charge cycle, which appears to be a promising solution to the complex nonlinear problem of battery assessment. The least square-support vector machine (LS-SVM) algorithm was used to estimate SOC and SOH with degrading data [14]. The artificial neural networks (ANNs) can be trained to describe the relationships between charging/discharging power and battery SOC without solving nonlinear equations.
To date, the online real-time evaluation of battery health for roadside energy storage systems still poses substantial challenges due to the difficulty in directly observing internal chemical and physical changes; therefore, indirect measurement techniques, involving the use of sensors and monitoring devices, are desirable. In addition, selecting appropriate sensors and devising efficient data acquisition and processing methods remain ongoing challenges, particularly in environments characterized by high temperatures, pressures, and currents.
This paper aims to address the challenges of online SOH evaluation in two areas. First, characteristic quantities are extracted from charging and discharging data of the base station and power station based on three indicators: the internal resistance, the rate of change of voltage, and the change of temperature SOH values, which are predicted by long short-time memory networks. Second, based on the preliminary SOH values, three clustering methods, namely K-Means, the Gaussian Mixture Model (GMM), and K-Means++, are employed to classify the general battery health status in terms of high, medium and low.
The rest of the paper is organized as follows: Section 2 introduces the framework for online SOH evaluation using health indicator extraction as well as the basics of a real-world case study. Section 3 demonstrates the experimental results of the case study. Section 4 and Section 5 are the discussion and conclusion.

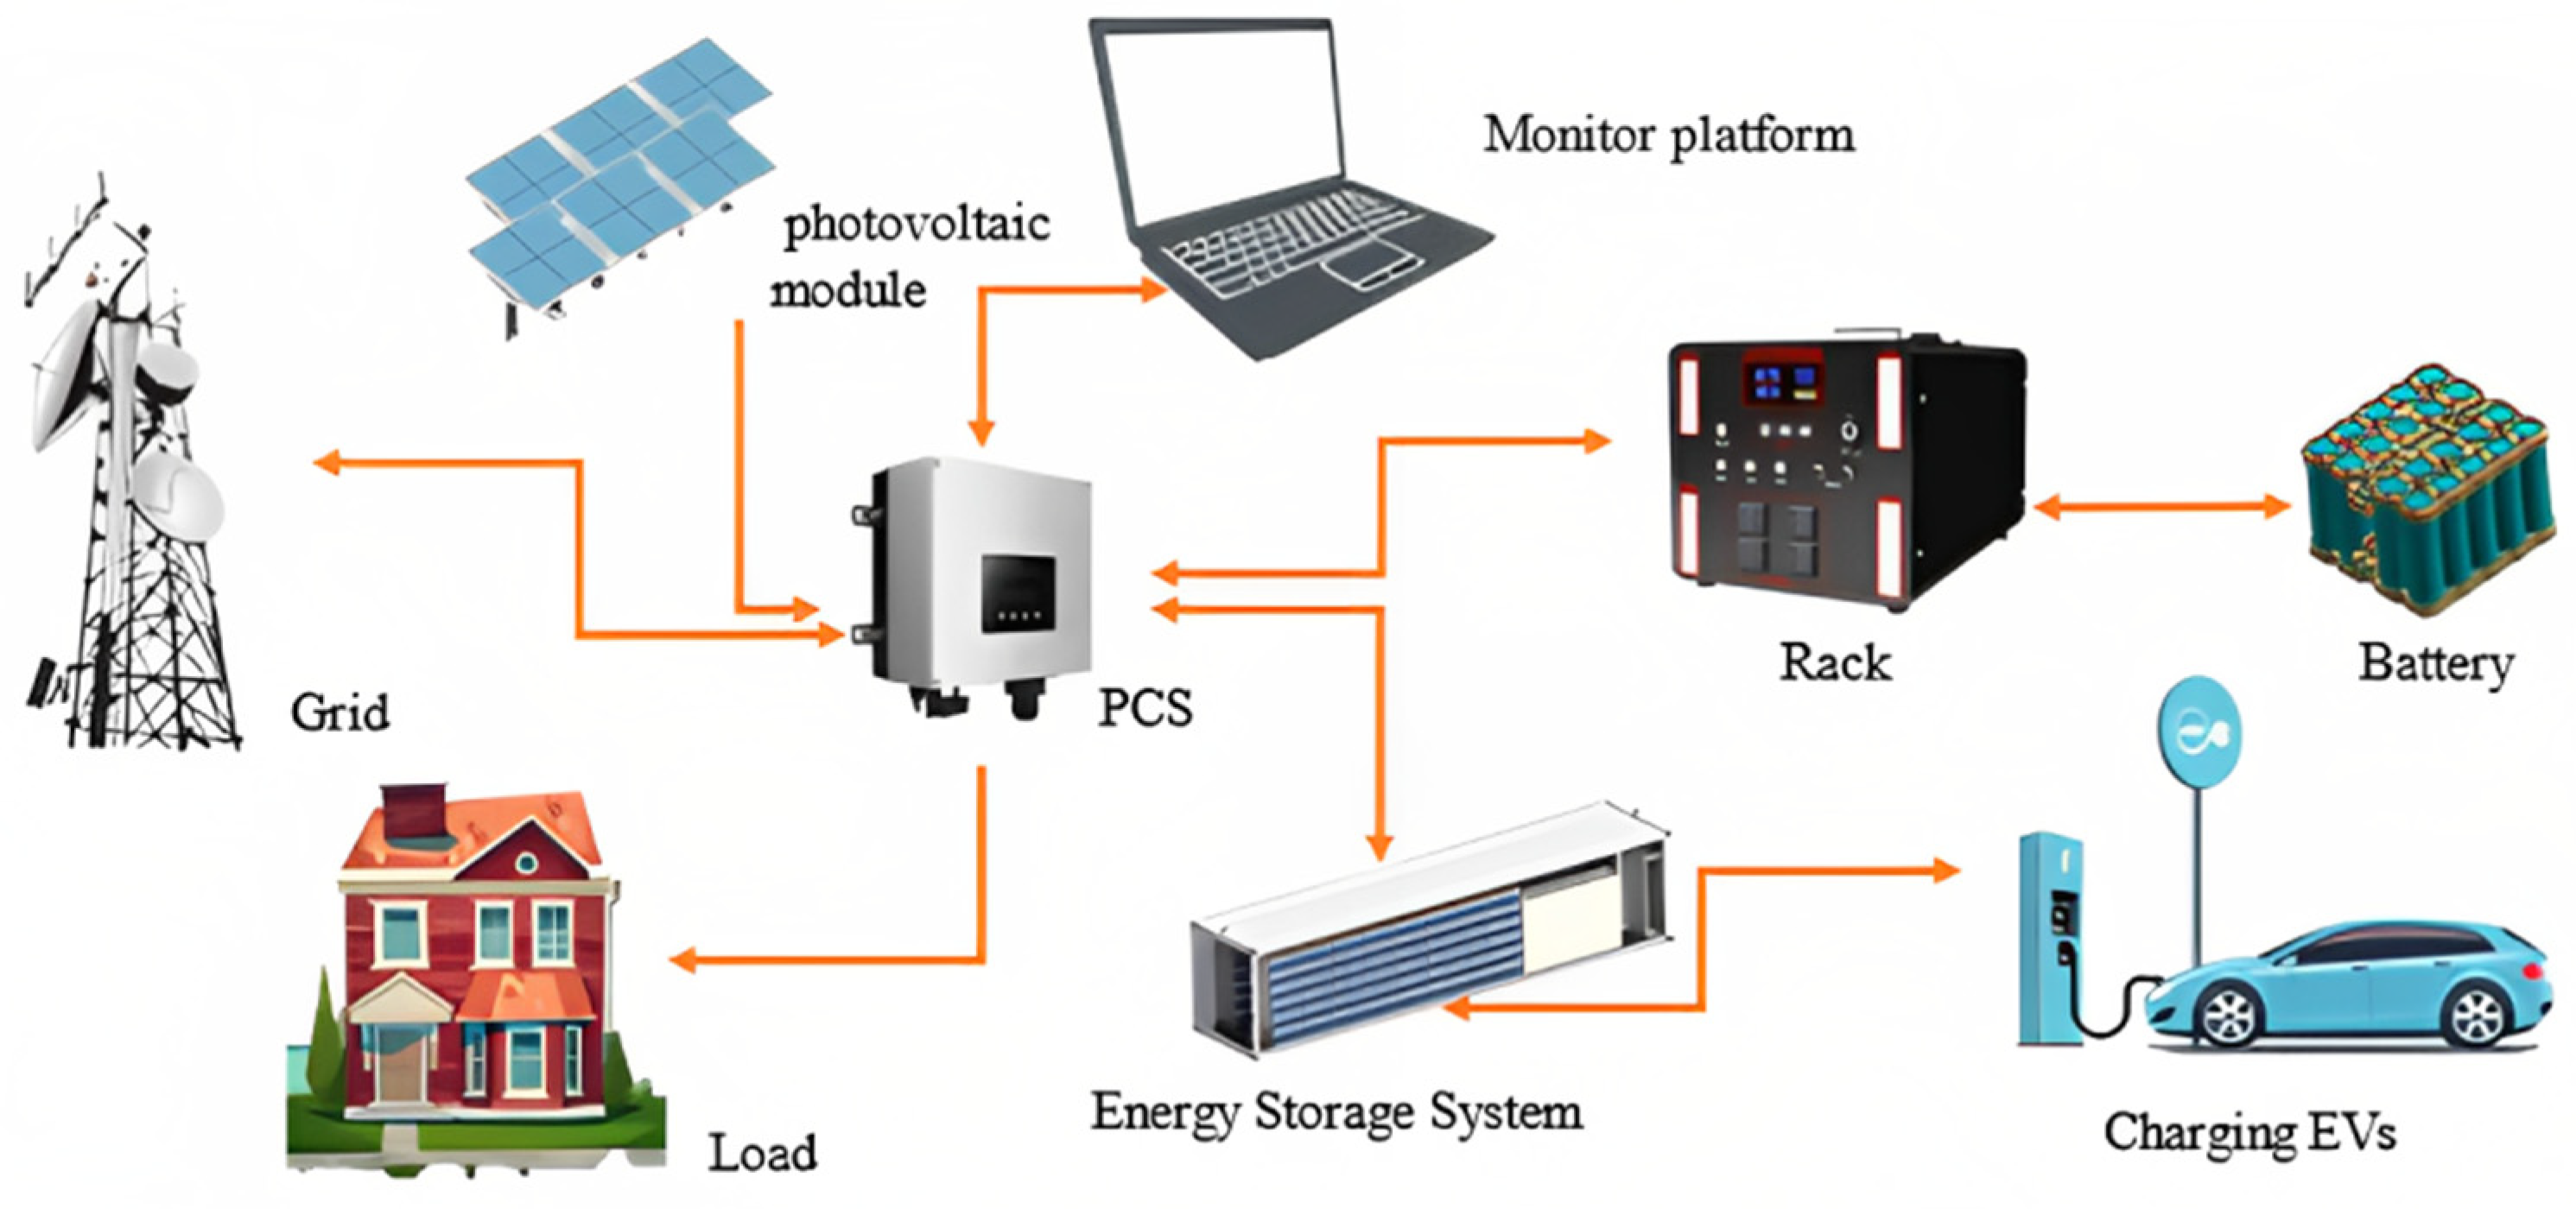
2. Case Study of a Roadside Energy Storage System

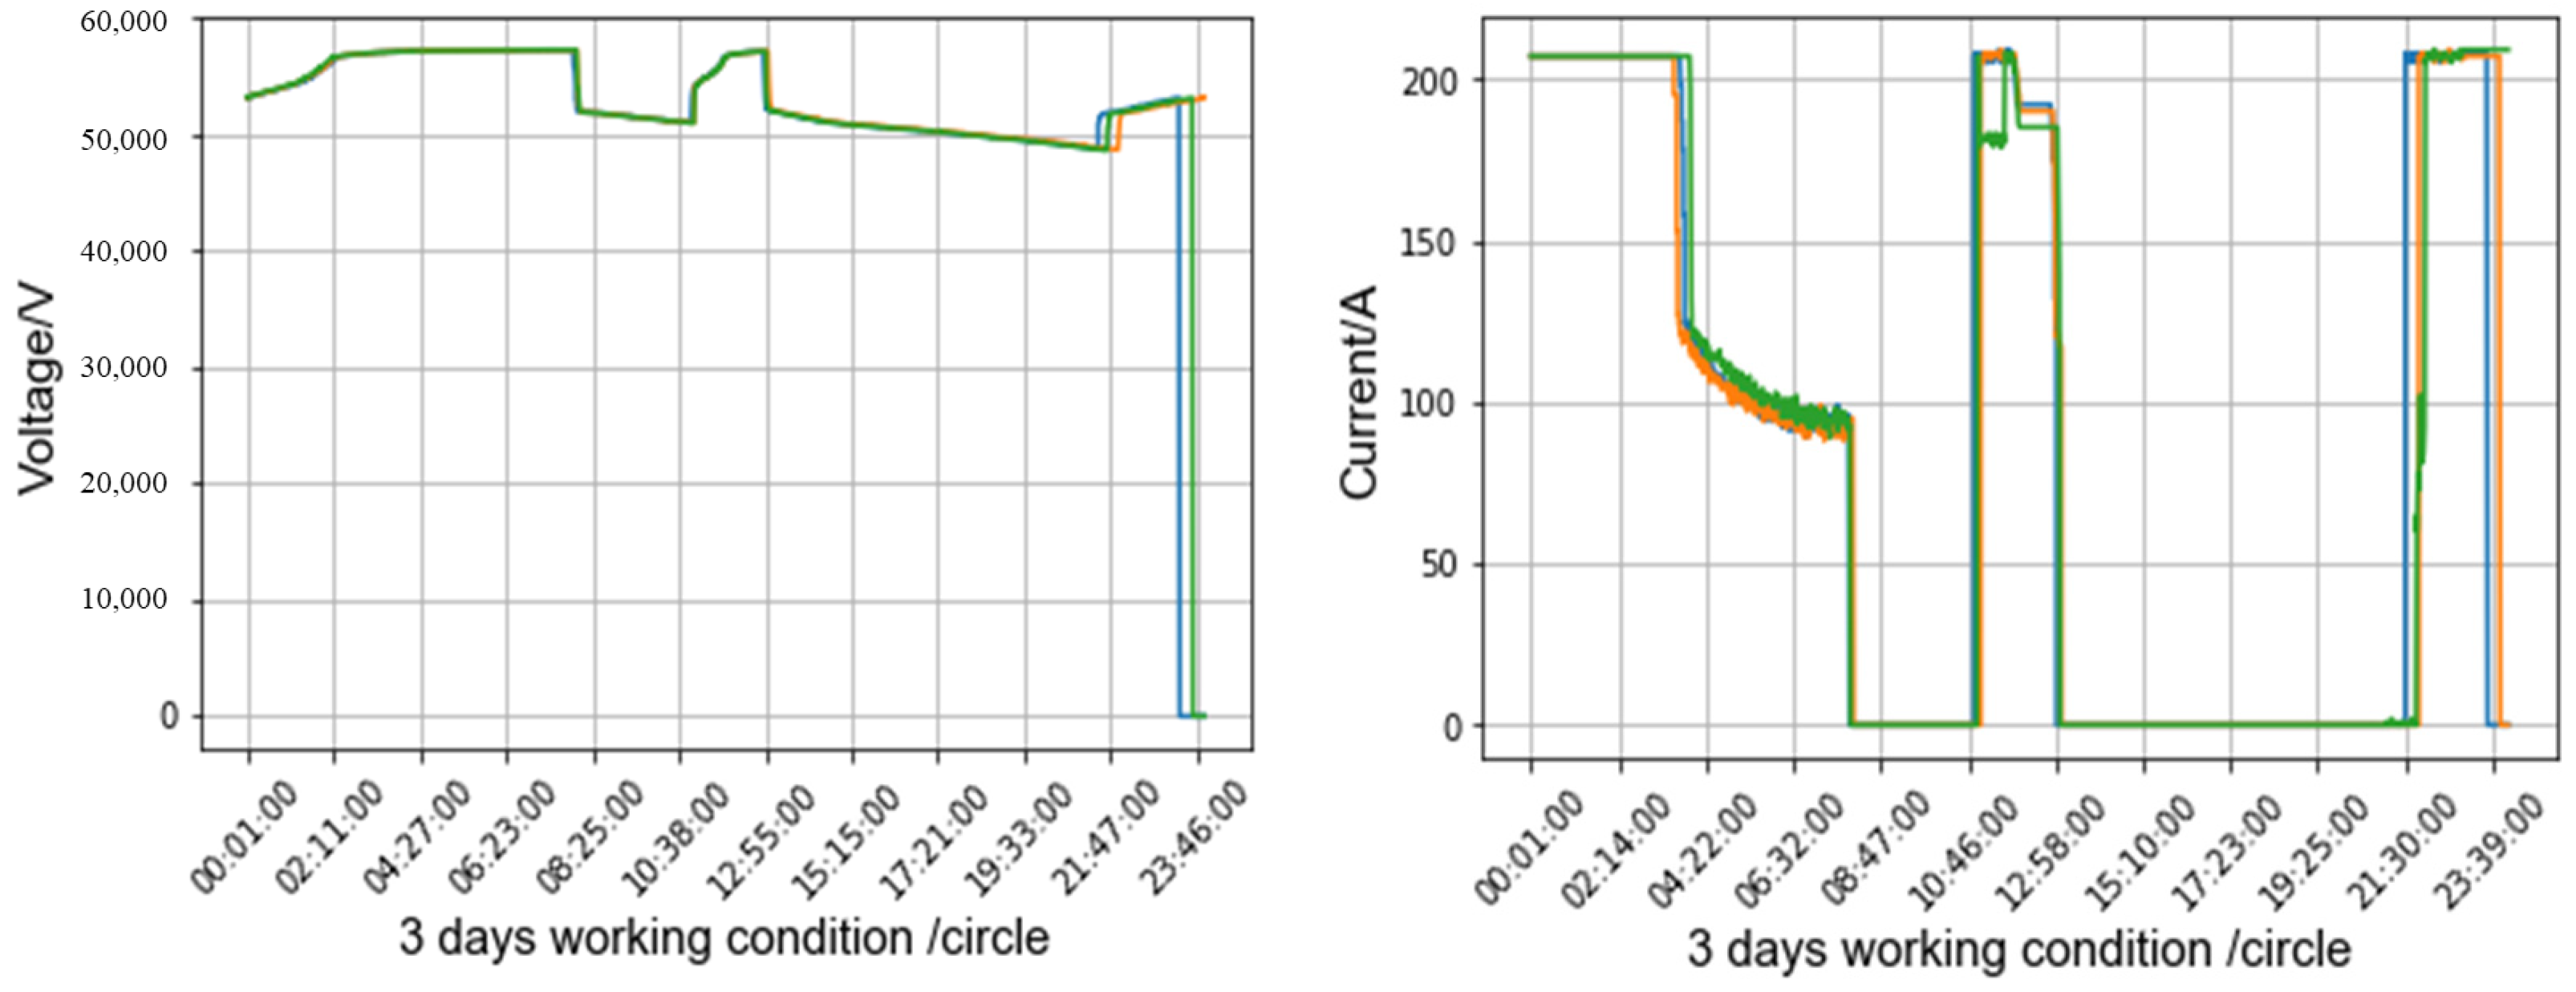
2.1. Data Collection

This case study is based on the data of a roadside energy storage system developed and completed in 2018 that was intended to reduce the energy consumption of 5G mobile nodes. The energy storage system is charged at night and discharged at peak hours during the day. The energy storage system is composed of lead–acid battery packs, each containing four battery packs. The current standard discharge rate is 120 A. The operation data from the energy storage system are collected from January 2021 to December 2021. Real-time data were collected every 30 s. Collected data sets include group voltage, battery voltage, ambient and on-board temperature, module static voltage and total current. The discharge rate of each cycle is constant. The accuracy is 0.1 V. From this, the change in discharge capacity and battery health status in the first 1500 cycles of the battery were obtained, as shown in Figure 2.
The roadside energy storage power station was put into operation on 1 January 2021, and the ambient temperature was set at 25 °C. Because the specific charging and discharging behavior is determined according to the user’s demand, this paper takes one month’s data as a cycle to study. However, due to the huge amount of data, the typical three days are selected as the representative data, i.e., the data of the battery on 1 February, 11 February, and 27 February, as shown in Figure 3.
It can be seen that the change in current and voltage in three days is basically consistent with time, which means that the energy storage power station is charged and discharged at a fixed time in three days, and there is no sign of current and voltage decay, indicating the good battery consistency of the energy storage power station.

2.2. Data Screening

Outliers in the charging and discharging data of the energy storage station tend to reduce the accuracy of the model. To improve the reliability of the results, 800 mA discharge data and voltage data other than 11–14.5 cell are removed. Not only can this improve the quality of data in the original database, but it can also avoid repeated cleaning work when extracting data again. The cleaned data are then used to obtain the voltage changes of the four batteries in the series, as shown in Figure 4. The statistical results of voltage, current, and temperature data of the energy storage power station under working state are shown in Table 1. The table gives the total operating voltage, single cell voltage, single-row battery pack voltage, and total voltage, as well as the ambient temperature and operating temperature of the energy storage system in detail, and contains the maximum, minimum, average, and standard deviation of the current under the main battery operating conditions.

2.3. Data Processing

The goal of feature extraction in the battery health assessment is to extract relevant features from the battery performance data that are indicative of the health condition. In this study, the focus was on extracting features that have a significant influence on battery lifespan. The analysis considered four key aspects: battery pack consistency, internal resistance balance, temperature balance, and battery-cell balance. These factors were carefully considered to identify and quantify the critical factors that affect the longevity of the batteries under investigation.

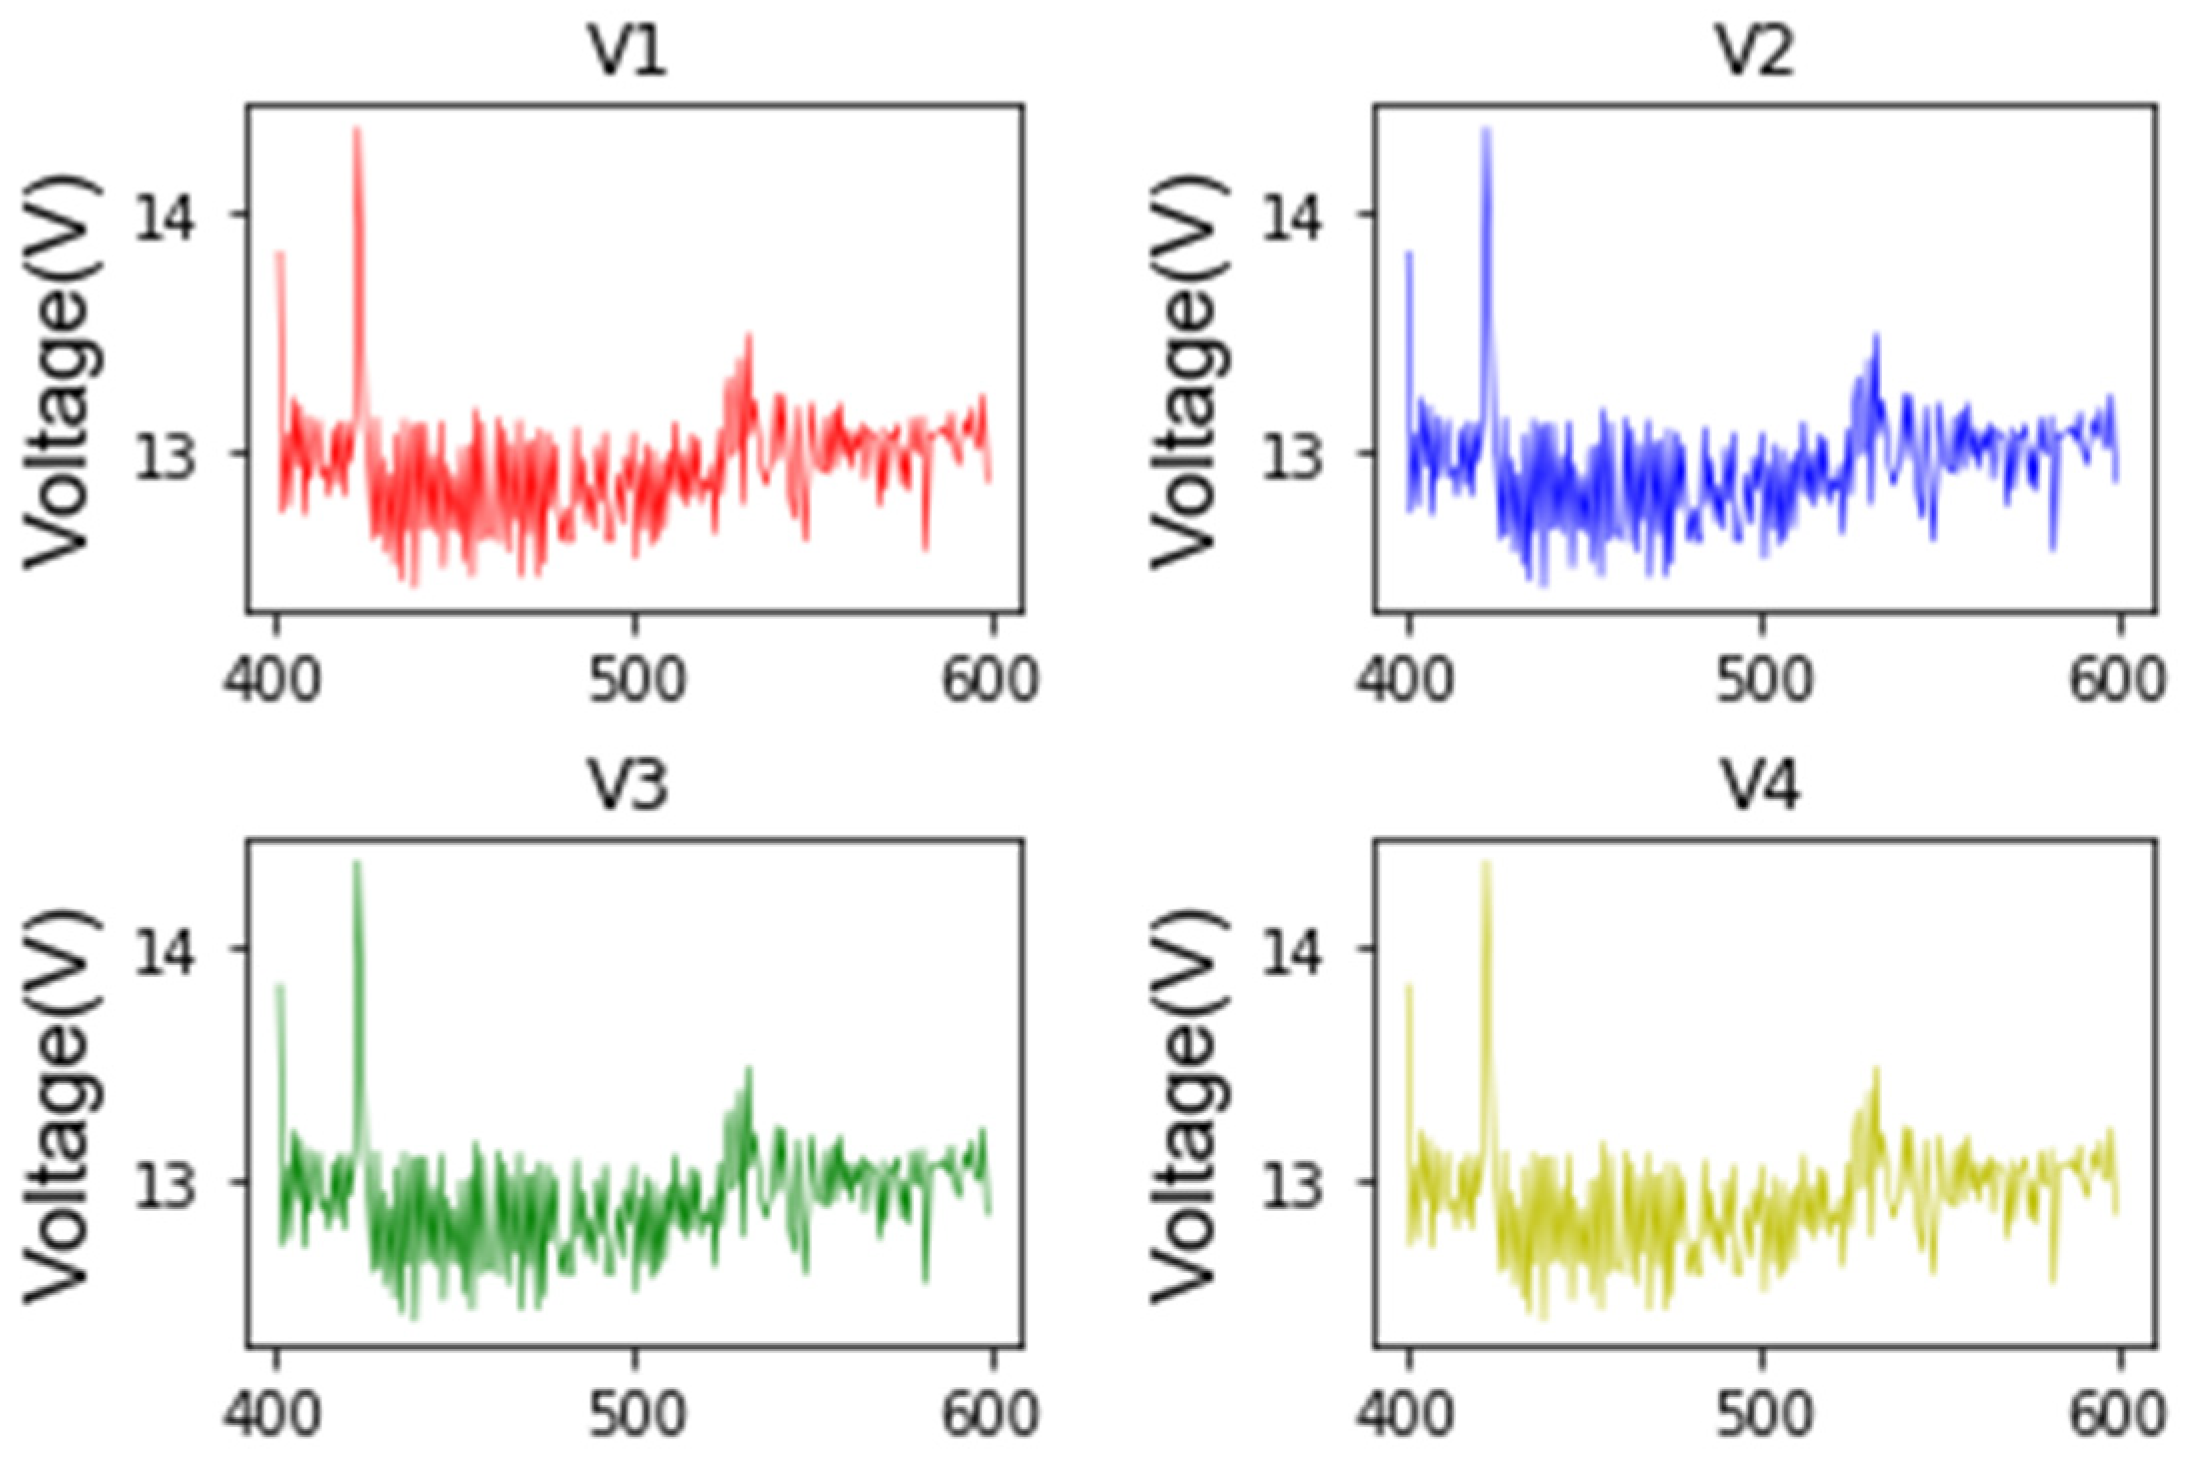
2.3.1. Battery-Pack Consistency Assessment

In this study, the battery-cell characteristics combined with battery pack consistency are considered, including the following indicators.
It is assumed that the number of battery cells is N . The ith battery voltage is Ui and the rest voltage in the group is U j ( j N , j i ) . The average voltage of the rest battery cell in the battery pack is u a v , which is defined as Equation (1):
u a v = 1 N 1 j = 1 , j i N U j
Then, comparing the cell battery U i and the rest battery cell in the battery pack, the voltage is u a v in the group. If the difference is larger than the thresholds, the battery pack voltage is considered abnormal.
This involves measuring the voltage and capacity of each battery cell in the pack to ensure that they are all functioning similarly. A deviation in voltage or capacity could indicate a faulty or degraded cell.

2.3.2. Internal Resistance Balance

The internal resistance within the batteries group is shown in Equation (2):
R a v = 1 N 1 j = 1 , j i N R j
where R a v is the average internal resistance of the other batteries. Comparing the internal R i and R a v , if the difference is larger than the thresholds, the internal resistance is considered abnormal.
Measuring the internal resistance of each battery cell can help to identify cells with higher-than-normal resistance, which can lead to reduced overall capacity and decreased efficiency.

2.3.3. The Temperature Balance

In the online battery management system, the data on real-time voltage, current, and temperature are collected. The temperature of the battery is used to judge the abnormal states, as shown in Equations (3) and (4):
Δ T i = T i T e n
Δ T a v = 1 N 1 i = 1 , j i N T j
where T e n is the environment temperature; Δ T i is the temperature increment in of the ith temperature; and Δ T a v is the avenge temperature increment in the group. If the temperature positive deviation is larger than thresholds, the internal resistance is considered abnormal.
Monitoring the temperature of each battery cell in the pack can help to identify any cells that are overheating or experiencing temperature fluctuations, which can cause degradation over time.

2.3.4. The Battery-Cell Balance

The maximum voltage of the battery cell is Vmax and the minimum voltage is V min . A proper voltage analysis interval is chosen to obtain the voltage interval points: [Vmax, Vmax-1 × Vinterval, Vmax-2 × Vinterval, Vmax-3 × Vinterval, …, Vmax-(k-1) × Vinterval]. Then, the data between each interval were checked by comparing the difference between the maximum and minimum current, Id. An Id that is greater than the threshold was deleted from the data sets. The average current I ¯ of the segment was calculated. Therefore, the segments in the C 1 t h cycle and in the C 2 t h cycle are described as [ ( V c 2 1 , I c 2 1 ) , ( V c 2 2 , I c 2 2 ) , , ( V c 2 N , I c 2 N ) ] , and N is the number of collected segments. The amp-hour integrator method was used to calculate the electric capacity Qd. The Q series changes in each segment and the Q-series are provided in Equations (5)–(7):
Q d , c 1 = ( Q d , c 1 1 , Q d , c 1 2 , Q d , c 1 N )
Q d , c 2 = ( Q d , c 2 1 , Q d , c 2 2 , Q d , c 2 N )
Q d = Q d , c 2 Q d , c 1 = ( Q d 1 , Q d 2 , Q d N )
where the Q d is electricity capacity deviation during the C 1 and C 2 cycle and V a r c 1 , c 2 represents the deviation of the electricity quantity between C 1 and C 2 .
Balancing the charge and discharge of each battery cell in the pack can help to ensure that they are all being used evenly, which can prolong the overall life of the battery pack. The battery pack is composed of four battery cells. Battery pack features can be used to describe the battery operation. The data of current, voltage, and temperature are extracted in C 1 and C 2 under the charging and discharging conditions. The feature series are shown in Equations (8) and (9):
T c 1 d i f f = ( T c 1 , d i f f 1 , T c 1 , d i f f 2 , T c 1 , d i f f p )
V c 1 d i f f = ( V c 1 , d i f f 1 , V c 1 , d i f f 2 , V c 1 , d i f f p )
where T c 1 d i f f is the temperature gaps in the C 1 t h cycle and V c 1 d i f f is the voltage gaps in the C 1 t h cycle.
The sample entropy (SampEn) indicates the randomness of a series of data without any previous knowledge. The following equation is used to measure the sample entropy information:
H = n l o g V c p
The sample entropy for temperature and voltage are as follows:
T E n c 1 = ( T E n c 1 1 , T E n c 1 2 , T E n c 1 p ) V E n c 1 = ( V E n c 1 1 , V E n c 1 2 , V E n c 1 p )
where T E n c 1 p is the temperature at the pth point and V E n c 1 p is the sample entropy of the voltage.
The sample entropies for temperature and voltage here are used as health indicators for the batteries in the energy storage system.

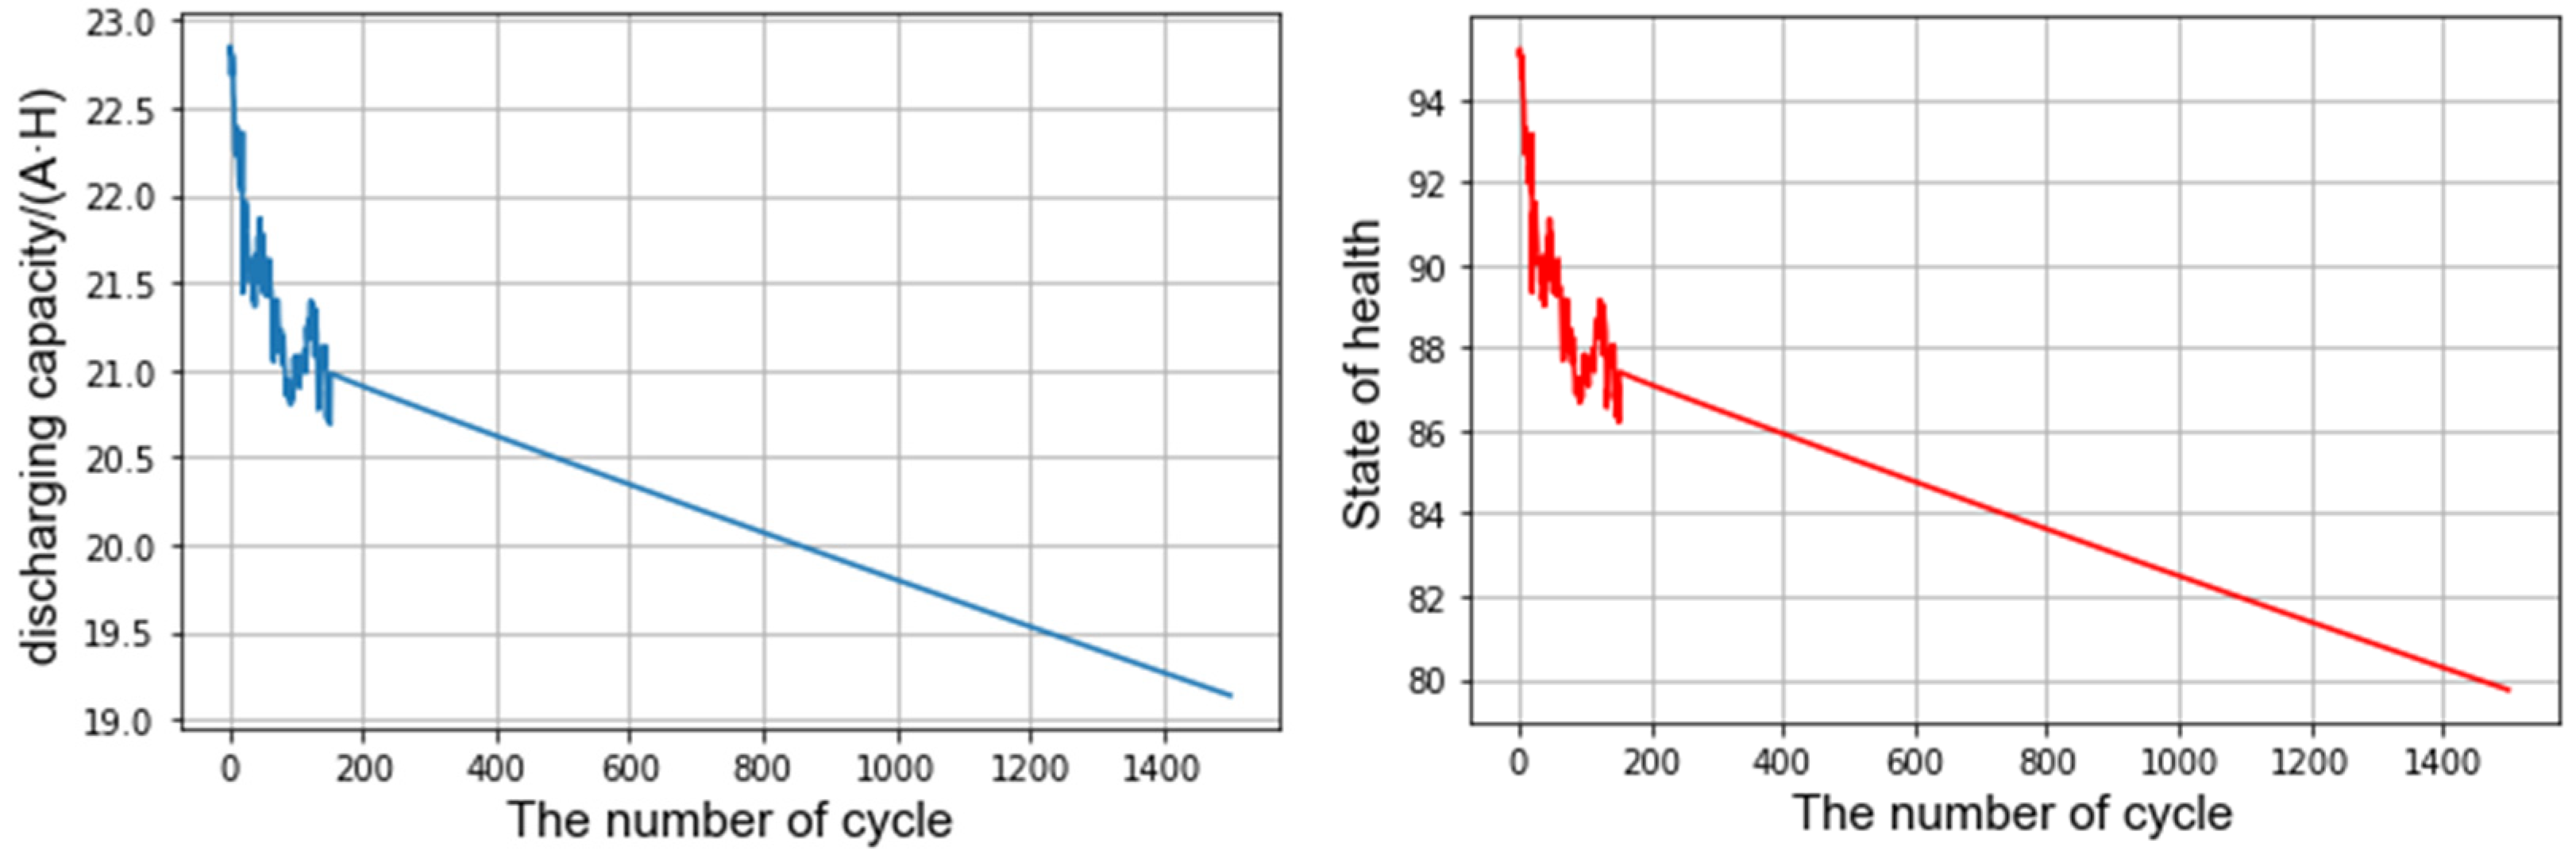
2.4. SOH Calculation

Analyzing the data collected through these assessments can evaluate the overall health and capacity of the battery pack and can help determine whether it needs to be replaced or serviced.
The imbalance of SOH within battery cells and high temperatures can cause problems such as thermal runway or a shorter lifespan. In order to identify factors that influence the SOH, in this study, the combination of features of the battery cell and pack are extracted to evaluate the health of the battery. Based on the analyses of the data sets, the following features are chosen to be analyzed, as shown in Table 2.
In practical applications, it is difficult to directly use the capacity of the batteries to estimate the SOH of the batteries. To address this challenge, in this paper, several easily accessible parameters were measured using sensors, and their correlation with the degree of deterioration of the batteries was analyzed. Finally, three health factors, namely the internal resistance, the rate of change of the voltage, and the change of temperature were extracted as input indicators. Pearson’s correlation coefficient was introduced to analyze the correlation between the three health factors and the health status of the batteries. Analyzing the correlation data in Table 2, the absolute value of the Pearson’s correlation coefficient between the selected health factors and the health status of the battery is very close to 1, which is a strong correlation and can indirectly reflect the health status of the battery.
The Pearson correlation coefficient can measure the linear correlation between features. The output values range from −1 to 1, where numbers closer to either end indicate stronger correlations. A value of 1 signifies a strong positive correlation, while −1 indicates a strong negative correlation. A value of 0 implies no correlation. Pearson’s correlation coefficient (PCC) was computed by centering the coefficients on the values calculated from similarity, expressed through Euclidean distance. The values were then centered based on similarity expressed through Euclidean distance, after which the cosine distance of the centered results was determined. This calculation process eliminates differences between the scales of variables. The centering result is used to calculate the cosine distance, which eliminates differences in variable scales during the calculation process. The formula for its calculation is as follows:
r = i = 1 n ( x i x ¯ ) ( y i y ¯ ) i = 1 n ( x i x ¯ ) 2 i = 1 n ( y i y ¯ ) 2
where x ¯ represents the mean value of the health factor and y ¯ represents the mean value of the SOH.
Battery health estimation for energy storage systems essentially belongs to the category of time series prediction, and the recurrent neural network method (RNN) is the typical method for dealing with time series data. However, RNNs suffer from the problem of “long-term dependence”, where the gradient vanishes or explodes when processing long time series data. To overcome this problem, the long short-term memory (LSTM) model was favored by many researchers, which means the LSTM model is widely used in various fields. The LSTM model improves the RNN by introducing the gating mechanism. This effectively solves the defects of the RNN and is a type of RNN with a special structure, which is therefore applied in this paper. Figure 5 contains an LSTM structure diagram.
In Figure 5, x t denotes the input of the neuron at time t, h t denotes the state value of the implicit layer of the network at time t. σ , and tanh are two activation functions commonly used in neural networks for mapping the output values of a certain range. The specific functions are as follows:
Oblivion Gate:
f t = σ ( W f [ h t 1 , x t ] + b f )
Input Gate:
i t = σ ( W i [ h t 1 , x t ] + b i )
g t = tanh ( W g [ h t 1 , x t ] + b g )
Output Gate:
o t = σ ( W o [ h t 1 , x t ] + b o )
h t = tanh ( c t ) o t
where h is the implicit layer of the LSTM network and h t 1 and h t are the implicit layer of the LSTM network at time (t − 1) and time t, respectively. W f , W I , W g , W o , b f , b i , b g , b o are memory modules connected together to form a chain structure, and each LSTM memory unit can control the data storage and forgetting operations and carry out effective information transfer between the chain structure until the completion of the last memory unit, thus extracting the data with temporal characteristics. The network structure of LSTM is shown in Figure 6.
By inputting the LSTM neural network and setting the number of hidden layers of the LSTM, feature extraction can be achieved, the amount of input can be simplified, and the speed of the operation can be improved. Partial input and output data for the prediction of the SOH are demonstrated in Table 3.
After determining the input and output data, in order to eliminate the influence of different magnitudes and units between different features and improve the convergence ability of the model, the input and output data are normalized so that the sequence of each feature is kept within [0, 1]. The results are shown in Figure 7.
From Figure 7, it can be seen that the value of battery health decreases in a nonlinear manner as the number of cycles increases, and the internal resistance becomes higher and higher as a result; therefore, the value of SOH can be estimated under a different number of cycles, which lays the foundation for the next step of the clustering analysis. The formula for its calculation is as follows.
The relationship between SOH and voltage, resistance, and temperature is:
S O H = k 1 T e k 2 t + k 3 u t + k 4 R t ,
where T, u, R, and t, respectively, represent temperature, voltage, internal resistance, and the number of cycles. k 1 , k 2 , k 3 , k 4 are constants that can be obtained by statistical techniques such as regression analysis. Formula (18) can be used to monitor the battery health of roadside energy storage facilities to ensure that the batteries are replaced at the right time, thereby maintaining the normal operation of the energy storage system.

3. State-of-Health Evaluation

3.1. Health State Segmentation

Online battery health evaluation for energy storage systems is a challenging task due to the complexity of real-world conditions, limited access to batteries, limited data, variability in battery performance, and high costs. While laboratory evaluations provide valuable insights into battery performance and health, online evaluation is essential to ensure the safe and efficient operation of energy storage systems in real-world applications.
Fully discharging and charging a battery is not practical or desirable for most battery-powered systems due to the potential damage to the battery and reduced lifespan. In addition, the mathematical models that are commonly used to predict battery performance and health require a detailed knowledge of the battery chemistry and the operating conditions, which can be difficult to obtain in real-world settings.
Battery aging is a complex process that depends on many factors, including the type of battery chemistry, the operating conditions, and the usage patterns. In order to accurately model battery aging, it is necessary to collect detailed data on these factors over a long period of time, which may not be feasible or cost-effective in many applications [15]. Instead of relying solely on mathematical modeling, many researchers and engineers are turning to data-driven approaches for battery health monitoring and evaluation. By collecting and analyzing data on battery performance and usage patterns in real-world settings, it may be possible to develop more accurate and reliable models for predicting battery health and the remaining lifespan.
Using unsupervised machine learning algorithms to segment battery health data into different phases may provide insights into the aging process of the battery without relying on complex mathematical models. To divide the different phases of the life cycle, three unsupervised learning algorithms were proposed for the online battery health evaluation. In this study, K-Means, GPR (Gaussian Process Regression), and K-Means++ were applied to the battery health state segmentation.

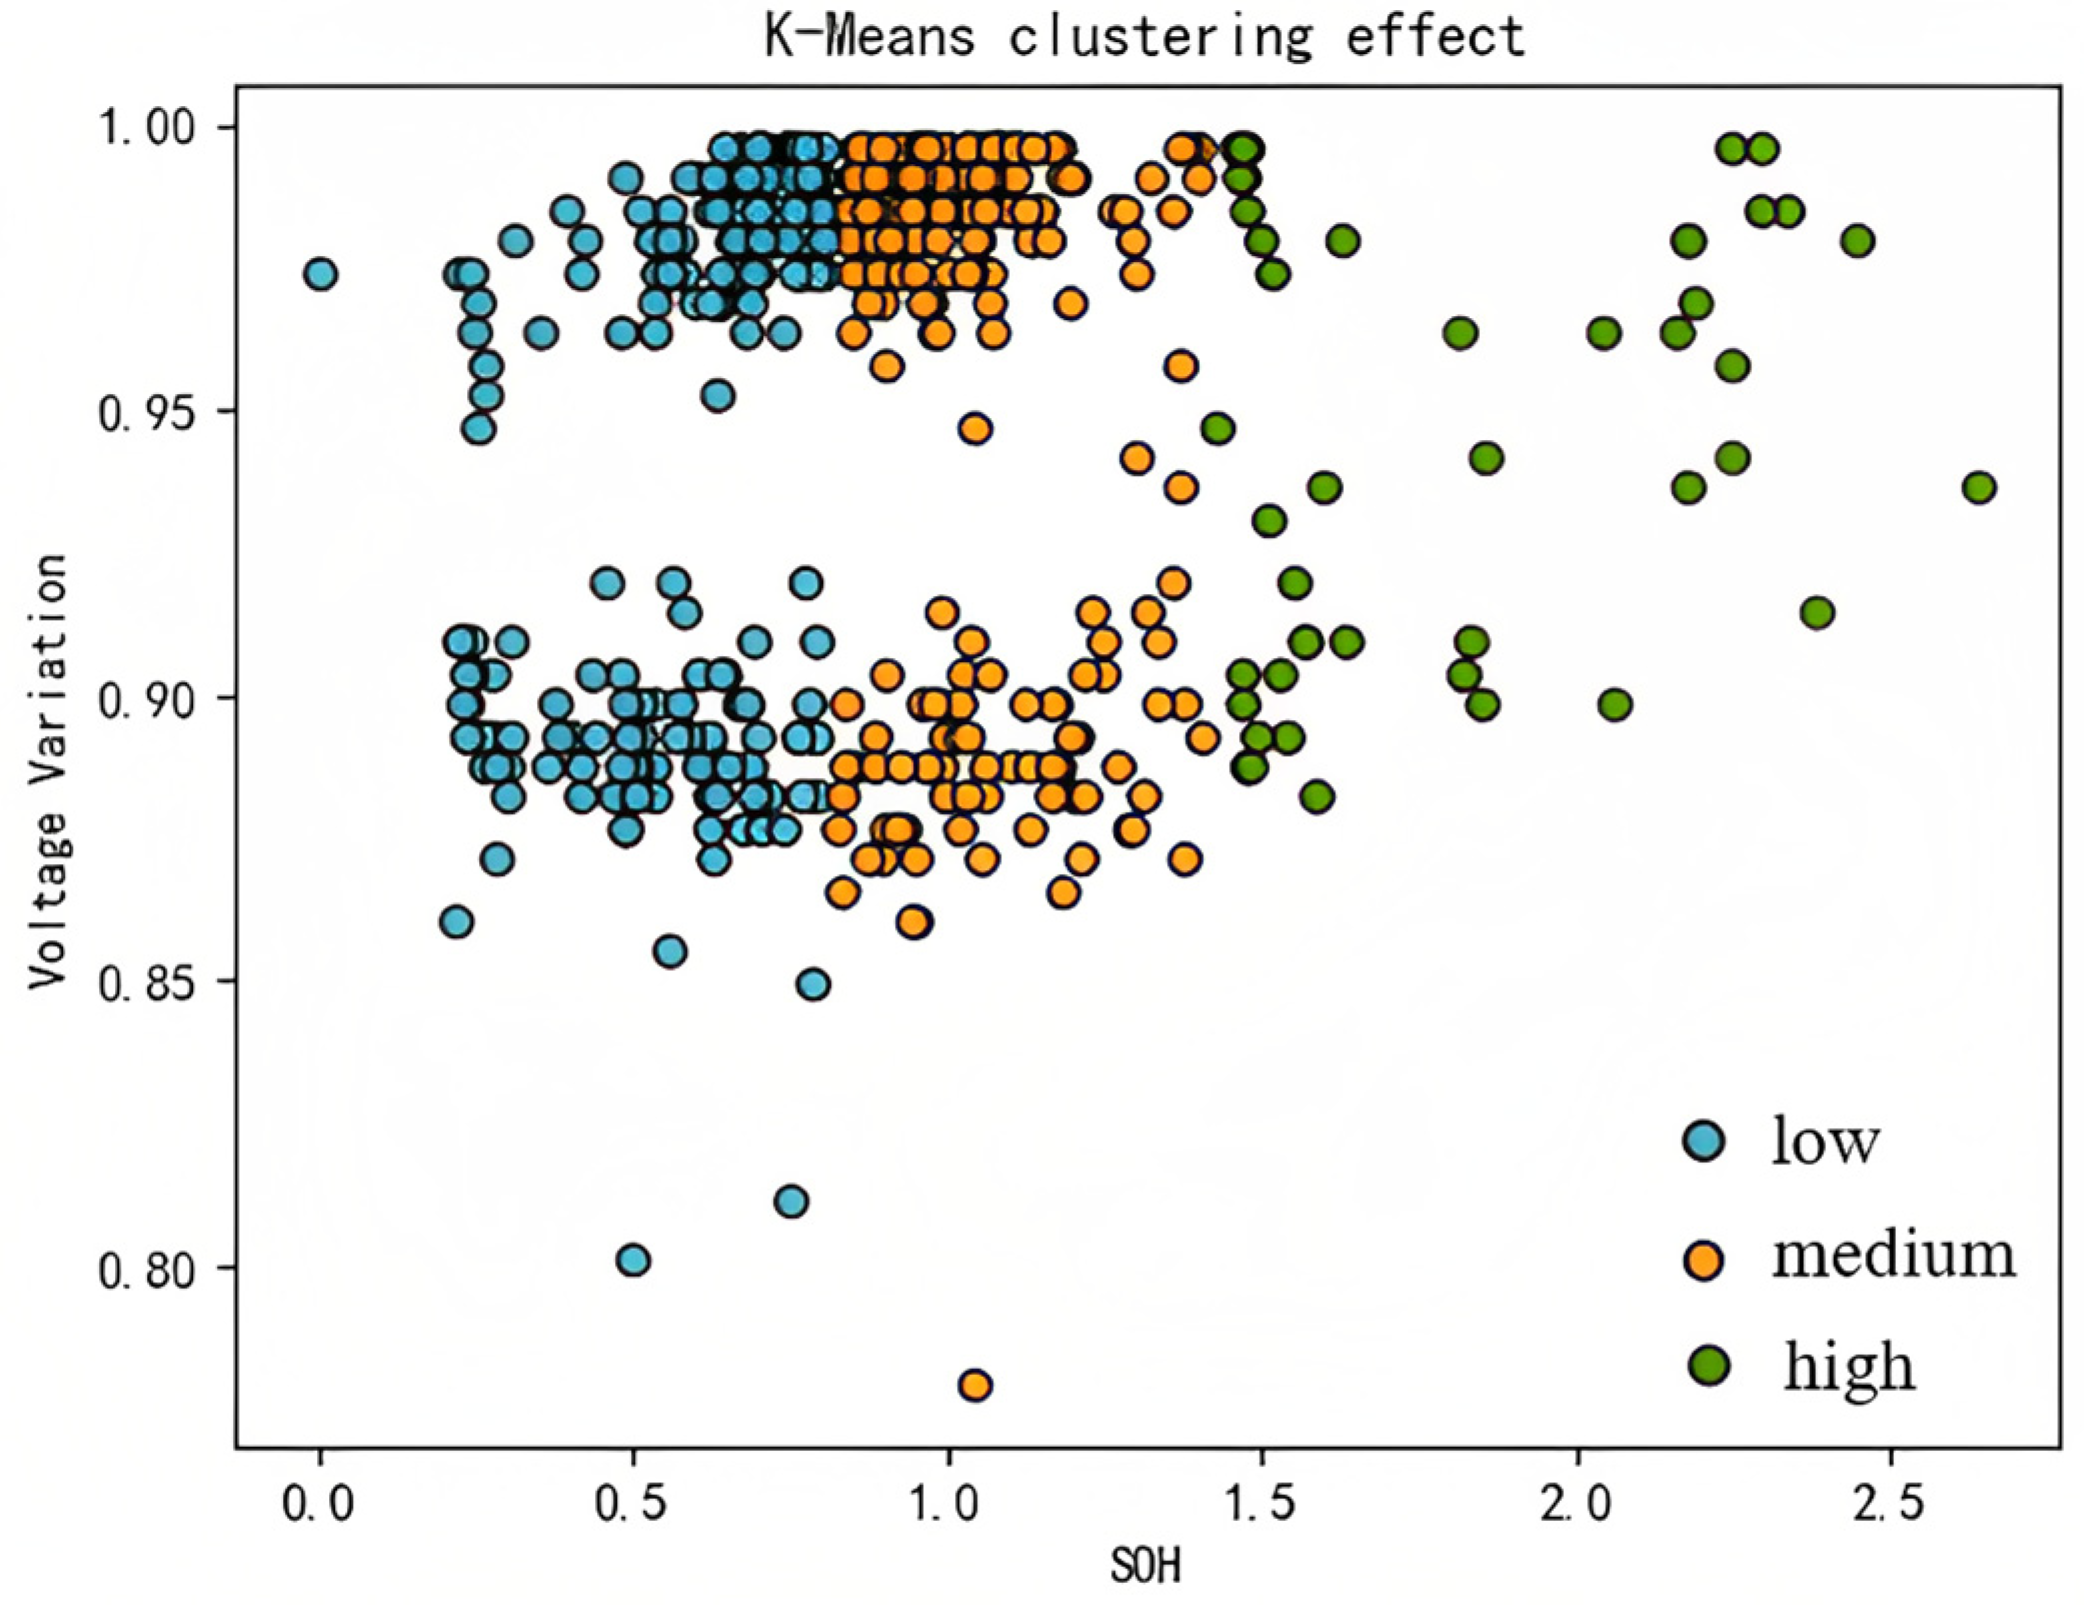
3.1.1. K-Means Algorithm

The K-Means algorithm is a widely applied clustering algorithm that minimizes the sum of the distances of all the alternatives to the clustering center. The practice of K-Means clustering is to divide n sample points into K classes according to the distance between the samples so that similar samples can be divided into the same class as far as possible. The K-Mean clustering algorithm uses the Euclidean norm to measure the similar degree between the alternatives [16] The range of features in the analysis and associated distance measures usually have an impact on the performance of the K-Means algorithm, since the distances between the data points are used to determine their similarity. The K-Means algorithm is implemented in the following specific steps:
(1)
For all n objects, randomly select k objects as the center of a class, representing the k classes to be generated;
(2)
Calculate the distance from other objects to the cluster center, and assign objects to the nearest cluster;
(3)
Calculate the average value of all objects for each class as the new central value of all objects;
(4)
Reassign data according to the principle of nearest distance;
(5)
Return to (3) until there is no change and end the clustering.

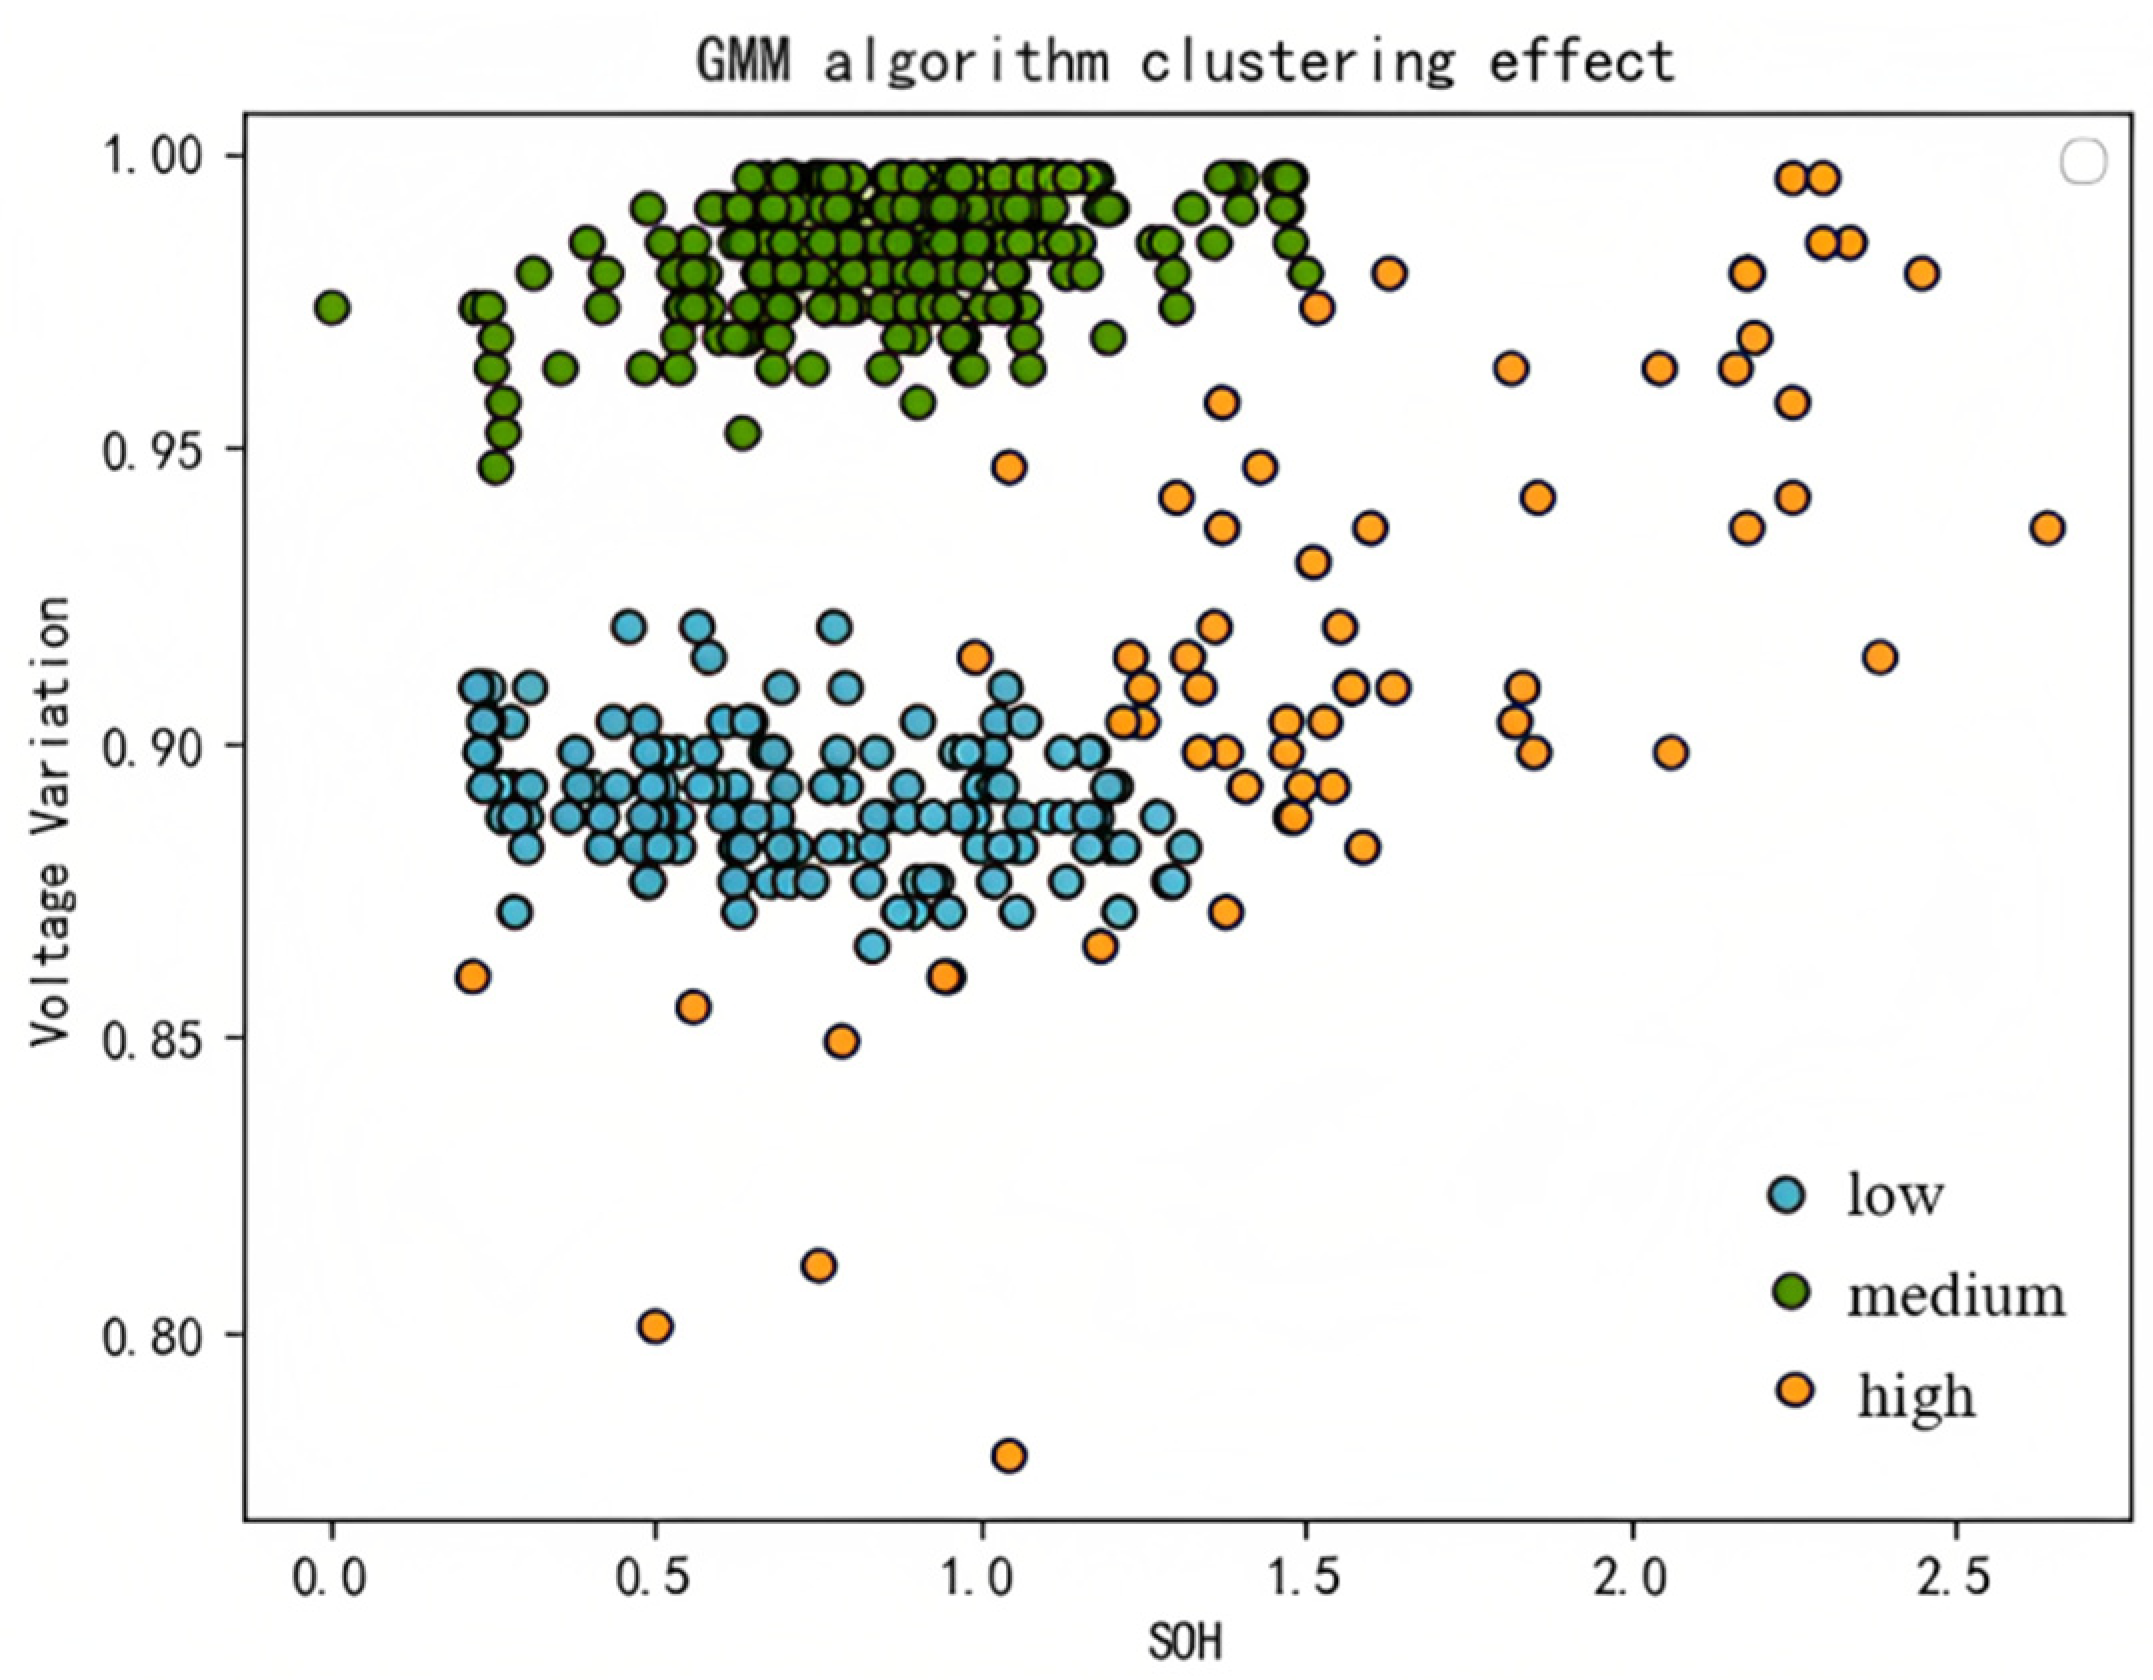
3.1.2. Gaussian Mixture Model

Because K-Means cannot cluster two classes with the same mean (the same cluster center point), the Gaussian Mixture Model (GMM) is proposed to solve this problem. The GMM completes clustering by selecting components to maximize the posterior probability. The posterior probability of each data point represents the possibility of belonging to various types, rather than a certain category, so it is called soft clustering. The Gaussian model is mainly determined by the two parameters of variance and mean. Different learning mechanisms for mean and variance will directly affect the stability, accuracy, and convergence of the model. The GMM uses the mean and standard deviation, and the cluster can show an ellipse, which is better than the circle that is produced using the K-Means method [17]. The GMM is the probability of use, so a data point can belong to multiple clusters. Therefore, it may be more suitable than K-Means clustering when there are different sizes and correlations between clusters.
The main steps to implement a Gaussian mixture model are described as follows:
(1)
Judge whether a model fits well by observing the proximity between the sampling probability value and the model probability value;
(2)
Calculate the expected value of the data through the model and update the mean and standard deviation (parameters) of the distribution, i.e., μ and σ ;
(3)
Repeat the process many times until the two probability values are very close;
(4)
Stop updating and complete model training.

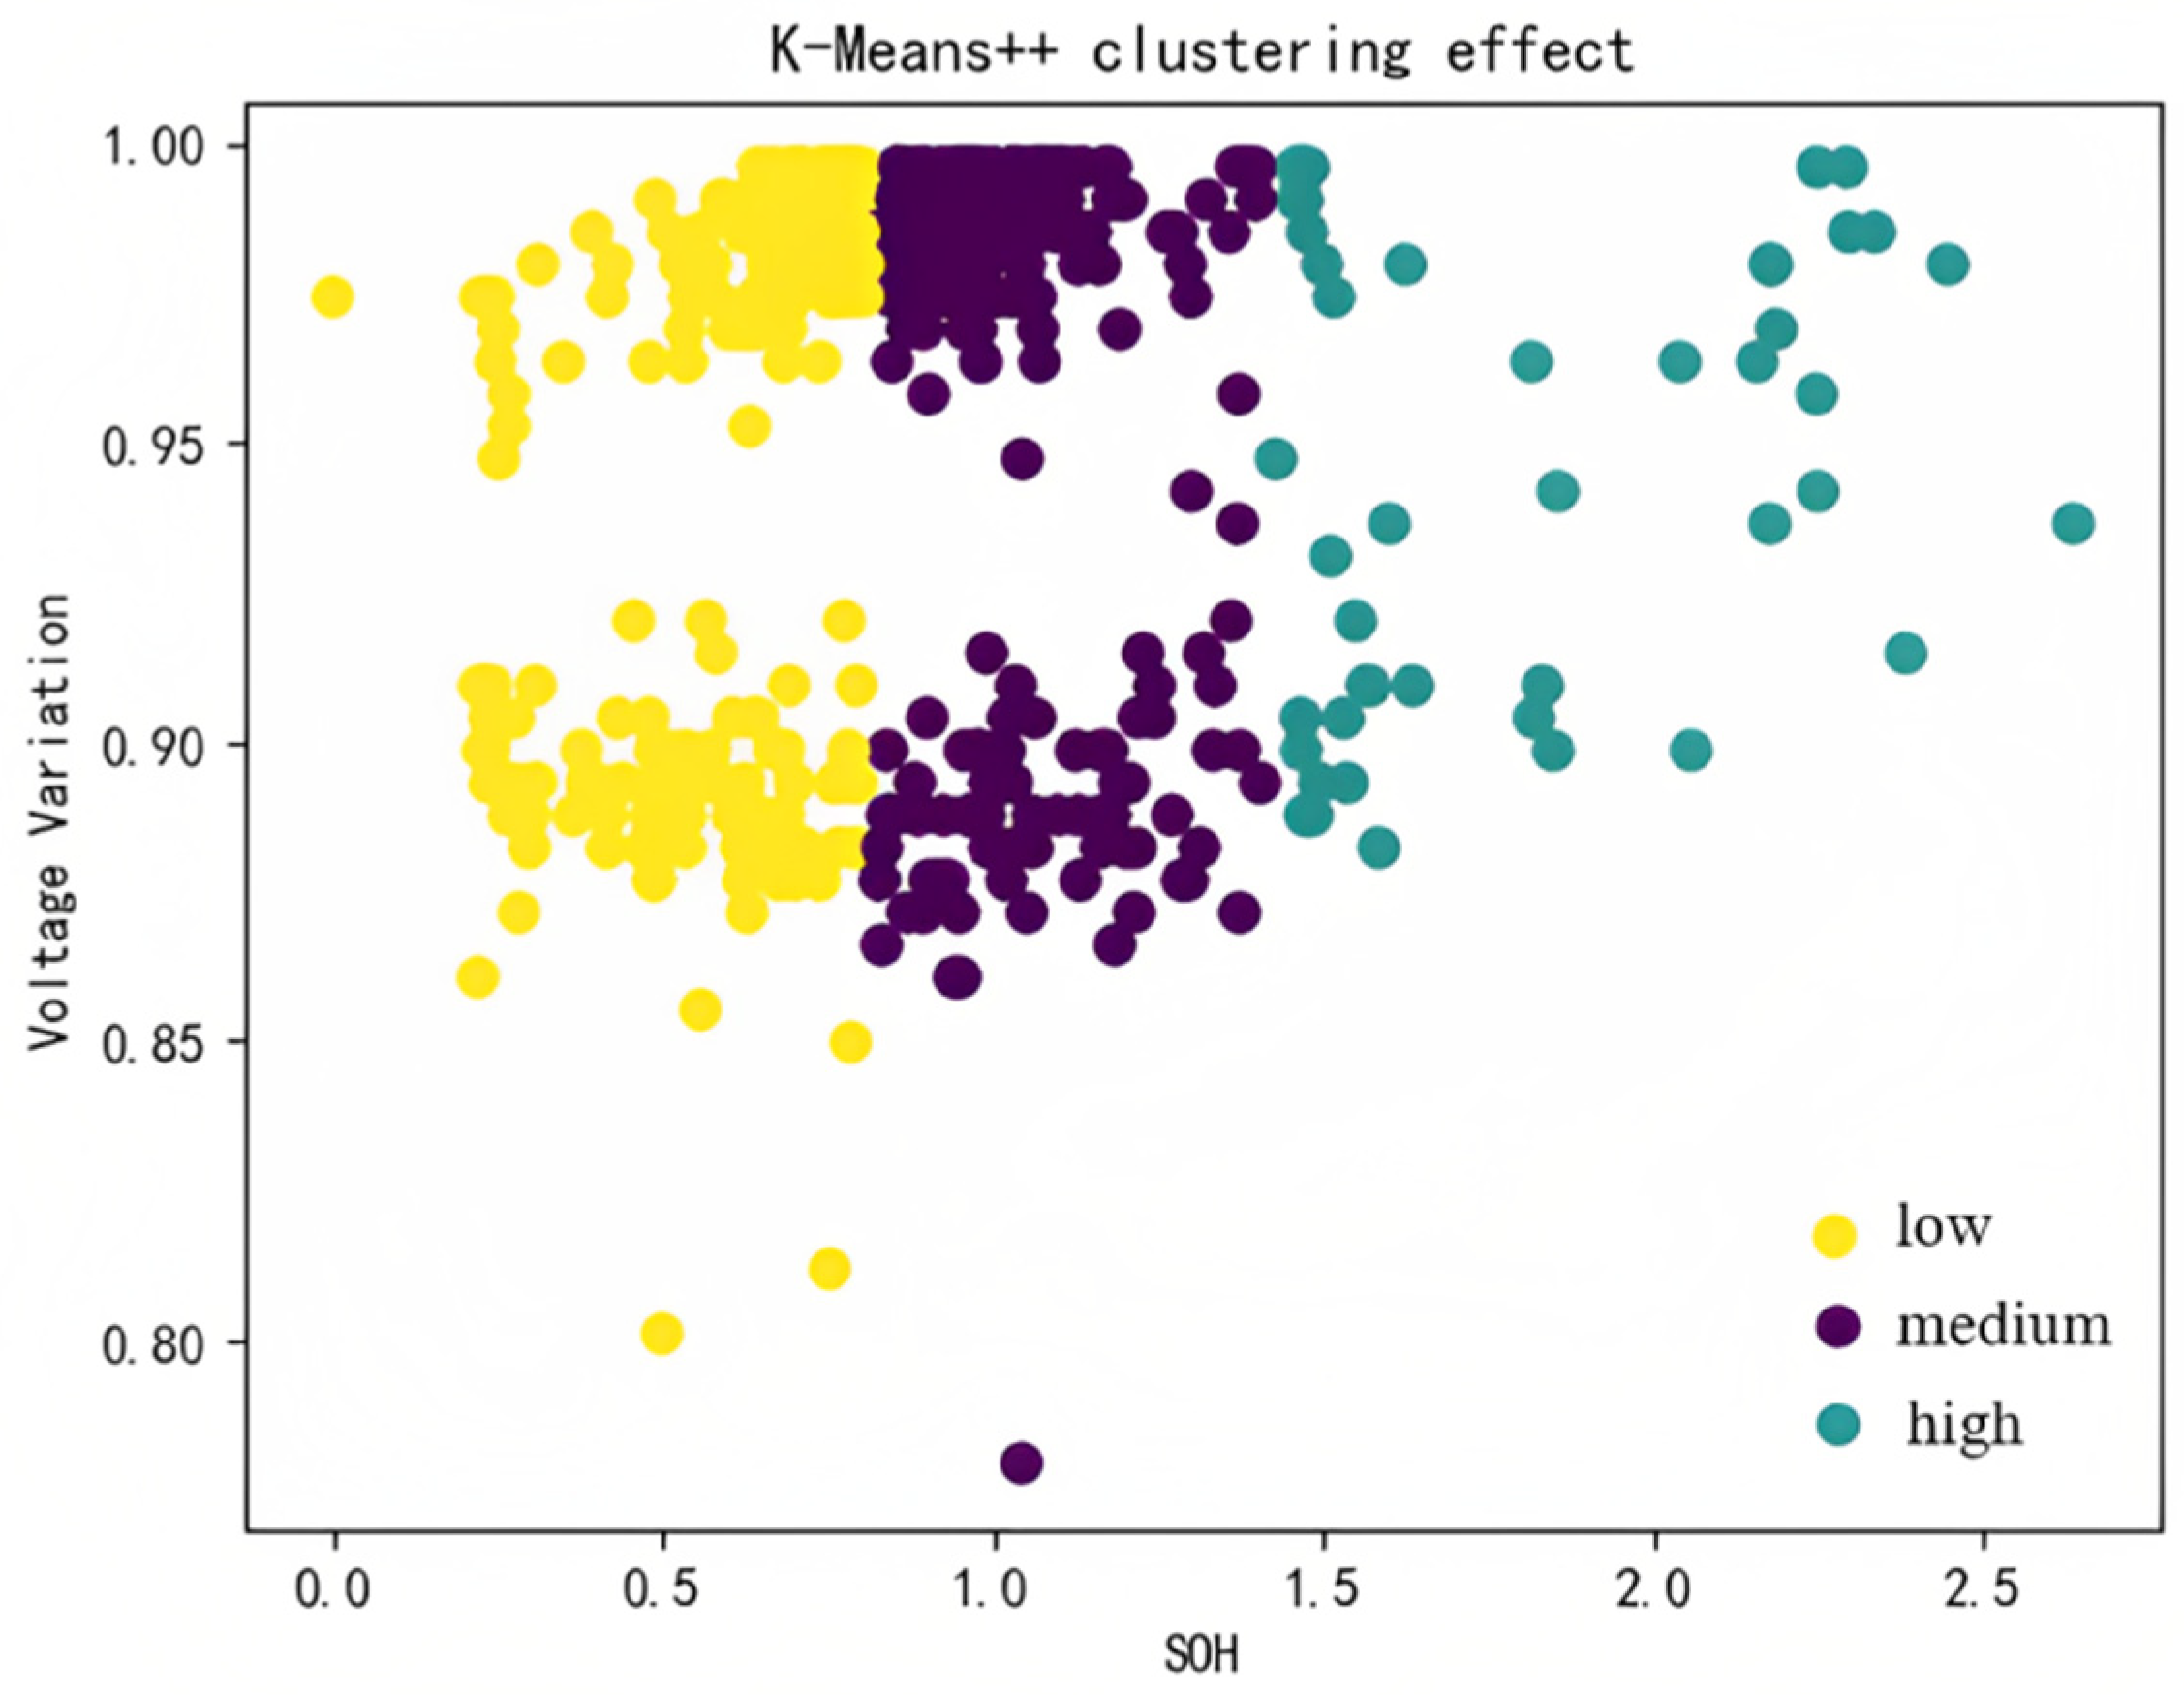
3.1.3. K-Means++ Algorithm

K-Means++ is an algorithm for selecting initial values for the K-Means clustering algorithm. The basic idea is that the initial cluster centers should be as far away from each other as possible, which can reduce the randomness of the initial cluster center selection, improve the model convergence effect and reliability [18] K-Means++ updates the clustering and centroid of the data set by iteration until the convergence condition is reached.
The main steps of K-Means++ clustering are as follows:
(1)
Select a point randomly from the set of input data points as the first cluster center;
(2)
For each point x in the data set, calculate the distance D(x) from the nearest cluster center (the selected cluster center);
(3)
Select a new data point as the new cluster center. The selection criterion is the point with larger D(x) has a higher probability of being selected as the cluster center;
(4)
Repeat steps 2 and 3 until k cluster centers are selected.

3.2. Results and Performance of the Methods

In this paper, 465 voltage differences and SOH data of charging and discharging conditions of the base station and the power station were collected (invalid data were removed) for clustering analysis. Figure 8 shows a flowchart for the overall battery health assessment of the roadside energy storage system. Health degrees are classified into three categories, i.e., high, medium, and low.
The Pearson correlation coefficient method was used to separately calculate the correlation of the four battery data points: internal resistance, rate of change of voltage, number of cycles, and discharge energy. The results of these calculations were used to set weights and compute the distances of the objects to the prototypes of the clusters during the clustering analysis.
The following Figure 9, Figure 10 and Figure 11 are the classification results obtained using the three clustering methods.
From the machine learning results, we can see that the classification results are based on the discharge capacity as the abscissa and the voltage change as the ordinate. The data are divided into three categories.
The silhouette coefficient evaluates the quality of the clustering using a measure of similarity between objects in a data set and is an evaluation of how dense and dispersed the clusters are. The contour coefficient is suitable for cases where the actual category information is unknown. It is calculated according to the following formula:
S = b a m a x ( a , b )  
In Equation (19), a is the average distance between this data frame and other data frames in the cluster and b is the average distance between this data frame and the sample in another cluster nearest to it.
The silhouette coefficient S is in the range of [−1, 1], the larger the value of S, the more reasonable the clustering results are. If the contour coefficient S = −1, the data frame should be classified into other classes; if S is close to 0, the data frame is at the intersection of two classes. Averaging the profile coefficients of all samples gives the overall profile coefficient of the clustering result:
S k = 1 n i = 1 n S i
Table 4 summarizes the advantages and disadvantages of the three methods and their values of the silhouette coefficient.
It is obvious from the classification results that all three clustering methods succeeded in classifying the battery health condition into high, medium, and low categories, but different clustering methods were used to obtain different classification results. As far as the study is concerned, the GMM clustering method is the best method for reflecting the battery charge and discharge capacity.

4. Discussion

Since the performance of a battery management system is the key to determining the function of the energy storage facility, this study collects the amount of battery voltage and current variation in the energy storage system under different operating conditions. In this paper, for the first time, the predicted SOH values are obtained by extracting the characteristic quantities affecting the battery health based on three indicators: the internal resistance, the rate of change of the voltage, and the change of temperature. Then, three unsupervised clustering methods, K-Means, the Gaussian mixture model, and K-Means++, are used to effectively classify the battery health of the roadside EES into high, medium, and low levels, which intuitively reflect the current health status of the battery. According to the conclusion, by comparing the three methods, GMM clustering seems to be the best method for reflecting the battery charging and discharging capacity, which in turn plays a positive role in the description of the battery health condition.

5. Conclusions

Roadside energy storage facilities are needed to alleviate the mileage anxiety of electric vehicle drivers. The health status of batteries plays a critical role in determining the lifespan of roadside energy storage facilities. This study focuses on estimating the State-of-Health (SOH) value by analyzing the battery charging and discharging data obtained from base stations and power stations using three indicators: the internal resistance, the rate of change in the voltage, and the change of temperature. Relevant features that may impact battery health are selected for analysis. Three clustering methods, namely K-Means, the Gaussian Mixture Model (GMM), and K-Means++, are employed to classify the battery health status. The advantages and disadvantages of these methods are thoroughly discussed and compared, aiming to identify the most suitable clustering approach. The results indicate that the GMM clustering method is more suitable for engineering battery health status classification as it provides clear and informative clustering outcomes. This case study provides a reference for battery health condition assessment in future roadside energy storage systems.

Author Contributions

Writing, K.D.; data curation, K.S., Z.D., Z.L. and L.Z.; supervision, T.X. and S.Y. All authors have read and agreed to the published version of the manuscript.

Funding

This research received no external funding.

Institutional Review Board Statement

Not applicable.

Informed Consent Statement

Not applicable.

Data Availability Statement

Detailed data will be available upon request from the authors with the permission of the respondents.

Acknowledgments

Authors are grateful to the College of Transportation Engineering, Chang’an University for their support.

Conflicts of Interest

The authors declare no conflict of interest.

References

  1. Hernandez, J.E.; Kreikebaum, F.; Divan, D. Flexible electric vehicle (EV) charging to meet renewable portfolio standard (RPS) mandates and minimize green house Gas emissions. In Proceedings of the 2010 IEEE Energy Conversion Congress and Exposition, Atlanta, GA, USA, 12–16 September 2010; pp. 4270–4277. [Google Scholar] [CrossRef]
  2. Xu, M.; Yang, H.; Wang, S. Mitigate the range anxiety: Siting battery charging stations for electric vehicle drivers. Transp. Res. Part C Emerg. Technol. 2020, 114, 164–188. [Google Scholar] [CrossRef]
  3. Bonges, H.A., III; Lusk, A.C. Addressing electric vehicle (EV) sales and range anxiety through parking layout, policy and regulation. Transp. Res. Part A Policy Pract. 2016, 83, 63–73. [Google Scholar] [CrossRef]
  4. Mohamad, F.; Teh, J.; Lai, C.-M. Optimum allocation of battery energy storage systems for power grid enhanced with solar energy. Energy 2021, 223, 120105. [Google Scholar] [CrossRef]
  5. Ordóñez, G.; Osma, G.; Vergara, P.P.; Rey, J.M. Wind and Solar Energy Potential Assessment for Development of Renewables Energies Applications in Bucaramanga, Colombia. IOP Conf. Ser. Mater. Sci. Eng. 2014, 59, 012004. [Google Scholar] [CrossRef]
  6. Manzo, M.A.; Miller, T.B.; Hoberecht, M.A.; Baumann, E.D. Energy Storage: Batteries and Fuel Cells for Exploration. In Proceedings of the 45th AIAA Aerospace Sciences Meeting and Exhibit, Reno, NV, USA, 8–11 January 2007. [Google Scholar]
  7. Xia, Z.; Li, Y.; Chen, R.; Sengupta, D.; Guo, X.; Xiong, B.; Niu, Y. Mapping the rapid development of photovoltaic power stations in northwestern China using remote sensing. Energy Rep. 2022, 8, 4117–4127. [Google Scholar] [CrossRef]
  8. Cowell, R. The role of place in energy transitions: Siting gas-fired power stations and the reproduction of high-carbon energy systems. Geoforum 2020, 112, 73–84. [Google Scholar] [CrossRef]
  9. Chen, H.; Cong, T.N.; Yang, W.; Tan, C.; Li, Y.; Ding, Y. Progress in electrical energy storage system: A critical review. Prog. Nat. Sci. Mater. Int. 2009, 19, 291–312. [Google Scholar] [CrossRef]
  10. Cacciato, M.; Nobile, G.; Scarcella, G.; Scelba, G. Real-Time Model-Based Estimation of SOC and SOH for Energy Storage Systems. IEEE Trans. Power Electron. 2017, 32, 794–803. [Google Scholar] [CrossRef]
  11. Tanujit, B.; Asokan, S. Electrochemical Impedance spectroscopy study of AgI-Ag2O-MoO3 Glasses: Understanding the Diffusion, Relaxation, Fragility and Power Law Behavior. Philos. Mag. 2019, 101, 400–419. [Google Scholar] [CrossRef]
  12. He, W.; Williard, N.; Osterman, M.; Pecht, M. Prognostics of lithium-ion batteries based on Dempster-Shafer theory and the Bayesian Monte Carlo method. J. Power Sources 2011, 196, 10314–10321. [Google Scholar] [CrossRef]
  13. Gurajala, R.; Choppala, P.B.; Meka, J.S.; Teal, P.D. Derivation of the Kalman filter in a Bayesian filtering perspective. In Proceedings of the 2021 2nd International Conference on Range Technology (ICORT), Balasore, India, 5–6 August 2021. [Google Scholar]
  14. Zhao, J.; Jia, H.; Zhan, Y.; Xiang, Z.; Zheng, S.; Bi, K. Combination of LS-SVM algorithm and JC method for fragility analysis of deep-water high piers subjected to near-field ground motions. Structures 2020, 24, 282–295. [Google Scholar] [CrossRef]
  15. Sun, H.; Sun, J.; Zhao, K.; Wang, L.; Wang, K. Data-Driven ICA-Bi-LSTM-Combined Lithium Battery SOH Estimation. Math. Probl. Eng. 2022, 2022, 9645892. [Google Scholar] [CrossRef]
  16. Ahmed, M.; Seraj, R.; Islam, S.M.S. The k-means algorithm: A comprehensive survey and performance evaluation. Electronics 2020, 9, 1295. [Google Scholar] [CrossRef]
  17. Zong, B.; Song, Q.; Min, M.R.; Cheng, W.; Lumezanu, C.; Cho, D.-K.; Chen, H. Deep Autoencoding Gaussian Mixture Model for Unsupervised Anomaly Detection. In Proceedings of the International Conference on Learning Representations, Vancouver, BC, Canada, 30 April–3 May 2018. [Google Scholar]
  18. Arthur, D.; Vassilvitskii, S. k-means++: The advantages of careful seeding. In Proceedings of the Eighteenth Annual ACM-SIAM Symposium on Discrete Algorithms, New Orleans, LA, USA, 7–9 January 2007. [Google Scholar]
Figure 1. The components of the energy storage power station.
Futuretransp 03 00072 g001
Figure 2. The change in discharge capacity and battery health status.
Futuretransp 03 00072 g002
Figure 3. The change in voltage and current over 3 days working condition.
Futuretransp 03 00072 g003
Figure 4. The voltage changes of the four batteries in series.
Futuretransp 03 00072 g004
Figure 5. LSTM structure diagram.
Futuretransp 03 00072 g005
Figure 6. LSTM network structure.
Futuretransp 03 00072 g006
Figure 7. Changes in internal resistance and battery health under cyclic life.
Futuretransp 03 00072 g007
Figure 8. Structural logical framework.
Futuretransp 03 00072 g008
Figure 9. K-Means algorithm clustering effect.
Futuretransp 03 00072 g009
Figure 10. GMM algorithm clustering effect.
Futuretransp 03 00072 g010
Figure 11. K-Means++ algorithm clustering effect.
Futuretransp 03 00072 g011
Table 1. Summary statistics of the charging data.
LabelMaximumMinimumMeanStd
Total operating voltage (V)57,268052,321.732921.62
Single cell voltage (V)15.305.21.35
Single row battery pack voltage (V)81.29025.1528.10
Total voltage (V)57,653032,486.9825,496.05
Mainboard temperature (°C)65043.255.92
Environment temperature (°C)41031.704.63
Main battery electricity (mA)316090.4489.73
Table 2. Selected features for battery health evaluation.
LegendParameterInterpretation
TemperatureMax TEncThe maximum of temperature entropy in the Cth iteration
Avg TEncThe average value of temperature entropy
Var TEncThe variance of temperature entropy
Avg  T c The average value of the Cth iteration
Avg  T c m a x The minimum temperature at Cth iteration
VoltageMax VEnc1The maximum value of the voltage entropy
Avg VEnc1The average value of the voltage entropy
Var VEnc1The variance of the voltage entropy
Max    V c 1 d i f f The maximum value of the voltage difference of the four cells
Avg  V c 1 d i f f The average value of the voltage difference of the four cells
Avg  V c 1 m a x The maximum value of the voltage of the four cells
CapacityVarc1,c2Variance: Varc1,c2 = Min(Qc2Qc1)
Resistance R i n t e r n a l The value of internal resistance
Table 3. Partial input and output data for prediction of SOH.
Input ParametersOutput Parameter
IndexVoltage (V)Resistance (Ω)Temperature (°C)State of Health
110.4970.09430.995.1
210.4970.09231.395.2
310.4970.09531.395.1
410.4970.09131.095.0
510.4970.09131.194.8
610.4970.08831.094.5
710.4970.09231.294.1
810.4970.09331.593.9
910.4980.09130.893.0
Table 4. Classification and characteristics of clustering algorithms.
Clustering AlgorithmsAdvantagesDisadvantagesSilhouette Coefficient
K-MeansLow time complexity; high computing efficiencyNumber of clusters needed to be preset; not suitable for nonconvex data0.63
Gaussian Mixture Modeleach class probability; high computing speedInflexible shape; limited accuracy; lack of robustness0.80
K-Means++Improved K-Means algorithm; improve the final error; reduce the calculation timeInternal orderliness; low scalability; high time complexity0.75
Disclaimer/Publisher’s Note: The statements, opinions and data contained in all publications are solely those of the individual author(s) and contributor(s) and not of MDPI and/or the editor(s). MDPI and/or the editor(s) disclaim responsibility for any injury to people or property resulting from any ideas, methods, instructions or products referred to in the content.

