Article

Analysis of Connected Vehicle Data to Quantify National Mobility Impacts of Winter Storms for Decision Makers and Media Reports

Joint Transportation Research Program, Lyles School of Civil Engineering, Purdue University, West Lafayette, IN 47907, USA
*
Author to whom correspondence should be addressed.
Future Transp. 2023, 3(4), 1292-1309; https://doi.org/10.3390/futuretransp3040071
Submission received: 12 August 2023 / Revised: 30 October 2023 / Accepted: 3 November 2023 / Published: 9 November 2023

Abstract

:
Traditional techniques of monitoring roadway mobility during winter weather have relied on embedded road sensors, roadside cameras, radio reports from public safety staff, or public incident reports. However, widely available connected vehicle (CV) data provides government agencies and media with a unique opportunity to monitor the mobility impact of inclement weather events in near real-time. This study presents such a use case that analyzed over 500 billion CV records characterizing the spatial and temporal impact of a winter storm that moved across the country from 21 to 26 December 2022. The analysis covered 97,000 directional miles of interstate roadway and processed over 503 billion CV records. At the storm’s peak on 22 December at 5:26 PM Eastern Time, nearly 4800 directional miles of interstate roadway were operating under 45 mph, a widely accepted indicator of degraded interstate conditions. The study presents a methodological approach to systematically assess the mobility impact of this winter event on interstate roadways at a national and regional level. The paper then looks at a case study on Interstate 70, a 4350 directional mile route passing through ten states. Statewide comparison showed Ohio was most impacted, with 9% of mile-hours operating below 45 mph on 23 December. High-Resolution Rapid Refresh weather data provided by the National Oceanic and Atmospheric Administration was integrated into the analysis to provide a visualization of the storm’s temporal path and severity. We believe the proposed metrics and visualizations are effective tools for communicating the severity and geographic impact of extreme weather events to broad non-technical audiences.

1. Introduction

Winter weather annually accounts for about 23% of non-recurrent travel delays on highways, and results in an estimated 544 million vehicle-hours of delay [1]. The Federal Highway Administration (FHWA) reports that, on average, freeway speed reductions may range from 3 to 40 percent for varying snow intensities, and carry associated capacity reductions ranging from 4 to 27 percent [1]. Historically, evaluations of the impact of winter storms on roadway mobility by state or local departments of transportation (DOT) have relied on embedded road sensors, roadside cameras, motorist reports or maintenance personnel reports. However, at the state or national level with nearly 100,000 directional miles of interstate roadway to be managed and maintained, these reporting procedures do not easily scale. On the other hand, media reports have traditionally leveraged fixed roadside cameras, mobile vans or weather station data to report on prevailing weather and roadway conditions and warn the motoring public of unsafe driving conditions. These reports often only present an instantaneous spatial and temporal snapshot of conditions which may not reflect the actual conditions outside of these reporting locations due to the ever-changing nature and unpredictability of weather fronts. Neither agencies or media routinely provide well-defined quantitative data on the severity, duration and geographic impact of extreme weather events.
Access to emerging sources of connected vehicle (CV) data from vehicles actually traversing the roads during such weather events presents potential opportunities for continuous real-time tracking of roadway mobility. This paper proposes a series of metrics based upon CV data that we believe are useful for both agencies and media to use. We illustrate their utility using a case study based upon a winter weather event associated with an intense arctic cold front for 21–26 December 2022 that impacted a large swath of the United States, placing more than 200 million people under some form of winter weather advisory or warning [2,3]. Significant temperature drops, lake-effect snowfall and blizzards, along with winds gusting to 72 mph, caused transportation delays across the nation, leading to flight cancellations, power outages, stranded motorists and dangerous driving conditions [3]. Multiple sections of interstates reported closures during the period of this winter storm, including I-70 in Colorado [4], the Ohio turnpike [5], I-90 in Washington State [6], I-90 in New York State [7] among others. Freezing temperatures were observed as far south as Texas and Florida, and multiple states sent out road condition warnings and alerts to their residents. Owing to the associated nationally widespread weather and travel impacts, the analysis presented in the sections that follow focuses on this particular winter storm.

2. Historical Winter Weather Mobility Data

A broad spectrum of data collection and analysis techniques have been utilized by researchers and agencies in the past to monitor the impacts of winter weather events on freeway mobility. A comprehensive study of 64 winter storm events leveraging Road Weather Information System (RWIS) stations and automatic traffic recorders (ATR), collected hourly traffic volumes over three winter seasons from 1995 to 1998, and seven selected interstate data collection locations in Iowa showed that vehicle volumes were significantly reduced during winter storm events, with volume reductions ranging from about 16 to 47 percent [8]. Mobile video collection trailers were utilized shortly after during the 1998–1999 winter season in Iowa to record traffic flow characteristics from a fixed site location selected on I-35 [9]. Crowdsourced travel time data based on motorist call-ins, loop detectors and incident reports, archived for road segments in the Washington, D.C. region from December 1999 to May 2001, were utilized to evaluate the impacts to traffic flow caused by weather events [10]. As recently as 2012, permanent count station data coupled with RWIS station’s data were utilized to quantify and model mobility impacts of winter weather on a selection of 21 maintenance routes in Ontario, Canada over a three-year period [11]. Similarly, loop detector data available at selected road sections have been leveraged by researchers in the past to calibrate microscopic simulation models aimed at modeling the travel time impacts of winter weather [12,13].
The above datasets, while effective in evaluating traffic flow characteristics at selected locations, do not provide quick and easy to understand system level performance measures at scalable costs that are useful for agency decision makers in communicating the severity, duration, and geographic impact of a storm in a systematic manner. A recent review study, looking at intelligent transportation systems and their benefit to reducing roadway mobility impacts due to adverse weather, observed that spatially constrained or location-specific fixed infrastructure monitoring solutions, such as RWIS, are cost-prohibitive for accomplishing system-level monitoring goals [14]. A 2019 study that surveyed 31 state departments of transportation (DOT) observed that reports by maintenance personnel, traffic cameras and accounting records were among the most common methods used by them to measure winter maintenance performance, and that a majority (68%) of state DOTs that responded indicated that their road condition reports were meant only for internal use [15].

3. Emerging Connected Vehicle Data Opportunities

A 2015 study of Indiana Interstates introduced the ‘Congestion Ticker’ as a real-time segment-based probe data dashboard to track interstate mobility during summer construction, as well as inclement winter weather [16]. Since then, real-time segment-based probe data have been leveraged extensively in multiple states, including Indiana, Iowa, New Jersey, Wyoming and in the Pacific Northwest, among others, to monitor the impact of winter storms on road travel, conduct after-action reviews on the effectiveness, and planning resource allocation strategies for winter maintenance operations, as well as improving traveler information [17,18,19,20,21,22]. Segment-based datasets such as the National Performance Management Research Data Set (NPMRDS) have been utilized recently by state and local agencies and practitioners to generate multi-state mobility performance measures to monitor passenger and freight travel [23,24]. While such datasets offer much broader coverage than traditional equipment intensive data collection techniques, they may yet suffer from over or under representativeness issues stemming from coarse segment lengths, which tend to wash out localized traffic flow characteristics. Secondly, such data often suffers from inherent latency involved in the pre-processing of segment level aggregated speeds is well documented by the existing literature [25,26,27,28], and thus may face potential issues for use in real-time operational decision making.
Emerging near real-time CV trajectory-level data provides far greater detail on individual passenger vehicle journey waypoints, and thus alleviates any over or underrepresentation concerns. Researchers have already demonstrated local or state-level examples of the versatility and sufficient representativeness of this CV trajectory data for use in assessing data coverage and filling gaps in traffic counts [29,30,31,32], monitoring mobility and safety through construction work zones [33,34,35,36,37], movement-level detection and performance monitoring at signalized intersections [38,39,40,41], and observing human mobility dynamics [42,43,44]. A pair of recent reports have built upon these methodologies and evaluated the usability of nationally available CV data sets at representative penetration rates towards analyzing the safety and mobility impacts of summer work zone construction as well as winter storm events on interstate travel in the United States [45].
CV data has the potential to provide a ubiquitous solution for stakeholders looking to monitor interstate mobility in near real-time while minimizing reliance on traditional sensor-based infrastructure. While many studies have analyzed interstate mobility impacts due to inclement winter weather at the state or local level, there is significantly limited research at evaluating and quantifying the mobility impacts of winter weather at a national or even a multi-state scale. This study aims to address this research gap by providing a first of its kind national evaluation of a major winter storm event from December 2022, and its impact on interstate mobility that may serve as a framework for such future evaluations and add to the state of the practice. Winter storms with a widespread spatial and temporal footprint often require coordinated efforts at the federal level and among neighboring state agencies to ensure an effective response to maintain an acceptable freeway mobility level of service, and a consistent and representative data source to monitor freeway mobility is an essential requirement for such situations.

4. Objectives and Scope

The scope of this study is to develop and present methodologies, visualizations and performance measures using CV data to scalably quantify the impact of winter storms on interstate mobility. The two main objectives of this study are described as follows:
  • To propose metrics that define the severity, duration and geographic impact of winter weather on interstate mobility using CV data that can be used by decision makers and media to monitor national, state and route level mobility.
  • To propose integrated visualizations of CV speeds and weather data to communicate these metrics to decision makers and the general public.
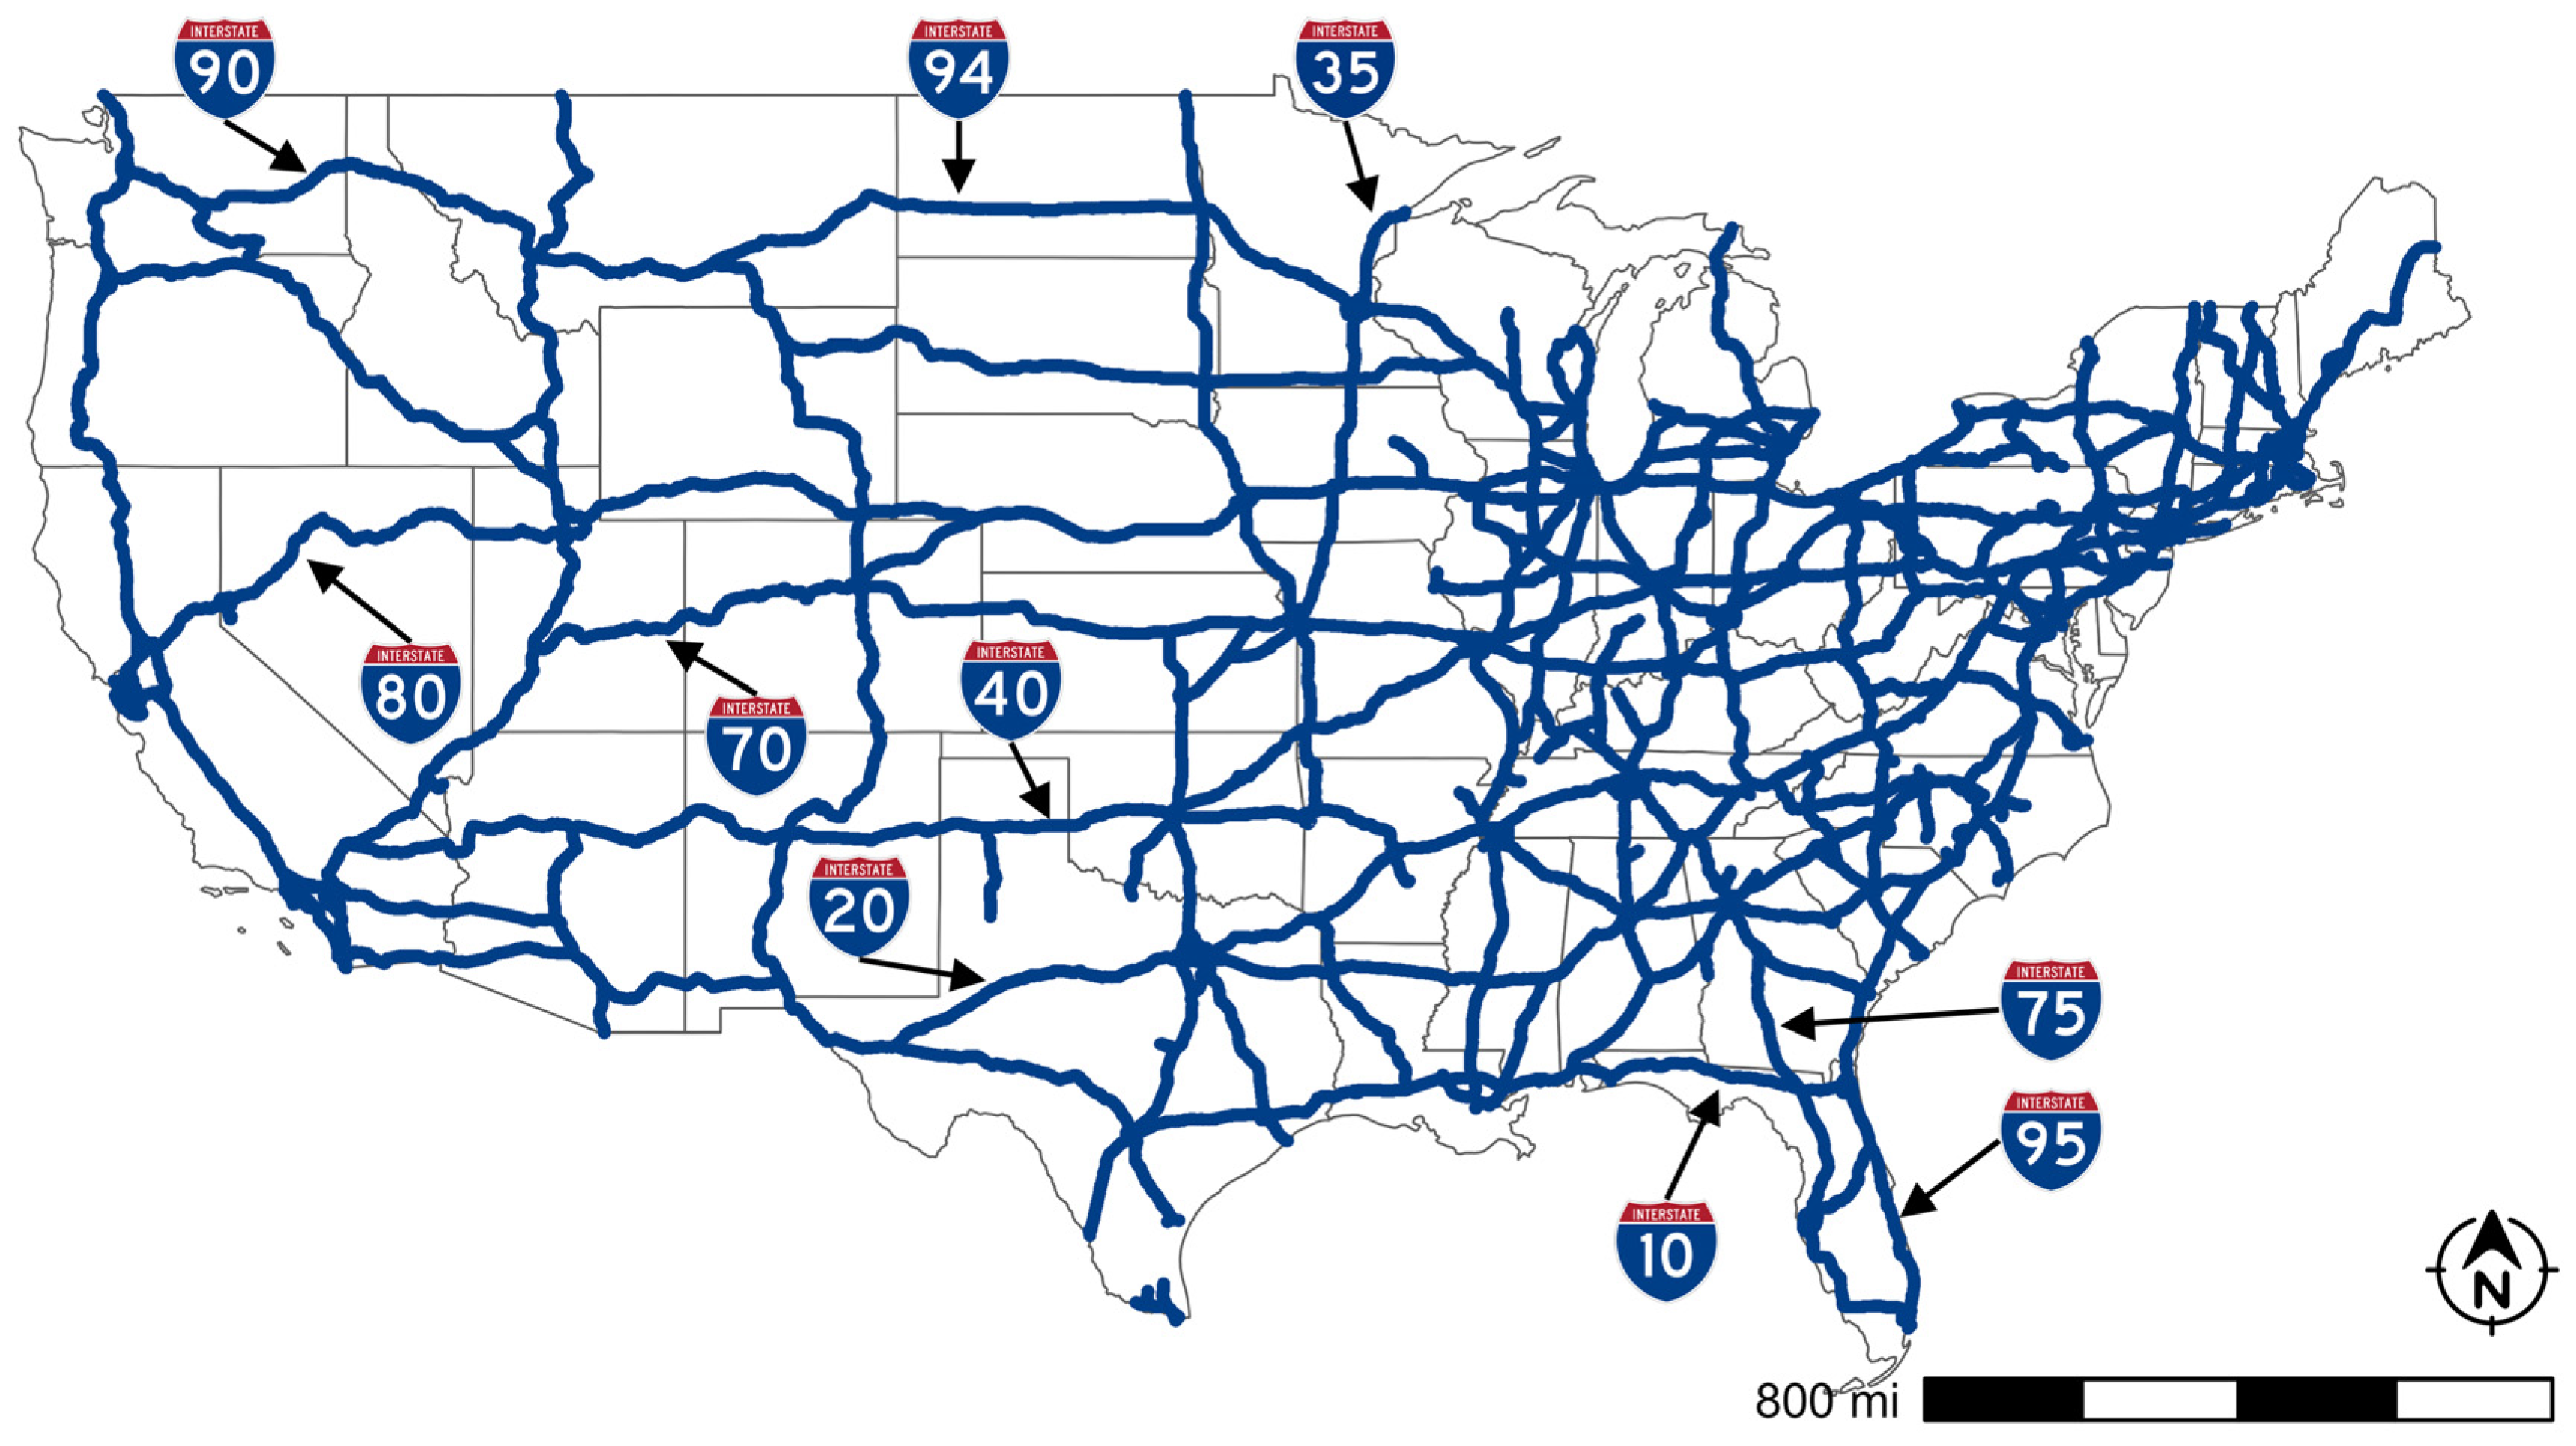
The sections that follow describe the study location and the CV data used for the analysis in detail, followed by a summary of the national-, state- and route-level visualizations developed to assess interstate mobility, concluding with a case study of I-70, one of the more significantly impacted interstate corridors by the winter storm from 21 to 26 December 2022.

5. Study Location

The US Interstate Highway System across the 48 contiguous states and the District of Columbia, more than 97,000 directional miles long, was chosen as the study location for this paper. Figure 1 shows an overview of this system with 1036 unique pairs of states and interstate routes (Indiana I-65 for example). This represents more than 500 unique interstate routes (I-65 for example), with 202 routes spanning multiple states and 326 routes spanning a single state. I-90 is the longest cross-country route at 6174.4 directional miles, while I-95 passes through the highest number of states at 16 stretching from Maine at its northern end to Florida at its southern end. Interstate routes in the state of Hawaii (namely H-1, H-2, H-3 and H-201) were excluded, as the winter storm under analysis did not appear to impact travel in the region. The state of Alaska does not host any interstate routes and was hence excluded from the analysis. The entire study location was segmented into 0.1-mile sections to allow for aggregate analysis at any desired geographic level ranging from local to national. The ten longest interstates in the country have been specifically called out in Figure 1 for geographical context.

6. Connected Vehicle Data

CV data obtained from a third-party commercial data provider, available at 1–3 s frequency, and approximately 3 m geolocation accuracy, were utilized for this study. Previous studies have shown this dataset represents a typical penetration rate of 4–5% [46,47,48]. The national CV dataset consisted of approximately 503 billion records. Each CV trajectory waypoint has an associated anonymized trajectory identifier, timestamp, geolocation, speed and heading, which enabled assignment and spatial referencing to a particular direction of travel.

7. Connected Vehicle Data Curation—Segment Speed and Counts

Previous studies have established and described in detail systematic techniques to spatially reference CV trajectory waypoint data to roadway mile markers. These techniques were built upon and extended to a national scale for the US Interstate Highway system to arrive at a linearly referenced CV waypoint dataset, with each pertinent waypoint having an associated state, interstate route and mile marker assignment. Following this geospatial joining process, an aggregated dataset of interstate mile markers and median speeds for each 1 min period for the month of December 2022 was prepared for the entire study location. This processing reduced the 503 billion records covering all roads in the US over 31 days to 59 billion GPS position records covering 97,000 directional miles of interstates. These data were then aggregated with a 0.1 mile resolution at 1 min intervals. In total, approximately 16 billion records covering the 0.1 mile segments over 31 days in December were generated. The 0.1 mile segments were used to aggregate counts of vehicles in those segments on a minute-by-minute basis, as well as computing the median speed.

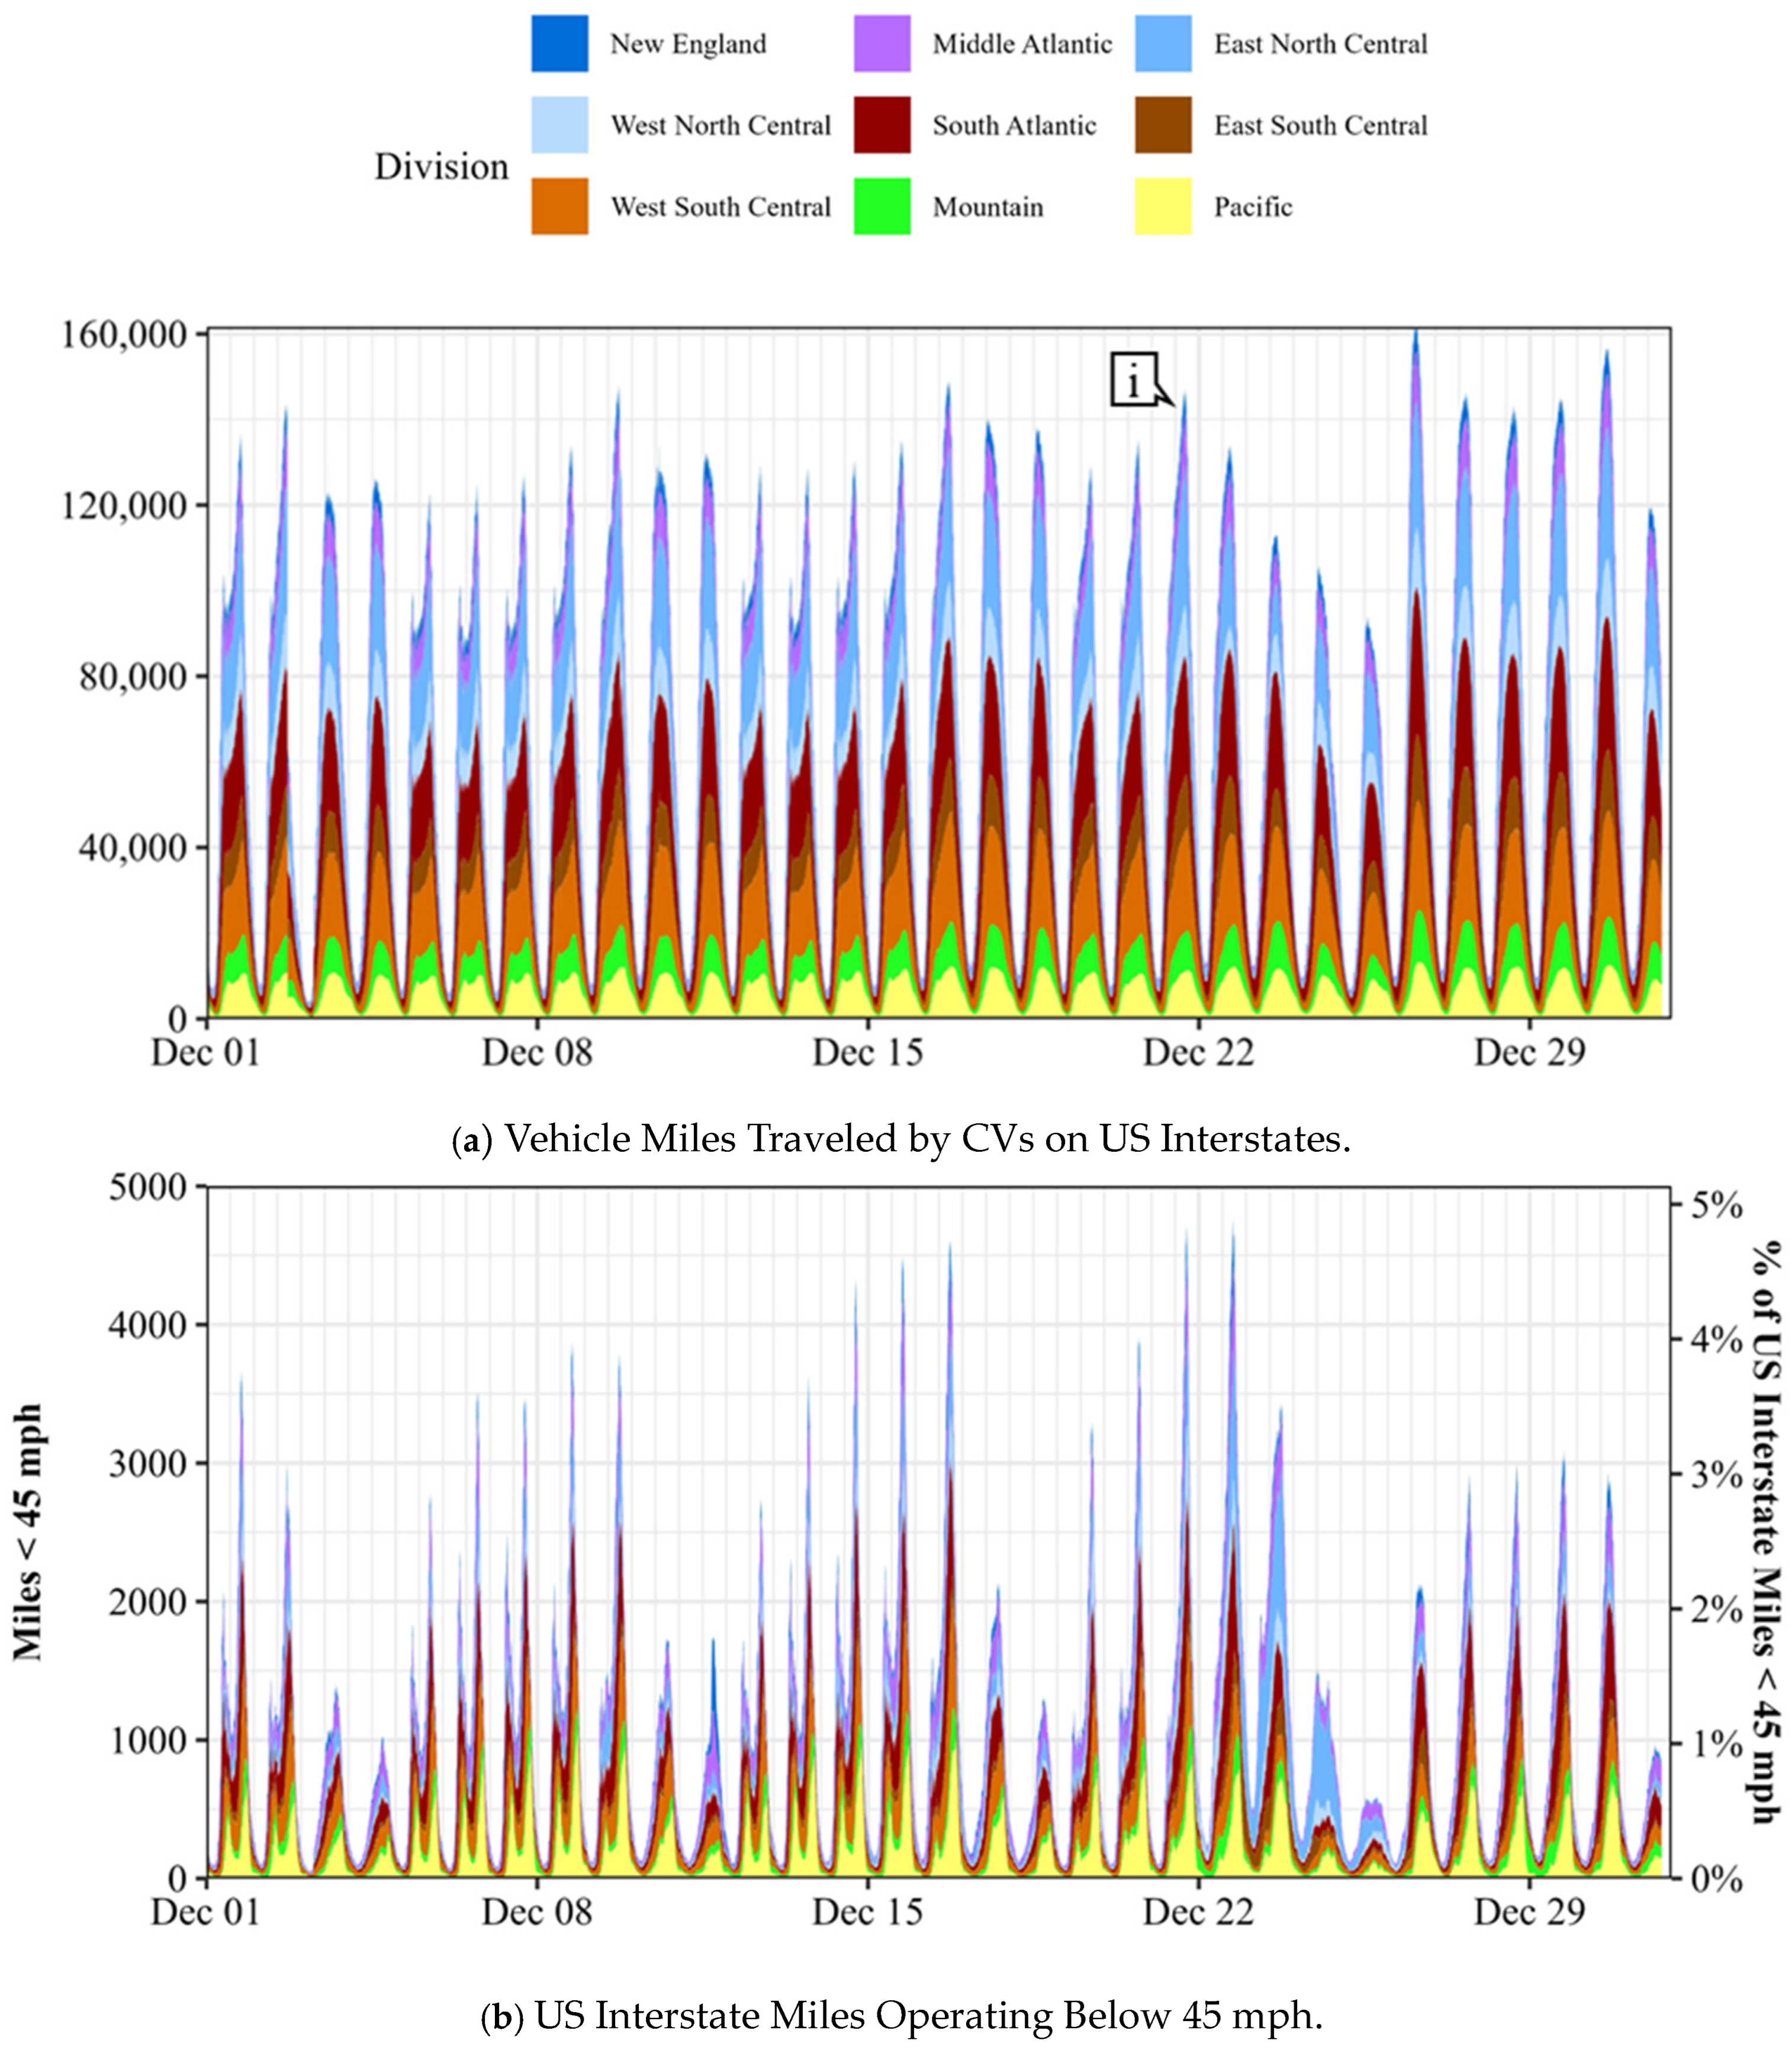
8. Connected Vehicle Data Curation—Vehicle Miles Travelled

Vehicle miles traveled (VMT) is a commonly used and well recognized measure for monitoring interstate travel trends. While VMT was traditionally documented by fixed traffic counters or recorders on major roadways, leaving room for potential underrepresentation of local traffic, ubiquitously available CV data allows for a more accurate estimation of VMT through continuous monitoring along an entire route as opposed to values recorded only at selected locations with detection equipment. Figure 2a shows a minute-by-minute visualization of VMT on the US Interstate System for the month of December 2022, colorized by nine geographic divisions made up of 48 US States and the District of Columbia. The U.S. Census Bureau [49] has defined these divisions and the corresponding component states as follows: New England (CT, ME, MA, NH, RI, VT), Middle Atlantic (NJ, NY, PA), East North Central (IN, IL, MI, OH, WI), West North Central (IA, KS, MN, MO, NE, ND, SD), South Atlantic (DE, DC, FL, GA, MD, NC, SC, VA, WV), East South Central (AL, KY, MS, TN), West South Central (AR, LA, OK, TX), Mountain (AZ, CO, ID, NM, MT, UT, NV, WY) and Pacific (AK, CA, HI, OR, WA). The states of Hawaii and Alaska were excluded from the Pacific division, as explained in the preceding text. Interstates in the state of Texas (West South Central) show the highest daily VMT. Notably, the substantial decline in VMT, beginning nominally around 21 December 2022 (callout i), aligned with the start of the major winter storm event.
A widely accepted indicator of degraded interstate conditions is median speeds dropping below 45 mph [50]. Figure 2b shows a corresponding visualization of the miles of interstate operating below median speeds of 45 mph every minute. Clear patterns of recurring weekday and weekend traffic are visible for the first three weeks of the month. Beginning on 22 December, a non-recurring pattern is observed with periods of sustained interstate miles operating below 45 mph due to the impact of the winter storm. The East North Central and East South Central divisions, home to a number of states in the Midwest and South, show significantly sustained periods of interstate miles operating below 45 mph, as shown by Figure 2b, thus pointing to the winter storm’s impact on interstate mobility. The underlying data on interstate VMT and miles operating below 45 mph by minute for December 2022, categorized by the nine geographic divisions for the contiguous US, have been made available via a public repository [51].

9. State Level Interstate Mobility

For a performance measure that can effectively represent interstate mobility for a US state, observed mobility conditions across all interstate routes present in the state need to be meaningfully aggregated. This section of the study excluded three-digit interstate routes representing beltways around major cities or supplemental radial and spur routes (I-465 around the city of Indianapolis, Indiana, for example), so we could focus on national mobility trends that would not skew weighting toward large urban areas. This reduced the number of directional interstate miles from approximately 97,000 to 86,000. However, these techniques could easily include all 97,000 miles of interstate routes.
Median CV speeds at 1 min frequency and 0.1 mile fidelity along 86,000 miles of major interstate routes (one or two digit) were tabulated. When these median speed records for all miles of major interstate routes in a state are combined for the week into a distance weighted measure with units of mile-hours [50], a representative value can be generated for the percent of major interstate route mile-hours in a state that operated below 45 mph for a chosen time period. Figure 3a,b show these percentage values for the 48 US States and DC for the weeks of 12–18 December 2022 (week before) and 19–25 December 2022 (week of winter storm), respectively. Figure 3 clearly depicts a number of states in the northern half of the country experiencing much higher percentages of major interstate route mile-hours, operating below 45 mph in the week of the winter storm compared to the week prior. The five states that showed the highest percentage increase in major interstate route mile-hours, operating below 45 mph in the week of the storm compared to the week prior, were Ohio (+1.87%), Kentucky (+1.31%), Delaware (+1.15%), Michigan (+1.10%) and Minnesota (+0.93%). States in the northeast appear to show similar percentages of mile-hours, operating below 45 mph in both weeks as they experienced a significant winter storm event in the week prior (on 17 December), in addition to the 21–26 December winter storm event chosen for this analysis. While only 19 states showed greater than 1% of mile-hours operating below 45 mph in the week prior to the storm, that number had increased to 23 during the week of the winter storm.

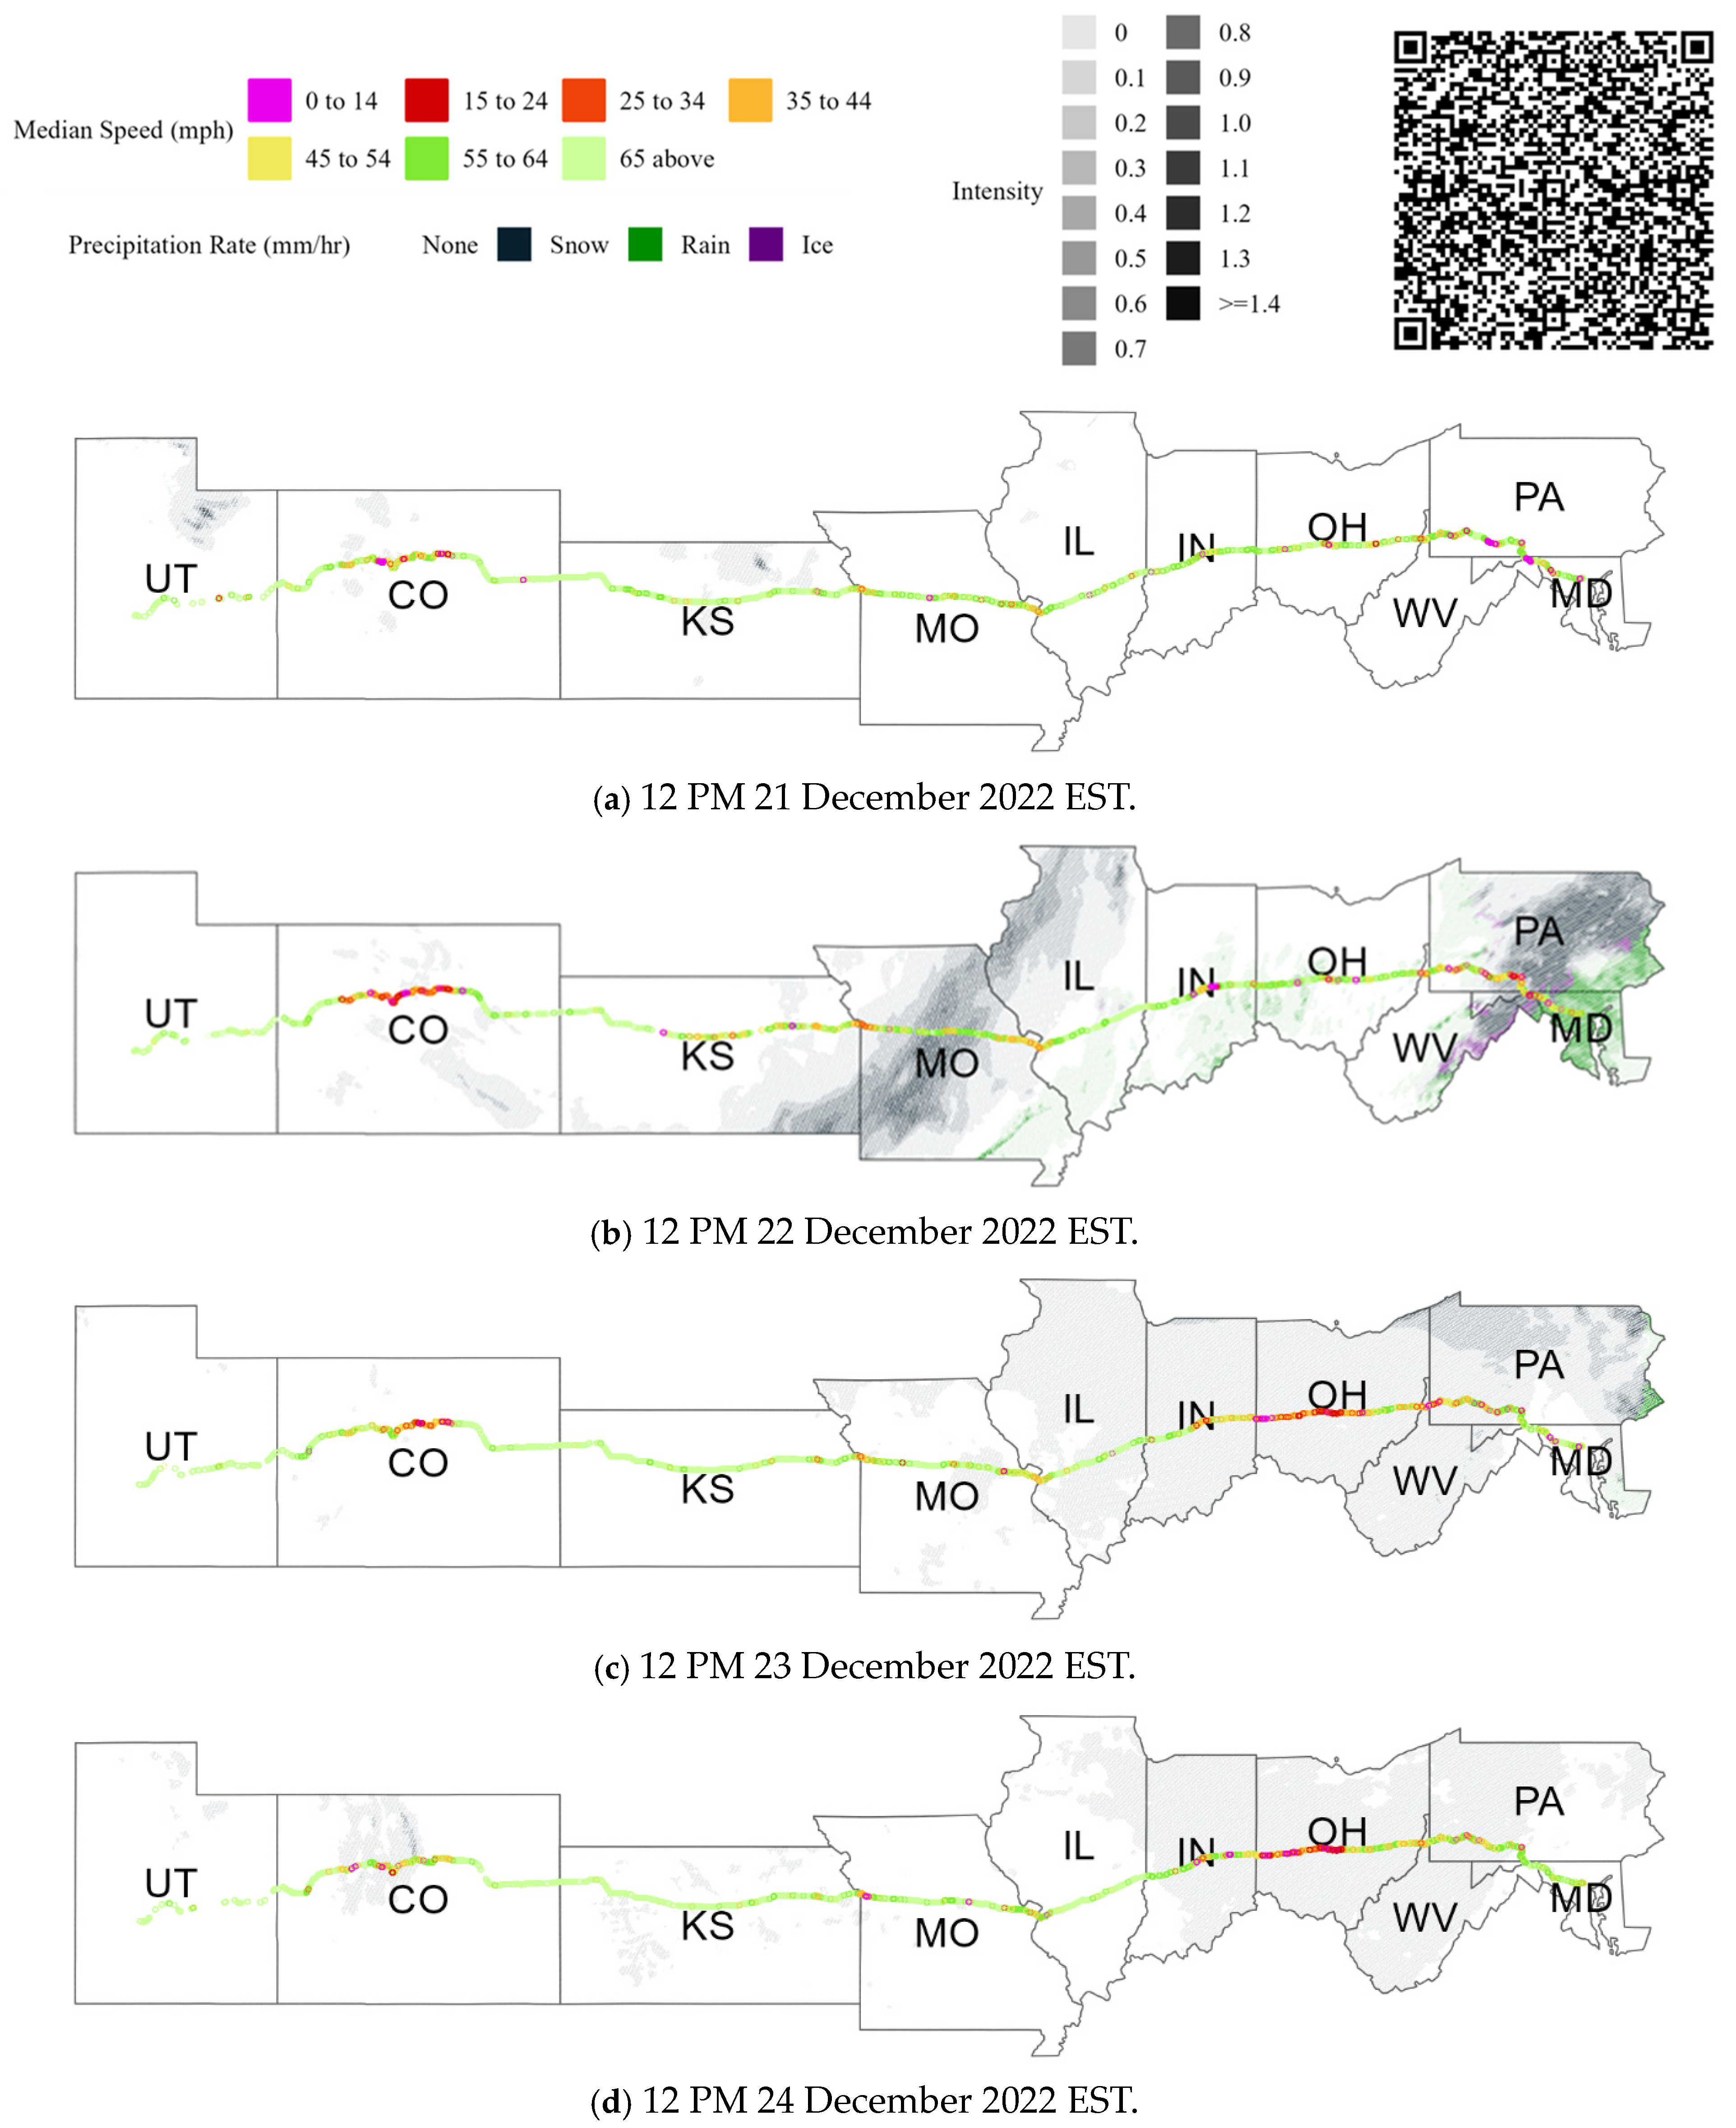
10. Cross Country Route Level Interstate Mobility

Having presented comparisons of interstate mobility at the state level, the next geographic level of aggregation of interest to practitioners or state and local agencies focuses on evaluating interstate mobility along cross country corridors. Recent studies have presented CV heatmaps that represent the spatial and temporal mobility along a chosen multi-state corridor [45]. Figure 4 shows visualizations that present a summary graphic for the percentage of directional route miles operating below 45 mph at a given instant. For each 1 min time period depicted on Figure 4a,b (week before and week of winter storm, respectively), a proportion of the number of 0.1 mile route segments operating below 45 mph out of the total length of the route are plotted. These visualizations were derived from approximately 3.7, 2.0, 1.6, 1.9, and 2.0 billion GPS records for I-10, I-40, I-70, I-80 and I-90, respectively. For consistency, visuals for each route are plotted in Eastern Standard Time. Recurring patterns (shown by callout I for I-10 as an example) during the morning and evening hours are visible for most routes pointing to commuter activity causing slower speeds.
The five interstate routes chosen for this visualization represent the five longest routes in the country in terms of directional miles. For the week of 12–18 December, each route shows expected recurring patterns of slow-moving traffic during the morning and evening hours, potentially attributable to commuter activity (callout i on Figure 4a for example). I-10 and I-40, the third and fourth longest interstate routes mainly traversing the southern half of the country, appear relatively unimpacted for the week of December 19–25 and mimic conditions from the prior week. However, I-70, I-80 and I-90, primarily traversing states in the northern half of the country, each show non-recurring patterns of sustained periods where a high percentage of the route operates below 45 mph, pointing to the winter storm event significantly impacting interstate traffic.

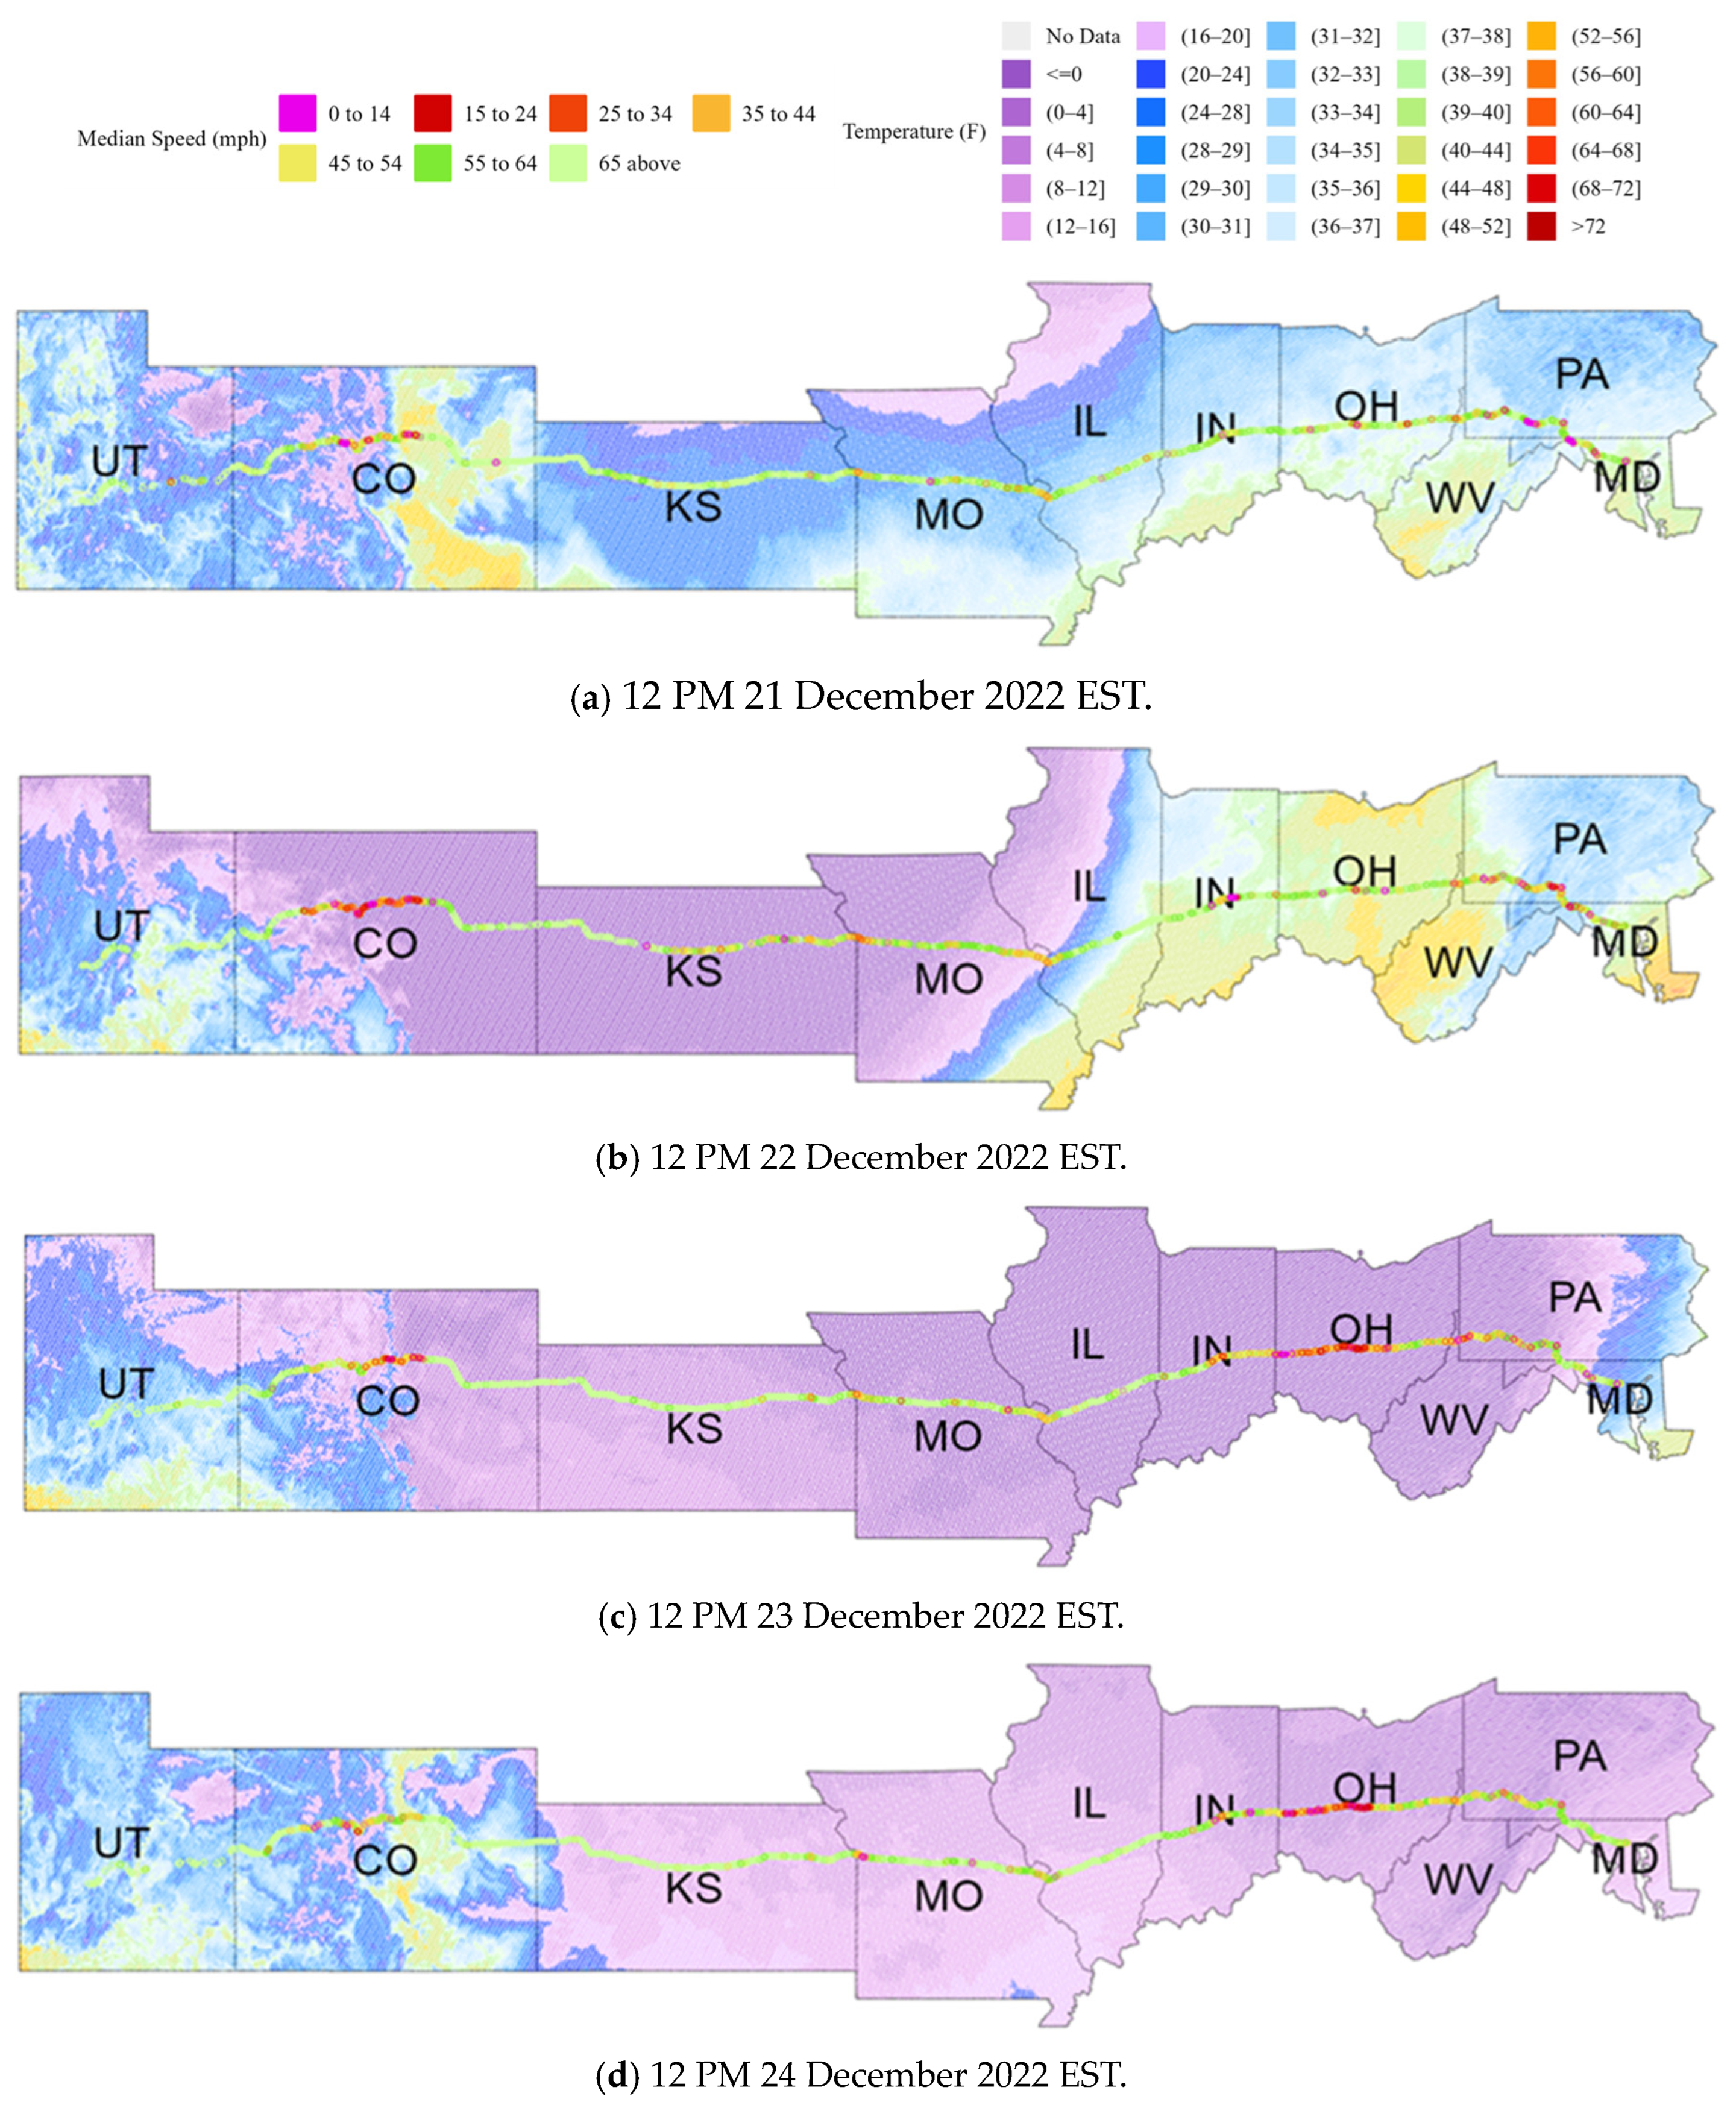
11. Interstate 70 Case Study

Based on the mobility impacts seen on cross country routes in Figure 4, I-70 and I-90 appear to be the two most impacted routes by the winter storm on account of the highest sustained proportion of the route operating below 45 mph. I-90 has a number of tolled sections through the states of Illinois, Indiana, Ohio, New York and Massachusetts, accounting for over 25% of the total route length. Not all I-90 tolled sections are open road tolling with a number of gated tolls that impact segment speeds significantly. There are only two tolled sections of I-70, one from New Stanton to Breezewood in Pennsylvania, where the interstate overlaps with I-76 on the Pennsylvania Turnpike, and the second from Topeka to Bonner Springs in Kansas. Together these sections account for less than 6% of the total route length.
Recent studies have leveraged publicly available weather data from the National Oceanic and Atmospheric Administration (NOAA) to demonstrate the impact of precipitation, including rain intensity on interstate traffic speeds [52,53], predicting roadway visibility [54], forecasting road temperatures [55], and evaluating impacts of weather forecast accuracy on driver commutes [56], among others. Figure 5 and Figure 6 represent integrated visualizations using similar High-Resolution Rapid Refresh (HRRR) weather data (precipitation rate and temperature, respectively), as well as instantaneous median speeds recorded on every 0.1 mile section of I-70 for the ten US States it passes through. A snapshot of conditions is presented by the four subfigures as of noon Eastern Standard Time (EST) daily from 21–24 December to show the progression of the winter storm from west to east, as well as corresponding I-70 traffic conditions.
Figure 5d and Figure 6d clearly show conditions on I-70 in the state of Colorado improving back to free flow speeds as precipitation receded and warmer temperatures returned to the region. However, median speeds on I-70 in Ohio, remaining below 45 mph, point to the potential impact freezing temperatures, in addition to precipitation, had on freeway mobility.

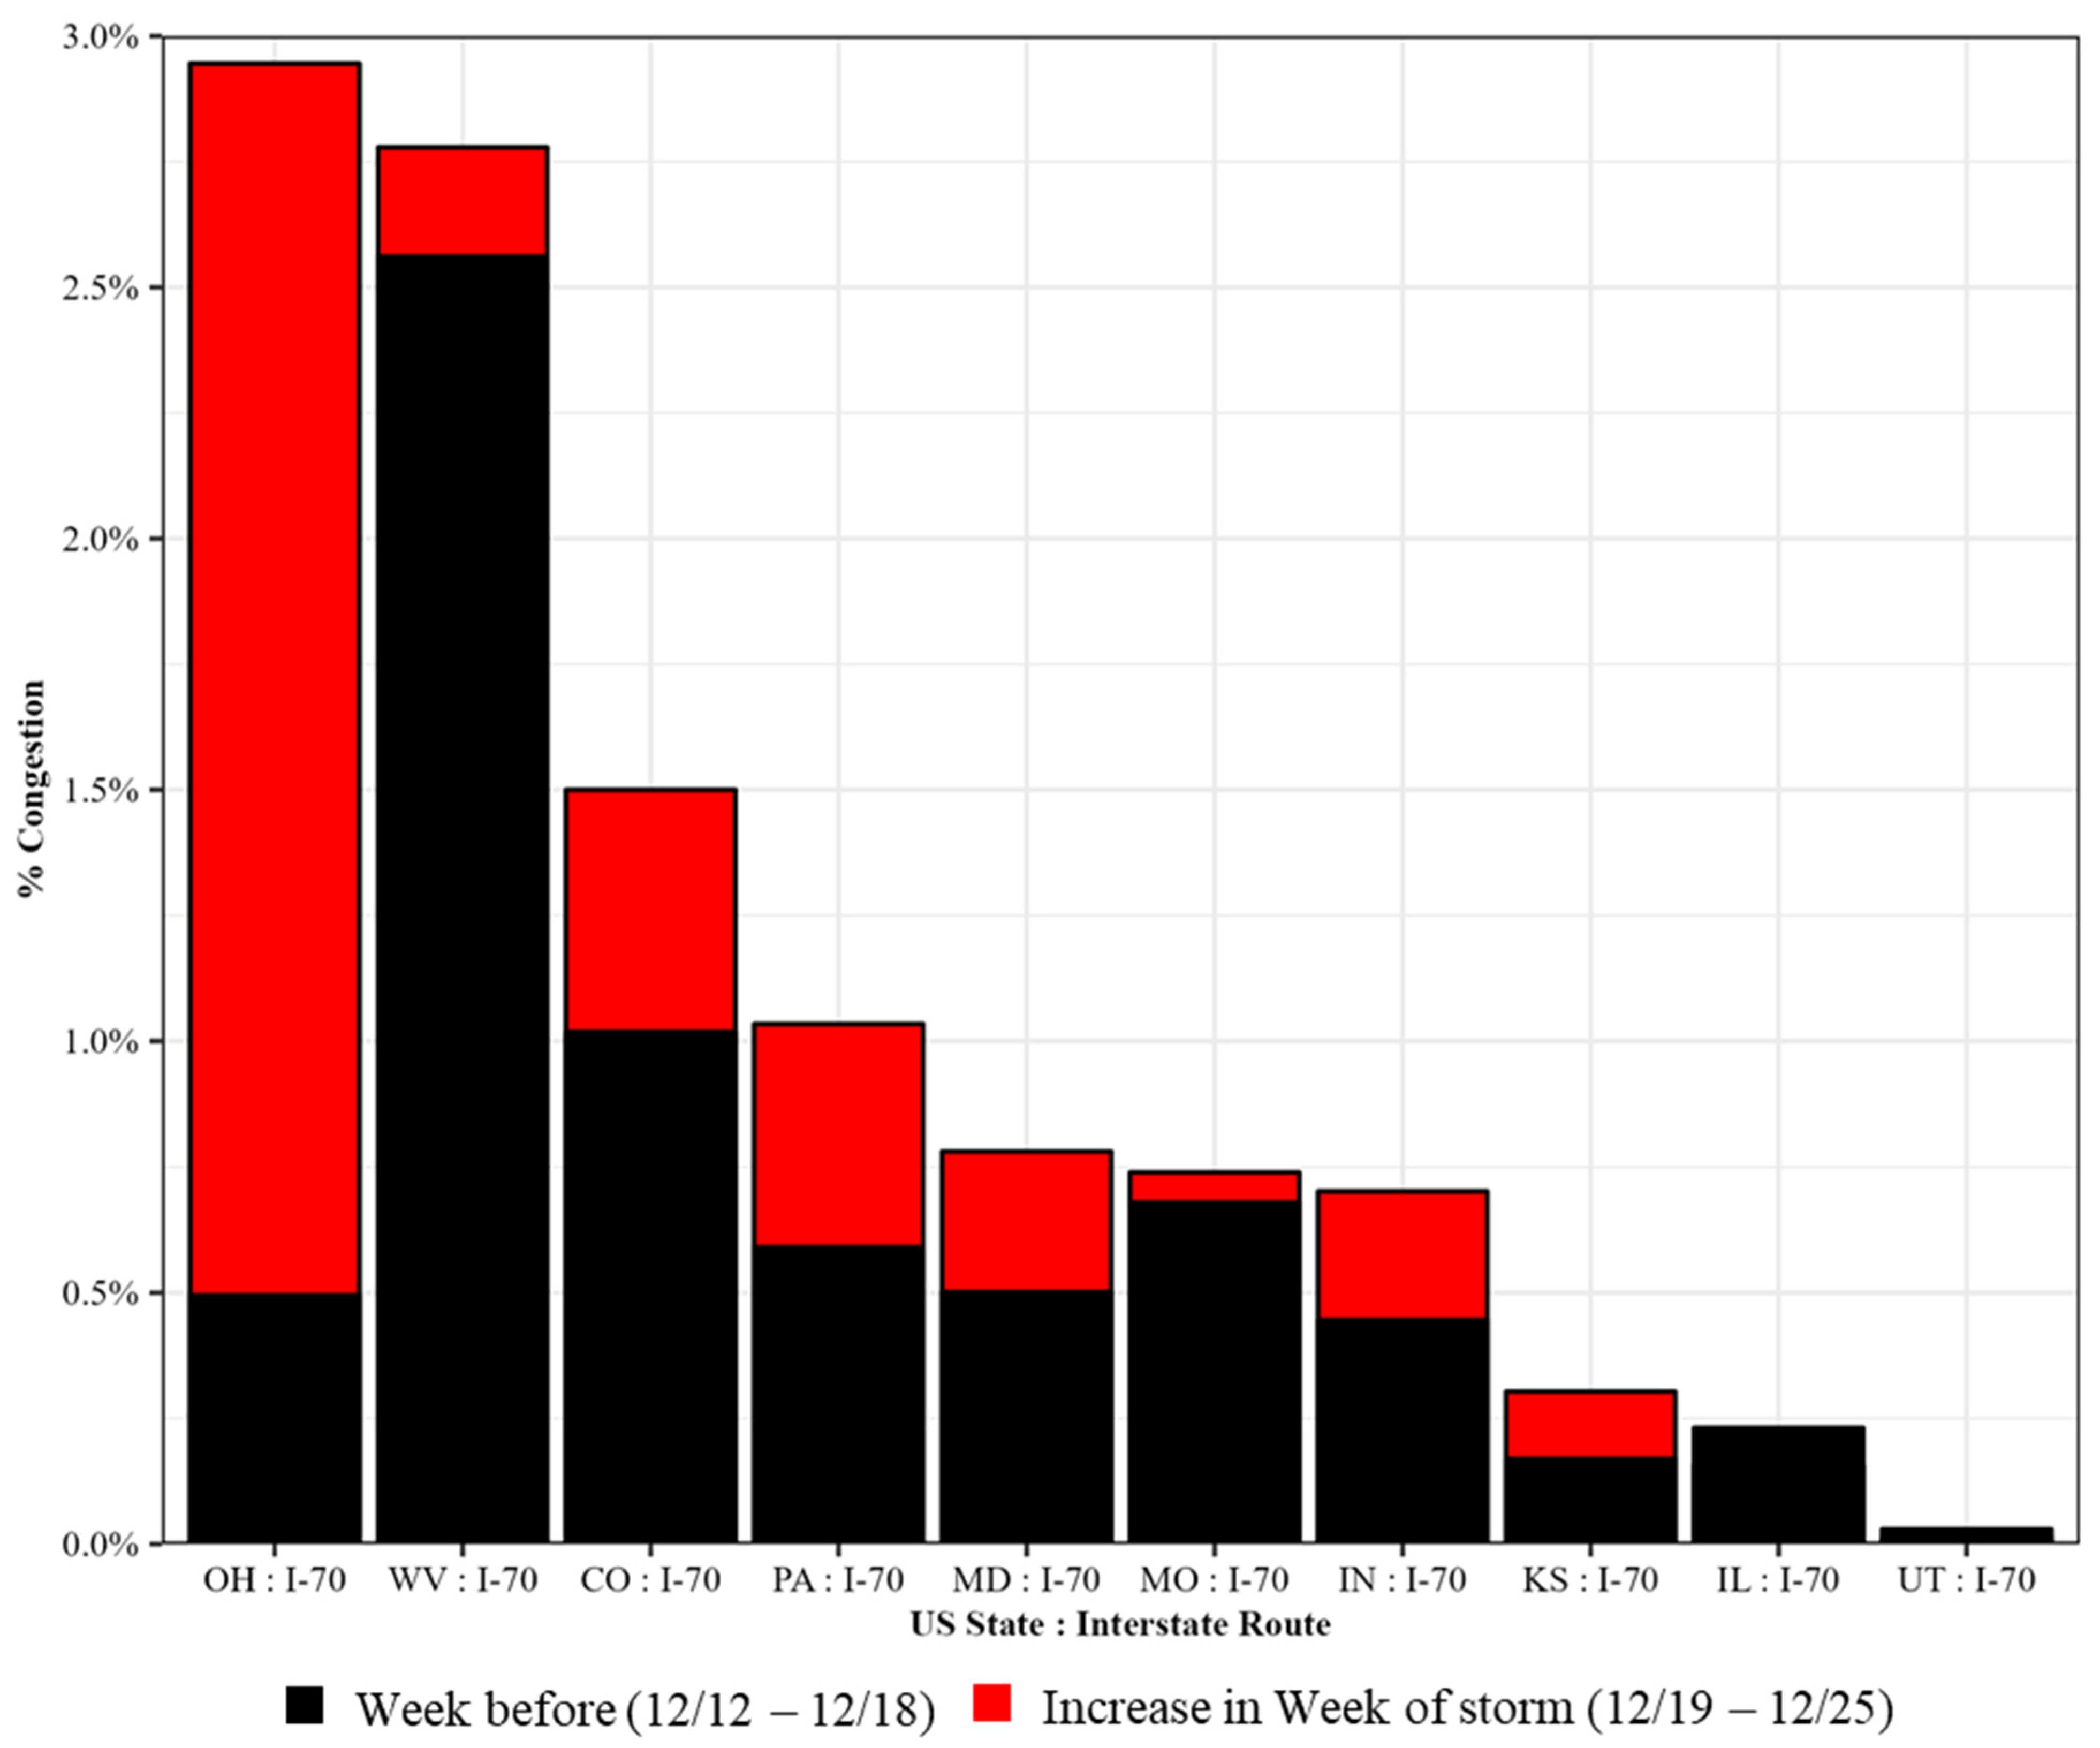
11.1. I-70 Congestion Indices by State

Normalized congestion indices provide an important tool to compare mobility impacts across routes of different lengths [50]. This study has used the congestion index concept to report the percentage of interstate mile-hours operating below 45 mph to quantify mobility on an interstate route. Figure 7 shows this percentage value for I-70, categorized and pareto sorted by each of the ten states it passes through. Values in black indicate the percentage value for the week of 12–18 December, while those in red indicate an increase, if any, in the week of 19–25 December. I-70 in Ohio clearly shows a significant jump from about 0.5% in the prior week, to about 3% during the week of the storm, roughly indicating a six-fold deterioration of interstate travel conditions. A speed threshold of 45 mph, as stated earlier, was utilized to define congested conditions.

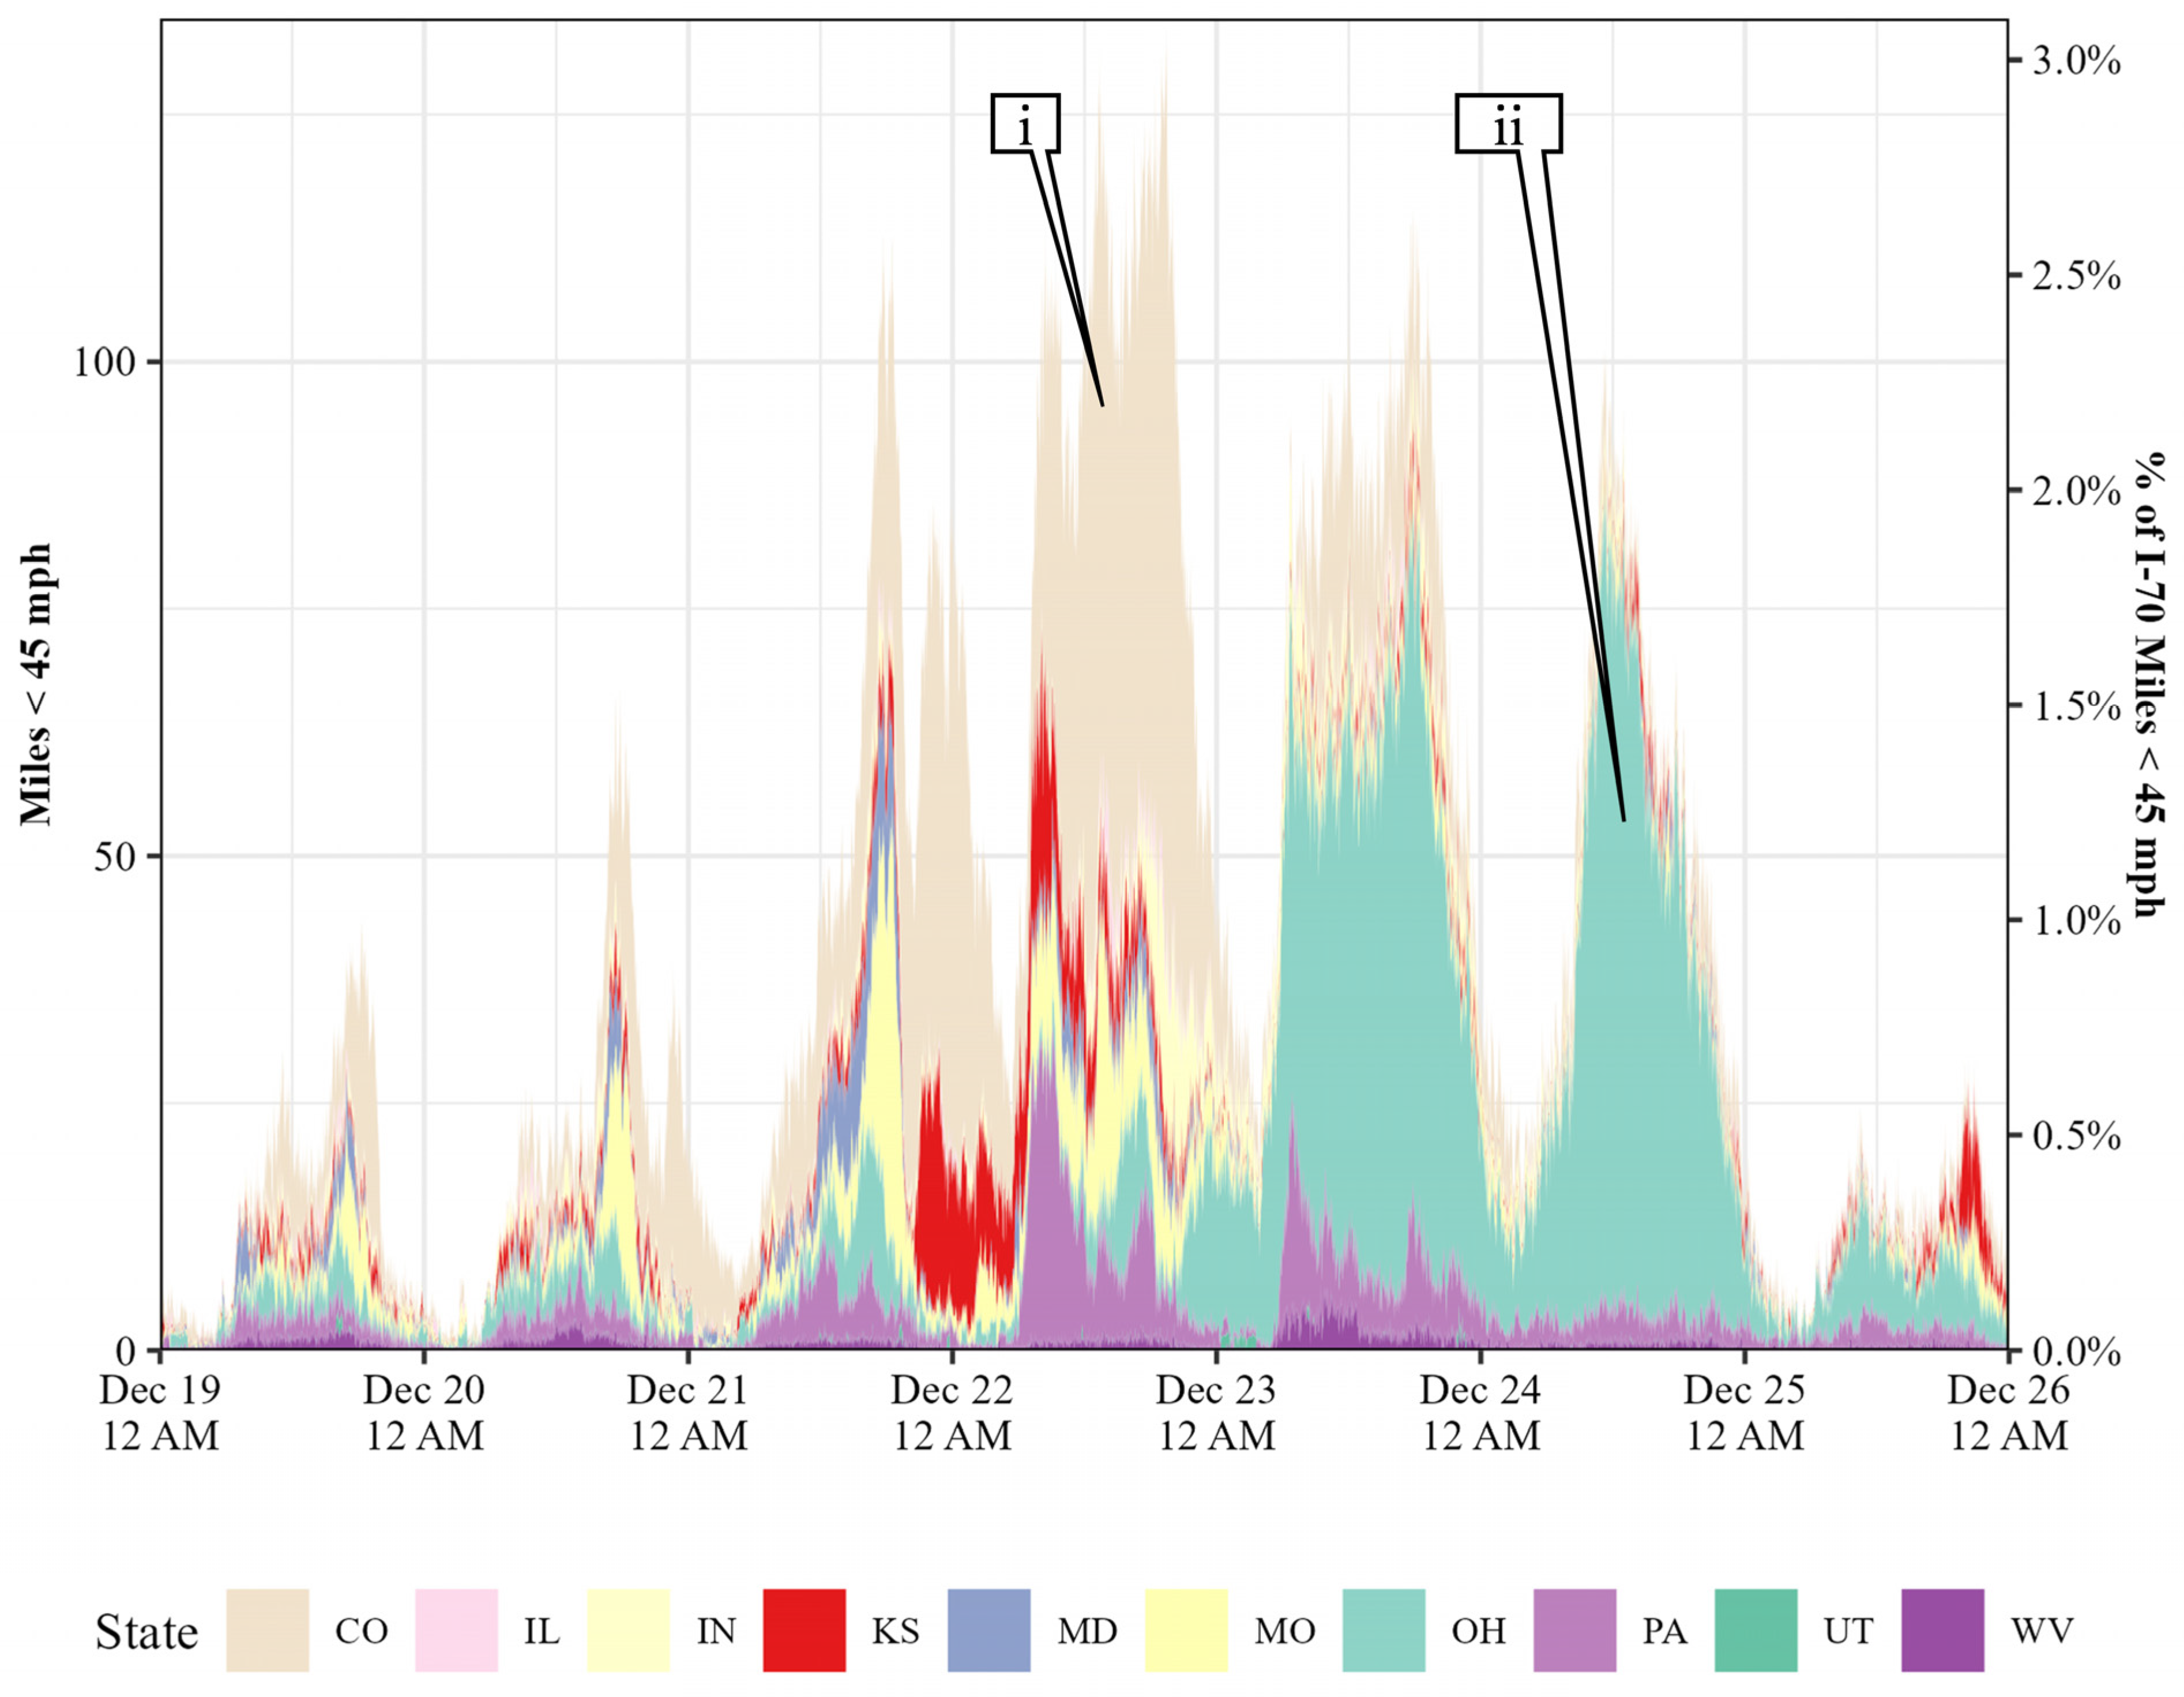
11.2. I-70 Miles of Interstate Operating below 45 mph by State and Time over One Week

Figure 8 represents a subset of the national interstate mobility overview shown in Figure 2b by only focusing on miles of I-70 operating below 45 mph for the analysis period of 19–26 December 2022, colorized by each US State that I-70 passes through from Utah at its western end, to Maryland at its eastern end. This visualization effectively shows the order in which the winter storm progressed from state to state, with Colorado first seeing the highest impacts from the evening of 21 December to the late hours of 22 December (callout i), followed by Ohio from the early hours of 23 December through the late hours of 24 December (callout ii) as the storm moved eastward. As shown by the secondary axis to the right, at its peak, the winter storm impacted as much as 3% of the entire length of I-70 on the evening of 22 December.

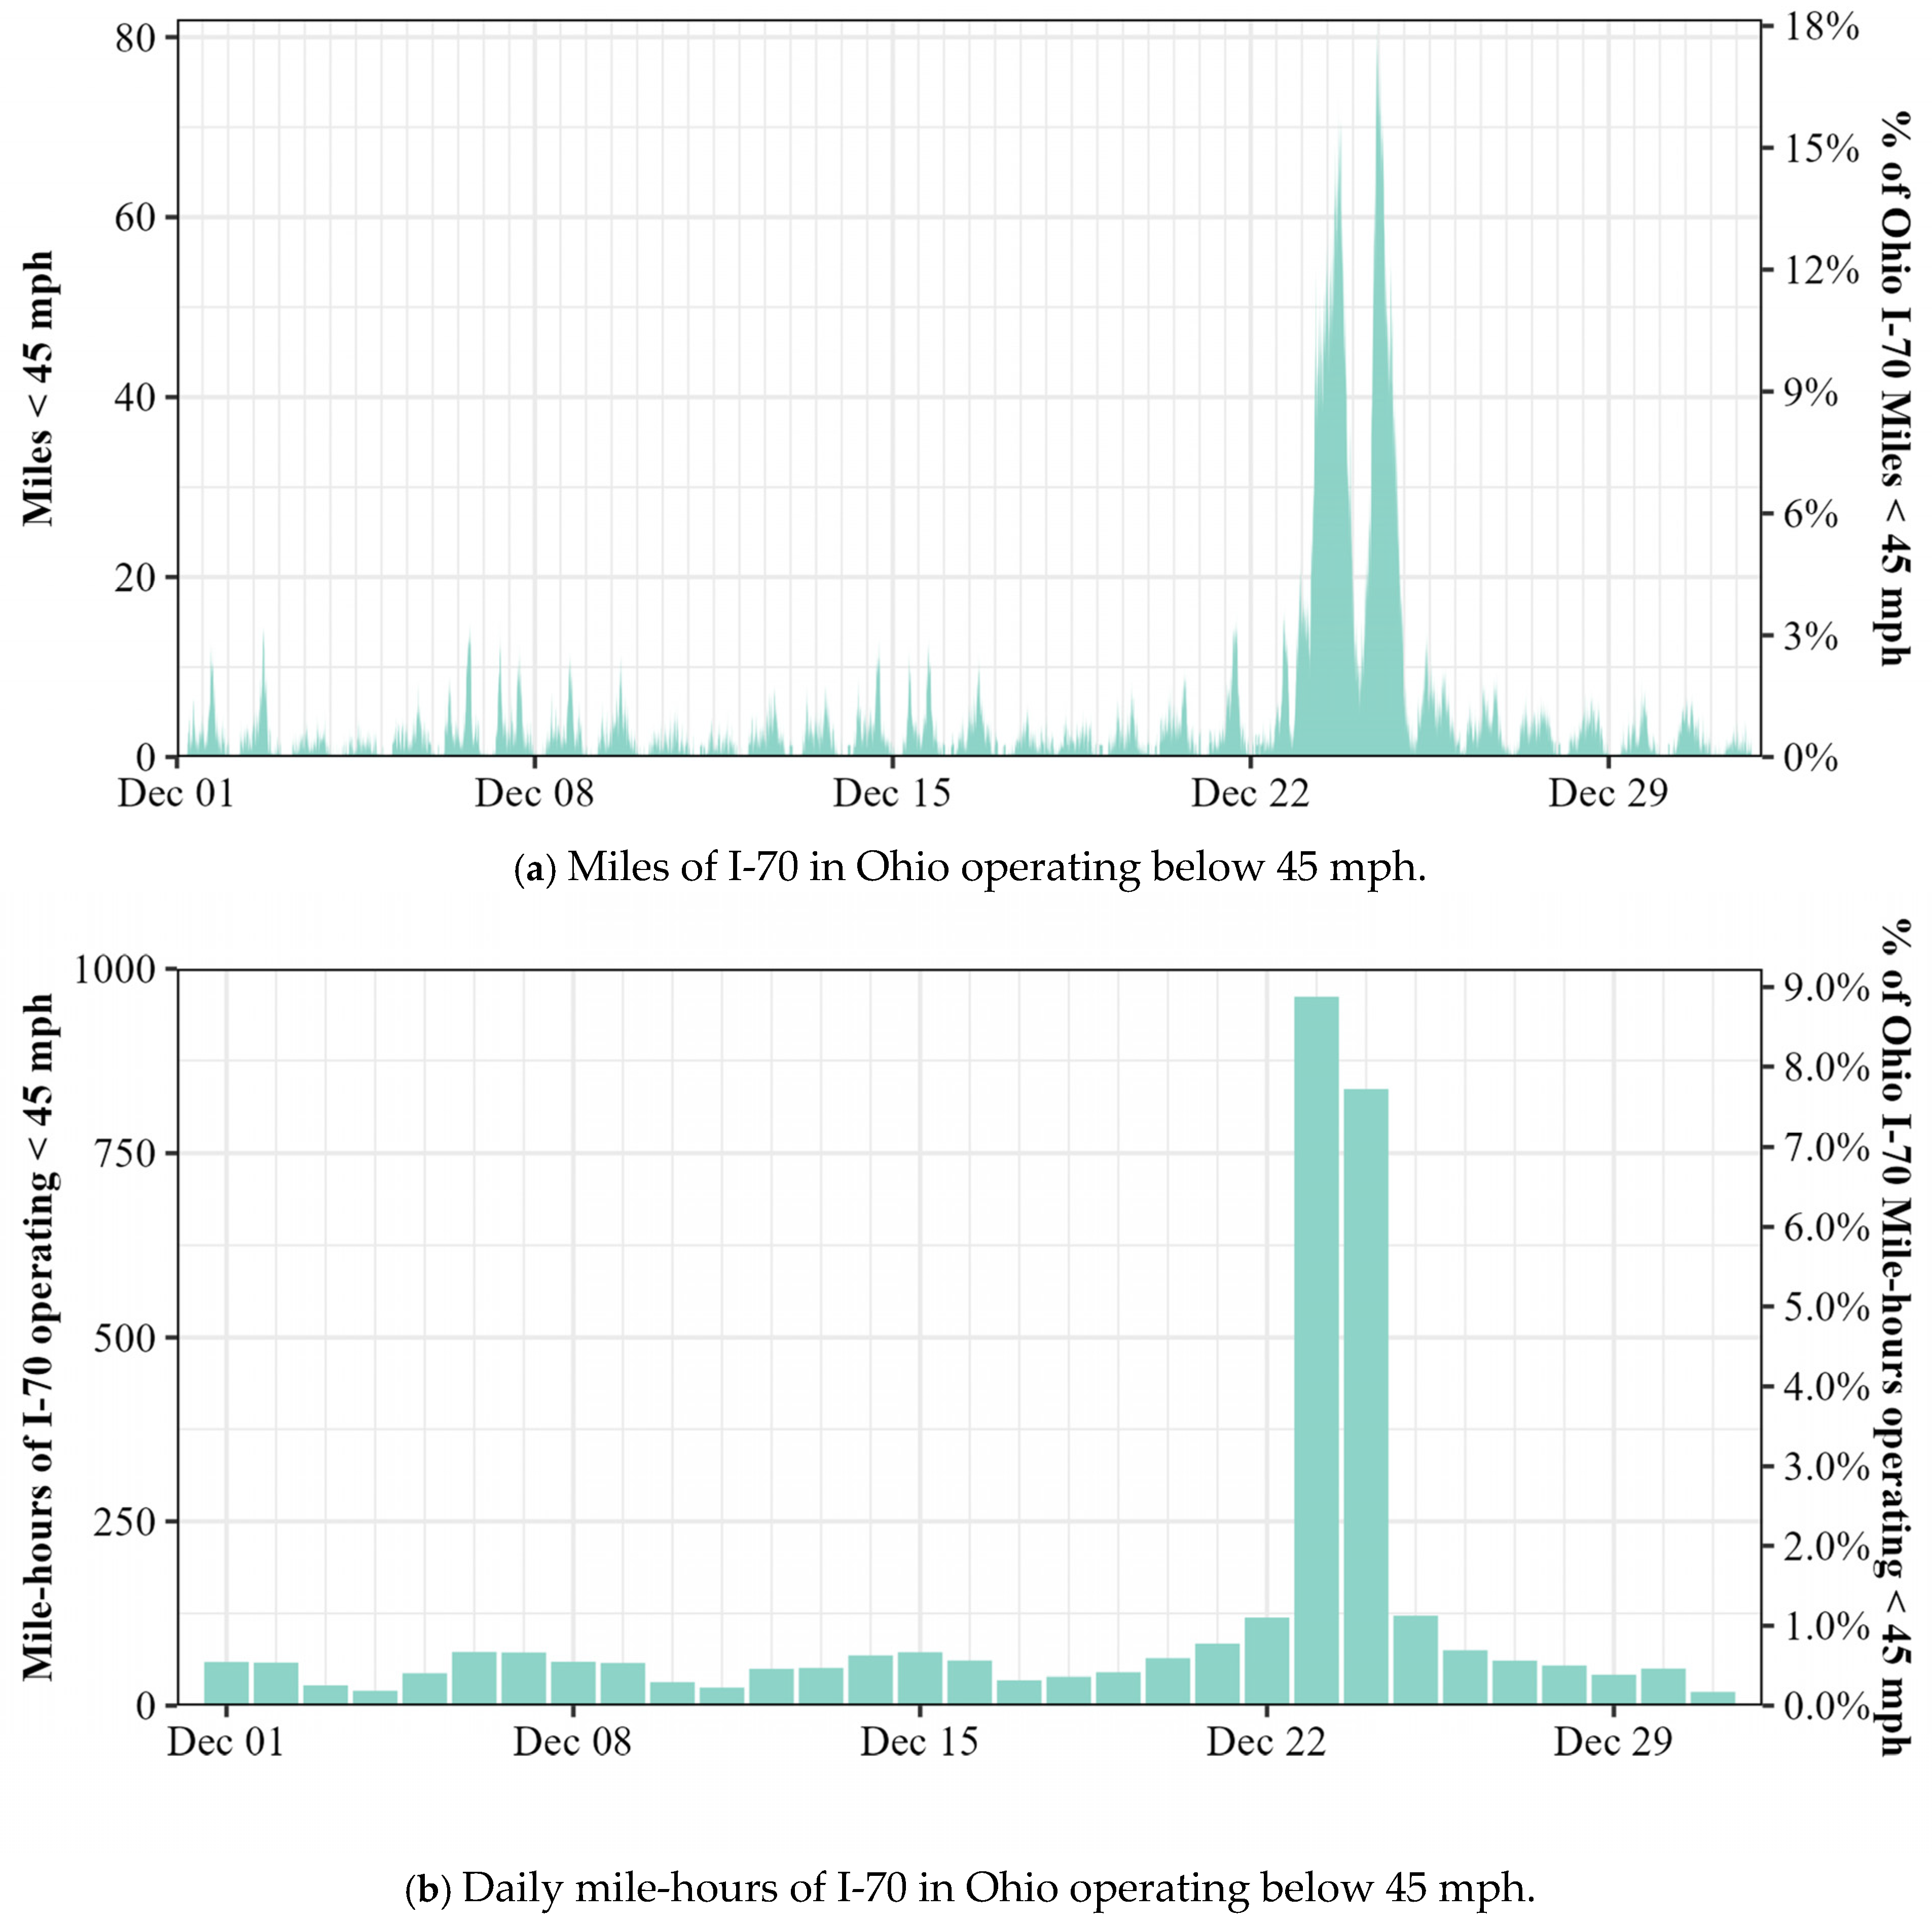
11.3. I-70 Miles of Interstate Operating below 45 mph for Ohio in December

Figure 9 shows an overview of I-70 mobility for the month of December 2022, specifically in the state of Ohio, the most impacted state as evidenced by Figure 8. Recurring weekday and weekend patterns of interstate miles operating below 45 mph are easily discernible from Figure 9a, as well as daily aggregated mile-hours operating below 45 mph, as shown by Figure 9b. A secondary axis on the figure shows the percentage of I-70 miles in Ohio operating below 45 mph. At the winter storm’s peak, almost 18% of I-70 miles in Ohio were operating below 45 mph, which corresponds to about 9% of daily mile-hours operating below 45 mph. Excluding the winter storm period, I-70 in Ohio only witnessed about 2–3% of miles operating below 45 mph thus indicating that the winter storm caused about six times the mobility impact on I-70 compared to the rest of the month.
The visualizations presented by this analysis thus show how national CV data can be leveraged to scalably evaluate the quantitative impacts of winter storm events on interstate mobility at the national, multi-state, state and route level.

12. Conclusions

This study examined over 503 billion CV records to present a summary analysis of the impact on interstate mobility for 97,000 directional miles of interstates across 48 US States and DC, resulting from a major winter storm event for the duration of 21–26 December 2022 that affected nearly a third of the US population. Scalable methodologies were proposed to meaningfully aggregate billions of CV data points into tractable national and state level visualizations (Figure 2 and Figure 3) to comparatively assess mobility impacts on interstate routes. Cross country route-level visualizations were also presented to demonstrate the temporal impact of a storm across an entire interstate route end to end, and easily help in delineating recurring morning and evening slow-moving commuter traffic patterns from non-recurring traffic operating below 45 mph due to inclement weather events (Figure 4).
These system level visualizations were able to quantify the severity, duration and geographic impact during a 21–26 December winter storm. The analysis concludes by presenting a case study of interstate mobility for I-70 and the ten states it passes through, from Utah at its western end, to Maryland at its eastern end. At the storm’s peak, nearly 3% of the 4350 total directional route miles across ten states and nearly 18% of the directional route miles in the state of Ohio alone were found to be operating below 45 mph, thus highlighting the significant national and regional mobility challenges posed by this storm (Figure 8 and Figure 9a).
The techniques proposed by this study will aid stakeholders, practitioners and emergency management agencies in systematically quantifying and documenting the mobility impacts of inclement weather events on interstate travel for near real-time operational decision making, as well as for after-action reviews. The percentage-based metrics and visualizations used throughout the analysis present a systematic way for practitioners at the federal, state or local level to comparatively assess roadway mobility performance irrespective of the magnitude of route miles to be analyzed. The widespread availability and growing penetration rates of CV data offer spatially and temporally unrestricted opportunities for continuous traffic monitoring on any functional class of roadway, which may traditionally have only been possible by time, cost and labor-intensive, sensor-based intelligent transportation system infrastructure. Although the contents of this study specifically focus on interstate routes in the United States, the methodologies, visualizations and performance measures proposed are easily scalable to a route of any functional classification provided the availability of CV data.

Author Contributions

The authors confirm contribution to the paper as follows: Conceptualization, J.D., J.K.M., H.L., R.S.S., D.H. and D.M.B.; Data curation, J.D., J.K.M., H.L. and R.S.S.; Formal analysis, J.D., J.K.M., H.L., R.S.S. and D.M.B.; Funding acquisition, D.H. and D.M.B.; Investigation, J.D., J.K.M., H.L., R.S.S., D.H. and D.M.B.; Methodology, J.D., J.K.M., H.L., R.S.S., D.H. and D.M.B.; Project administration, D.H. and D.M.B.; Resources, H.L. and D.M.B.; Supervision, D.M.B.; Validation, J.D., J.K.M., H.L. and R.S.S.; Visualization, J.D., J.K.M., H.L., R.S.S., D.H. and D.M.B.; Writing—original draft, J.D., J.K.M., R.S.S., D.H. and D.M.B.; Writing—review and editing, J.D., J.K.M., H.L., R.S.S., D.H. and D.M.B. All authors have read and agreed to the published version of the manuscript.

Funding

This research received no external funding.

Institutional Review Board Statement

Not applicable.

Informed Consent Statement

Not applicable.

Data Availability Statement

Connected vehicle trajectory data for December 2022 used in this study was provided by Wejo Data Services Inc. The data that support the findings of this study grouped by the 9 US Geographic Divisions are openly available at [51].

Acknowledgments

Google Cloud Platform’s Big Query was utilized for the cloud database analysis and warehousing. This study is based upon work supported by the Joint Transportation Research Program administered by the Indiana Department of Transportation and Purdue University. The contents of this paper reflect the views of the authors, who are responsible for the facts and the accuracy of the data presented herein, and do not necessarily reflect the official views or policies of the sponsoring organizations. These contents do not constitute a standard, specification, or regulation.

Conflicts of Interest

The authors declare no conflict of interest.

References

  1. How Do Weather Events Impact Roads?—FHWA Road Weather Management. Available online: https://ops.fhwa.dot.gov/weather/q1_roadimpact.htm (accessed on 21 July 2023).
  2. December 2022 National Climate Report | National Centers for Environmental Information (NCEI). Available online: https://www.ncei.noaa.gov/access/monitoring/monthly-report/national/202212 (accessed on 20 July 2023).
  3. LeComte, D. Weather Highlights 2022—Drought, Flash Floods, Severe Outbreaks, Hurricane Ian, Blockbuster Winter Storms. Weatherwise 2023, 76, 14–22. [Google Scholar] [CrossRef]
  4. Colorado Road Closures: Several Northeast Highways Closed Due to Safety Concerns from Winter Storm. The Denver Post. Available online: https://www.denverpost.com/2022/12/22/colorado-traffic-road-closures-i-70-winter-storm/ (accessed on 21 July 2023).
  5. 4 Dead in 46-Car Pileup in Ohio as Storm Blasts Christmas Weekend—The Washington Post. Available online: https://www.washingtonpost.com/weather/2022/12/24/ohio-winter-weather-pileup-storm/ (accessed on 21 July 2023).
  6. Winter Storm Elliott Intensified into Bomb Cyclone with High Winds, Blizzard Conditions, Flooding. Available online: https://www.wunderground.com/article/storms/winter/news/2022-12-23-winter-storm-elliott-bomb-cyclone-midwest-northeast-winds-snow (accessed on 21 July 2023).
  7. Herbert, G. Update: NYS Thruway Reopens; Syracuse Snow Crews to Help Dig Out Buffalo. Syracuse. Available online: https://www.syracuse.com/state/2022/12/thruway-still-closed-in-western-ny-syracuse-snow-crews-to-help-dig-out-buffalo.html (accessed on 26 September 2023).
  8. Knapp, K.K.; Smithson, L.D. Winter Storm Event Volume Impact Analysis Using Multiple-Source Archived Monitoring Data. Transp. Res. Rec. 2000, 1700, 10–16. [Google Scholar] [CrossRef]
  9. Knapp, K.K.; Smithson, L.D. Use of Mobile Video Data Collection Equipment to Investigate Winter Weather Vehicle Speeds. Transp. Res. Rec. 2001, 1745, 53–60. [Google Scholar] [CrossRef]
  10. Stern, A.D.; Shah, V.; Goodwin, L.C. Analysis of Weather Impacts on Traffic Flow in Metropolitan Washington, DC; Federal Highway Administration: Washington, DC, USA, 2003. Available online: https://rosap.ntl.bts.gov/view/dot/51762 (accessed on 22 July 2023).
  11. Donaher, G.; Fu, L.; Usman, T.; Perchanok, M. Quantifying the mobility effects of winter snow events and the benefits of winter road maintenance. Surf. Transp. Weather. 2012, 173, 173–186. [Google Scholar]
  12. Shahdah, U.; Fu, L. Quantifying the mobility benefits of winter road maintenance—A simulation based analysis. In Proceedings of the TRB 89th Annual Meeting Compendium of Papers DVD, Washington, DC, USA, 10–14 January 2010; Available online: https://www.academia.edu/download/53531545/Quantifying_the_mobility_benefits_of_win20170615-20832-6l0uwp.pdf (accessed on 26 September 2023).
  13. Fu, L.; Kwon, T.J. Mobility Effects of Winter Weather and Road Maintenance Operations. In Sustainable Winter Road Operations; John Wiley & Sons, Ltd.: Hoboken, NJ, USA, 2018; pp. 131–155. ISBN 978-1-119-18516-1. [Google Scholar] [CrossRef]
  14. Dey, K.C.; Mishra, A.; Chowdhury, M. Potential of Intelligent Transportation Systems in Mitigating Adverse Weather Impacts on Road Mobility: A Review. IEEE Trans. Intell. Transp. Syst. 2015, 16, 1107–1119. [Google Scholar] [CrossRef]
  15. Dao, B.; Hasanzadeh, S.; Walker, C.L.; Steinkruger, D.; Esmaeili, B.; Anderson, M.R. Current Practices of Winter Maintenance Operations and Perceptions of Winter Weather Conditions. J. Cold Reg. Eng. 2019, 33, 04019008. [Google Scholar] [CrossRef]
  16. McNamara, M.; Li, H.; Remias, S.; Horton, D.; Cox, E.; Bullock, D. Real-Time Probe Data Dashboards for Interstate Performance Monitoring during Winter Weather and Incidents. Transp. Res. Rec. 2016, 20. Available online: https://docs.lib.purdue.edu/civeng/20 (accessed on 26 September 2023).
  17. Desai, J.; Mahlberg, J.; Kim, W.; Sakhare, R.; Li, H.; McGuffey, J.; Bullock, D.M. Leveraging Telematics for Winter Operations Performance Measures and Tactical Adjustment. JTTs 2021, 11, 611–627. [Google Scholar] [CrossRef]
  18. Hans, Z.; Hawkins, N.; Savolainen, P.; Rista, E.; Iowa State University. Center for Weather Impacts on Mobility and Safety, and Iowa State University. Institute for Transportation. Operational Data to Assess Mobility and Crash Experience during Winter Conditions. InTrans Project 14-523. 2018. Available online: https://rosap.ntl.bts.gov/view/dot/64414 (accessed on 26 September 2023).
  19. Young, R.; Milliken, E.; Offei, E.; University of Wyoming. Department of Civil and Architectural Engineering. Improving Traveler Information on Rural Corridors in Wyoming through the Use of Intelligent Transportation Systems. FHWA-WY-14/03F. 2014. Available online: https://rosap.ntl.bts.gov/view/dot/28951 (accessed on 26 September 2023).
  20. Chien, S.I.; Gao, S.; Meegoda, J.N. Fleet Size Estimation for Snowplowing Operation Considering Road Geometry, Weather, and Traffic Speed. J. Transp. Eng. 2013, 139, 903–912. [Google Scholar] [CrossRef]
  21. Shi, X.; Wang, Y.; Wang, H.; Akin, M. Exploring Weather-Related Connected Vehicle Applications for Improved Winter Travel in the Pacific Northwest. 2020. Available online: https://digital.lib.washington.edu:443/researchworks/handle/1773/46273 (accessed on 26 September 2023).
  22. Leos Barajas, V.; Wang, Z.; Kaiser, M.; Zhu, Z.; Iowa State University. Institute for Transportation. Improving Estimates of Real-Time Traffic Speeds during Weather for Winter Maintenance Performance Measurements. InTrans Project 13-485. 2017. Available online: https://rosap.ntl.bts.gov/view/dot/32224 (accessed on 26 September 2023).
  23. Rafferty, P.; Jin, J.; Silber, H. Examining Multistate Mobility Performance in the Mid-America Region. J. Transp. Eng. Part A Syst. 2017, 143, 04016008. [Google Scholar] [CrossRef]
  24. Lawson, C.T.; Chen, F.; Alim, A.; Apama, J. Techniques for Efficient Detection of Rapid Weather Change and Analysis of their Impacts on a Highway Network; University Transportation Research Center: New York, NY, USA, 2017. Available online: https://rosap.ntl.bts.gov/view/dot/34856 (accessed on 22 July 2023).
  25. Kim, S.; Coifman, B. Comparing INRIX speed data against concurrent loop detector stations over several months. Transp. Res. Part C: Emerg. Technol. 2014, 49, 59–72. [Google Scholar] [CrossRef]
  26. Adu-Gyamfi, Y.O.; Sharma, A.; Knickerbocker, S.; Hawkins, N.; Jackson, M. Framework for Evaluating the Reliability of Wide-Area Probe Data. Transp. Res. Rec. 2017, 2643, 93–104. [Google Scholar] [CrossRef]
  27. Liu, X.; Chien, S.; Kim, K. Evaluation of floating car technologies for travel time estimation. J. Mod. Transport. 2012, 20, 49–56. [Google Scholar] [CrossRef]
  28. Wang, Y.; Araghi, B.N.; Malinovskiy, Y.; Corey, J.; Cheng, T.; Pacific Northwest Transportation Consortium. Error Assessment for Emerging Traffic Data Collection Devices. WA-RD 810.1. 2014. Available online: https://rosap.ntl.bts.gov/view/dot/27777 (accessed on 26 September 2023).
  29. Dimitrijevic, B.; Zhong, Z.; Zhao, L.; Besenski, D.; Lee, J. Assessing Connected Vehicle Data Coverage on New Jersey Roadways. In Proceedings of the 2022 IEEE 7th International Conference on Intelligent Transportation Engineering (ICITE), Beijing, China, 11–13 November 2022; pp. 388–393. [Google Scholar] [CrossRef]
  30. Claros, B.; Vorhes, G.; Chitturi, M.; Bill, A.; Noyce, D.A. Filling Traffic Count Gaps with Connected Vehicle Data. In Proceedings of the International Conference on Transportation and Development, Washington, DC, USA, 31 May–3 June 2022; pp. 192–199. [Google Scholar] [CrossRef]
  31. Kandiboina, R.; Knickerbocker, S.; Bhagat, S.; Hawkins, N.; Sharma, A. Exploring the Efficacy of Large-Scale Connected Vehicle Data in Real-Time Traffic Applications. Transp. Res. Rec. 2023. [Google Scholar] [CrossRef]
  32. Khadka, S.; Wang, S.; Li, T.P.; Torres, F.J. A New Framework for Regional Traffic Volumes Estimation with Large-Scale Connected Vehicle Data and Deep Learning Method. J. Transp. Eng. Part A Syst. 2023, 149, 04023015. [Google Scholar] [CrossRef]
  33. Sakhare, R.S.; Desai, J.; Li, H.; Kachler, M.A.; Bullock, D.M. Methodology for Monitoring Work Zones Traffic Operations Using Connected Vehicle Data. Safety 2022, 8, 41. [Google Scholar] [CrossRef]
  34. Islam, Z.; Abdel-Aty, M.; Anwari, N.; Islam, M.R. Understanding the impact of vehicle dynamics, geometric and non-geometric roadway attributes on surrogate safety measure using connected vehicle data. Accid. Anal. Prev. 2023, 189, 107125. [Google Scholar] [CrossRef]
  35. Khadka, S.; Li, T.P.; Wang, Q. Developing Novel Performance Measures for Traffic Congestion Management and Operational Planning Based on Connected Vehicle Data. J. Urban Plan. Dev. 2022, 148, 04022016. [Google Scholar] [CrossRef]
  36. Nafakh, A.; Davila, F.; Zhang, Y.; Fricker, J.; Abraham, D. Safety and Mobility Analysis of Rolling Slowdown for Work Zones: Comparison with Full Closure; Purdue University: West Lafayette, IN, USA, 2022. [Google Scholar] [CrossRef]
  37. Mahmud, S.; Day, C.M. Exploring Crowdsourced Hard—Acceleration and Braking Event Data for Evaluating Safety Performance of Low-Volume Rural Highways in Iowa. J. Transp. Technol. 2023, 13, 282–300. [Google Scholar] [CrossRef]
  38. Saldivar-Carranza, E.; Li, H.; Mathew, J.; Desai, J.; Platte, T.; Gayen, S.; Sturdevant, J.; Taylor, M.; Fisher, C.; Bullock, D. Next Generation Traffic Signal Performance Measures: Leveraging Connected Vehicle Data; Purdue University: West Lafayette, IN, USA, 2023. [Google Scholar] [CrossRef]
  39. Nazari Enjedani, S.; Khanal, M. Development of a Turning Movement Estimator Using CV Data. Future Transp. 2023, 3, 349–367. [Google Scholar] [CrossRef]
  40. Islam, Z.; Abdel-Aty, M.; Ugan, J. Signal Phasing and Timing Prediction Using Connected Vehicle Data. Transp. Res. Rec. 2023, 03611981231171909. [Google Scholar] [CrossRef]
  41. Vlachogiannis, D.M.; Moura, S.; Macfarlane, J. Intersense: An XGBoost model for traffic regulator identification at intersections through crowdsourced GPS data. Transp. Res. Part C Emerg. Technol. 2023, 151, 104112. [Google Scholar] [CrossRef]
  42. Li, X.; Xu, H.; Huang, X.; Guo, C.; Kang, Y.; Ye, X. Emerging geo-data sources to reveal human mobility dynamics during COVID-19 pandemic: Opportunities and challenges. Comput.Urban Sci. 2021, 1, 22. [Google Scholar] [CrossRef]
  43. Li, X.; Jalilifar, E.; Martin, M.; Dadashova, B.; Salgado, D.; Samant, S. Exploring Crowdsourced Big Data to Estimate Border Crossing Times; Texas A&M Transportation Institute: El Paso, TX, USA, 2022. [Google Scholar]
  44. Ahmad, S.; Ali, A.; Ahmed, H.U.; Huang, Y.; Lu, P. Evaluating Traffic Operation Conditions during Wildfire Evacuation Using Connected Vehicles Data. Fire 2023, 6, 184. [Google Scholar] [CrossRef]
  45. Desai, J.; Mathew, J.; Li, H.; Sakhare, R.S.; Horton, D.; Bullock, D. National Mobility Analysis for All Interstate Routes in the United States: December 2022; Purdue University: West Lafayette, IN, USA, 2022. [Google Scholar] [CrossRef]
  46. Sakhare, R.S.; Hunter, M.; Mukai, J.; Li, H.; Bullock, D.M. Truck and Passenger Car Connected Vehicle Penetration on Indiana Roadways. J. Transp. Technol. 2022, 12, 578–599. [Google Scholar] [CrossRef]
  47. Abdelraouf, A.; Abdel-Aty, M.; Mahmoud, N. Sequence-to-Sequence Recurrent Graph Convolutional Networks for Traffic Estimation and Prediction Using Connected Probe Vehicle Data. IEEE Trans. Intell. Transp. Syst. 2023, 24, 1395–1405. [Google Scholar] [CrossRef]
  48. Tavafoghi, H.; Porter, J.; Flores, C.; Poolla, K.; Varaiya, P. Queue Length Estimation from Connected Vehicles with Low and Unknown Penetration Level. In Proceedings of the 2021 IEEE International Intelligent Transportation Systems Conference (ITSC), Indianapolis, IN, USA, 19–22 September 2021; pp. 1217–1224. [Google Scholar]
  49. Geographic Division or Region—Health, United States. Available online: https://www.cdc.gov/nchs/hus/sources-definitions/geographic-region.htm (accessed on 25 October 2023).
  50. Brennan, T.M.; Remias, S.M.; Grimmer, G.M.; Horton, D.K.; Cox, E.D.; Bullock, D.M. Probe Vehicle–Based Statewide Mobility Performance Measures for Decision Makers. Transp. Res. Rec. 2013, 2338, 78–90. [Google Scholar] [CrossRef]
  51. Desai, J.C.; Mathew, J.K.; Sakhare, R.S.; Li, H.; Horton, D.; Bullock, D.M. Interstate Vehicle Miles Travelled and Miles Operating Below 45 mph Dataset; Purdue University Research Repository: West Lafayette, IN, USA, 2023. [Google Scholar] [CrossRef]
  52. Sakhare, R.S.; Zhang, Y.; Li, H.; Bullock, D.M. Impact of Rain Intensity on Interstate Traffic Speeds Using Connected Vehicle Data. Vehicles 2023, 5, 133–155. [Google Scholar] [CrossRef]
  53. Downing, W.L. Using Probe Data Analytics for Characterizing Speed Reductions as Well as Predicting Speeds during Rain Events. M.Sc., Purdue University: United State—Indiana. 2020. Available online: https://www.proquest.com/docview/2827706585/abstract/C488433DAB1F4656PQ/1 (accessed on 26 September 2023).
  54. Pulugurtha, S.S.; Mane, A.S.; Duddu, V.R.; Godfrey, C.M. Investigating the influence of contributing factors and predicting visibility at road link-level. Heliyon 2019, 5, e02105. [Google Scholar] [CrossRef]
  55. Handler, S.L.; Reeves, H.D.; McGovern, A. Development of a Probabilistic Subfreezing Road Temperature Nowcast and Forecast Using Machine Learning. Weather Forecast. 2020, 35, 1845–1863. [Google Scholar] [CrossRef]
  56. Hartman, B.; Cutler, H.; Shields, M.; Turner, D. The economic effects of improved precipitation forecasts in the United States due to better commuting decisions. Growth Chang. 2021, 52, 2149–2171. [Google Scholar] [CrossRef]
Figure 1. US Interstate Highway System.
Futuretransp 03 00071 g001
Figure 2. Overview of US Interstate Mobility categorized by 9 Geographic Divisions for December 2022. (a) Vehicle Miles Traveled by CVs on US Interstates. (b) US Interstate Miles Operating Below 45 mph.
Futuretransp 03 00071 g002
Figure 3. Week-over-week comparison of percent of major interstate route mile-hours operating below 45 mph by US State. (a) 12–18 December 2022. (b) 19–25 December 2022.
Futuretransp 03 00071 g003
Figure 4. Minute-by-minute visualization of percent of total route operating below 45 mph for five longest US Interstates. (a) 12–18 December 2022. (b) 19–25 December 2022.
Futuretransp 03 00071 g004
Figure 5. I-70 CV Speeds and HRRR Precipitation Rate (https://youtu.be/ZtuqAHaoKq4 (accessed on 11 August 2023)). (a) 12 PM 21 December 2022 EST. (b) 12 PM 22 December 2022 EST. (c) 12 PM 23 December 2022 EST. (d) 12 PM 24 December 2022 EST.
Futuretransp 03 00071 g005
Figure 6. I-70 CV Speeds and HRRR Temperature. (a) 12 PM 21 December 2022 EST. (b) 12 PM 22 December 2022 EST. (c) 12 PM 23 December 2022 EST. (d) 12 PM 24 December 2022 EST.
Futuretransp 03 00071 g006
Figure 7. Week-over-week comparison of percentage congestion on I-70 ordered by severity.
Futuretransp 03 00071 g007
Figure 8. Miles of I-70 operating below 45 mph colored by US State.
Futuretransp 03 00071 g008
Figure 9. I-70 Mobility in Ohio for December 2022. (a) Miles of I-70 in Ohio operating below 45 mph. (b) Daily mile-hours of I-70 in Ohio operating below 45 mph.
Futuretransp 03 00071 g009
Disclaimer/Publisher’s Note: The statements, opinions and data contained in all publications are solely those of the individual author(s) and contributor(s) and not of MDPI and/or the editor(s). MDPI and/or the editor(s) disclaim responsibility for any injury to people or property resulting from any ideas, methods, instructions or products referred to in the content.

