
To Share or to Own? Understanding the Willingness to Adopt Shared and Owned Electric Automated Vehicles on Three Continents

Abstract
:1. Introduction
2. Literature Review
2.1. Automated Vehicles
2.2. Effect of AVs on Society and the Build Environment
2.3. Change in Vehicle-Miles Travelled
2.4. Differences Because of Personal Characteristics
2.5. Differences in Environmental Characteristics
3. Data and Methods
3.1. Data
3.2. Methods
4. Results
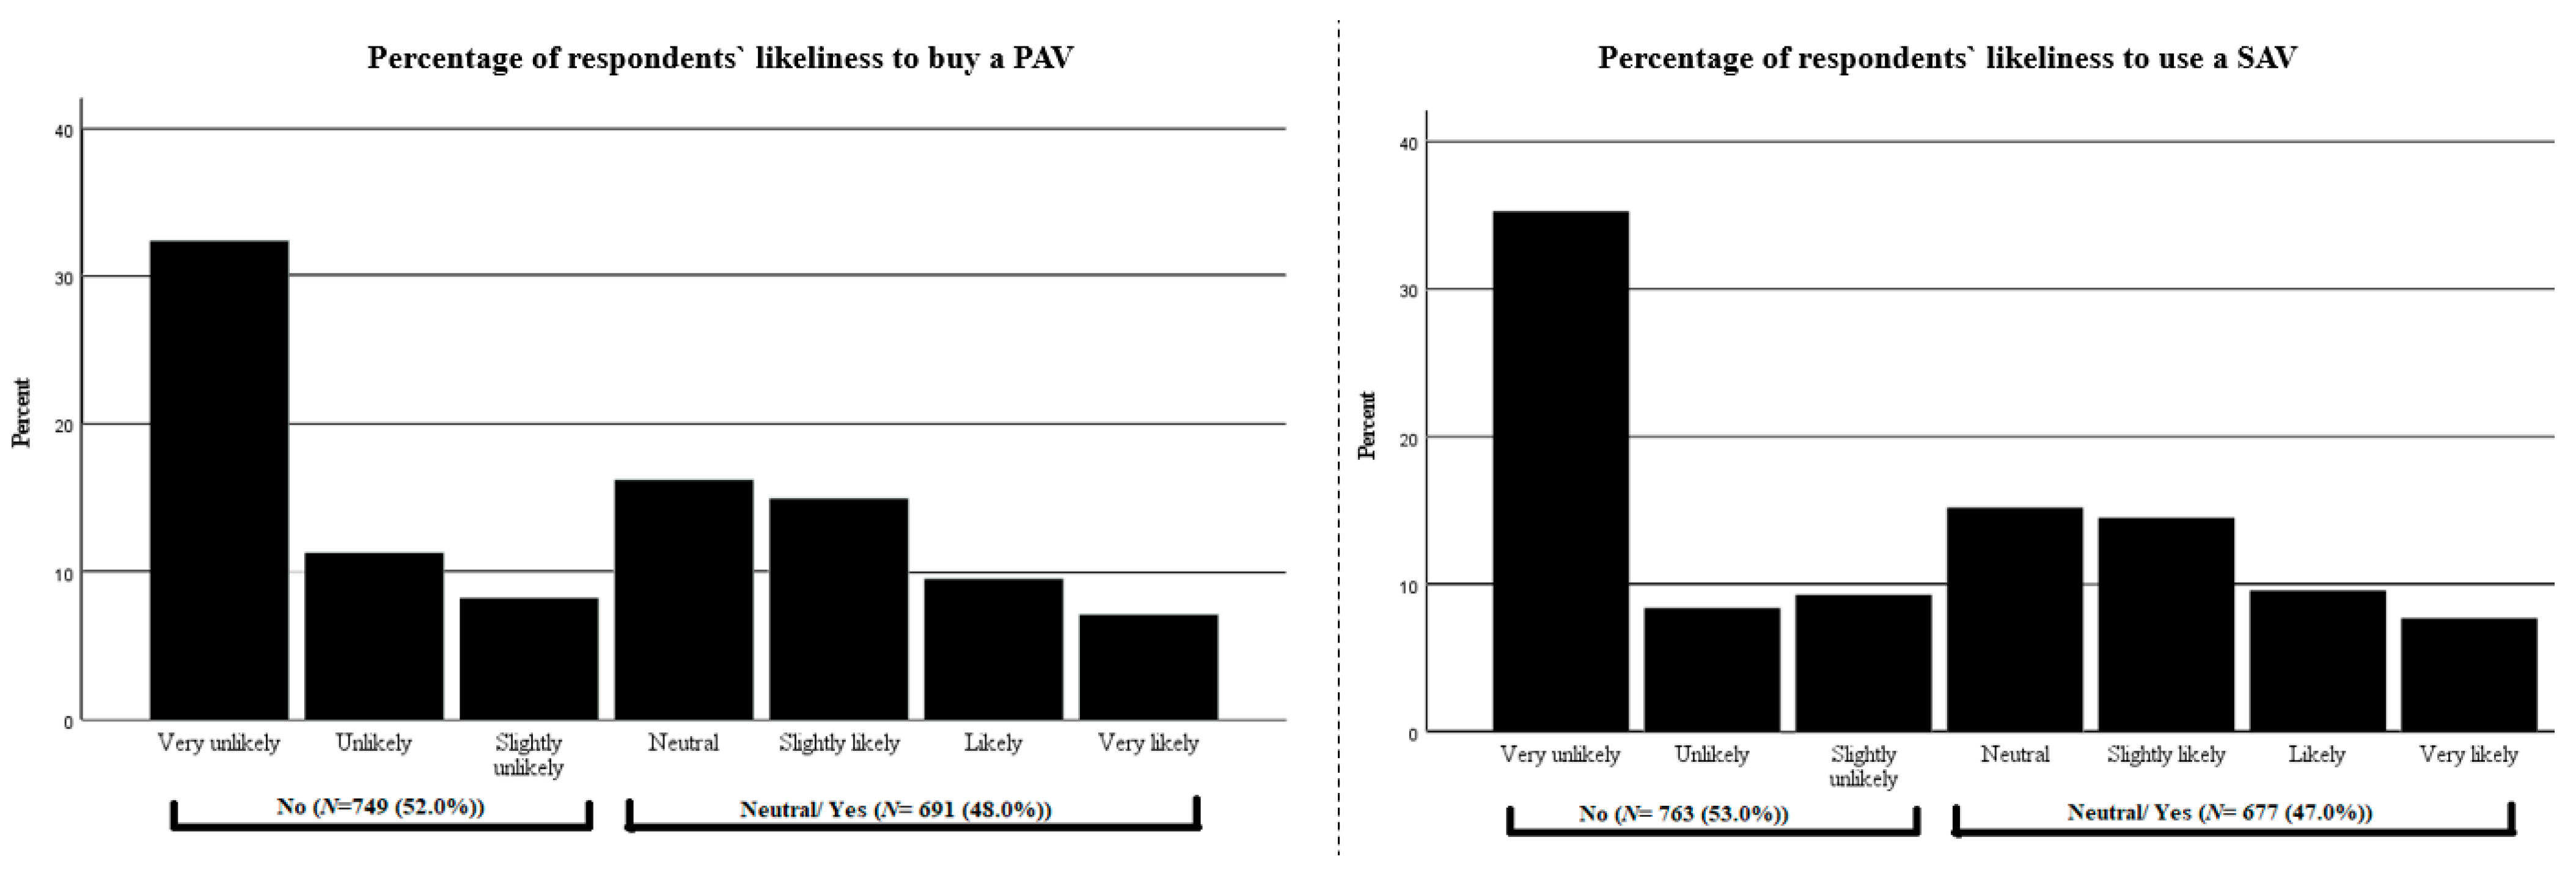
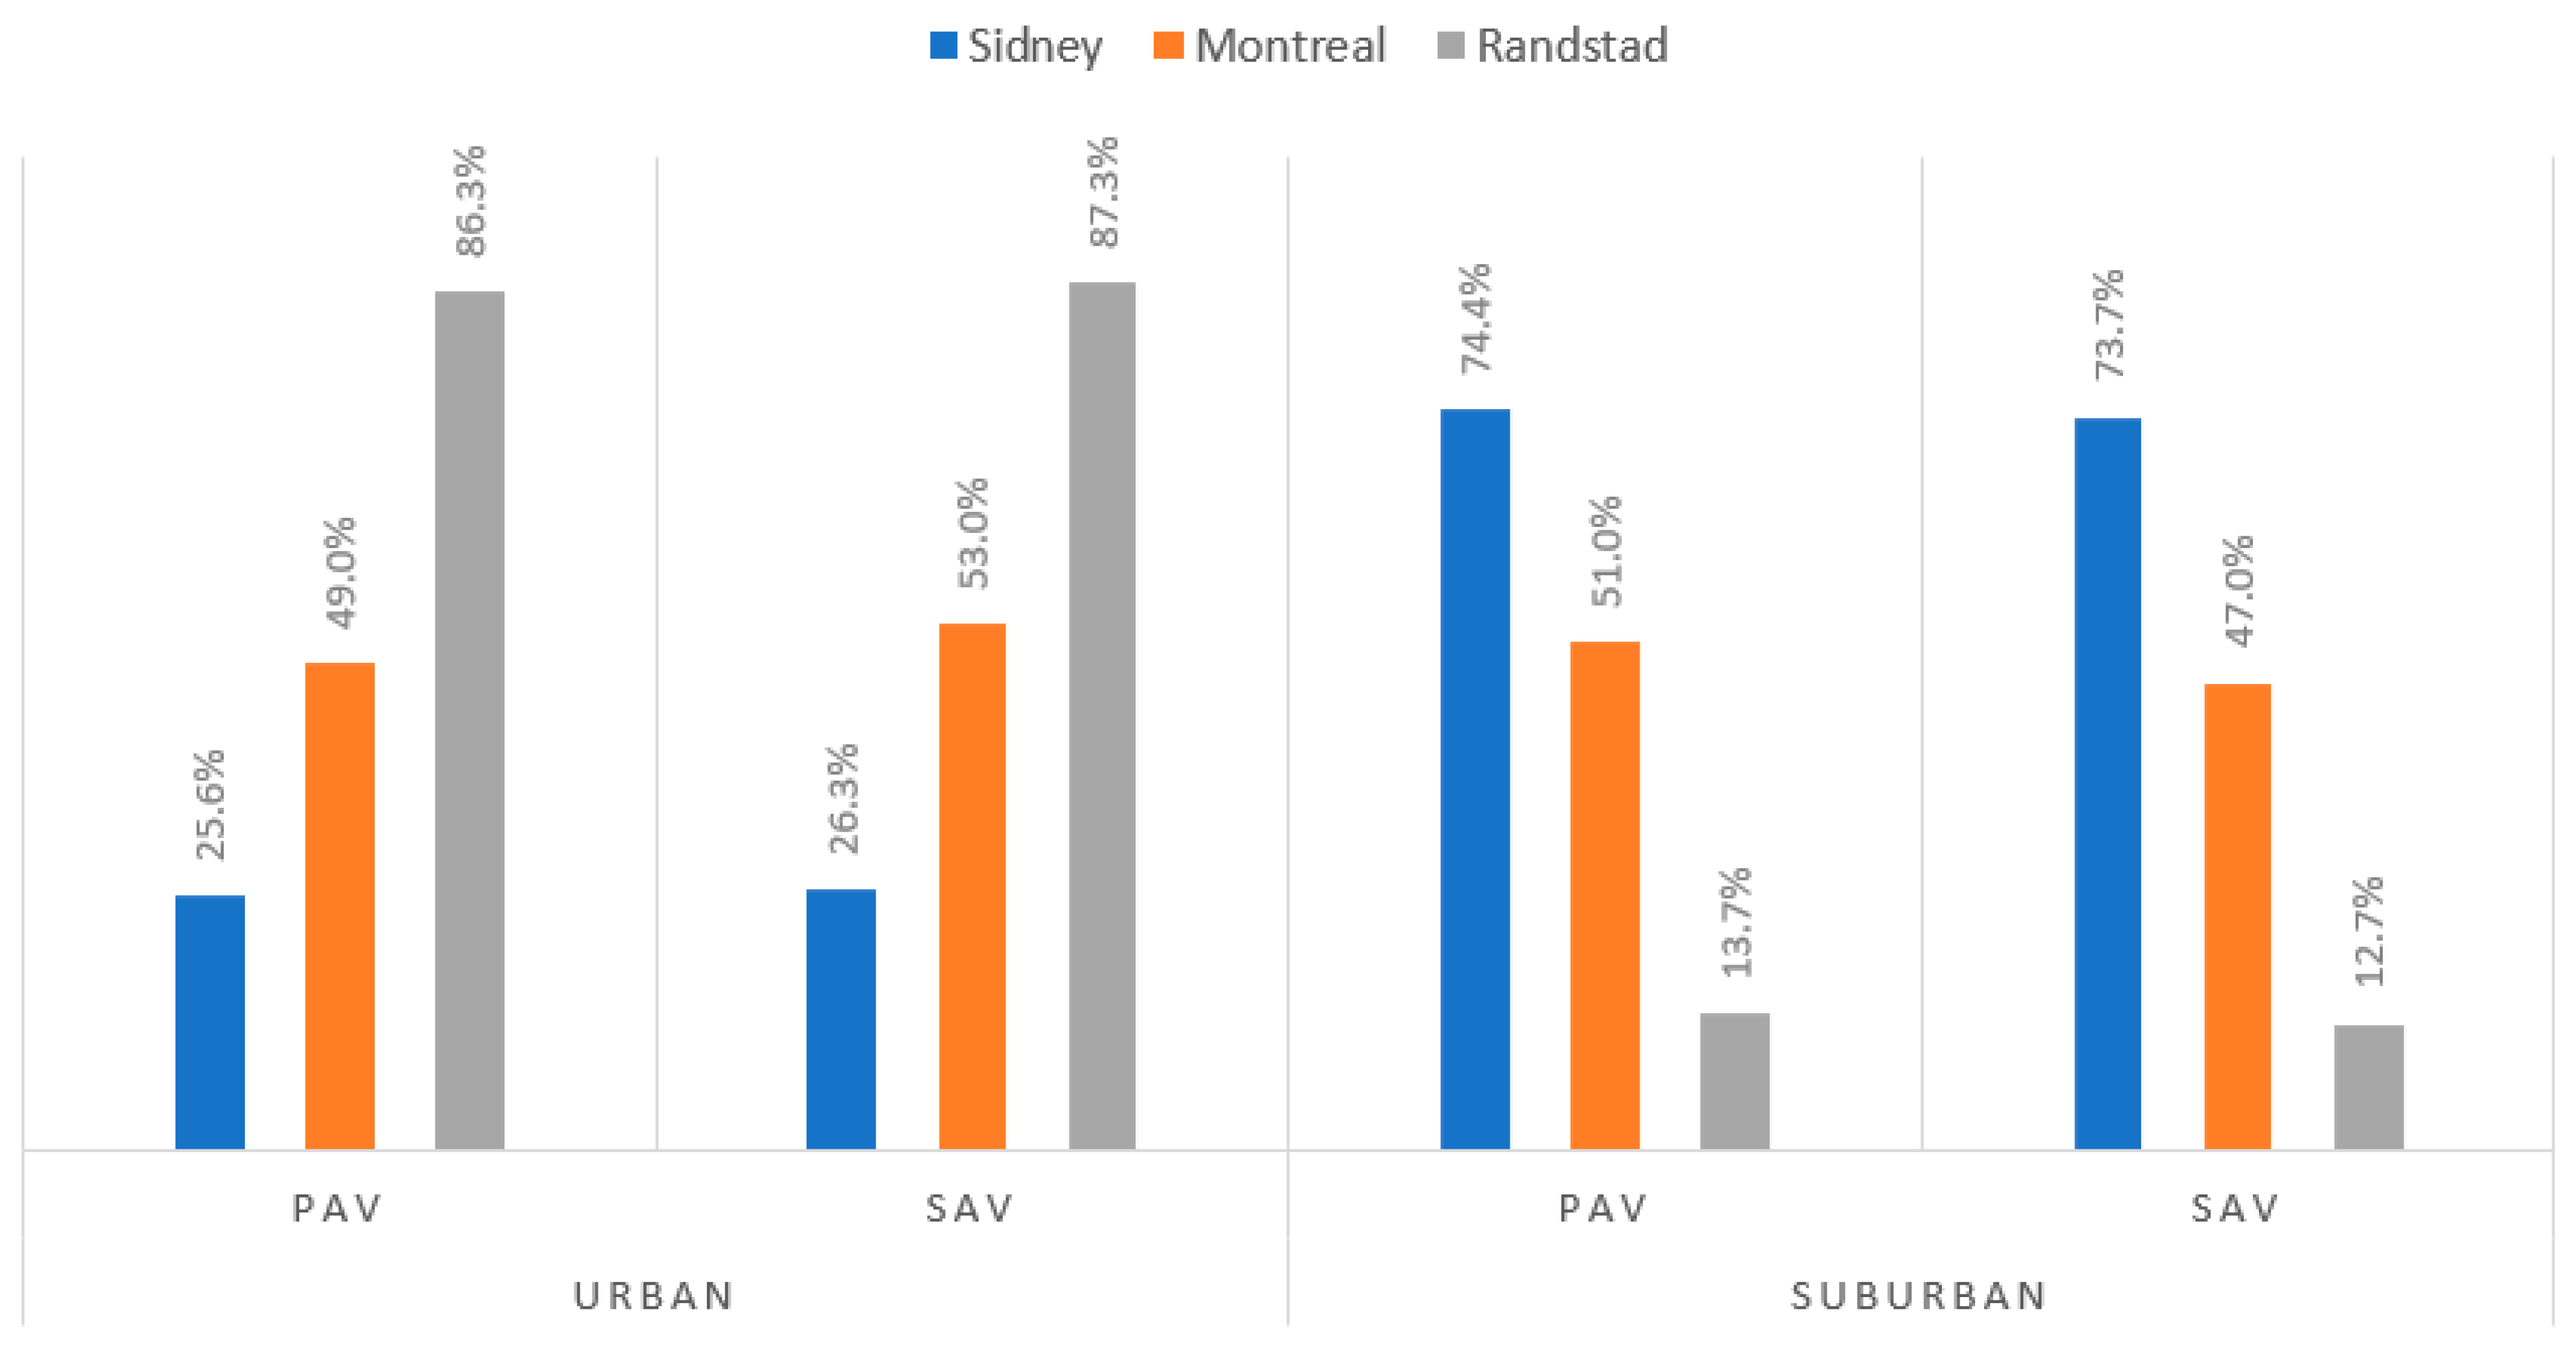
4.1. Descriptive Results
4.2. Model Results
4.2.1. PAV
4.2.2. SAV
5. Discussion and Conclusions
5.1. Personal Characteristics
5.2. Regional Differences
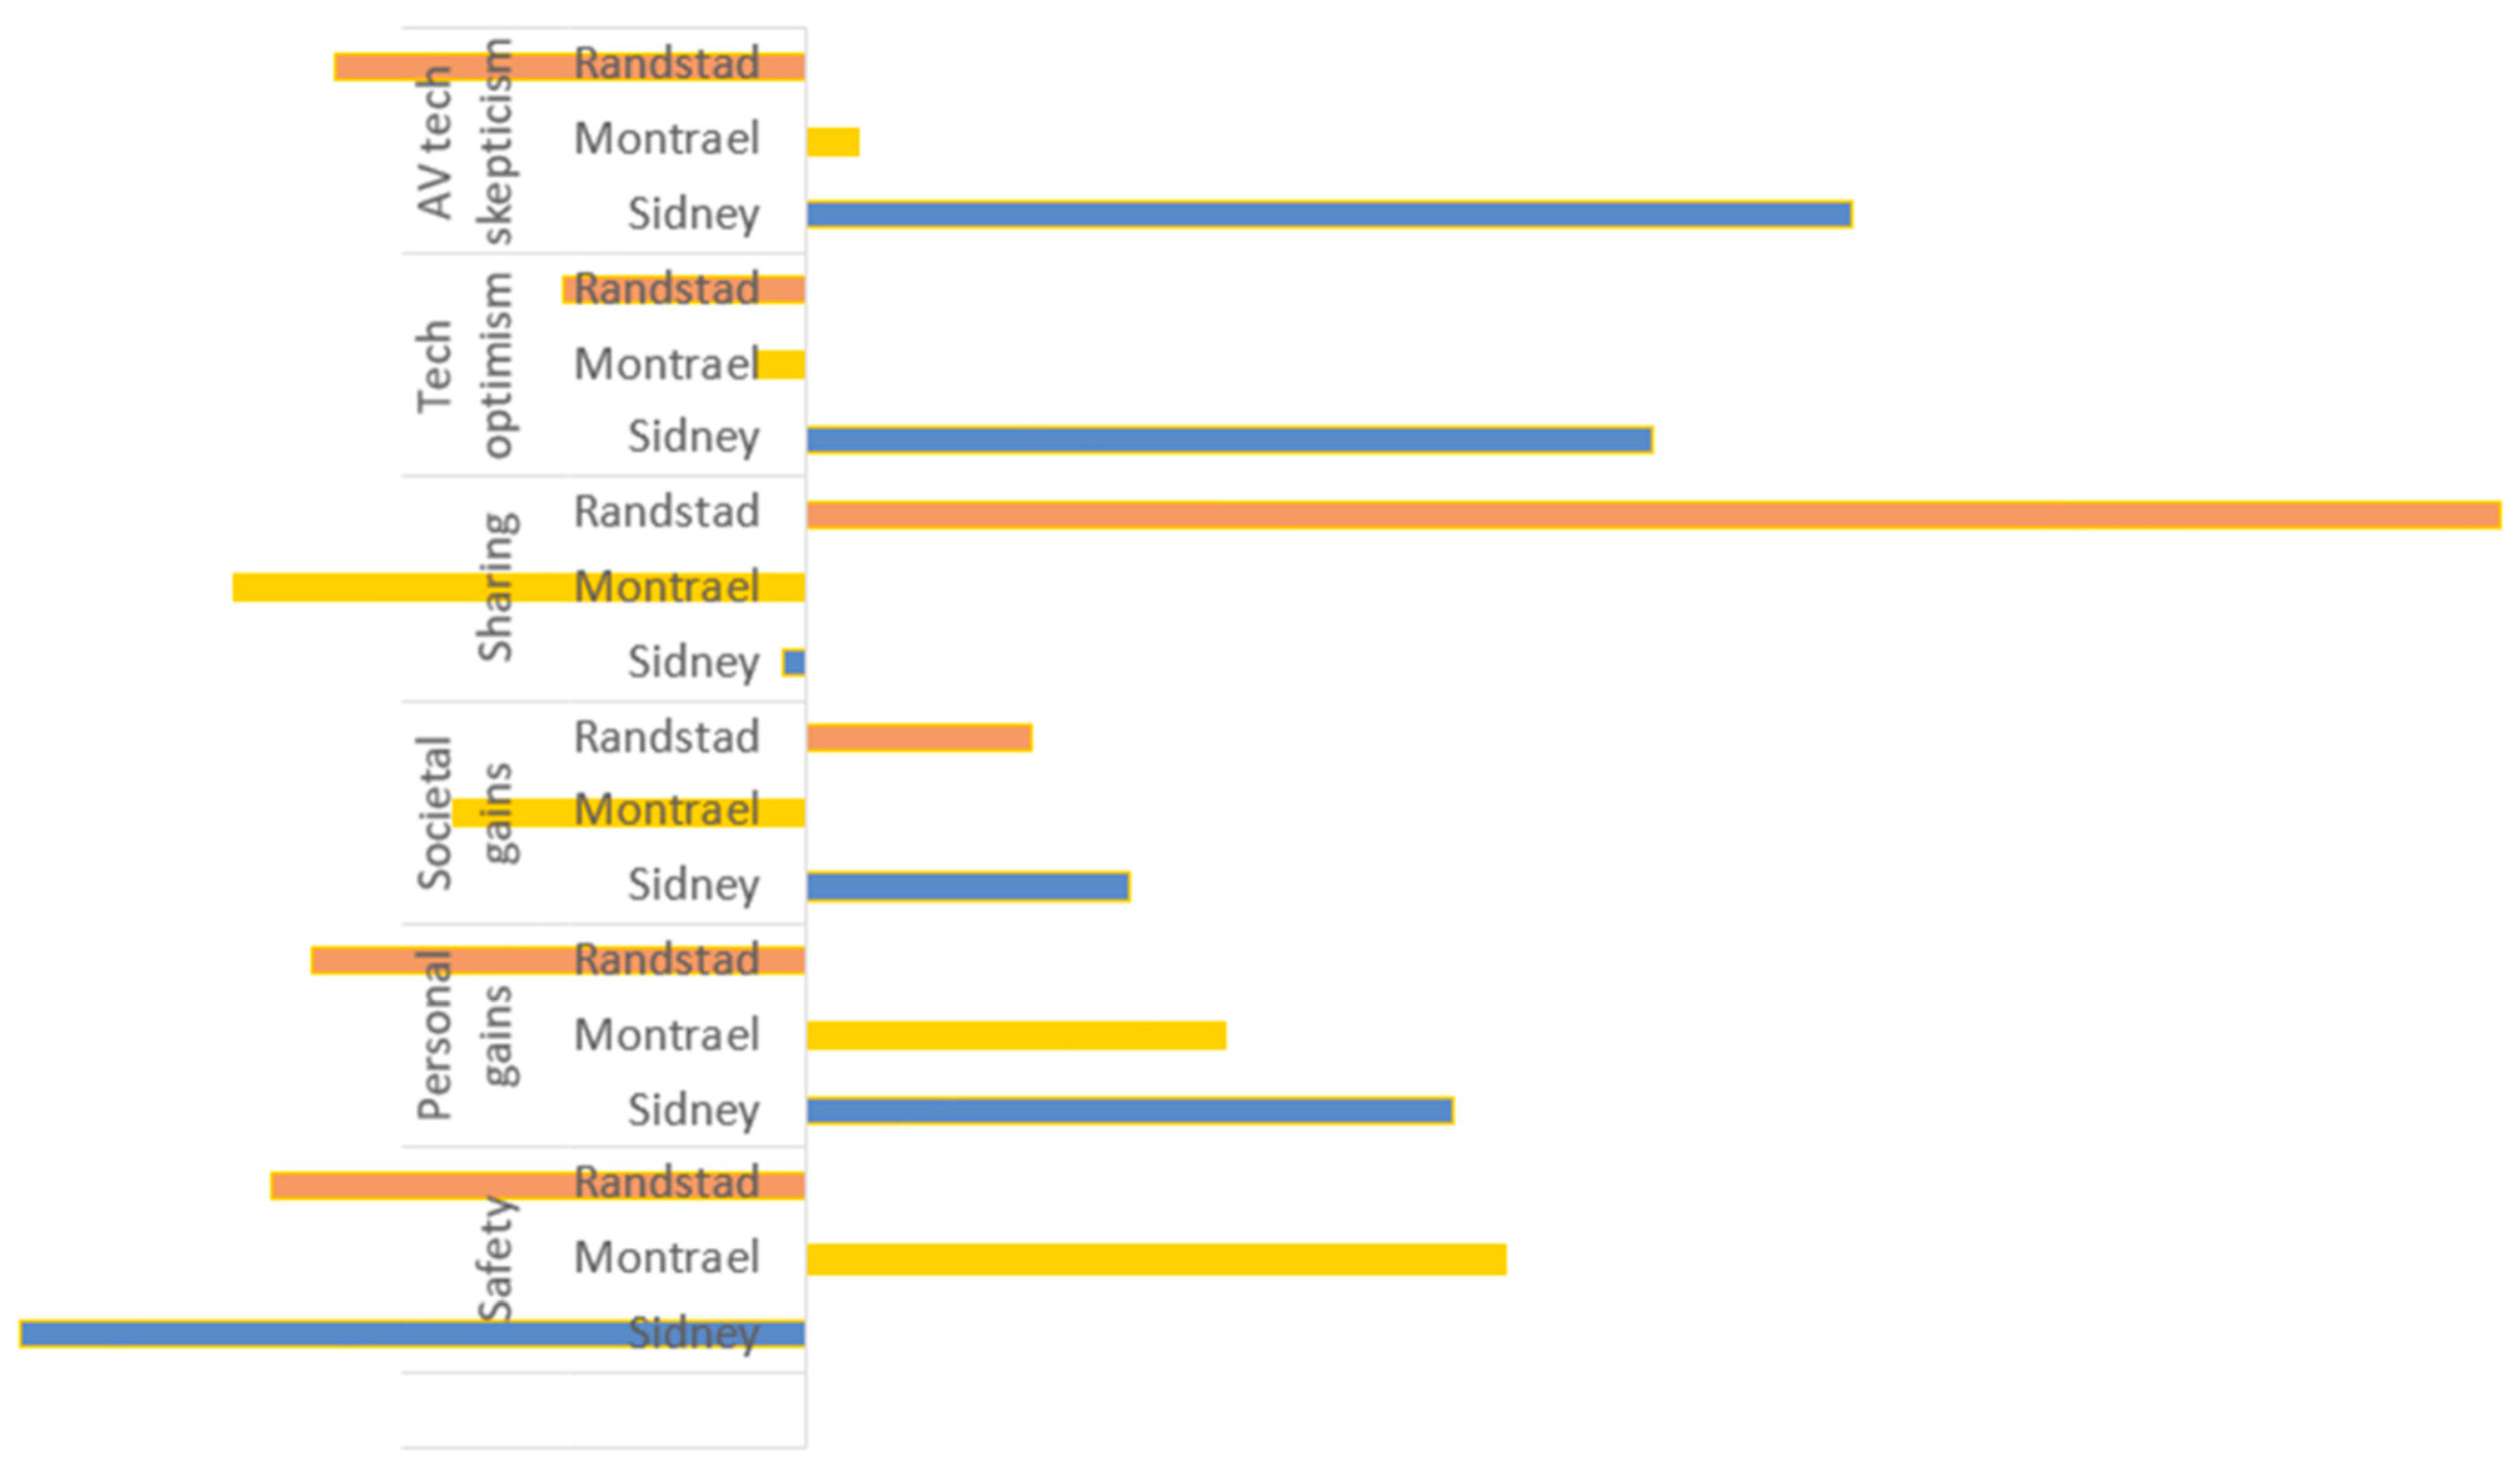
5.3. Personal Attitudes
6. Future Research Directions and Policy Implications
Author Contributions
Funding
Institutional Review Board Statement
Informed Consent Statement
Data Availability Statement
Conflicts of Interest
References
- Ross, P.E. Ford: Robotaxis in 2021, Self-Driving Cars for Consumer 2025—IEEE Spectrum. Available online: https://spectrum.ieee.org/ford-robotaxis-in-2021-selfdriving-cars-for-consumer-2025 (accessed on 2 July 2023).
- Autoredactie. Wereldprimeur Voor Zelfrijdende Taxi’s in San Francisco: ‘Dit Voelt zo Raar’. Algemeen Dagblad. 2022. Available online: https://www.ad.nl/auto/wereldprimeur-voor-zelfrijdende-taxi-s-in-san-francisco-dit-voelt-zo-raar~adb88610/?referrer=https%3A%2F%2Fwww.google.com%2F#:~:text=In%20San%20Francisco%20is%20het,wel%20geconfronteerd%20met%20een%20wachtlijst (accessed on 2 July 2023).
- Milakis, D.; Müller, S.C. The societal dimension of the automated vehicles transition: Towards a research agenda. Cities 2021, 113, 103144. [Google Scholar] [CrossRef]
- Harb, M.; Xiao, Y.; Circella, G.; Mokhtarian, P.L.; Walker, J.L. Projecting Travelers into a World of Self-Driving Vehicles: Estimating Travel Behavior Implications via a Naturalistic Experiment. Transportation 2018, 45, 1671–1685. [Google Scholar] [CrossRef]
- Calthorpe, P.; Walters, J. Autonomous Vehicles: Hype and Potential. Urban Land 2017. Available online: https://urbanland.uli.org/industry-sectors/infrastructure-transit/autonomous-vehicles-hype-potential/ (accessed on 20 May 2023).
- Mohammadzadeh, M. Sharing or Owning Autonomous Vehicles? Comprehending the Role of Ideology in the Adoption of Autonomous Vehicles in the Society of Automobility. Transp. Res. Interdiscip. Perspect. 2021, 9, 100294. [Google Scholar] [CrossRef]
- National Highway Traffic Safety Administration (NHTSA) (2013). Preliminary Statement of Policy Concerning Automated Vehicles. Available online: http://www.nhtsa.gov/staticfiles/rulemaking/pdf/Automated_Vehicles_Policy.pdf (accessed on 20 May 2023).
- Taxonomy and Definitions for Terms Related to Driving Automation Systems for On-Road Motor Vehicles—SAE International. Available online: https://www.sae.org/standards/content/j3016_202104/ (accessed on 2 July 2023).
- Childress, S.; Nichols, B.; Charlton, B.; Coe, S. Using an Activity-Based Model to Explore the Potential Impacts of Automated Vehicles. Transp. Res. Rec. 2015, 2493, 99–106. [Google Scholar] [CrossRef]
- Hörl, S.; Ciari, F.; Axhausen, K.W. Recent Perspectives on the Impact of Autonomous; Arbeitsberichte Verkehrs-und Raumplanung 1216; Institute for Transport Planning and Systems (IVT), ETH Zurich: Zürich, Switzerland, 2016. [Google Scholar]
- Brown, A. Automated Vehicles Have a Wide Range of Possible Energy Impacts. In Proceedings of the TRB 2nd Annual Workshop on Road Vehicle Automation, Stanford, CA, USA, 16 July 2013; Volume 16. [Google Scholar]
- Begg, D. A 2050 Vision for London: What Are the Implications of Driverless Transport? Transport Times: London, UK, 2014. [Google Scholar]
- Kolekar, S.; de Winter, J.; Abbink, D. Human-like Driving Behaviour Emerges from a Risk-Based Driver Model. Nat. Commun. 2020, 11, 4850. [Google Scholar] [CrossRef] [PubMed]
- Fagnant, D.J.; Kockelman, K. Preparing a Nation for Autonomous Vehicles: Opportunities, Barriers and Policy Recommendations. Transp. Res. Part Policy Pract. 2015, 77, 167–181. [Google Scholar] [CrossRef]
- Faber, K.; van Lierop, D. How Will Older Adults Use Automated Vehicles? Assessing the Role of AVs in Overcoming Perceived Mobility Barriers. Transp. Res. Part Policy Pract. 2020, 133, 353–363. [Google Scholar] [CrossRef]
- Singleton, P.A. Discussing the “Positive Utilities” of Autonomous Vehicles: Will Travellers Really Use Their Time Productively? Transp. Rev. 2018, 39, 50–65. [Google Scholar] [CrossRef]
- Pudāne, B.; Molin, E.J.E.; Arentze, T.A.; Maknoon, Y.; Chorus, C.G. A Time-Use Model for the Automated Vehicle-Era. Transp. Res. Part C Emerg. Technol. 2018, 93, 102–114. [Google Scholar] [CrossRef]
- Lavieri, P.S.; Garikapati, V.M.; Bhat, C.R.; Pendyala, R.M.; Astroza, S.; Dias, F.F. Modeling Individual Preferences for Ownership and Sharing of Autonomous Vehicle Technologies. Transp. Res. Rec. 2017, 2665, 1–10. [Google Scholar] [CrossRef]
- Harb, M.; Stathopoulos, A.; Shiftan, Y.; Walker, J.L. What Do We (Not) Know about Our Future with Automated Vehicles? Transp. Res. Part C Emerg. Technol. 2021, 123, 102948. [Google Scholar] [CrossRef]
- Becker, F.; Axhausen, K.W. Literature Review on Surveys Investigating the Acceptance of Automated Vehicles. Transportation 2017, 44, 1293–1306. [Google Scholar] [CrossRef]
- Nordhoff, S.; van Arem, B.; Happee, R. Conceptual Model to Explain, Predict, and Improve User Acceptance of Driverless Podlike Vehicles. Transp. Res. Rec. J. Transp. Res. Board 2016, 2602, 60–67. [Google Scholar] [CrossRef]
- Nordhoff, S.; De Winter, J.; Kyriakidis, M.; Van Arem, B.; Happee, R. Acceptance of Driverless Vehicles: Results from a Large Cross-National Questionnaire Study. J. Adv. Transp. 2018, 2018, 5382192. [Google Scholar] [CrossRef]
- Clewlow, R.; Mishra, G. Disruptive Transportation: The Adoption, Utilization, and Impact of Ride-Hailing in the United States; Institute of Transportation Studies, Univ. of California: Davis, CA, USA, 2017. [Google Scholar]
- Shaheen, S.; Bell, C.; Cohen, A.; Yelchuru, B. Shared Mobility Primer|2 Quality Assurance Statement; U.S. Department of Transportation, Federal Highway Administration: Washington, DC, USA, 2017.
- Davis, F.D. Perceived Usefulness, Perceived Ease of Use, and User Acceptance of Information Technology. MIS Q. 1989, 13, 319. [Google Scholar] [CrossRef]
- Eby, D.W.; Molnar, L.J.; Zhang, L.; St Louis, R.M.; Zanier, N.; Kostyniuk, L.P.; Stanciu, S. Use, Perceptions, and Benefits of Automotive Technologies among Aging Drivers. Inj. Epidemiol. 2016, 3, 28. [Google Scholar] [CrossRef]
- Schrauth, B.; Funk, W.; Maier, S.; Kraetsch, C. The Acceptance of Conditionally Automated Cars from the Perspective of Different Road User Groups. Eur. J. Transp. Infrastruct. Res. 2021, 21, 81–103. [Google Scholar]
- Seebauer, S.; Stolz, R.; Berger, M. Technophilia as a Driver for Using Advanced Traveler Information Systems. Transp. Res. Part C Emerg. Technol. 2015, 60, 498–510. [Google Scholar] [CrossRef]
- Dykstra, P.A.; Fokkema, T. Norms of Filial Obligation in the Netherlands. Population 2012, 67, 97–122. [Google Scholar] [CrossRef]
- Gerlach, A.J.; Teachman, G.; Laliberte-Rudman, D.; Aldrich, R.M.; Huot, S. Expanding beyond Individualism: Engaging Critical Perspectives on Occupation. Scand. J. Occup. Ther. 2018, 25, 35–43. [Google Scholar] [CrossRef]
- Noordin, F.; Jusoff, K. Individualism-Collectivism and Job Satisfaction between Malaysia and Australia. Int. J. Educ. Manag. 2010, 24, 159–174. [Google Scholar] [CrossRef]
- Hofstede, G.; Hofstede, G.J.; Minkov, M. Cultures and Organizations: Software of the Mind; Mcgraw-Hill: New York, NY, USA, 2005; Volume 2. [Google Scholar]
- Bassett, D.R.; Pucher, J.; Buehler, R.; Thompson, D.L.; Crouter, S.E. Walking, Cycling, and Obesity Rates in Europe, North America, and Australia. J. Phys. Act. Health 2008, 5, 795–814. [Google Scholar] [CrossRef] [PubMed]
- Centraal Bureau Voor de Statistiek. Degree of Urbanisation. 2022. Available online: https://www.cbs.nl/en-gb/onze-diensten/methods/definitions/degree-of-urbanisation (accessed on 1 December 2022).
- Gagliardi, G.J.; Lovell, D.; Peterson, P.D.; Jemelka, R. Forecasting recidivism in mentally ill offenders released from prison. Law Hum. Behav. 2004, 28, 133–155. [Google Scholar] [CrossRef]
- Gomez, R.; Stavropoulos, V.; Beard, C.; Pontes, H.M. Item response theory analysis of the recoded internet gaming disorder scale-short-form (IGDS9-SF). Int. J. Ment. Health Addict. 2019, 17, 859–879. [Google Scholar] [CrossRef]
- Pontes, P.E.; Griffiths, M.D. Measuring DSM-5 internet gaming disorder: Development and validation of a short psychometric scale. Comput. Hum. Behav. 2015, 45, 137–143. [Google Scholar] [CrossRef]
- Nusbaum, M.R.; Gamble, G.; Skinner, B.; Heiman, J. The high prevalence of sexual concerns among women seeking routine gynecological care. J. Fam. Pract. 2000, 49, 229. [Google Scholar]
- Minkov, M.; Dutt, P.; Schachner, M.; Morales, O.; Sanchez, C.; Jandosova, J.; Khassenbekov, Y.; Mudd, B. A Revision of Hofstede’s Individualism-Collectivism Dimension: A New National Index from a 56-Country Study. Cross Cult. Strateg. Manag. 2017, 24, 386–404. [Google Scholar] [CrossRef]
- Wang, Y.; So, K.K.F.; Sparks, B.A. Technology Readiness and Customer Satisfaction with Travel Technologies: A Cross-Country Investigation. J. Travel Res. 2016, 56, 563–577. [Google Scholar] [CrossRef]
- Schaller, B. Unsustainable? The Growth of App-Based Ride Services and Traffic, Travel and the Future of New York City. Schaller Consult. 2017, 27. Available online: http://www.schallerconsult.com/rideservices/unsustainable.htm (accessed on 20 May 2023).
- Wen, J.; Chen, Y.X.; Nassir, N.; Zhao, J. Transit-Oriented Autonomous Vehicle Operation with Integrated Demand-Supply Interaction. Transp. Res. Part C Emerg. Technol. 2018, 97, 216–234. [Google Scholar] [CrossRef]
- Zhang, W.; Guhathakurta, S. Residential Location Choice in the Era of Shared Autonomous Vehicles. J. Plan. Educ. Res. 2018, 41, 135–148. [Google Scholar] [CrossRef]
- Kamargianni, M.; Li, W.; Matyas, M.; Schäfer, A. A Critical Review of New Mobility Services for Urban Transport. Transp. Res. Procedia 2016, 14, 3294–3303. [Google Scholar] [CrossRef]


| Sydney (N = 277) | Montréal (N = 808) | Randstad (N = 355) | Total (N = 1440) | |||||
|---|---|---|---|---|---|---|---|---|
| Variables | Definitions | N (%) | Exp. N (%) | N (%) | Exp. N (%) | N (%) | Exp. N (%) | N (%) |
| Gender | Male | 144 (52.0) | 137 (49.3) | 405 (50.1) | 394 (48.8) | 186 (52.4) | 175 (49.4) | 735 (51.0) |
| Female | 133 (48.0) | 140 (50.7) | 398 (49.3) | 414 (51.2) | 168 (47.3) | 180 (50.6) | 699 (48.5) | |
| Other | 0 (0.0) | 5 (0.6) | 1 (0.3) | 6 (0.5) | ||||
| Age | 19–35 years | 50 (18.1) | 94 (33.9) | 202 (25.0) | 233 (28.8) | 78 (22.0) | 103 (29.0) | 330 (22.9) |
| 36–50 years | 59 (21.3) | 75 (27.1) | 216 (26.7) | 212 (26.3) | 79 (22.3) | 87 (24.5) | 354 (24.6) | |
| 51–65 years | 76 (27.4) | 61 (22.0) | 223 (27.6) | 206 (25.5) | 107 (30.1) | 89 (25.1) | 406 (28.2) | |
| 66 years and older | 92 (33.2) | 47 (17.0) | 167 (20.7) | 157 (19.4) | 91 (25.6) | 76 (21.4) | 350 (24.3) | |
| Household Income | Low income | 93 (38.7) | 281 (38.9) | 107 (37.0) | 481 (38.4) | |||
| Middle income | 83 (34.6) | 216 (29.9) | 115 (39.8) | 414 (33.1) | ||||
| High income | 64 (26.7) | 226 (31.2) | 67 (23.2) | 357 (28.5) | ||||
| Missing values | 37 | 85 | 66 | 188 | ||||
| Household Composition | Living alone | 63 (22.7) | 193 (23.9) | 131 (36.9) | 387 (26.9) | |||
| Together with partner/spouse and Together with partner/spouse and non-dependent person(s) | 104 (37.6) | 322 (39.8) | 123 (34.6) | 549 (38.1) | ||||
| With children (18 or younger) | 53 (19.1) | 142 (17.6) | 55 (15.5) | 250 (17.4) | ||||
| With non-dependent person(s) | 57 (20.6) | 151 (18.7) | 46 (13.0) | 254 (17.6) | ||||
| Education level | Secondary | 57 (20.7) | 121 (15.1) | 101 (28.5) | 279 (19.5) | |||
| Vocational | 78 (28.2) | 333 (41.4) | 77 (21.7) | 488 (34.0) | ||||
| Bachelor’s Degree | 96 (34.8) | 239 (29.8) | 97 (27.3) | 432 (30.1) | ||||
| Graduate Degree | 45 (16.3) | 110 (13.7) | 80 (22.5) | 235 (16.4) | ||||
| Sydney (N = 277) | Montréal (N = 808) | Randstad (N = 355) | Total (N = 1440) | |||||
| Variables | Definitions | N (%) | Exp. N (%) | N (%) | Exp. N (%) | N (%) | Exp. N (%) | N (%) |
| Missing Values | 1 | 5 | 0 | 6 | ||||
| Employment status | Full time job | 92 (33.2) | 375 (46.4) | 111 (31.3) | 578 (40.1) | |||
| Part time job | 49 (17.7) | 80 (9.9) | 82 (23.1) | 211 (14.7) | ||||
| Student | 13 (4.7) | 98 (12.1) | 27 (7.6) | 138 (9.6) | ||||
| Other: Retired, Stay-at-home parent, Caregiver, Volunteer, Unemployed or Other | 123 (44.4) | 255 (31.6) | 135 (38.0) | 513 (35.6) | ||||
| Member car sharing | Yes | 12 (4.3) | 45 (5.6) | 26 (7.3) | 83 (5.8) | |||
| No | 265 (95.7) | 763 (94.4) | 329 (92.7) | 1357 (94.2) | ||||
| Valid driver’s licence | Yes | 249 (89.9) | 726 (89.9) | 286 (80.6) | 1261 (87.6) | |||
| No | 28 (10.1) | 82 (10.1) | 69 (19.4) | 179 (12.4) | ||||
| Owned cars per household | 0 | 25 (9.5) | 105 (13.3) | 86 (24.4) | 216 (15.4) | |||
| 1 | 134 (51.2) | 397 (50.2) | 218 (62.0) | 749 (53.3) | ||||
| 2+ | 103 (39.3) | 288 (36.5) | 48 (13.6) | 439 (31.3) | ||||
| Missing values | 15 | 18 | 3 | 36 | ||||
| Duration trip to work | Until 30 min | 73 (26.4) | 321 (39.7) | 132 (37.2) | 526 (36.5) | |||
| More than 30 min | 66 (23.8) | 231 (28.6) | 79 (22.2) | 376 (26.1) | ||||
| Other: Variable, Not working or Working from home | 138 (49.8) | 256 (31.7) | 144 (40.6) | 538 (37.4) | ||||
| Urbanisation degree | Extremely urbanised | 19 (6.9) | 255 (32.2) | 234 (66.9) | 508 (35.8) | |||
| Strongly urbanised | 45 (16.2) | 133 (16.8) | 70 (20.0) | 248 (17.5) | ||||
| Moderately urbanised | 55 (19.9) | 91 (11.5) | 17 (4.9) | 163 (11.5) | ||||
| Hardly urbanised | 91 (32.9) | 129 (16.3) | 18 (5.1) | 238 (16.8) | ||||
| Not urbanised | 67 (24.2) | 184 (23.2) | 11 (3.1) | 262 (18.4) | ||||
| Missing values | 0 | 16 | 5 | 21 | ||||
| Factors | Indicators | Loadings |
|---|---|---|
| Safety | Self-driving cars will make traffic safer for cyclists | 0.892 |
| Self-driving cars will make traffic safer for pedestrians | 0.890 | |
| Self-driving cars will make it safer for animals to cross roads and highways | 0.815 | |
| Self-driving cars will make motorized traffic safer | 0.785 | |
| Personal gains | If I used a self-driving car, I would enjoy the feeling of being driven more than driving myself | 0.755 |
| If I used a self-driving car, I would gain time by doing activities in the vehicle while it drove itself (such as work or reading) | 0.682 | |
| If I used a self-driving car, I would be able to travel more independently, without the assistance of others | 0.671 | |
| If I used a self-driving car, I would be less stressed than driving myself | 0.640 | |
| If I used a self-driving car, I would gain time by sending the vehicle to do errands without me (such as picking up groceries or delivering a package) | 0.620 | |
| If I used a self-driving car, I would miss the feeling of being in control while driving | −0.630 | |
| Societal gains | Self-driving cars will be available to all population groups without discrimination | 0.771 |
| Self-driving cars will lead to a healthier society, overall | 0.686 | |
| Self-driving cars will lead to less pollution | 0.591 | |
| Sharing | If I used a shared self-driving car, similarly to a taxi, I would feel safe sharing with strangers | 0.889 |
| If I used a shared self-driving car, similarly to a taxi, I would be open to sharing the vehicle with strangers | 0.882 | |
| Tech optimism | In my day-to-day experience, technology works well | 0.865 |
| In my day-to-day experience, I like to use new technology | 0.659 | |
| In my day-to-day experience, people are good drivers | 0.609 | |
| AV tech scepticism | Self-driving cars will reduce personal data privacy | 0.705 |
| If I used a self-driving car, I would be concerned that the vehicle would track my location | 0.693 | |
| Self-driving cars will require users to be tech savvy | 0.629 |
| Sydney (N = 277) | Montréal (N = 808) | Randstad (N = 355) | Total (N = 1440) | ||
|---|---|---|---|---|---|
| Variables | Definitions | n (%) | n (%) | n (%) | n (%) |
| Likeliness to buy a PAV | No | 143 (51.6) | 386 (47.8) | 220 (62.0) | 749 (52.0) |
| Neutral/Yes | 134 (48.4) | 422 (52.2) | 135 (38.0) | 691 (48.0) | |
| Likeliness to use an SAV | No | 156 (56.3) | 387 (47.9) | 220 (62.0) | 763 (53.0) |
| Neutral/Yes | 121 (43.7) | 421 (52.1) | 135 (38.0) | 677 (47.0) |
| Model 1.1 | Model 1.2 | Model 1.3 | |||||
|---|---|---|---|---|---|---|---|
| B | Std.err. | B | Std.err | B | Std.err. | OR | |
| Home region (ref = Sydney) | |||||||
| Montréal | −0.216 | 0.141 | −0.158 | 0.150 | −0.325 | 0.186 | 0.723 |
| Randstad | −0.658 *** | 0.163 | −0.569 *** | 0.175 | −0.463 * | 0.214 | 0.629 |
| Age (ref = 19–35 years) | |||||||
| 36–50 years | −0.499 *** | 0.153 | −0.177 | 0.180 | 0.838 | ||
| 51–65 years | −0.834 *** | 0.154 | −0.495 ** | 0.186 | 0.610 | ||
| 66 years and older | −1.300 *** | 0.170 | −0.917 ** | 0.211 | 0.400 | ||
| Carsharing membership (ref = No) | 0.054 | 0.233 | −0.309 | 0.284 | 0.734 | ||
| Owned cars per household (ref = 0 cars) | |||||||
| 1 car | 0.760 *** | 0.170 | 1.350 *** | 0.204 | 3.859 | ||
| 2 or more cars | 0.736 *** | 0.183 | 1.353 *** | 0.220 | 3.870 | ||
| Safety | 0.856 *** | 0.076 | 2.354 | ||||
| Personal gains | 1.109 *** | 0.080 | 3.030 | ||||
| Societal gains | 0.341 *** | 0.071 | 1.406 | ||||
| Sharing | 0.135 * | 0.068 | 1.145 | ||||
| Tech optimism | 0.405 *** | 0.072 | 1.499 | ||||
| Av tech scepticism | −0.045 | 0.071 | 0.956 | ||||
| Intercept | 0.305 * | 0.122 | 0.232 | 0.222 | −0.547 * | 0.271 | 0.579 |
| N | 1440 | 1440 | 1440 | ||||
| Nagelkerke R2 | 0.017 | 0.102 | 0.425 | ||||
| X2 (df) | 18.698 (2) *** | 111.561 (8) *** | 537.060 (14) *** | ||||
| Model 2.1 | Model 2.2 | Model 2.3 | |||||
|---|---|---|---|---|---|---|---|
| Count | Std.err. | Count | Std.err | Count | Std.err. | OR | |
| Country (ref = Sydney) | |||||||
| Montréal | 0.108 | 0.139 | 0.101 | 0.148 | 0.123 | 0.180 | 1.130 |
| Randstad | −0.353 * | 0.162 | −0.474 ** | 0.174 | −0.504 * | 0.211 | 0.604 |
| Age (ref = 19–35 years) | |||||||
| 36–50 years | −0.629 *** | 0.152 | −0.442 * | 0.176 | 0.642 | ||
| 51–65 years | −0.713 *** | 0.153 | −0.385 * | 0.183 | 0.681 | ||
| 66 years and older | −1.037 *** | 0.167 | −0.525 * | 0.205 | 0.591 | ||
| Carsharing membership (ref = No) | 1.402 *** | 0.272 | 1.322 *** | 0.315 | 3.750 | ||
| Owned cars per household (ref = 0 cars) | |||||||
| 1 car | 0.038 | 0.166 | 0.417 * | 0.194 | 1.518 | ||
| 2 or more cars | −0.192 | 0.181 | 0.253 | 0.212 | 1.287 | ||
| Safety | 0.596 *** | 0.071 | 1.815 | ||||
| Personal gains | 0.990 *** | 0.076 | 2.692 | ||||
| Societal gains | 0.336 *** | 0.070 | 1.400 | ||||
| Sharing | 0.654 *** | 0.068 | 1.924 | ||||
| Tech optimism | 0.182 ** | 0.068 | 1.199 | ||||
| Av tech scepticism | 0.075 | 0.069 | 1.078 | ||||
| Intercept | −0.024 | 0.120 | 0.541 * | 0.219 | −0.153 | 0.259 | 0.858 |
| N | 1440 | 1440 | 1440 | ||||
| Nagelkerke R2 | 0.012 | 0.088 | 0.391 | ||||
| X2 (df) | 12.992 (2) ** | 95.168 (8) *** | 486.666 (14) *** | ||||
Disclaimer/Publisher’s Note: The statements, opinions and data contained in all publications are solely those of the individual author(s) and contributor(s) and not of MDPI and/or the editor(s). MDPI and/or the editor(s) disclaim responsibility for any injury to people or property resulting from any ideas, methods, instructions or products referred to in the content. |
© 2023 by the authors. Licensee MDPI, Basel, Switzerland. This article is an open access article distributed under the terms and conditions of the Creative Commons Attribution (CC BY) license (https://creativecommons.org/licenses/by/4.0/).
Share and Cite
Dijkhuijs, T.; Israel, F.; van Lierop, D. To Share or to Own? Understanding the Willingness to Adopt Shared and Owned Electric Automated Vehicles on Three Continents. Future Transp. 2023, 3, 1108-1123. https://doi.org/10.3390/futuretransp3030061
Dijkhuijs T, Israel F, van Lierop D. To Share or to Own? Understanding the Willingness to Adopt Shared and Owned Electric Automated Vehicles on Three Continents. Future Transportation. 2023; 3(3):1108-1123. https://doi.org/10.3390/futuretransp3030061
Chicago/Turabian StyleDijkhuijs, Tim, Fabian Israel, and Dea van Lierop. 2023. "To Share or to Own? Understanding the Willingness to Adopt Shared and Owned Electric Automated Vehicles on Three Continents" Future Transportation 3, no. 3: 1108-1123. https://doi.org/10.3390/futuretransp3030061