
Dynamics of Campus Travel Behavior under the COVID-19 Pandemic


Abstract
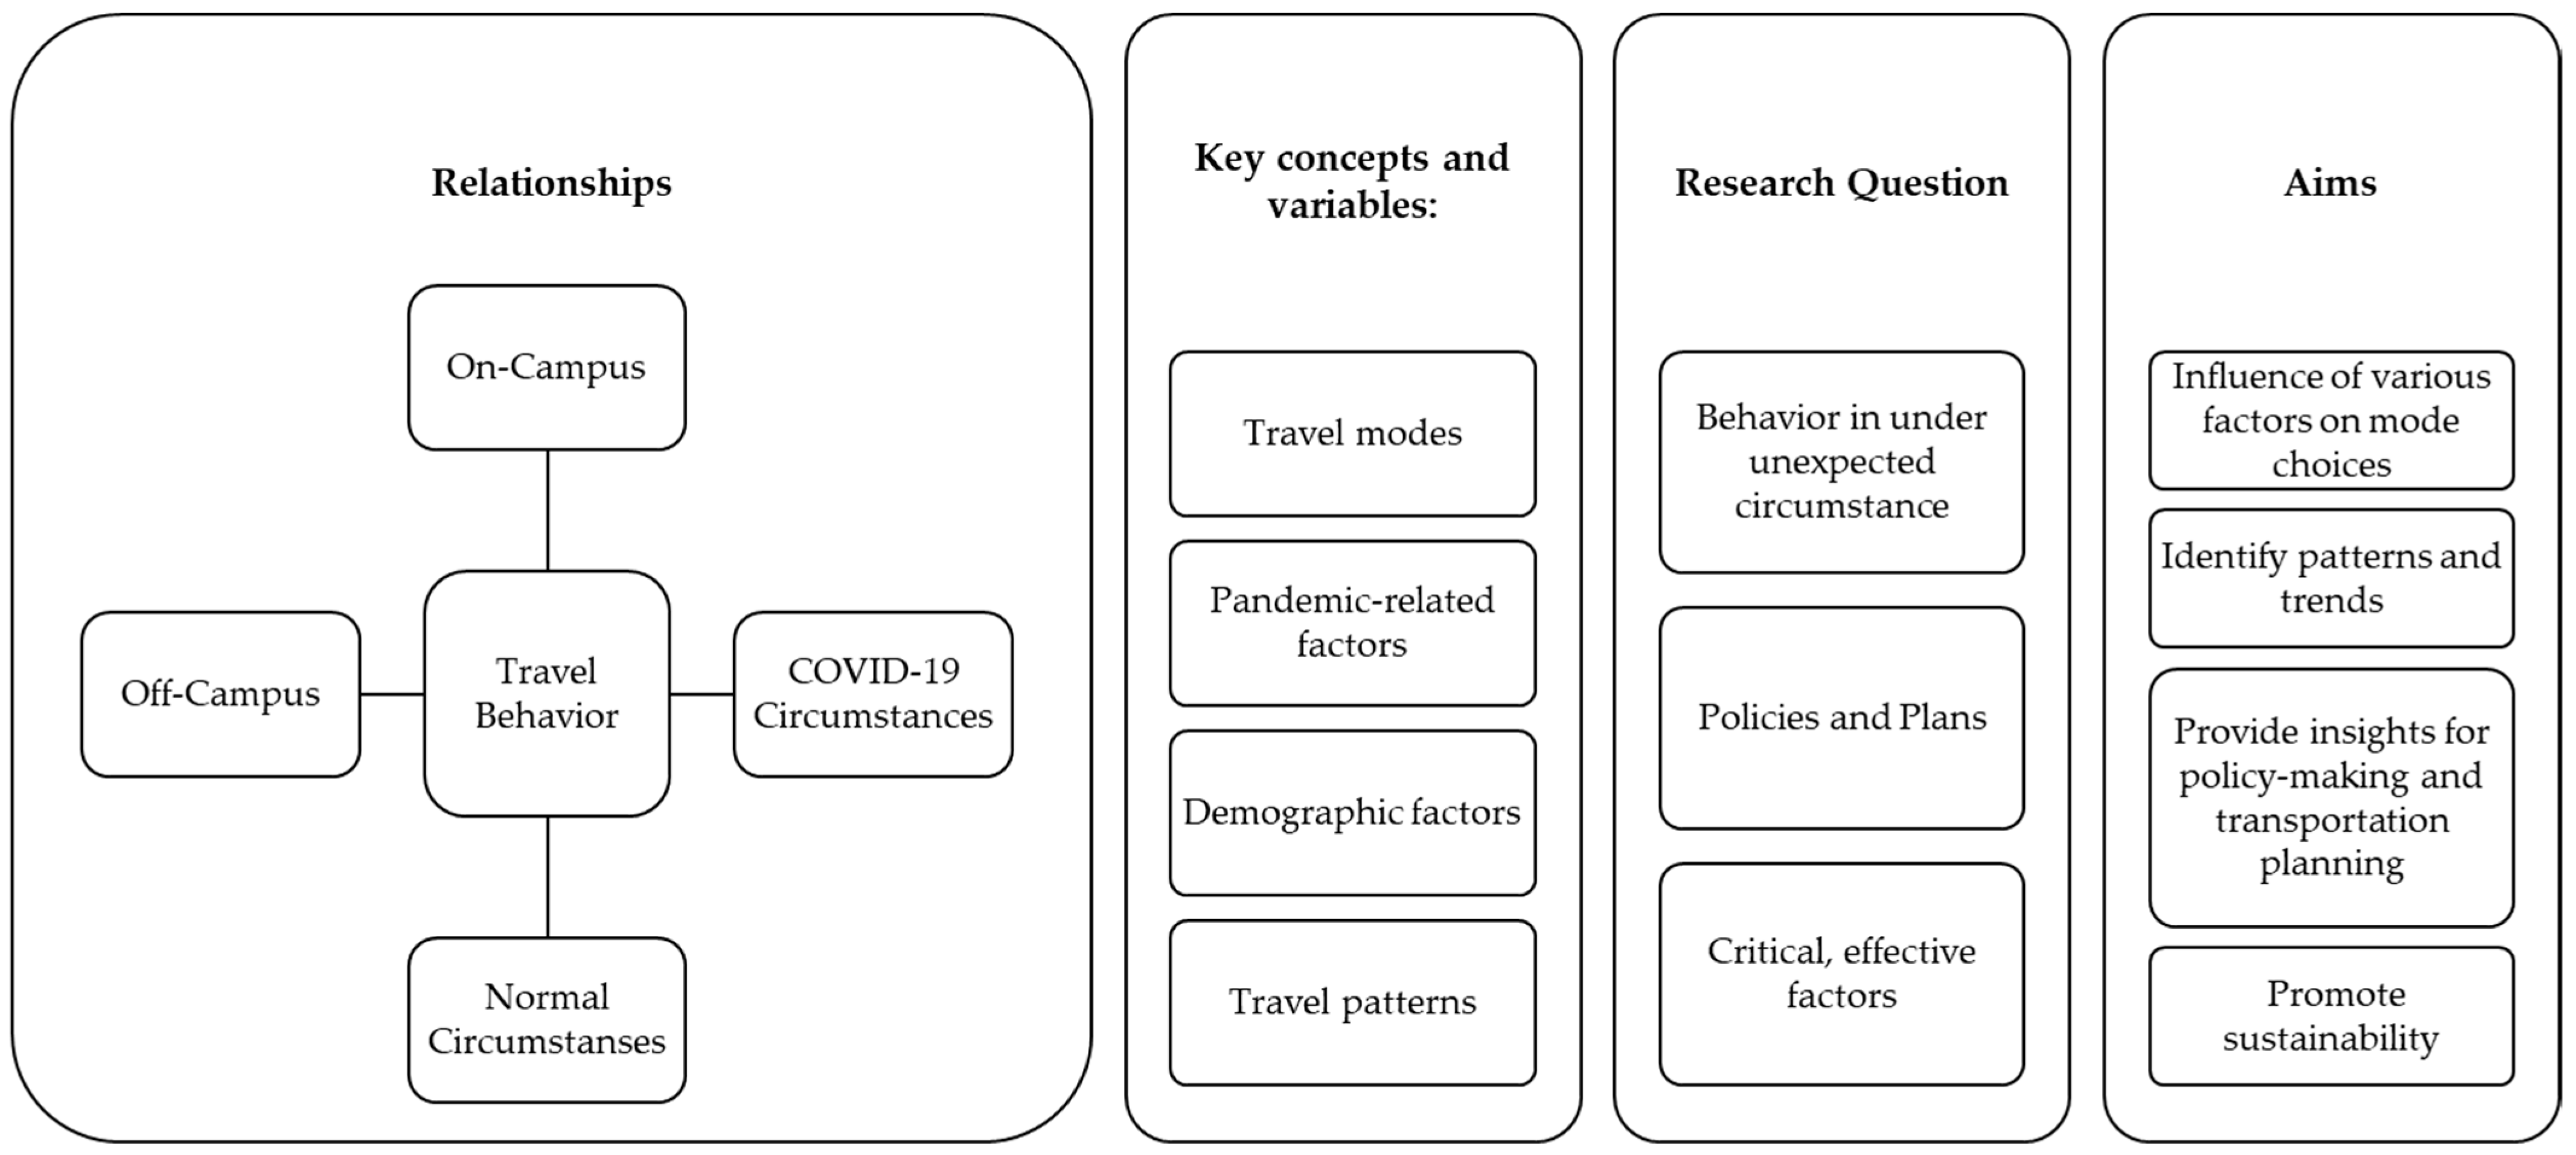
:1. Introduction
- How inter- and intra-university passengers behave in different unexpected situations;
- How we should plan and develop policies and be prepared for these conditions;
- What are the critical factors that influence travel mode choice before and during the pandemic;
- What policies are appropriate to improve transportation during critical situations.
2. Review of the Relevant Literature
3. Methodology
3.1. Questionnaire and Variable Description
3.2. Mode Choice Model
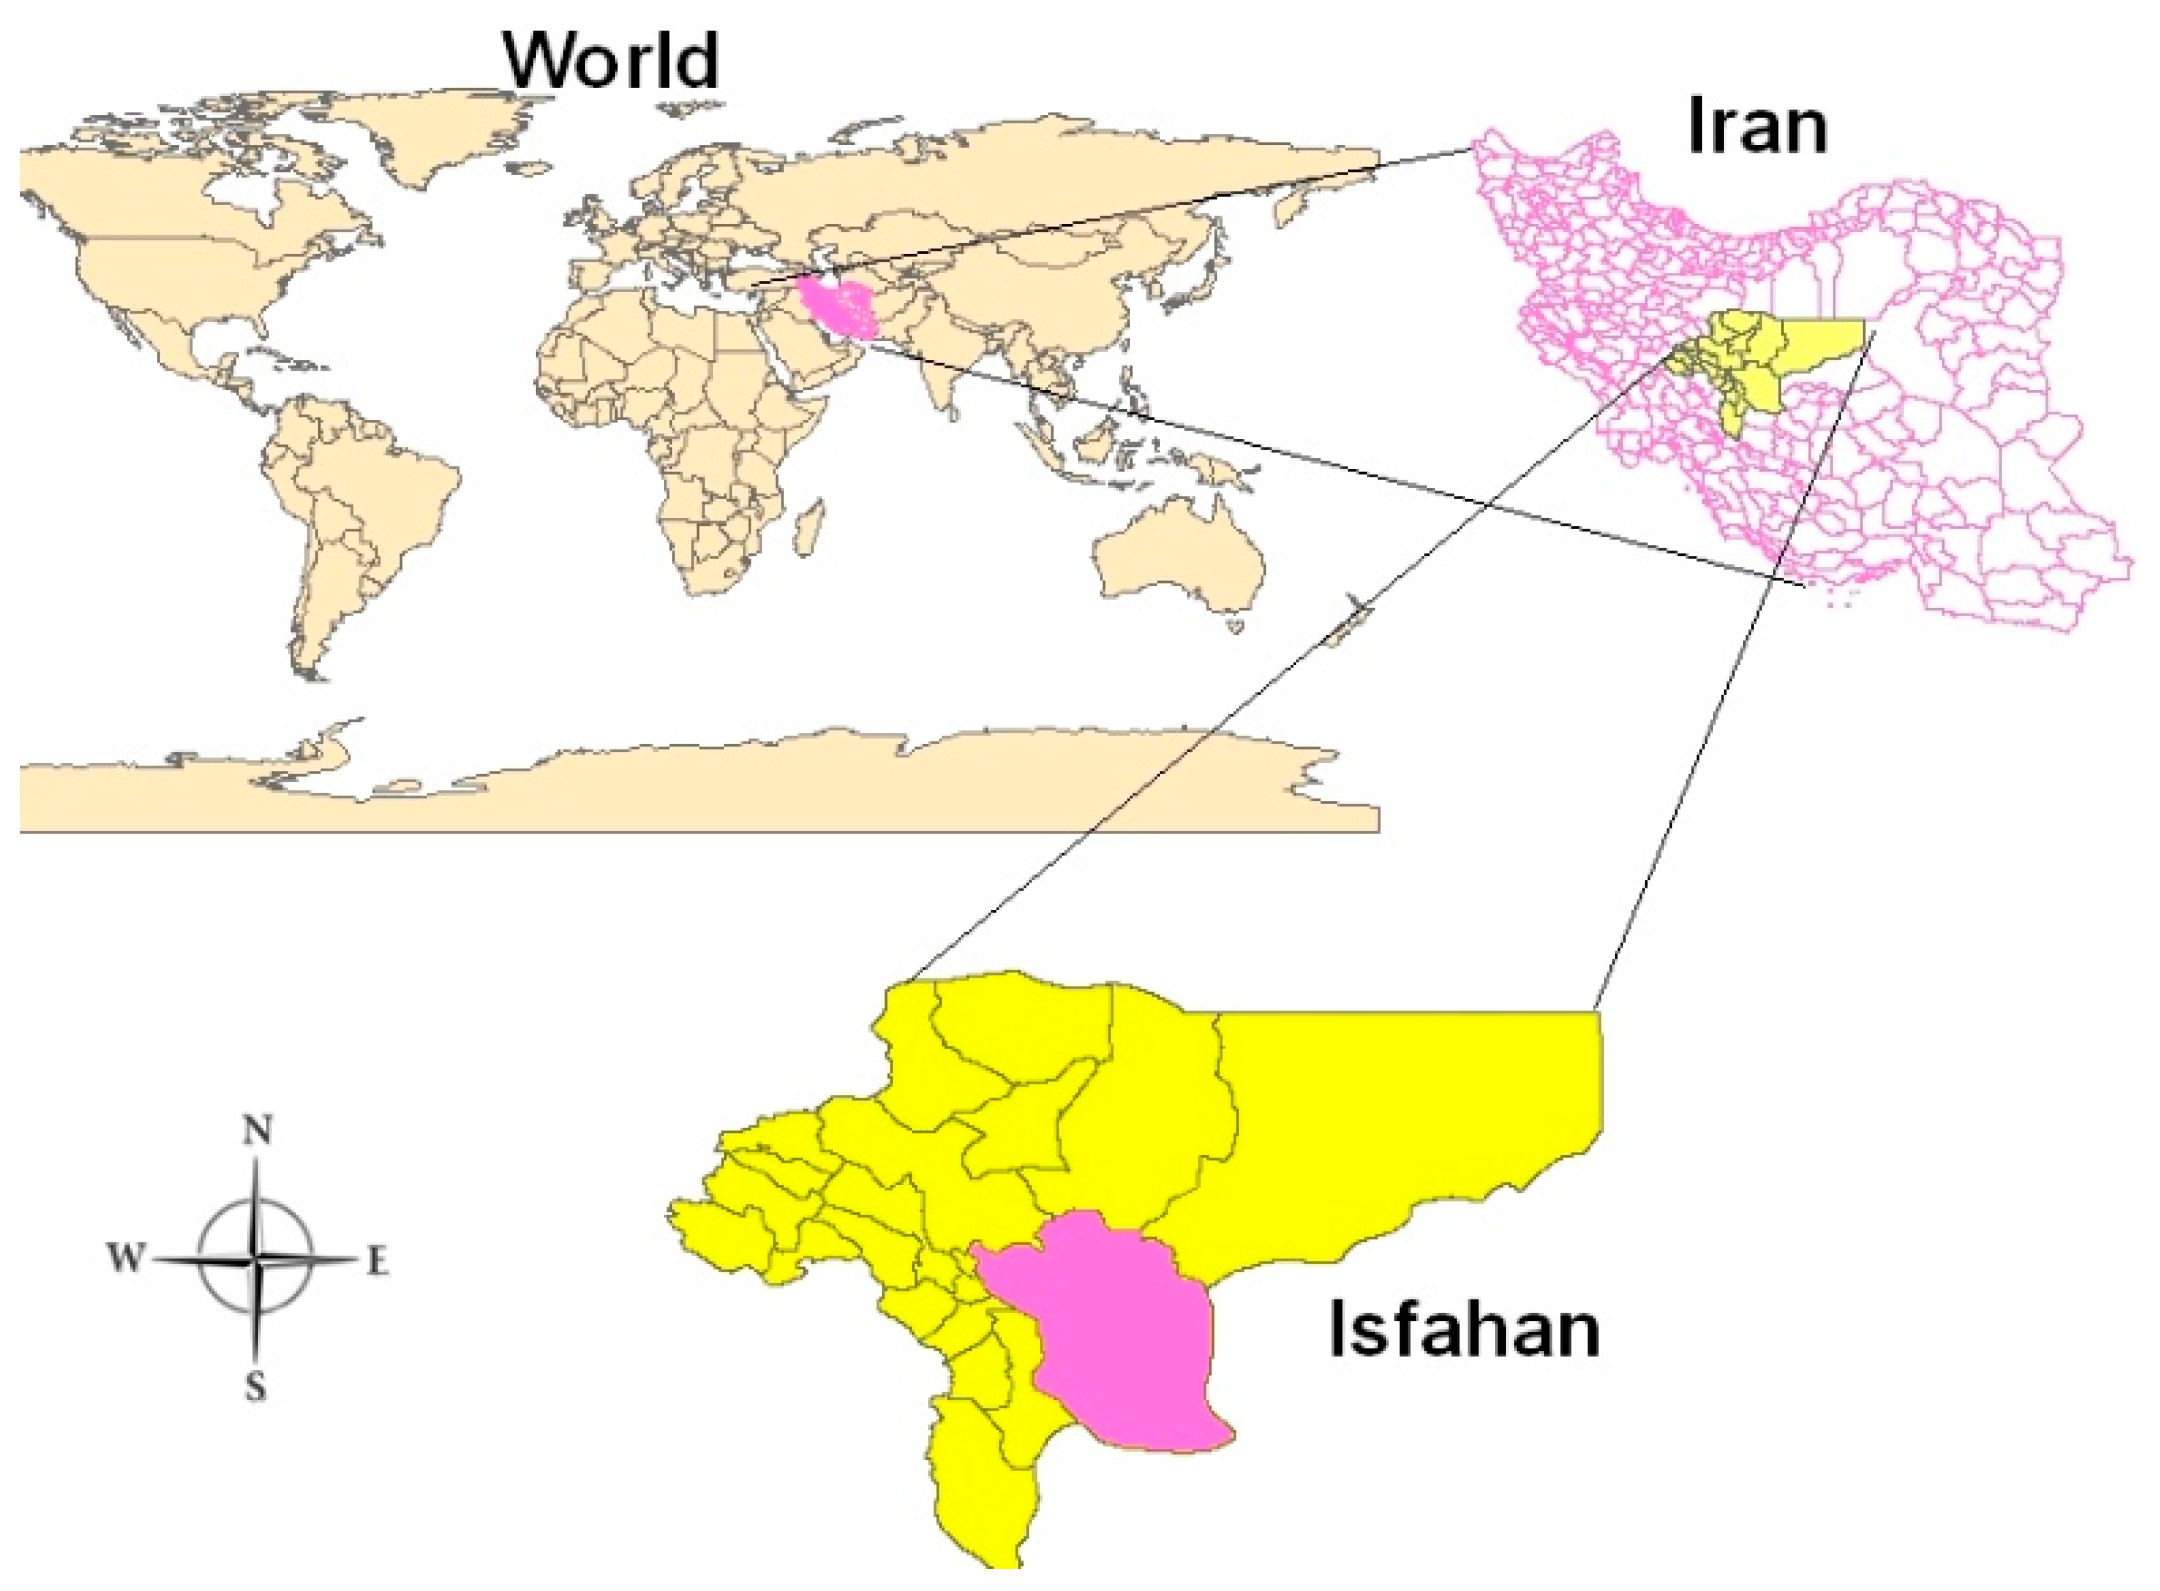
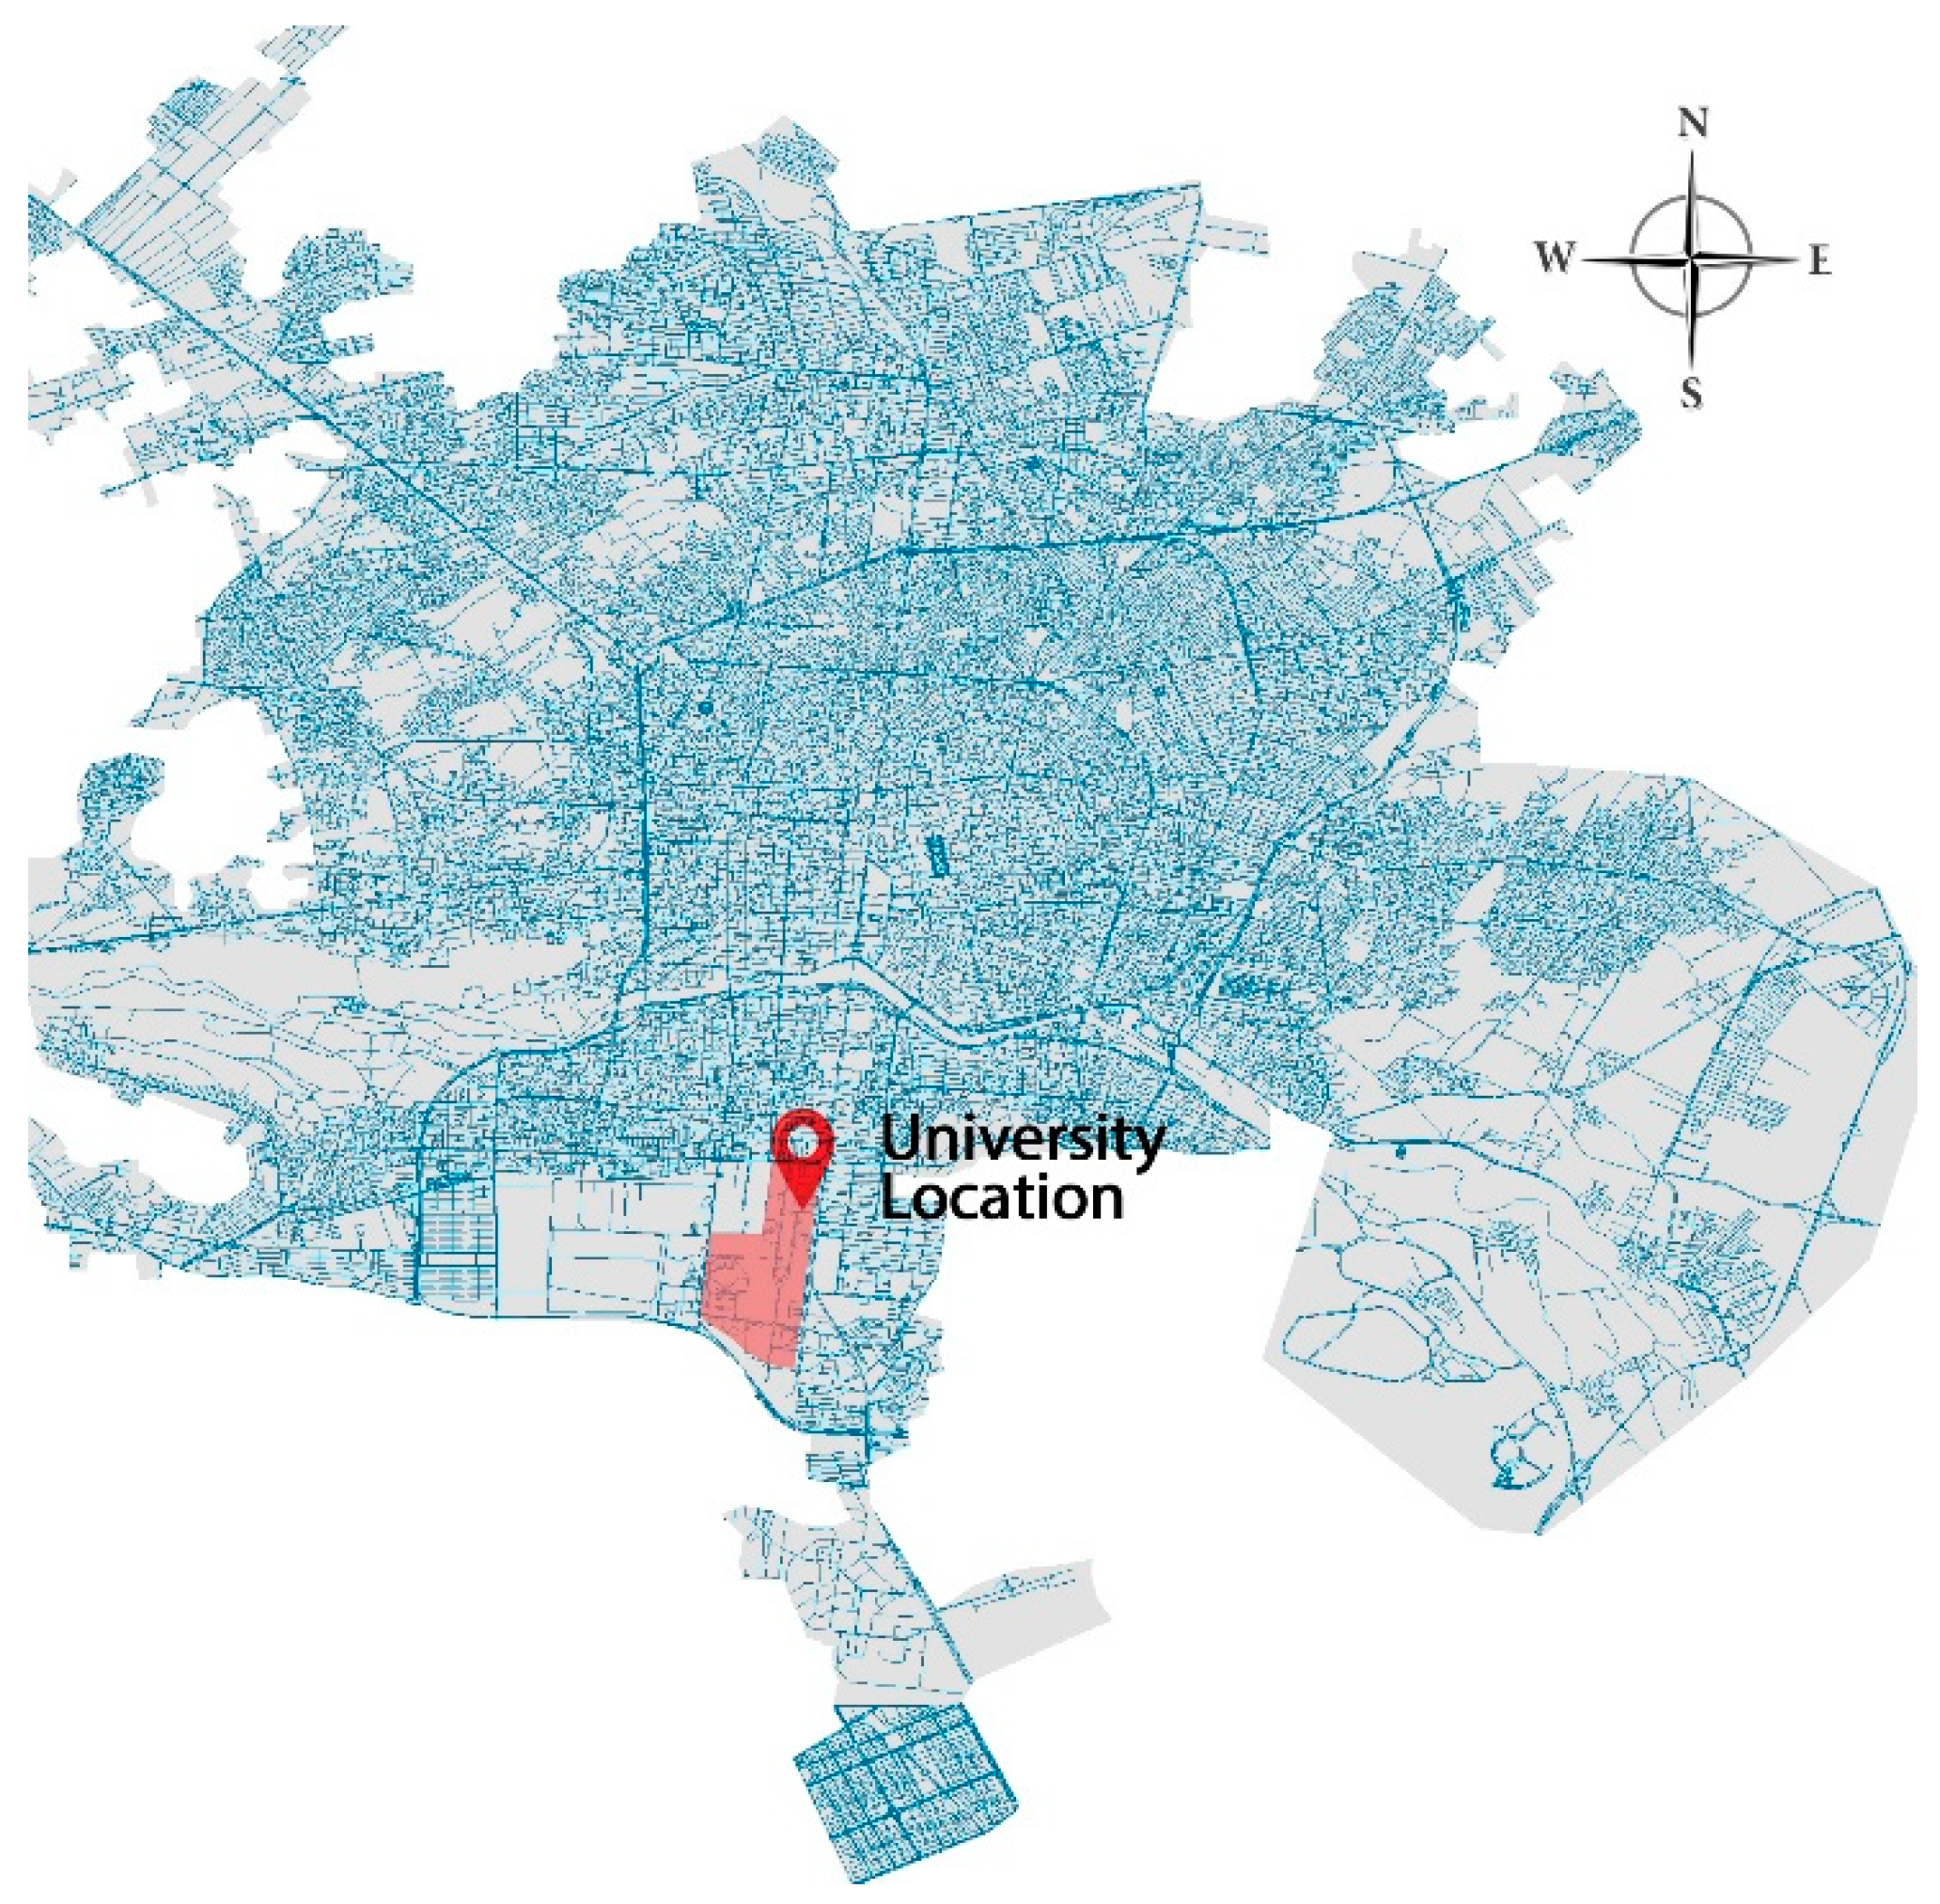
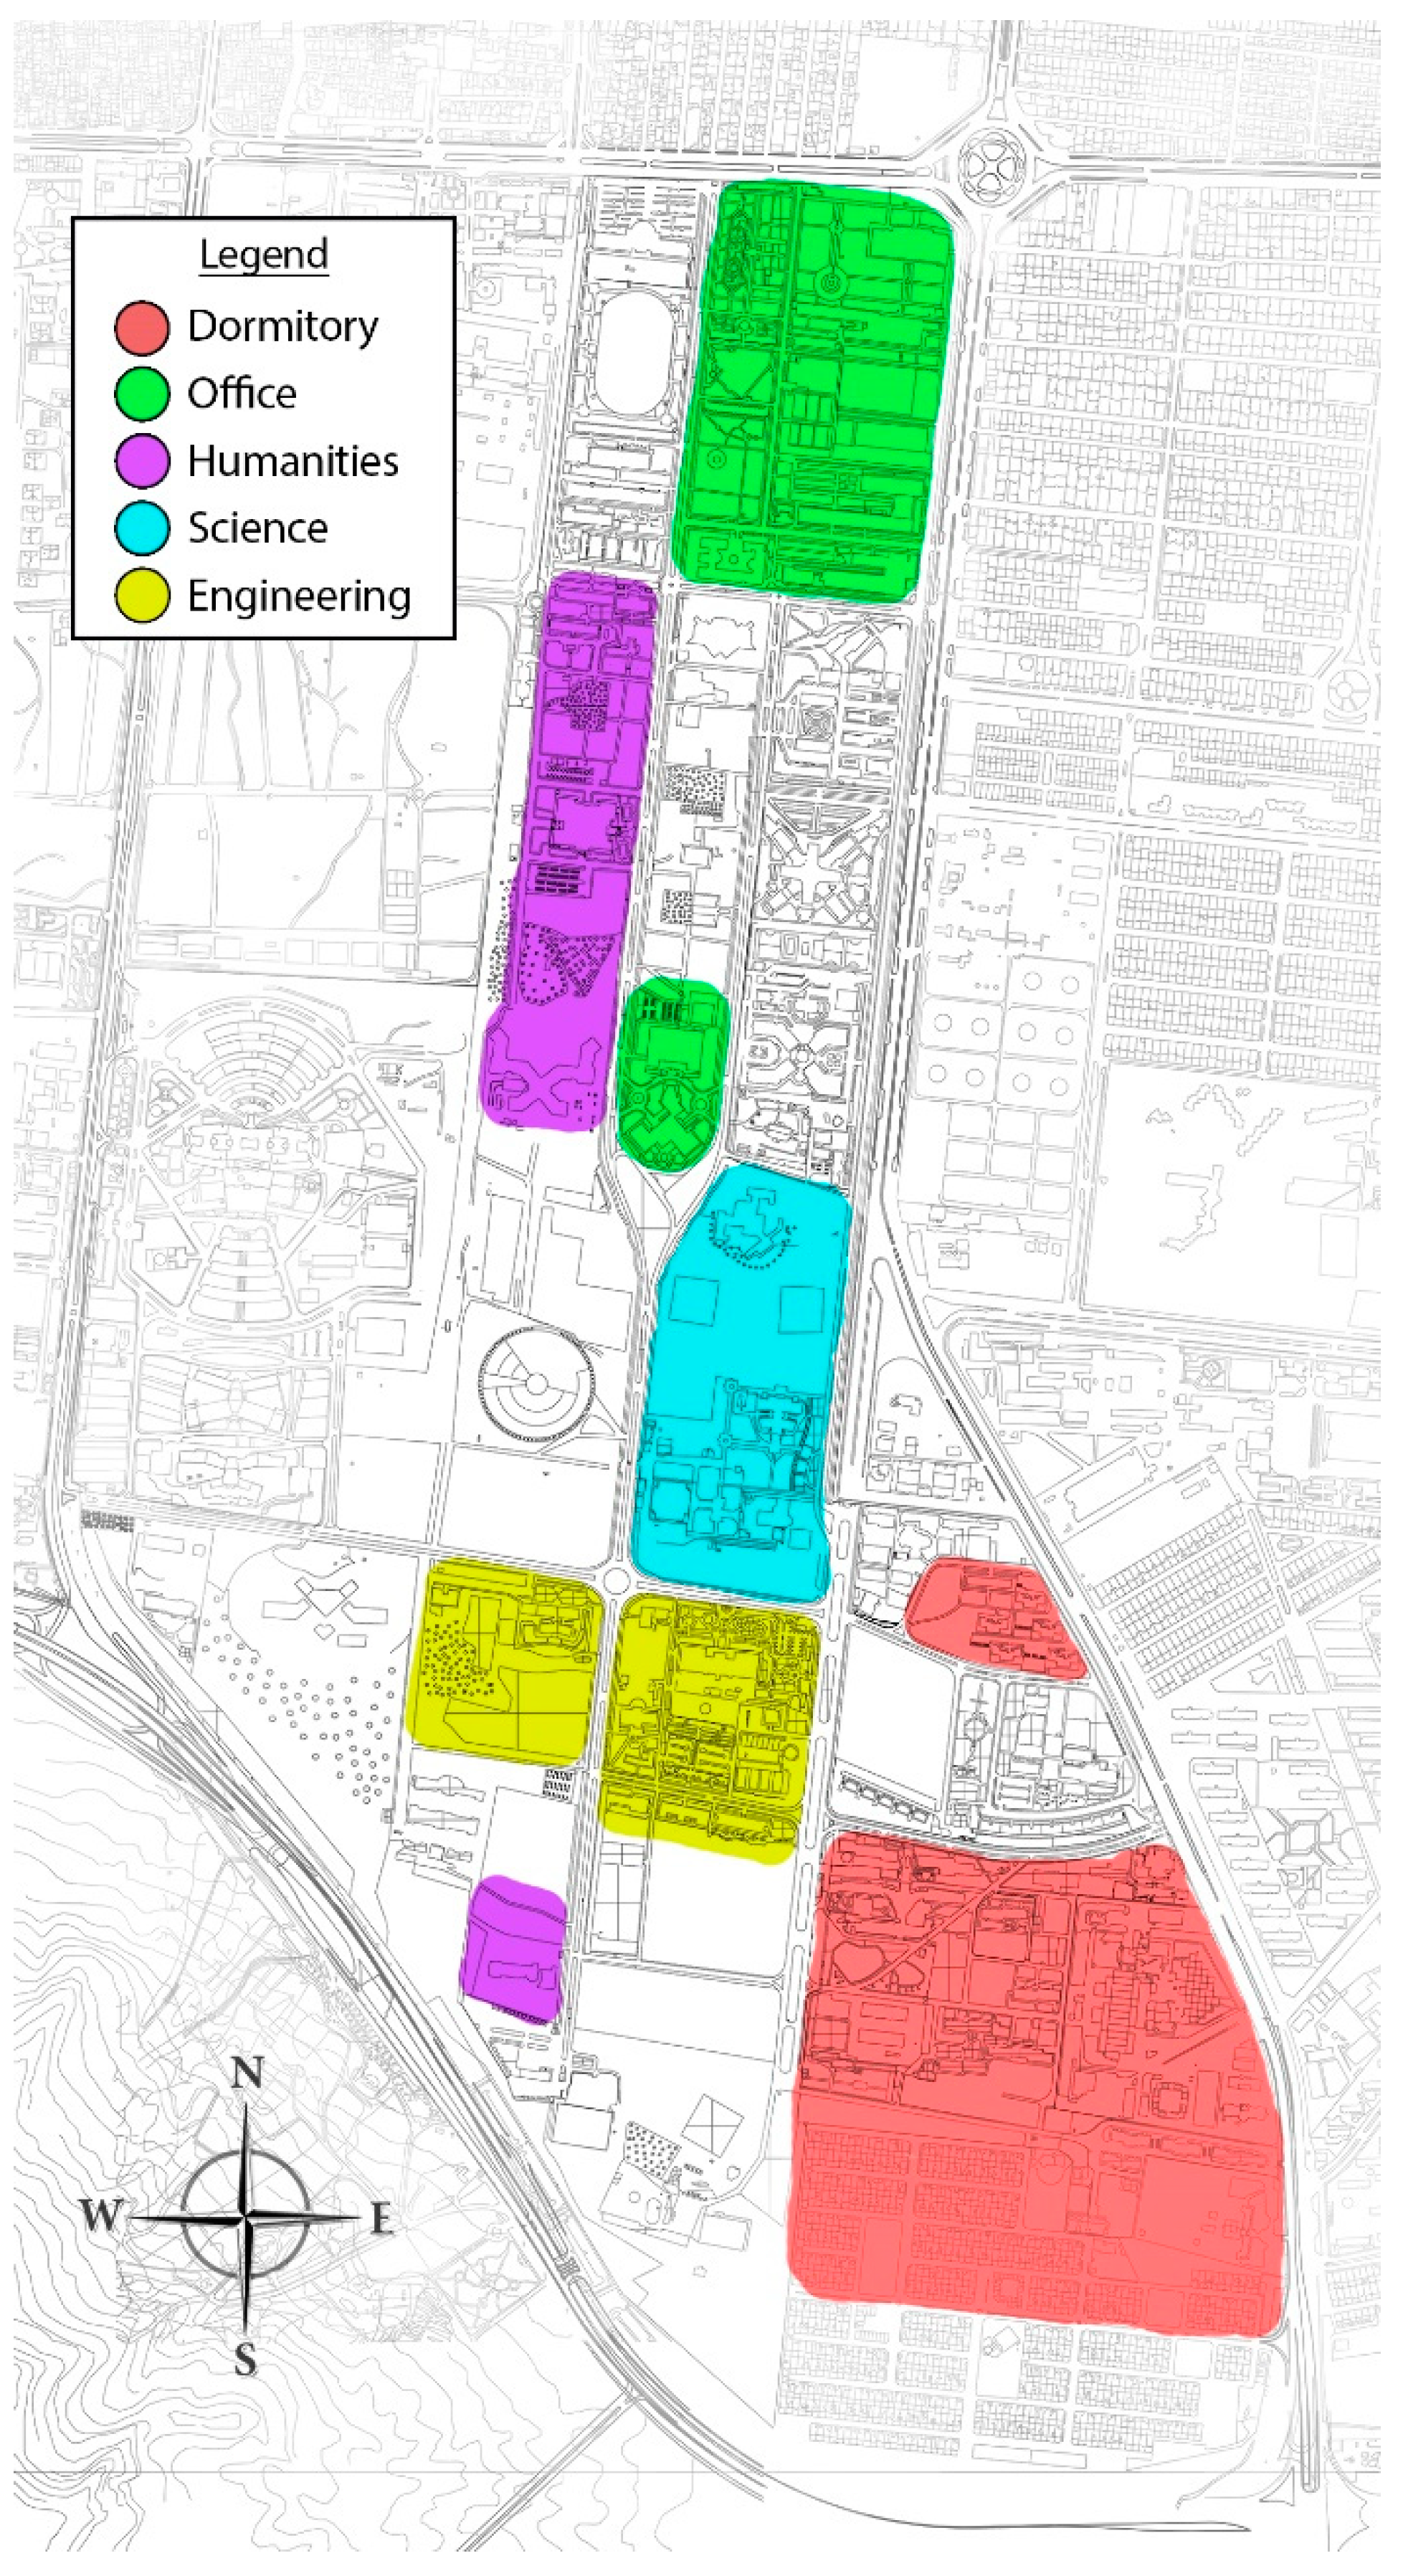
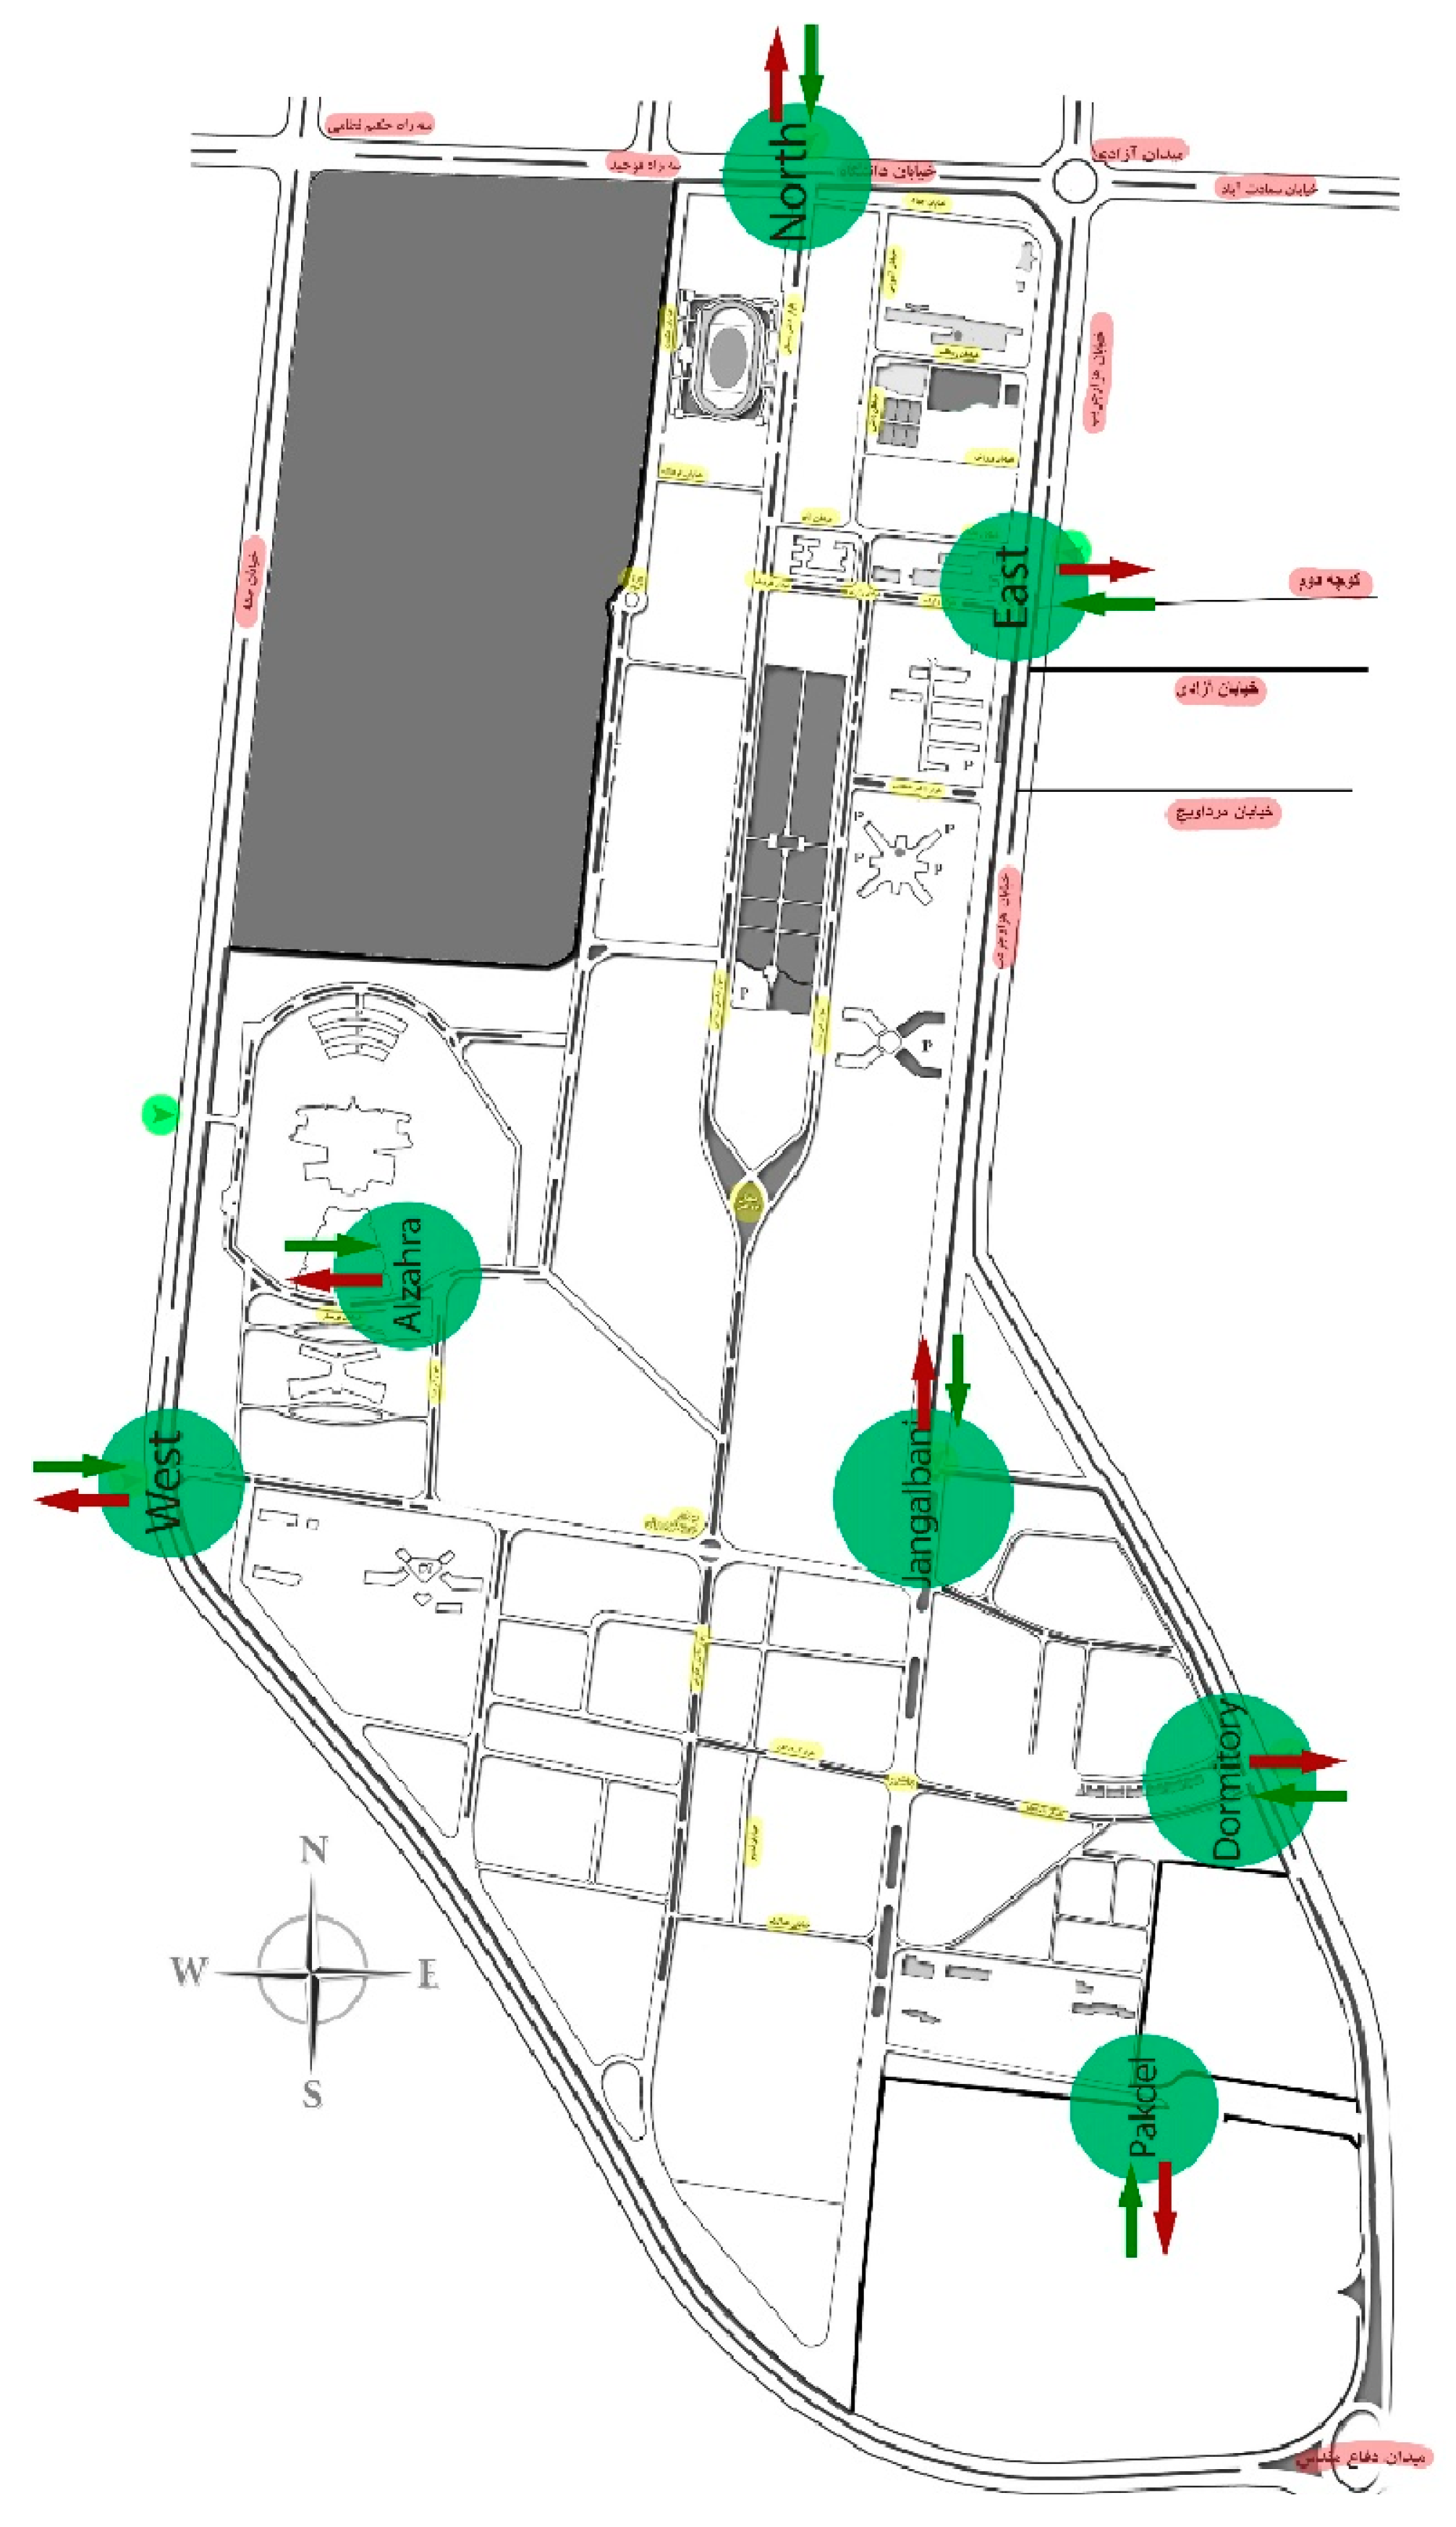
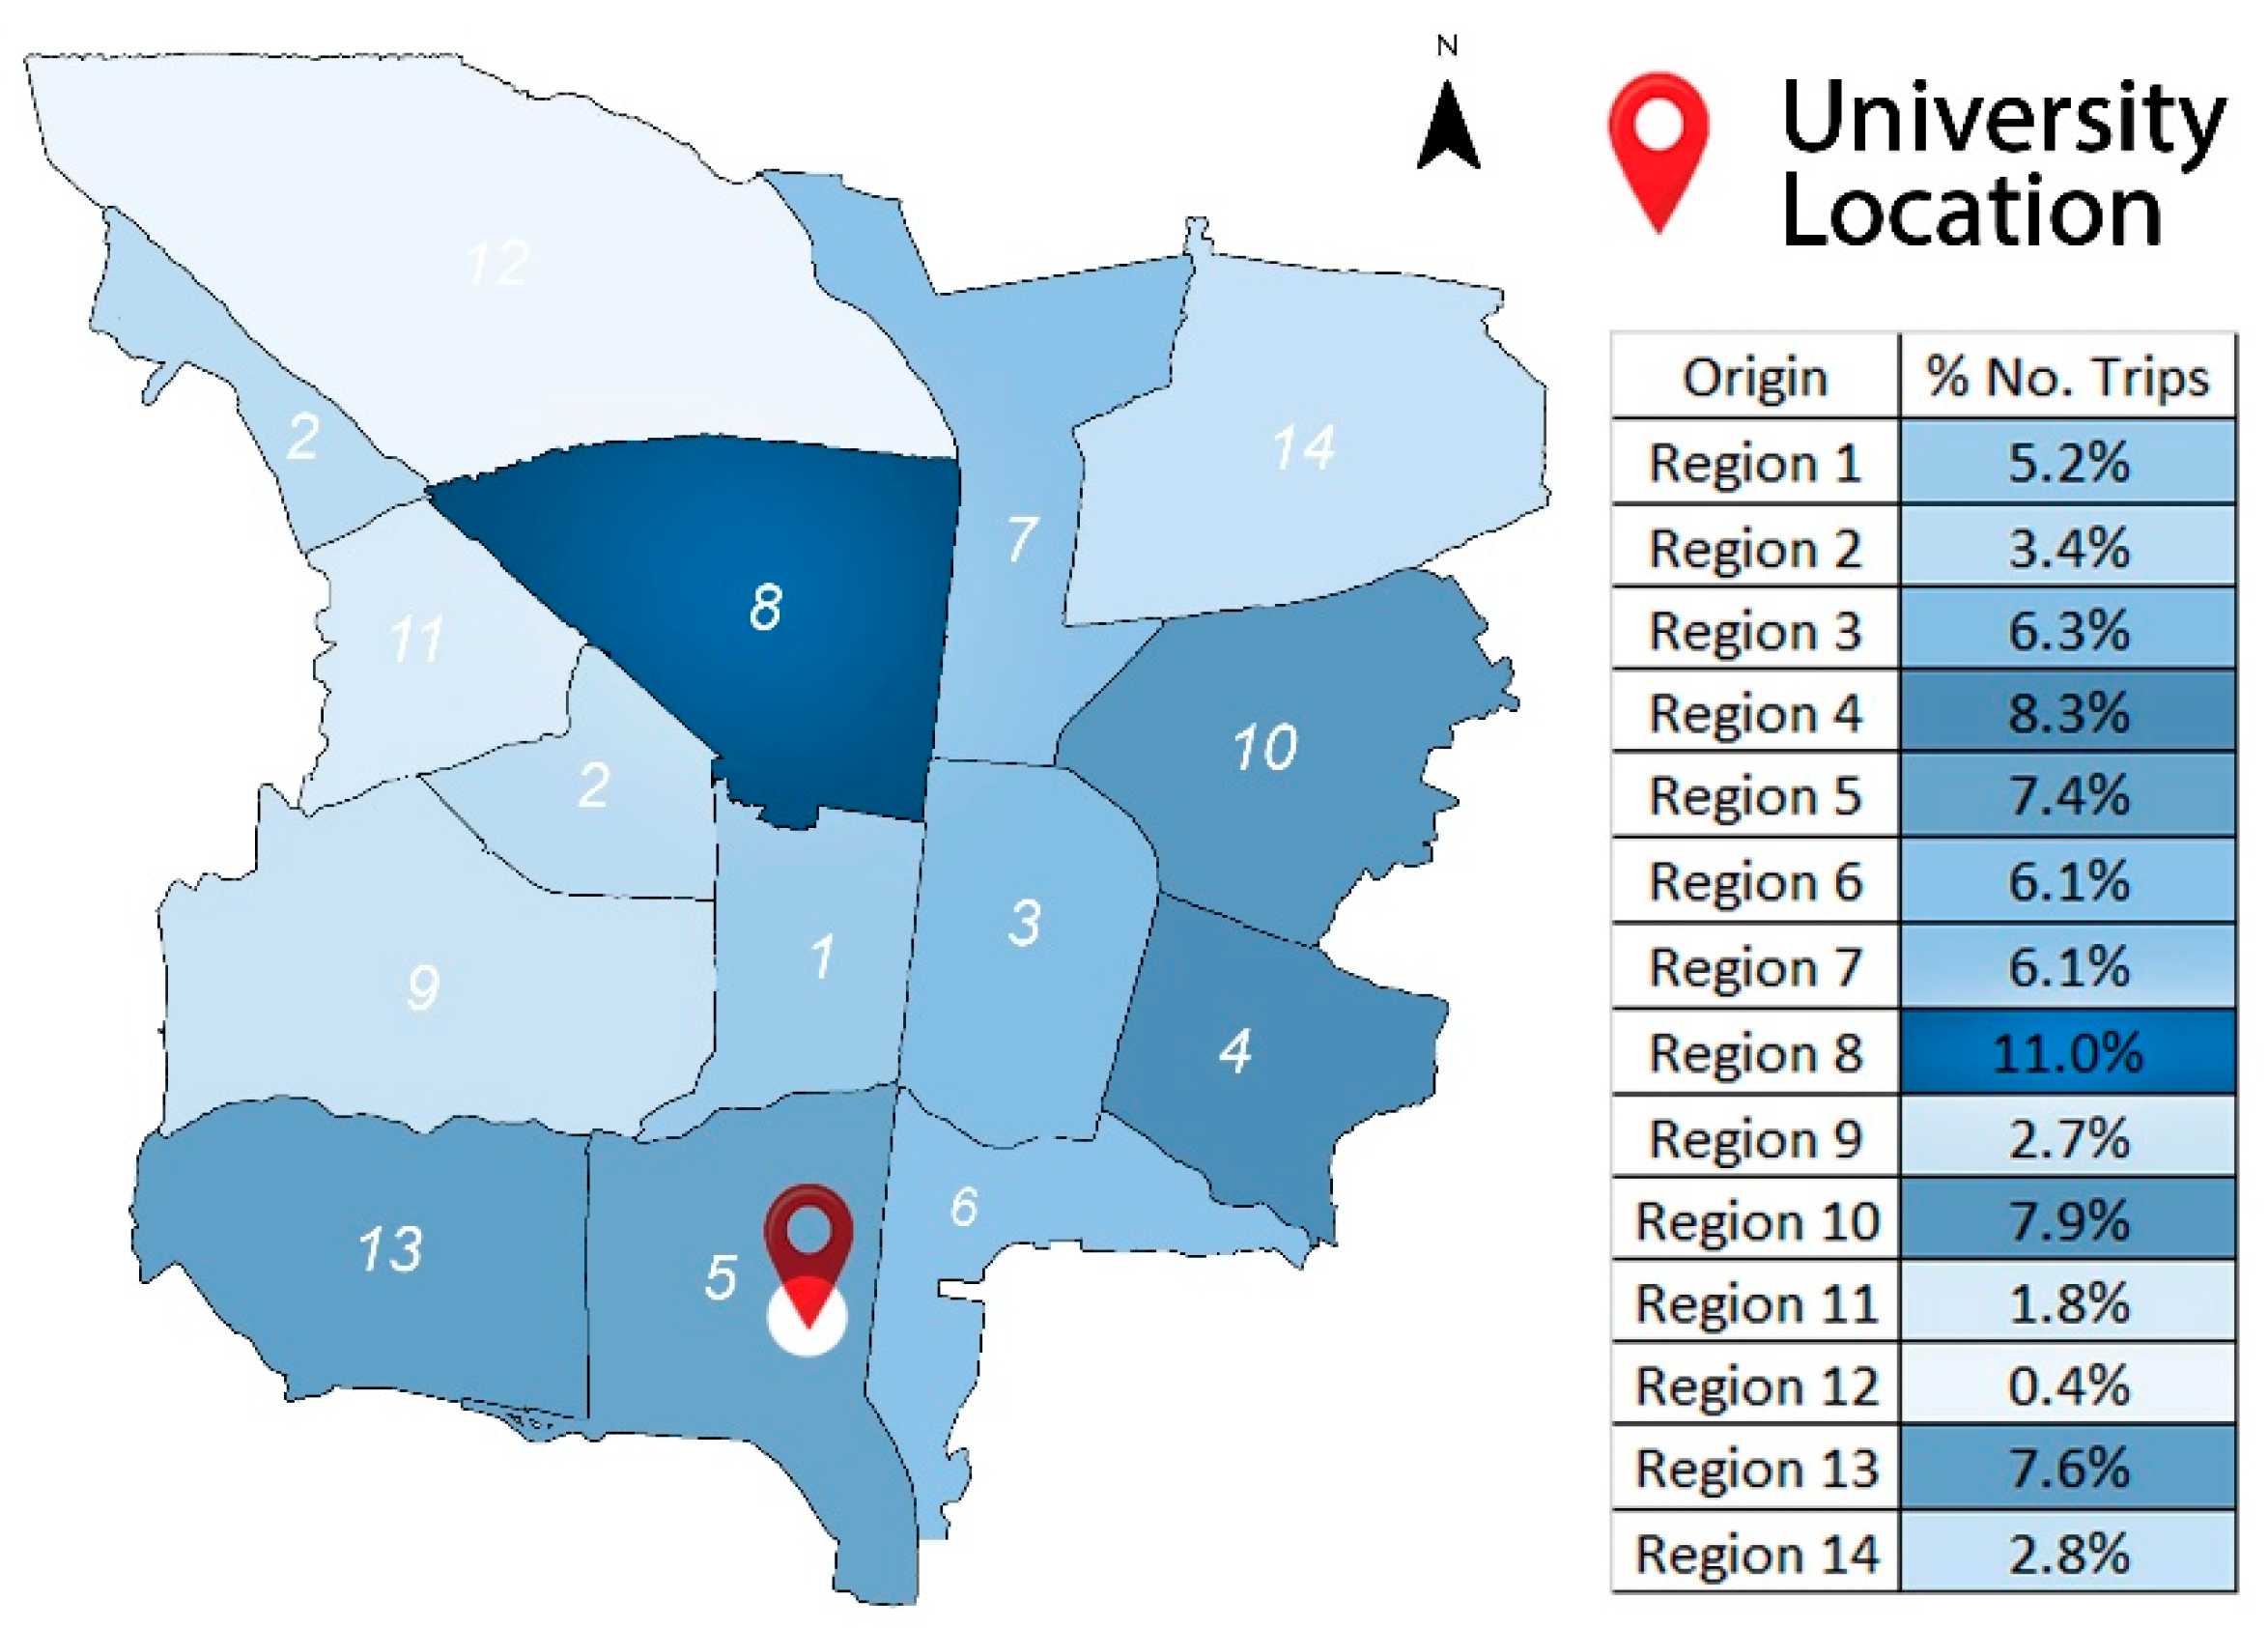
3.3. The Study Area
4. Results
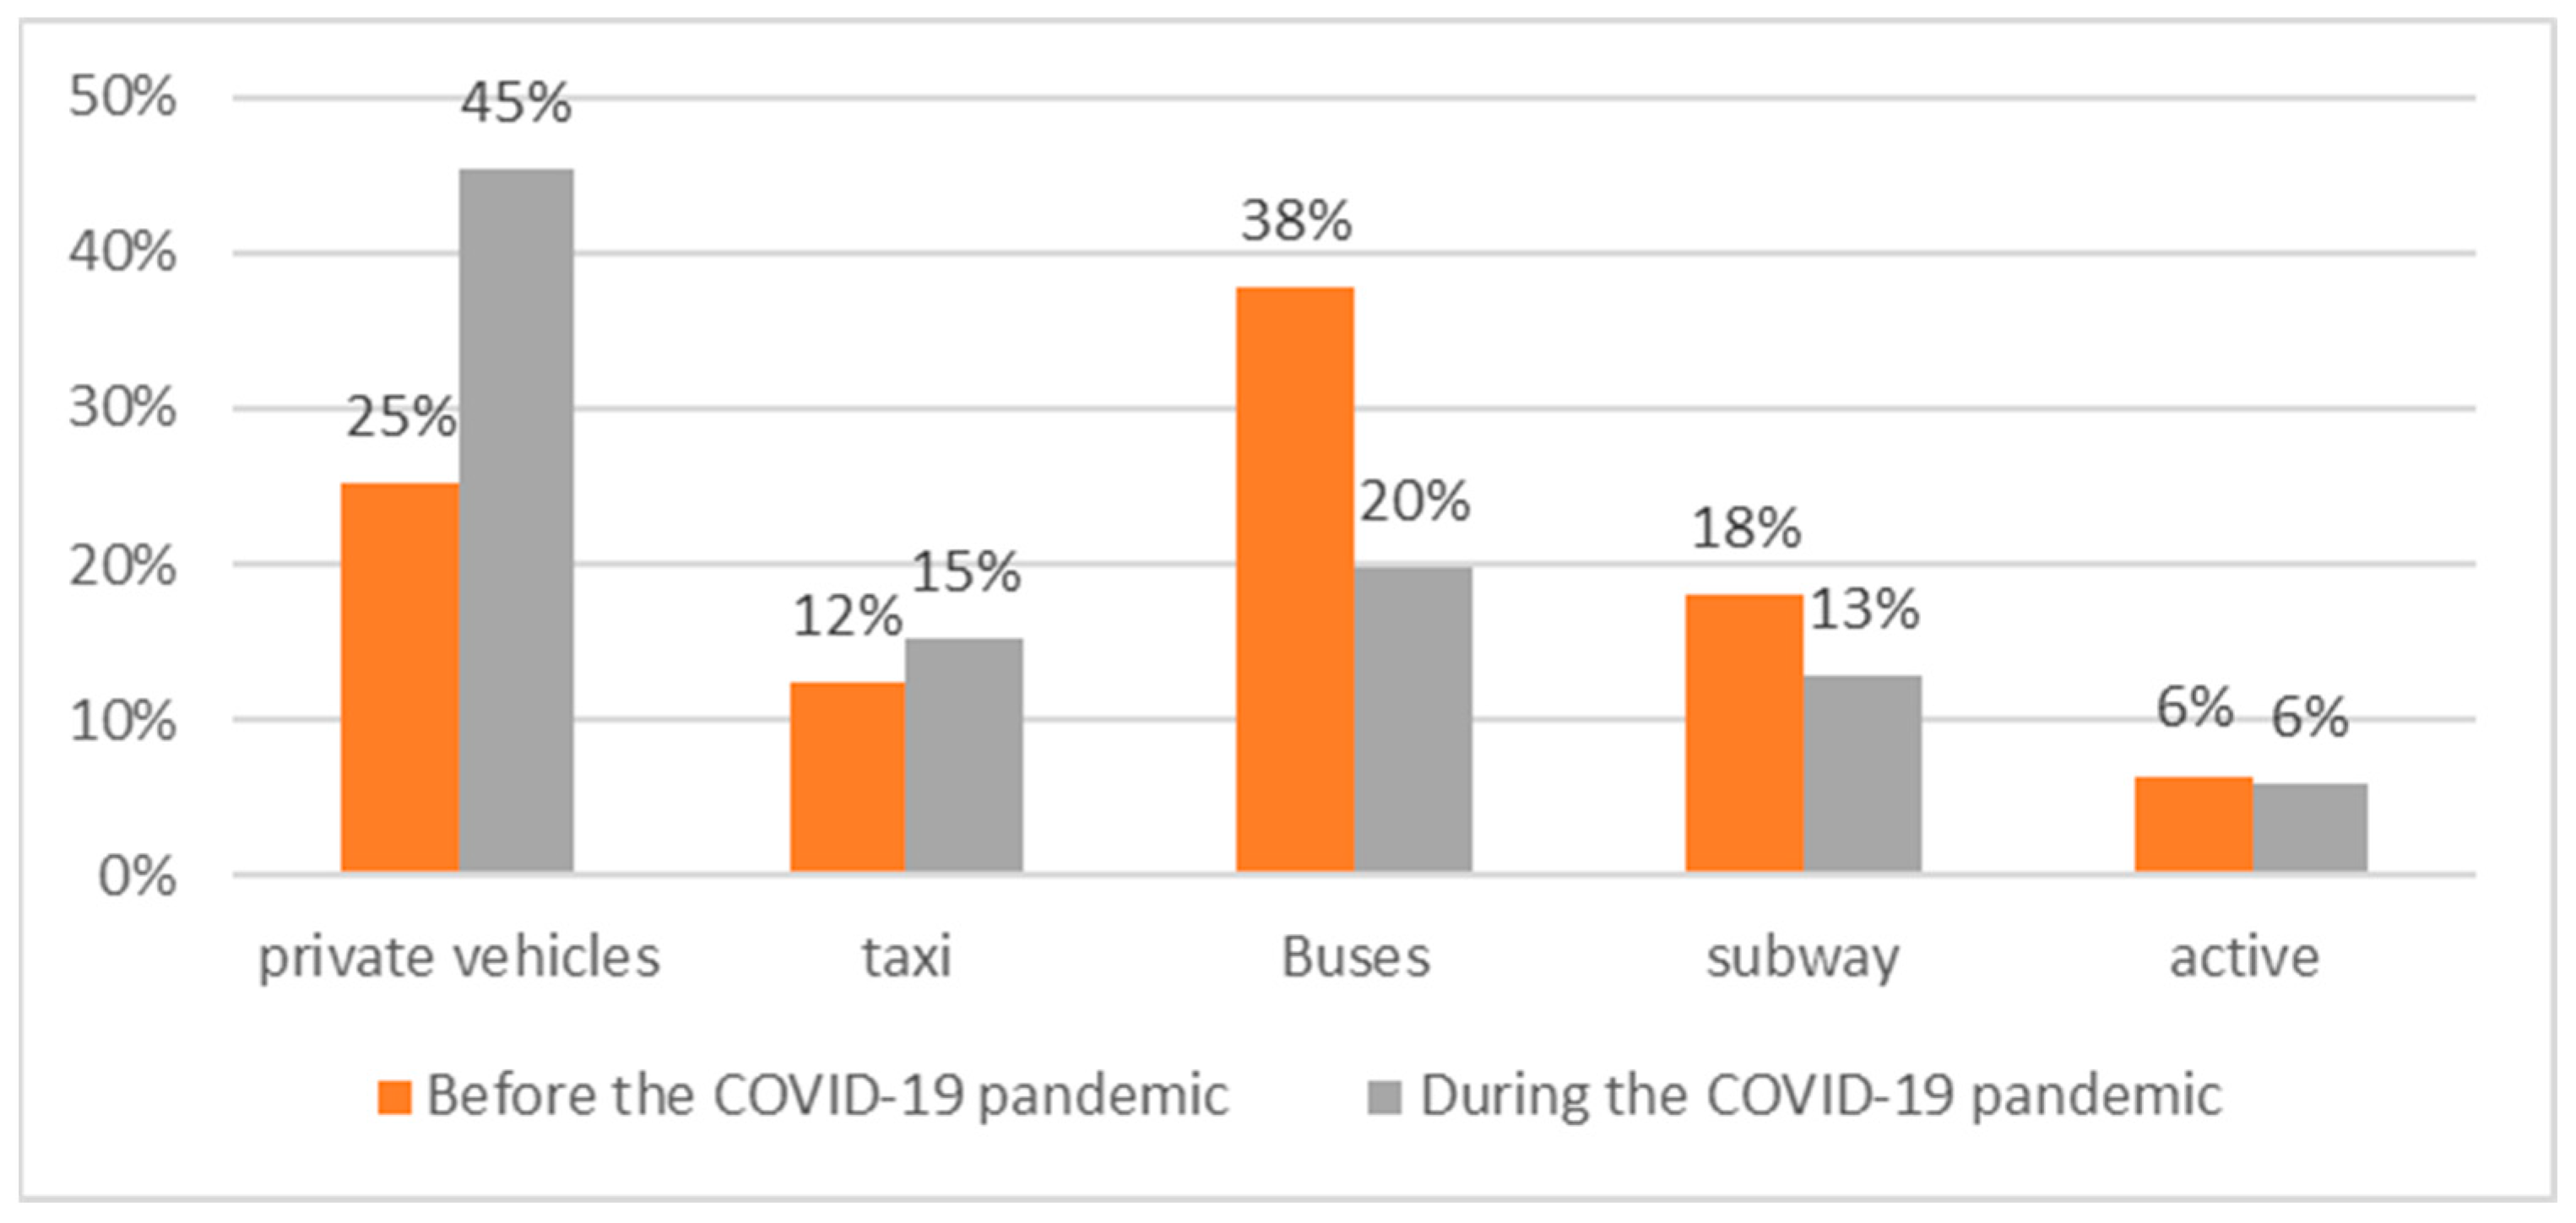
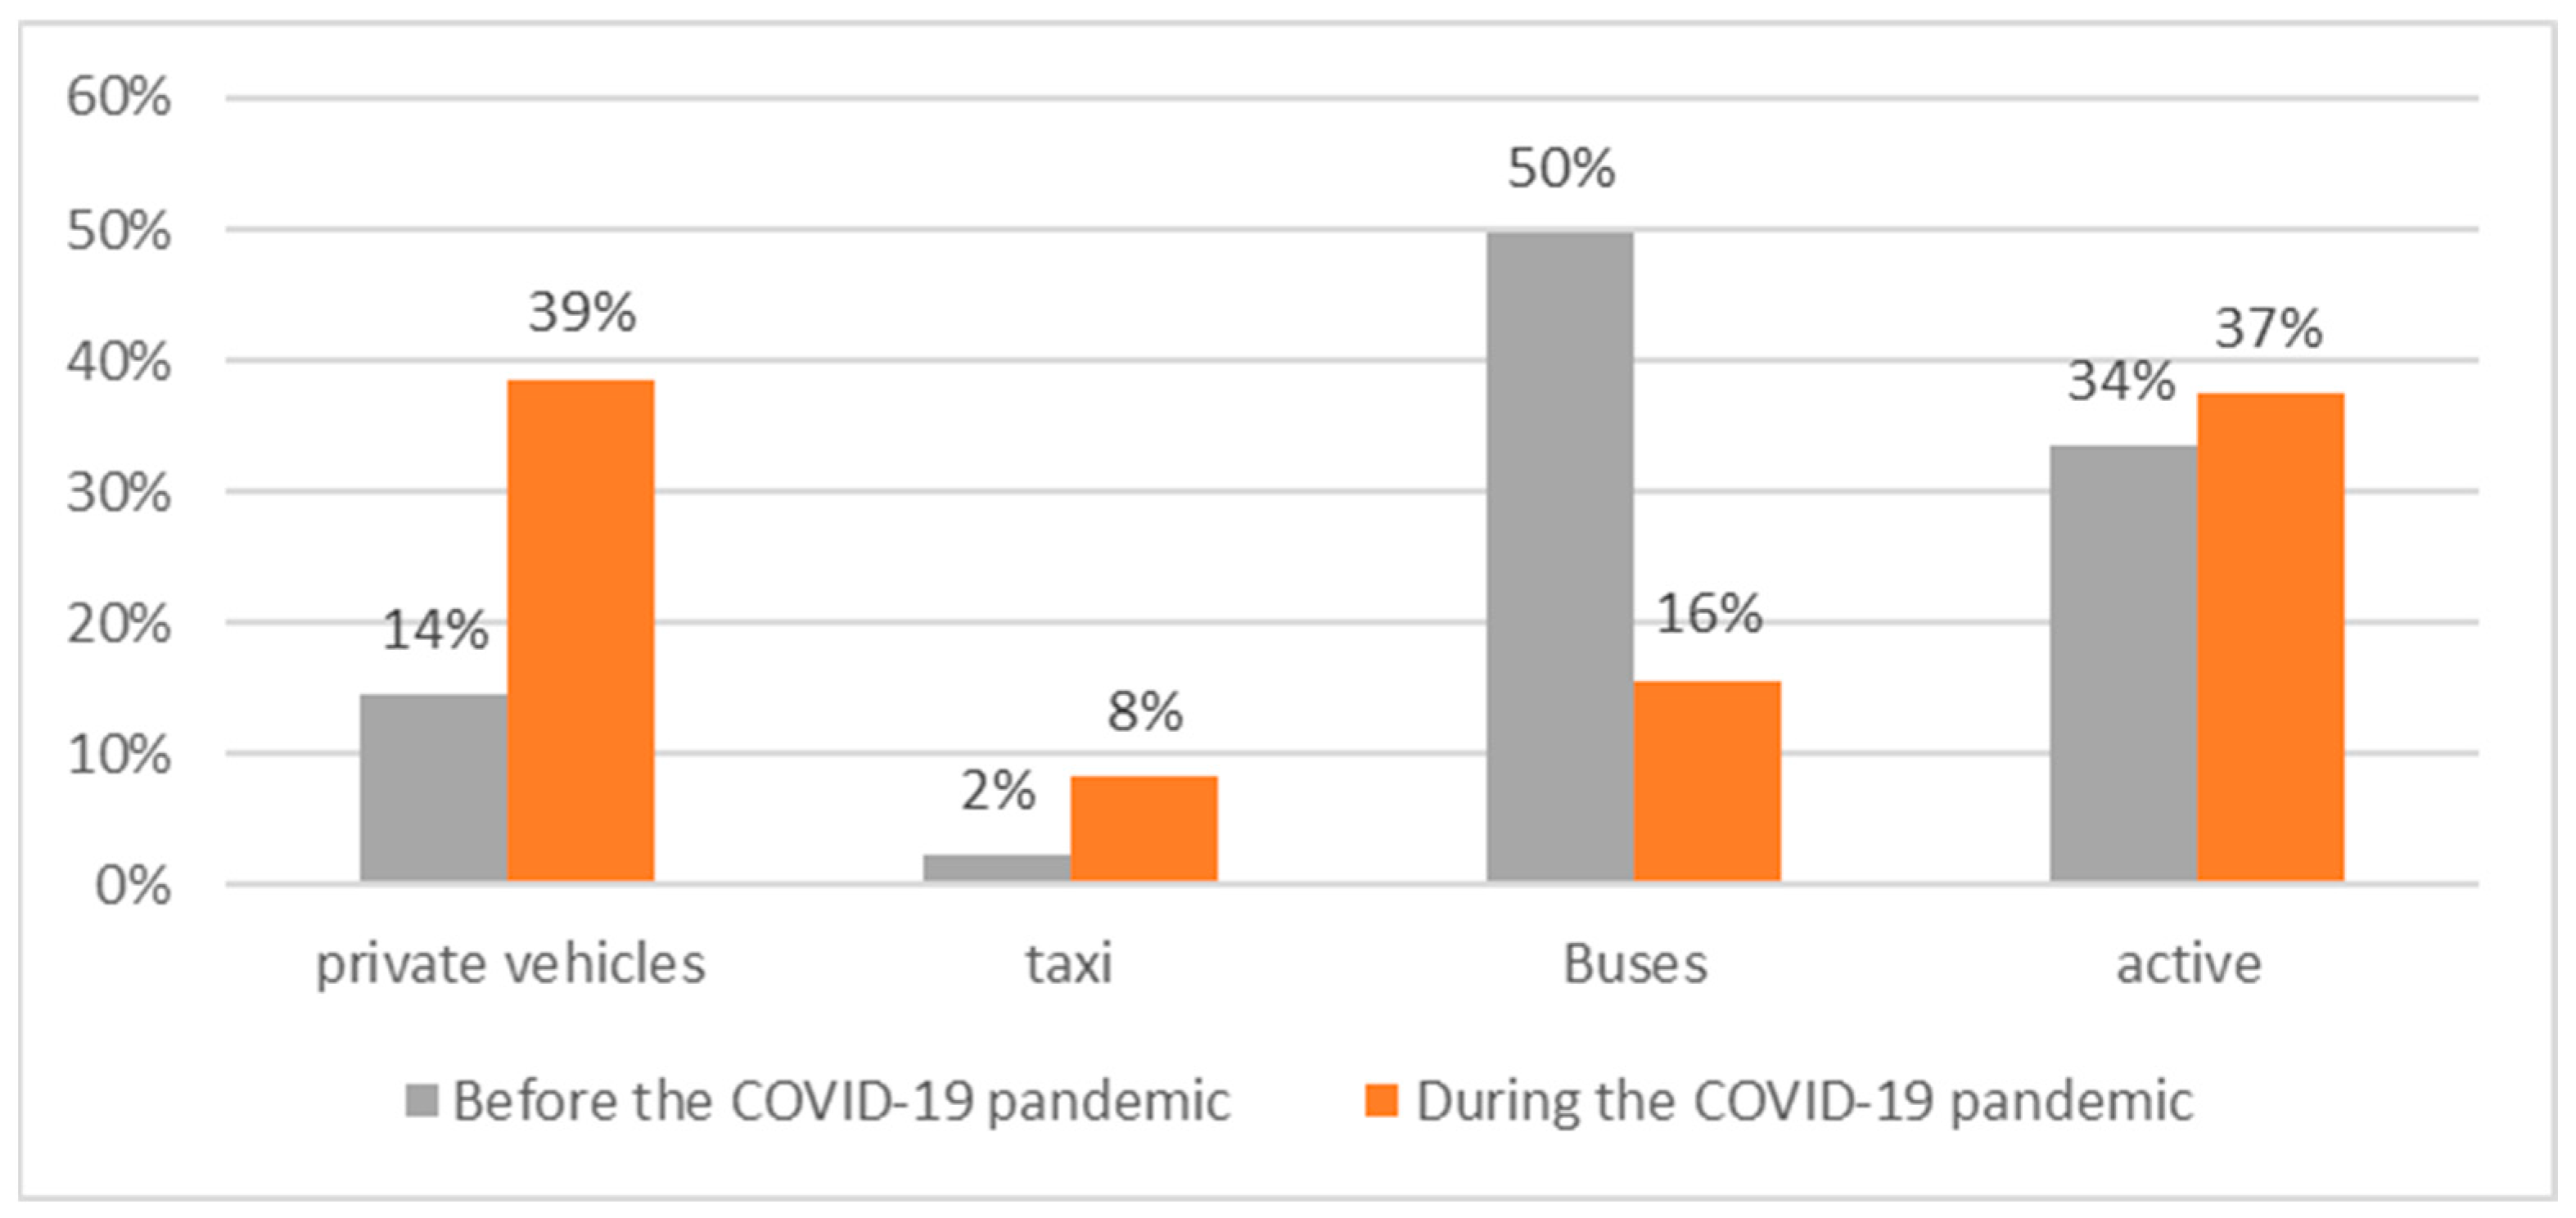
4.1. Travel Behavior
4.2. Mode Choice Models
4.2.1. Private Vehicles
4.2.2. Taxi
4.2.3. Bus
4.2.4. Subway
4.2.5. Active Mode
5. Discussion
6. Conclusions
Author Contributions
Funding
Informed Consent Statement
Data Availability Statement
Conflicts of Interest
References
- Whalen, K.E.; Páez, A.; Carrasco, J.A. Mode choice of university students commuting to school and the role of active travel. J. Transp. Geogr. 2013, 31, 132–142. [Google Scholar] [CrossRef]
- Isiaka, A.; Siong, H.C. Developing sustainable index for university campus. In Proceedings of the Easts International Symposium on Sustainable Transportation Incorporating Malaysian Universities Transport Research Forum Conference, Skudai, Malaysia, 12–13 August 2008; pp. 12–13. [Google Scholar]
- Shamsuddin, S.; Sulaiman, A.B.; Lamit, H.; Omar, R.; Aziz, N.; Noor, M.M. Kriteria Reka Bentuk Persekitaran Kampus Yang Kondusif Bagi Institusi Pengajian Tinggi di Malaysia; University Teknologi Malaysia: Johor Bahru, Malaysia, 2007. [Google Scholar]
- Beck, M.J.; Hensher, D.A. Insights into the impact of COVID-19 on household travel and activities in Australia–The early days under restrictions. Transp. Policy 2020, 96, 76–93. [Google Scholar] [CrossRef]
- Chinazzi, M.; Davis, J.T.; Ajelli, M.; Gioannini, C.; Litvinova, M.; Merler, S.; Pastore y Piontti, A.; Mu, K.; Rossi, L.; Sun, K. The effect of travel restrictions on the spread of the 2019 novel coronavirus (COVID-19) outbreak. Science 2020, 368, 395–400. [Google Scholar] [CrossRef]
- de Haas, M.; Faber, R.; Hamersma, M. How COVID-19 and the Dutch ‘intelligent lockdown’change activities, work and travel behaviour: Evidence from longitudinal data in the Netherlands. Transp. Res. Interdiscip. Perspect. 2020, 6, 100150. [Google Scholar] [PubMed]
- Oum, T.H.; Wang, K. Socially optimal lockdown and travel restrictions for fighting communicable virus including COVID-19. Transp. Policy 2020, 96, 94–100. [Google Scholar] [CrossRef] [PubMed]
- Dawe, G.F.; Vetter, A.; Martin, S. An overview of ecological footprinting and other tools and their application to the development of sustainability process: Audit and methodology at Holme Lacy College, UK. Int. J. Sustain. High. Educ. 2004, 5, 340–371. [Google Scholar] [CrossRef]
- Griffiths, A. Ecological Footprint Analysis: Swansea (University of Wales). Unpublished BSc Dissertation, University of Wales, Swansea, Wales, 2002. [Google Scholar]
- Flint, K. Institutional ecological footprint analysis—A case study of the University of Newcastle, Australia. Int. J. Sustain. High. Educ. 2001, 2, 48–62. [Google Scholar] [CrossRef]
- Chambers, N.; Simmons, C.; Wackernagel, M. Sharing Nature’s Interest: Ecological Footprints as an Indicator of Sustainability; Routledge: London, UK, 2014. [Google Scholar]
- Venetoulis, J. Assessing the ecological impact of a university: The ecological footprint for the University of Redlands. Int. J. Sustain. High. Educ. 2001, 2, 180–197. [Google Scholar] [CrossRef]
- Drumhell, B. Sustainable Transportation Options for Protecting the Climate: A Local Government Guid; ICLEI: Bonn, Germany, 2001. [Google Scholar]
- Mat, S.; Sopian, K.; Mokhtar, M.; Ali, B.; Hashim, H.S.; Rashid, A.K.A.; Ho, G.T. Managing sustainable campus in malaysia-organisational approach and measures. Eur. J. Soc. Sci. 2009, 8, 201–214. [Google Scholar]
- Wright, T.S.A. A Tenth Year Anniversary Retrospect: The Effect of the Halifax Declaration on Canadian Signatory Universities. Can. J. Environ. Educ. (CJEE) 2003, 8, 235–248. [Google Scholar]
- Walton, J. Should monitoring be compulsory within voluntary environmental agreements? Sustain. Dev. 2000, 8, 146–154. [Google Scholar] [CrossRef]
- Leal Filho, W.; Wright, T.S.A. Barriers on the Path to Sustainability: European and Canadian Perspectives in Higher Education. Int. J. Sustain. Dev. World Ecol. 2002, 9, 179–186. [Google Scholar]
- Millard-Ball, A.; Siegman, P.; Tumlin, J. Solving Campus Parking Shortages: New Solutions for an Old Problem. Plan. High. Educ. 2004, 33, 30–43. [Google Scholar]
- Delmelle, E.M.; Delmelle, E.C. Exploring spatio-temporal commuting patterns in a university environment. Transp. Policy 2012, 21, 1–9. [Google Scholar] [CrossRef]
- Markowitz, F.; Estrella, A. Campus Moves: Transportation technology crosses the line between town and gown. PLANNING-CHICAGO- 1998, 64, 14–19. [Google Scholar]
- Pooley, C.G.; Turnbull, J. Modal choice and modal change: The journey to work in Britain since 1890. J. Transp. Geogr. 2000, 8, 11–24. [Google Scholar] [CrossRef]
- Thøgersen, J. Understanding repetitive travel mode choices in a stable context: A panel study approach. Transp. Res. Part A Policy Pract. 2006, 40, 621–638. [Google Scholar] [CrossRef]
- Miralles-Guasch, C. Circular o arribar? Velles tradicions i noves estratègies per a repensar la mobilitat quotidiana. Rev. Catalana Sociol. 2001, 14, 171–183. [Google Scholar]
- Eriksson, L.; Garvill, J.; Nordlund, A.M. Interrupting habitual car use: The importance of car habit strength and moral motivation for personal car use reduction. Transp. Res. Part F Traffic Psychol. Behav. 2008, 11, 10–23. [Google Scholar] [CrossRef]
- Collantes, G.O.; Mokhtarian, P.L. Subjective assessments of personal mobility: What makes the difference between a little and a lot? Transp. Policy 2007, 14, 181–192. [Google Scholar] [CrossRef]
- Sandow, E. Commuting behaviour in sparsely populated areas: Evidence from northern Sweden. J. Transp. Geogr. 2008, 16, 14–27. [Google Scholar] [CrossRef]
- Schafer, A.; Victor, D.G. The future mobility of the world population. Transp. Res. Part A Policy Pract. 2000, 34, 171–205. [Google Scholar] [CrossRef]
- Shannon, T.; Giles-Corti, B.; Pikora, T.; Bulsara, M.; Shilton, T.; Bull, F. Active commuting in a university setting: Assessing commuting habits and potential for modal change. Transp. Policy 2006, 13, 240–253. [Google Scholar] [CrossRef]
- Rybarczyk, G.; Gallagher, L. Measuring the potential for bicycling and walking at a metropolitan commuter university. J. Transp. Geogr. 2014, 39, 1–10. [Google Scholar] [CrossRef]
- ATM & GC. Enquesta Mobilitat Quotidiana de Catalunya 2006. Available online: https://terra.bibliotecadigital.gencat.cat/bitstream/handle/20.500.13045/535/enquesta-mobilitat-quotidiana-catalunya-2006-resum-resultats.pdf?sequence=4&isAllowed=y (accessed on 17 May 2023).
- Ellis, A.; Gile, A.; Prusak, S.; Wolters, C. Evaluating Madison from Two Wheels. UW Geography Undergraduate Colloquium, 2013. Project. Available online: http://digital.library.wisc.edu/1793/73427 (accessed on 17 May 2023).
- Tolley, R. Green campuses: Cutting the environmental cost of commuting. J. Transp. Geogr. 1996, 4, 213–217. [Google Scholar] [CrossRef]
- Pucher, J.; Dill, J.; Handy, S. Infrastructure, programs, and policies to increase bicycling: An international review. Prev. Med. 2010, 50, S106–S125. [Google Scholar] [CrossRef]
- Peers, J. Transit & pedestrian oriented developments: Do they really make a difference? In Proceedings of the Harmonizing Transportation and Community Goals-The Challenge for Today’s Transportation Professional, Monterey, CA, USA, 1–4 March 1998; ITE International Conference Institute of Transportation Engineers (ITE): Washington, DC, USA, 1998. [Google Scholar]
- Khattak, A.; Wang, X.; Son, S.; Agnello, P. Travel by university students in Virginia: Is this travel different from travel by the general population? Transp. Res. Rec. 2011, 2255, 137–145. [Google Scholar] [CrossRef]
- Eom, J.K.; Stone, J.R.; Ghosh, S.K. Daily activity patterns of university students. J. Urban Plan. Dev. 2009, 135, 141–149. [Google Scholar] [CrossRef]
- Ceccato, R.; Rossi, R.; Gastaldi, M. Travel Demand Prediction during COVID-19 Pandemic: Educational and Working Trips at the University of Padova. Sustainability 2021, 13, 6596. [Google Scholar] [CrossRef]
- Lavery, T.; Páez, A.; Kanaroglou, P.S. Driving out of choices: An investigation of transport modality in a university sample. Transp. Res. Part A Policy Pract. 2013, 57, 37–46. [Google Scholar] [CrossRef]
- Akar, G.; Fischer, N.; Namgung, M. Bicycling choice and gender case study: The Ohio State University. Int. J. Sustain. Transp. 2013, 7, 347–365. [Google Scholar] [CrossRef]
- Collins, C.M.; Chambers, S.M. Psychological and situational influences on commuter-transport-mode choice. Environ. Behav. 2005, 37, 640–661. [Google Scholar] [CrossRef]
- Bamberg, S.; Ajzen, I.; Schmidt, P. Choice of travel mode in the theory of planned behavior: The roles of past behavior, habit, and reasoned action. Basic Appl. Soc. Psychol. 2003, 25, 175–187. [Google Scholar] [CrossRef]
- Rose, G. Encouraging sustainable campus travel: Self-reported impacts of a university TravelSmart initiative. J. Public Transp. 2008, 11, 85–108. [Google Scholar] [CrossRef]
- Kerr, A.; Lennon, A.; Watson, B. The call of the road: Factors predicting students’ car travelling intentions and behaviour. Transportation 2010, 37, 1–13. [Google Scholar] [CrossRef]
- Maxwell, S.A. Car Cultures: Using Deliberative and Inclusionary Processes to Explore Meanings of Car Use in Everyday Life. Doctoral Thesis, University of London, University College London, London, UK, 2001. Available online: https://www.proquest.com/openview/9b1bcb2fc253ac607f95b1a0f79b14e3/1?pq-origsite=gscholar&cbl=2026366&diss=y (accessed on 17 May 2023).
- Bari, C.; Chopade, R.; Kachwa, S.; Navandar, Y.V.; Dhamaniya, A. Impact of COVID-19 on educational trips—An Indian case study. Transp. Lett. 2021, 13, 375–387. [Google Scholar] [CrossRef]
- Tsavdari, D.; Klimi, V.; Georgiadis, G.; Fountas, G.; Basbas, S. The Anticipated Use of Public Transport in the Post-Pandemic Era: Insights from an Academic Community in Thessaloniki, Greece. Soc. Sci. 2022, 11, 400. [Google Scholar] [CrossRef]
- Limanond, T.; Butsingkorn, T.; Chermkhunthod, C. Travel behavior of university students who live on campus: A case study of a rural university in Asia. Transp. Policy 2011, 18, 163–171. [Google Scholar] [CrossRef]
- Molloy, J.; Schatzmann, T.; Schoeman, B.; Tchervenkov, C.; Hintermann, B.; Axhausen, K.W. Observed impacts of the Covid-19 first wave on travel behaviour in Switzerland based on a large GPS panel. Transp. Policy 2021, 104, 43–51. [Google Scholar] [CrossRef]
- Ivanova, M.; Ivanov, I.K.; Ivanov, S. Travel behaviour after the pandemic: The case of Bulgaria. Anatolia 2021, 32, 1–11. [Google Scholar]
- Bhaduri, E.; Manoj, B.; Wadud, Z.; Goswami, A.K.; Choudhury, C.F. Modelling the effects of COVID-19 on travel mode choice behaviour in India. Transp. Res. Interdiscip. Perspect. 2020, 8, 100273. [Google Scholar]
- Vo, K.D.; Lam, W.H.; Li, Z.-C. A mixed-equilibrium model of individual and household activity–travel choices in multimodal transportation networks. Transp. Res. Part C Emerg. Technol. 2021, 131, 103337. [Google Scholar]
- Liu, Y.; Tong, L.C.; Zhu, X.; Du, W. Dynamic activity chain pattern estimation under mobility demand changes during COVID-19. Transp. Res. Part C Emerg. Technol. 2021, 131, 103361. [Google Scholar] [PubMed]
- Ouyang, S. Analysing the Influence of the COVID-19 Pandemic on Air Travel Behaviour: An Approach of Stated Choice Experiments. Master’s Thesis, Delft University of Technology, Delft, The Netherlands, 2021. [Google Scholar]
- van Wee, B.; Witlox, F. COVID-19 and its long-term effects on activity participation and travel behaviour: A multiperspective view. J. Transp. Geogr. 2021, 95, 103144. [Google Scholar] [PubMed]
- Neuburger, L.; Egger, R. Travel risk perception and travel behaviour during the COVID-19 pandemic 2020: A case study of the DACH region. Curr. Issues Tour. 2021, 24, 1003–1016. [Google Scholar]
- Thombre, A.; Agarwal, A. A paradigm shift in urban mobility: Policy insights from travel before and after COVID-19 to seize the opportunity. Transp. Policy 2021, 110, 335–353. [Google Scholar]
- Schmidt, K.; Sieverding, T.; Wallis, H.; Matthies, E. COVID-19—A window of opportunity for the transition toward sustainable mobility? Transp. Res. Interdiscip. Perspect. 2021, 10, 100374. [Google Scholar]
- Politis, I.; Georgiadis, G.; Papadopoulos, E.; Fyrogenis, I.; Nikolaidou, A.; Kopsacheilis, A.; Sdoukopoulos, A.; Verani, E. COVID-19 lockdown measures and travel behavior: The case of Thessaloniki, Greece. Transp. Res. Interdiscip. Perspect. 2021, 10, 100345. [Google Scholar]
- Truong, D.; Truong, M.D. Projecting daily travel behavior by distance during the pandemic and the spread of COVID-19 infections–Are we in a closed loop scenario? Transp. Res. Interdiscip. Perspect. 2021, 9, 100283. [Google Scholar]
- Abdullah, M.; Dias, C.; Muley, D.; Shahin, M. Exploring the impacts of COVID-19 on travel behavior and mode preferences. Transp. Res. Interdiscip. Perspect. 2020, 8, 100255. [Google Scholar]
- Parady, G.; Taniguchi, A.; Takami, K. Travel behavior changes during the COVID-19 pandemic in Japan: Analyzing the effects of risk perception and social influence on going-out self-restriction. Transp. Res. Interdiscip. Perspect. 2020, 7, 100181. [Google Scholar]
- Shamshiripour, A.; Rahimi, E.; Shabanpour, R.; Mohammadian, A.K. How is COVID-19 reshaping activity-travel behavior? Evidence from a comprehensive survey in Chicago. Transp. Res. Interdiscip. Perspect. 2020, 7, 100216. [Google Scholar] [CrossRef] [PubMed]
- Kotrlik, J.; Higgins, C. Organizational research: Determining appropriate sample size in survey research appropriate sample size in survey research. Inf. Technol. Learn. Perform. J. 2001, 19, 43. [Google Scholar]
- Ben-Akiva, M.E.; Lerman, S.R.; Lerman, S.R. Discrete Choice Analysis: Theory and Application to Travel Demand; MIT Press: Cambridge, MA, USA, 1985; Volume 9. [Google Scholar]
- Albert, A.; Anderson, J.A. On the existence of maximum likelihood estimates in logistic regression models. Biometrika 1984, 71, 1–10. [Google Scholar] [CrossRef]
- Bujang, M.A.; Sa’at, N.; Bakar, T.M.I.T.A. Sample size guidelines for logistic regression from observational studies with large population: Emphasis on the accuracy between statistics and parameters based on real life clinical data. Malays. J. Med. Sci. MJMS 2018, 25, 122. [Google Scholar] [CrossRef] [PubMed]
- Wang, H.; Noland, R.B. Bikeshare and subway ridership changes during the COVID-19 pandemic in New York City. Transp. Policy 2021, 106, 262–270. [Google Scholar] [CrossRef]
- Martel, M. COVID-19 Effects on US Higher Education Campuses. From Emergency Response to Planning for Future Student Mobility; The Institute of International Education: New York, NY, USA, 2020; Available online: https://bit.ly/2zVxewC (accessed on 17 May 2023).
- Jamal, S.; Paez, A. Changes in trip-making frequency by mode during COVID-19. Transp. Find. 2020, 24, 435–436. [Google Scholar]
- Jenelius, E.; Cebecauer, M. Impacts of COVID-19 on public transport ridership in Sweden: Analysis of ticket validations, sales and passenger counts. Transp. Res. Interdiscip. Perspect. 2020, 8, 100242. [Google Scholar]
- Zhang, N.; Jia, W.; Wang, P.; Dung, C.-H.; Zhao, P.; Leung, K.; Su, B.; Cheng, R.; Li, Y. Changes in local travel behaviour before and during the COVID-19 pandemic in Hong Kong. Cities 2021, 112, 103139. [Google Scholar] [CrossRef]


| Personal Characteristics | Before the COVID-19 Pandemic (2019 and Earlier) | During the COVID-19 Pandemic | |||
|---|---|---|---|---|---|
| Definition | Variable | Definition | Variable | Definition | Variable |
| Occupation | Professor | Inter mode choice (Independent) | Private vehicle | Inter mode choice (Independent) | Private vehicle |
| Student studying | Taxi | Taxi | |||
| Graduate student | Bus | Bus | |||
| Staff | Subway | Subway | |||
| Study/work length | No. year | Active | Active | ||
| Trip distance | No. Km | Intra mode choice | Personal car | Intra mode choice | Personal car |
| Living | Urban/suburb | Taxi | Taxi | ||
| Age | No. year | Bus | Bus | ||
| Field of activity | Engineering | Bike | Bike | ||
| Science | On foot | On foot | |||
| Humanities | Motorcycle | Motorcycle | |||
| Office work | Second destination | Shopping centers | Visit | Similar to before pandemic | |
| Degree | PhD | Restaurant | Yes, once a week | ||
| Master’s | Library | Yes, more than once a month | |||
| Bachelor | Religious centers | Yes, once a month | |||
| Gender | Male/female | Other | Rarely, less than once a month | ||
| Car permit | Entrance permit | No, I meet my needs virtually | |||
| Parking permit | No, I did not need it | ||||
| None | Changing destination | Yes, it has changed | |||
| Parking | Inside the university, near the destination | No, it is the same as before the pandemic | |||
| Parking (near the door) | Second destination | Cultural department | |||
| Outside the university | Library | ||||
| Mode change time | Less than 5 min | Educational department | |||
| 5–10 min | Official department | ||||
| 10–15 min | Student department | ||||
| More than 15 min | |||||
| Variable | % | Number | ||
|---|---|---|---|---|
| Occupation | Professor | 7.4 | 48 | |
| Student | 84.1 | 544 | ||
| Staff | 7.6 | 49 | ||
| Other | 0.9 | 6 | ||
| Education | Students | PhD | 6.2 | 40 |
| Master | 15.9 | 103 | ||
| Bachelor | 61.7 | 399 | ||
| Professor/Staff | 15.0 | 97 | ||
| Other | 1.2 | 8 | ||
| Gender | Female | 58.0 | 375 | |
| Male | 41.3 | 267 | ||
| Other | 0.8 | 5 | ||
| Age | 18–24 | 64.8 | 419 | |
| 24–30 | 13.0 | 84 | ||
| 30–36 | 5.3 | 34 | ||
| 36–42 | 4.3 | 28 | ||
| 42–48 | 5.3 | 34 | ||
| >48 | 3.4 | 22 | ||
| Other | 4.0 | 26 | ||
| Accommodation | On campus | 27.0 | 175 | |
| Urban | 53.9 | 349 | ||
| Suburb | 15.8 | 102 | ||
| Other | 3.2 | 21 | ||
| Study/work zone | Engineering | 33.69 | 218 | |
| Science | 18.24 | 118 | ||
| Humanities | 41.42 | 268 | ||
| Office | 4.02 | 26 | ||
| Other | 2.63 | 17 | ||
| Inter | Intra | ||||||||
|---|---|---|---|---|---|---|---|---|---|
| Before the Pandemic | Before the Pandemic | ||||||||
| Bus (%) | Private Vehicle (%) | Taxi (%) | Subway (%) | Active (%) | Bus (%) | Private Vehicle (%) | Taxi (%) | Active (%) | |
| Professor | 10 | 68 | 11 | 5 | 6 | 42 | 39 | 2 | 17 |
| Student | 44 | 16 | 13 | 20 | 7 | 62 | 5 | 2 | 30 |
| Staff | 11 | 69 | 8 | 11 | 2 | 48 | 34 | 3 | 16 |
| PhD | 38 | 30 | 13 | 18 | 3 | 61 | 11 | 5 | 24 |
| Master’s | 42 | 21 | 16 | 18 | 4 | 62 | 7 | 2 | 29 |
| Bachelor | 45 | 14 | 12 | 21 | 8 | 62 | 5 | 2 | 31 |
| Female | 42 | 20 | 13 | 20 | 5 | 61 | 8 | 3 | 28 |
| Male | 33 | 31 | 11 | 16 | 9 | 55 | 16 | 1 | 28 |
| Shopping | 31 | 28 | 13 | 16 | 12 | 50 | 16 | 2 | 32 |
| Restaurant | 41 | 20 | 13 | 20 | 7 | 56 | 9 | 2 | 32 |
| Library | 41 | 17 | 13 | 21 | 7 | 55 | 9 | 2 | 34 |
| Religious | 43 | 21 | 13 | 21 | 3 | 54 | 10 | 2 | 34 |
| Official | 8 | 52 | 16 | 16 | 8 | 47 | 35 | 3 | 15 |
| Fun and sports | 35 | 27 | 12 | 12 | 15 | 53 | 15 | 3 | 30 |
| Same as before pandemic | 33 | 32 | 14 | 16 | 5 | 55 | 17 | 2 | 25 |
| Cultural department | 20 | 25 | 20 | 25 | 10 | 55 | 9 | 0 | 36 |
| Library | 58 | 8 | 0 | 33 | 0 | 74 | 0 | 0 | 26 |
| Educational Department | 43 | 17 | 17 | 12 | 12 | 57 | 10 | 2 | 31 |
| Inter | Intra | ||||||||
|---|---|---|---|---|---|---|---|---|---|
| During the Pandemic | During the Pandemic | ||||||||
| Bus (%) | Private Vehicle (%) | Taxi (%) | Subway (%) | Active (%) | Bus (%) | Private Vehicle (%) | Taxi (%) | Active (%) | |
| Professor | 9 | 80 | 0 | 2 | 9 | 3 | 65 | 6 | 26 |
| Student | 17 | 38 | 24 | 15 | 6 | 19 | 30 | 9 | 42 |
| Staff | 11 | 66 | 11 | 8 | 5 | 8 | 62 | 5 | 25 |
| PhD | 21 | 37 | 21 | 16 | 5 | 21 | 29 | 16 | 34 |
| Master’s | 22 | 38 | 18 | 15 | 6 | 20 | 27 | 13 | 41 |
| Bachelor | 14 | 38 | 27 | 15 | 5 | 19 | 31 | 7 | 43 |
| Female | 18 | 37 | 23 | 17 | 5 | 18 | 30 | 11 | 41 |
| Male | 12 | 57 | 16 | 8 | 7 | 13 | 48 | 5 | 33 |
| Shopping | 11 | 56 | 14 | 10 | 9 | 9 | 48 | 8 | 35 |
| Restaurant | 15 | 43 | 21 | 14 | 6 | 17 | 35 | 8 | 39 |
| Library | 17 | 42 | 20 | 14 | 7 | 16 | 34 | 10 | 40 |
| Religious | 13 | 42 | 23 | 16 | 5 | 17 | 36 | 7 | 41 |
| Official | 20 | 65 | 5 | 5 | 5 | 10 | 62 | 19 | 10 |
| Fun and sports | 0 | 69 | 15 | 8 | 8 | 0 | 50 | 0 | 50 |
| Same as before pandemic | 16 | 47 | 20 | 12 | 5 | 16 | 40 | 8 | 36 |
| Cultural department | 13 | 47 | 7 | 20 | 13 | 0 | 44 | 13 | 44 |
| Library | 4 | 13 | 46 | 25 | 13 | 26 | 16 | 0 | 58 |
| Educational Department | 19 | 47 | 23 | 7 | 5 | 21 | 33 | 8 | 38 |
| Duration | Before the Pandemic * | During the Pandemic ** | |||||||||
|---|---|---|---|---|---|---|---|---|---|---|---|
| Mode Choice | Private Vehicle | Taxi | Bus | Subway | Active | Private Vehicle | Taxi | Bus | Subway | Active | |
| Variable | Symbol | - | - | - | - | - | - | - | - | - | - |
| Constant | - | −0.66 | −1.8 | ||||||||
| Gender | A | 1.3133 | |||||||||
| Age | B | 0.532 | |||||||||
| Being Staff | C | 1.001 | 2.3266 | ||||||||
| Destination: Engineering | D | −1.9907 | |||||||||
| Destination: Humanities | E | −1.884 | |||||||||
| Studying Master | F | 0.4695 | |||||||||
| Attendance history (year) | G | 0.1986 | |||||||||
| Destination: Official | H | 1.5963 | |||||||||
| Intra mode (walk) | I | 1.6328 | 0.6067 | ||||||||
| Intra mode (bike) | J | 3.8006 | |||||||||
| Distance from origin | K | 0.0381 | −0.1601 | −0.0574 | |||||||
| Origin within urban | L | 0.6875 | 0.8484- | −1.0093 | −1.7996 | ||||||
| Car permit (none) | M | 1.2706 | 2.8278 | ||||||||
| Walking time (mode change) | N | 0.4989 | 0.3607 | −0.7001 | −0.5312 | ||||||
| Intra mode (taxi) | O | 1.6267 | −2.2161 | −2.0268 | |||||||
| Intra mode (motorcycle) | P | 1.5846 | |||||||||
| Parking (inside) | Q | 1.9416 | |||||||||
| Intra mode (car) | R | 0.9329 | −1.3307 | ||||||||
Disclaimer/Publisher’s Note: The statements, opinions and data contained in all publications are solely those of the individual author(s) and contributor(s) and not of MDPI and/or the editor(s). MDPI and/or the editor(s) disclaim responsibility for any injury to people or property resulting from any ideas, methods, instructions or products referred to in the content. |
© 2023 by the authors. Licensee MDPI, Basel, Switzerland. This article is an open access article distributed under the terms and conditions of the Creative Commons Attribution (CC BY) license (https://creativecommons.org/licenses/by/4.0/).
Share and Cite
Naaman, A.; Shiran, G.; Alavi, M.; Pirdavani, A. Dynamics of Campus Travel Behavior under the COVID-19 Pandemic. Future Transp. 2023, 3, 1085-1107. https://doi.org/10.3390/futuretransp3030060
Naaman A, Shiran G, Alavi M, Pirdavani A. Dynamics of Campus Travel Behavior under the COVID-19 Pandemic. Future Transportation. 2023; 3(3):1085-1107. https://doi.org/10.3390/futuretransp3030060
Chicago/Turabian StyleNaaman, Ali, Gholamreza Shiran, Maryam Alavi, and Ali Pirdavani. 2023. "Dynamics of Campus Travel Behavior under the COVID-19 Pandemic" Future Transportation 3, no. 3: 1085-1107. https://doi.org/10.3390/futuretransp3030060