1. Introduction
Over the last decade, cities have been transitioning from traditional mobility to Mobility as a Service (MaaS). MaaS is the integration of and access to different transport services, such as public transport, ride/car/bike/scooter sharing, taxis, car rental and ride-hailing, among others, in a single digital mobility service based on active mobility and an efficient public transport system [
1].
While the goal of MaaS is to offer passengers a seamless, end-to-end and easily accessible journey, one of its key enablers is the ticketing [
2]. The passenger experience of ticket purchase should be flexible, seamless and based on real-time information.
The ticketing service in MaaS should integrate the public and individual transport modes together with the billing platforms into a unified ticketing service.
If the ticketing experience is realized on everyone’s personal smartphone, passengers could receive a consolidated bill for their monthly/weekly use of the unified transport network without even having to buy a ticket. To realize this concept, it is necessary to develop a seamless identification of the transport modes used, based on commercially available smartphones.
In the literature, there are approaches to realize the seamless identification of the transport modes used based on smartphones. For example, reading a QR code that identifies the transport mode when hopping in and out of the vehicle is a possible implementation of smartphone-based ticketing [
3]. However, this solution relies either on the good will of the passengers when reading the QR code with the smartphone or the existence of a controller in the transport mode.
Other implementations of ticketing with smartphones involve the use of Near-Field Communication (NFC) devices [
4]. This implementation implies the use of check-in and check-out terminals that are able to determine the duration of the journey. The NFC terminals are normally placed outside the transport mode, beside turnstiles or gates.
Unlike the above mentioned solutions, a seamless identification of the used transport mode for ticketing is possible based on the use of Global Navigation Satellite Systems (GNSSs) [
5]. This implementation uses the position and velocity information from satellite systems to identify the transport mode that is being used and the journey that has been traveled. Nevertheless, the GNSS position and velocity can be forged with spoofing attacks, for instance, to avoid or modify the billing. Additionally, there are plenty of urban scenarios with no satellite reception, such as stations.
As the identification of transport modes should be used for billing, resilience is of high importance. Resilience is the ability of the ticketing system to recover from a malicious attack and provide correct identification of transport modes throughout the journey.
Depending on the particular technology used to identify the transport mode with the smartphone, the system might be to a greater or lesser extent vulnerable to attacks. We will focus on the smartphone-based identification of transport modes without the use of external infrastructure, such as QR codes or NFC devices. As described above, one of the most extended methods to identify the transport mode with the smartphone is to use the position and the velocity provided by GNSSs.
The identification of transport modes purely or mainly based on GNSSs is vulnerable to jamming and spoofing attacks. The jamming attack consists on an intentional interference with enough power to force the receiver to lose the legitimate GNSS signal.
The spoofing attack consists of making the receiver believe it is positioned at a different place than it is actually located and eventually that it is moving with a wrong velocity. This attack is a common practice in the military context. However, the civilian context is not left out, e.g., for criminal purposes, such as defeating automated payment systems, violating a forbidden fishing zone or cheating on the driving hours of truck drivers.
Therefore, the spoofing attacks represent a major issue for the functioning of ticketing systems, since a faulty navigation signal can be transmitted to one or some smartphones. To do this, the receiver of the smartphone has to unlock from the legitimate navigation signal and lock to the faulty navigation signal. The unlock is usually forced through jamming [
6].
The faulty navigation signal can be a real satellite signal recorded with a legitimate GNSS signal, e.g., a replay attack, or a created navigation signal. The replay attack is possible because the integrity and the authentication are checked for the complete message but not for the navigation signal [
7].
The faulty navigation signals can be classified into three categories [
8]:
The signal simulator, which uses GNSS signal simulator software connected to generate a signal undifferentiated from a legitimate signal but not necessarily synchronized with the satellite. The commercial GNSS receivers used in smartphones may be vulnerable to this attack if the power of the faulty navigation signal is higher than the legitimate navigation signal.
The receiver-based spoofer, which follows the above explained principle but takes the faulty navigation signal from a legitimate navigation signal in order to synchronize the attack. This attack is more complex and thus more difficult to detect.
The sophisticated receiver-based spoofer, which is the most complex and effective spoofing attack, since it allows a perfect synchronization between the faulty and the legitimate navigation signal by knowing the receiver position. Nevertheless, this attack is not possible if the exact position of the receiver is unknown, e.g., for moving receivers.
In this work, we present two methods for smartphone-based transport mode identification that are resilient to spoofing attacks using the public transport modes subways, trams and buses and the individual transport modes bicycles and walking. The multisensor-based identification of transport modes relies on smartphones’ embedded sensors to identify the transport mode, as well as on GNSS. The system-under-attack check uses in this case the discrepancies between both sources of information to detect the attack. The only-GNSS-based identification of transport modes relies only on GNSS to identify the transport modes, and the system-under-attack check uses the GNSS clock drift to detect the attack [
9].
We present real measurements recorded with commercial smartphones in Munich (Germany) and Paris (France), to which we add a spoofing attack safely produced in an anechoic chamber. With this work, we therefore put in evidence the vulnerability of the ticketing system against spoofing attacks.
The remaining sections are structured as follows.
Section 2 explains the methodology followed to record the real-world measurements and to generate the attack in an anechoic chamber.
Section 3 is devoted to the presentation of the two novel proposed resilient systems to identify transport modes with commercial smartphones.
Section 4 discusses the results obtained with the two proposed systems to identify transport modes in terms of their resilience. Finally,
Section 5 concludes the paper.
2. Methodology
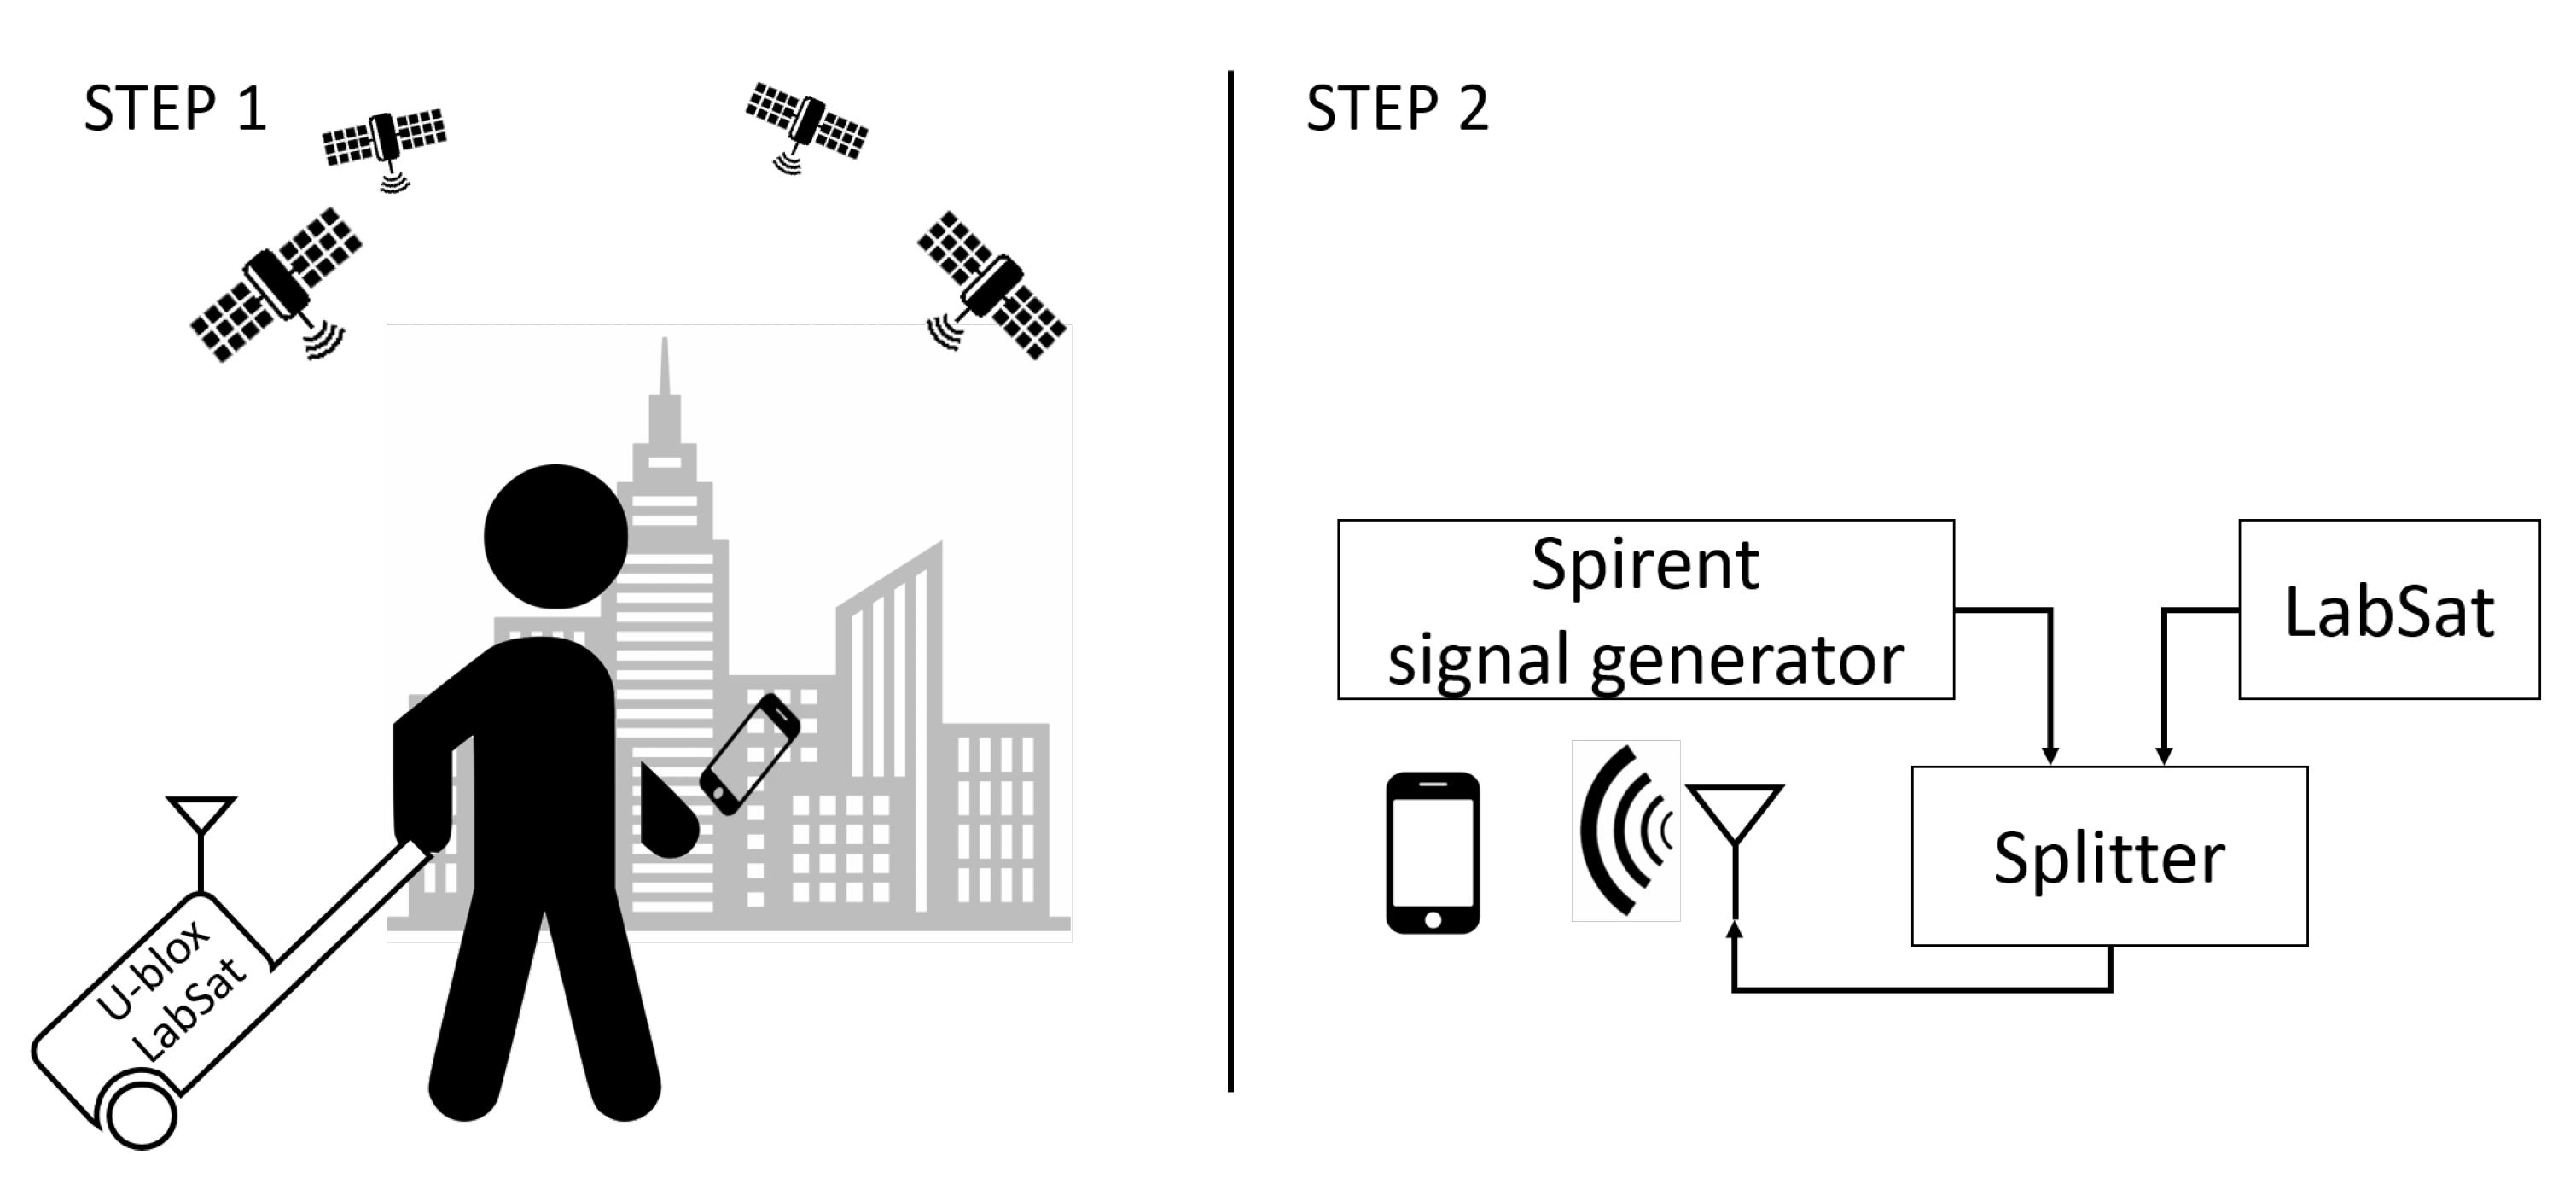
In this section, we present the methodology we followed to record the journeys in Munich and Paris with commercial smartphones and how we generated the spoofing attacks in the anechoic chamber (see
Figure 1).
The data collection is divided into two steps, namely: (1) We collect real measurements with a commercial smartphone during a multimodal journey. The legitimate navigation signal is not only recorded with the smartphone but also with special equipment, which is indicated in the figure above as u-blox and LabSat. (2) In an anechoic chamber, we mix the legitimate navigation signal coming from the LabSat and the faulty navigation signal generated by the Spirent signal generator and record the mix with the smartphone. We then substitute the original GNSS recorded file with the modified GNSS recorded file and associate the latter to the original multisensor file recorded during the journey.
2.1. Step 1: Real-Time Data Collection
We have designed multimodal journeys to cover the following transport modes: buses, trams, subways, walking and bicycles.
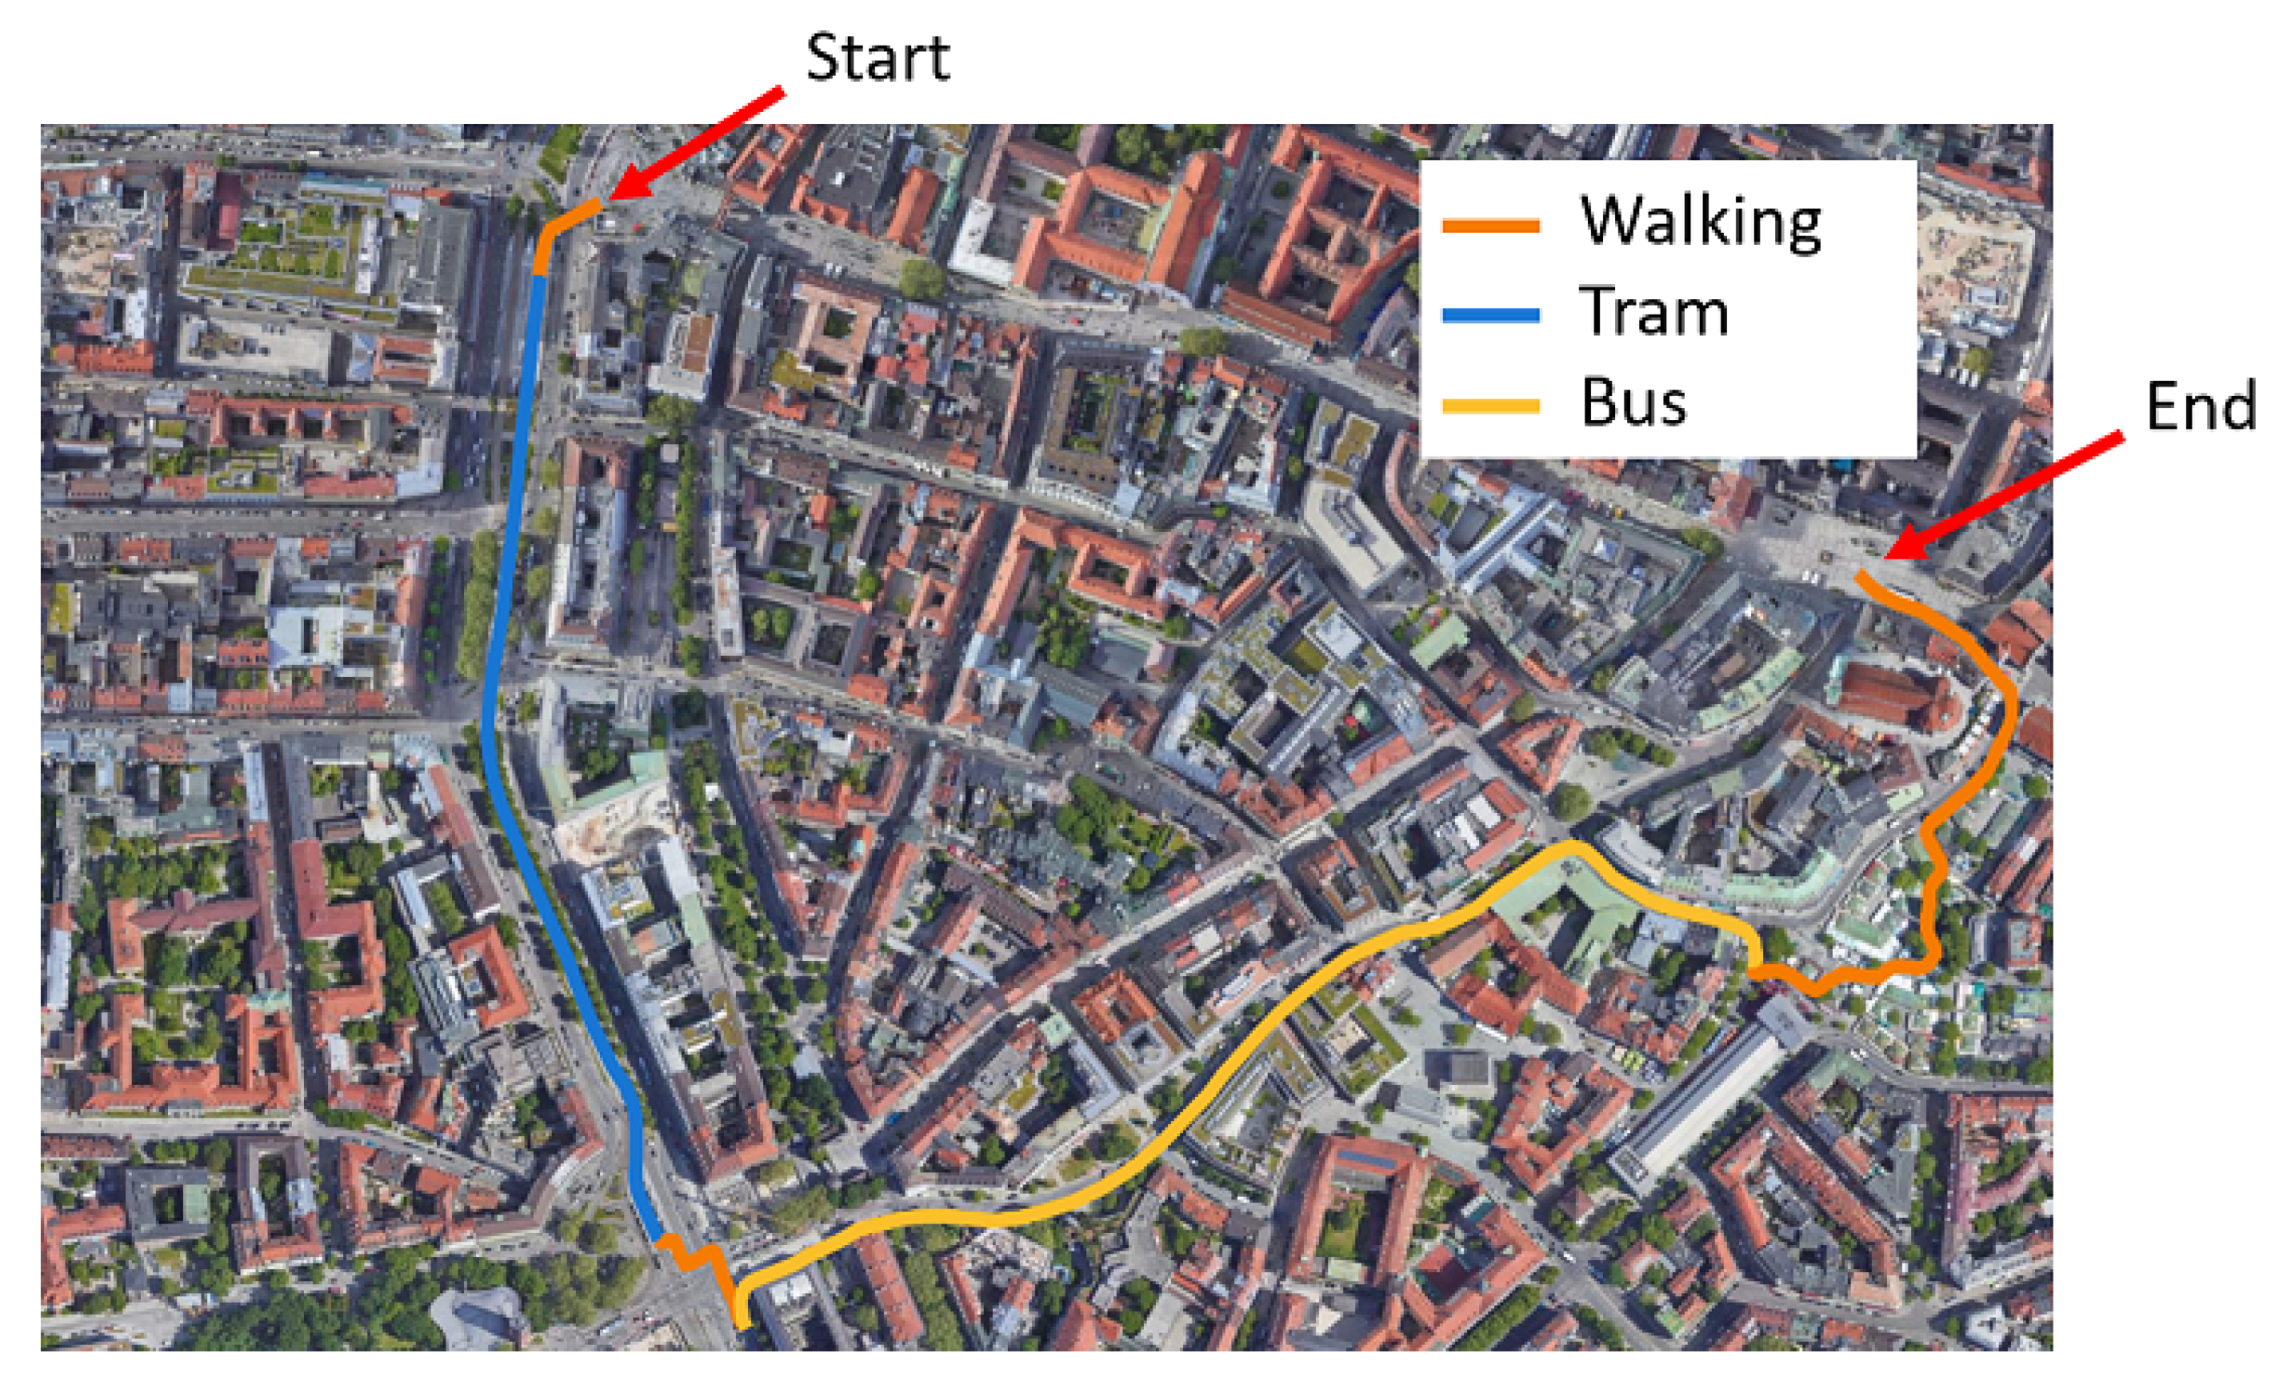
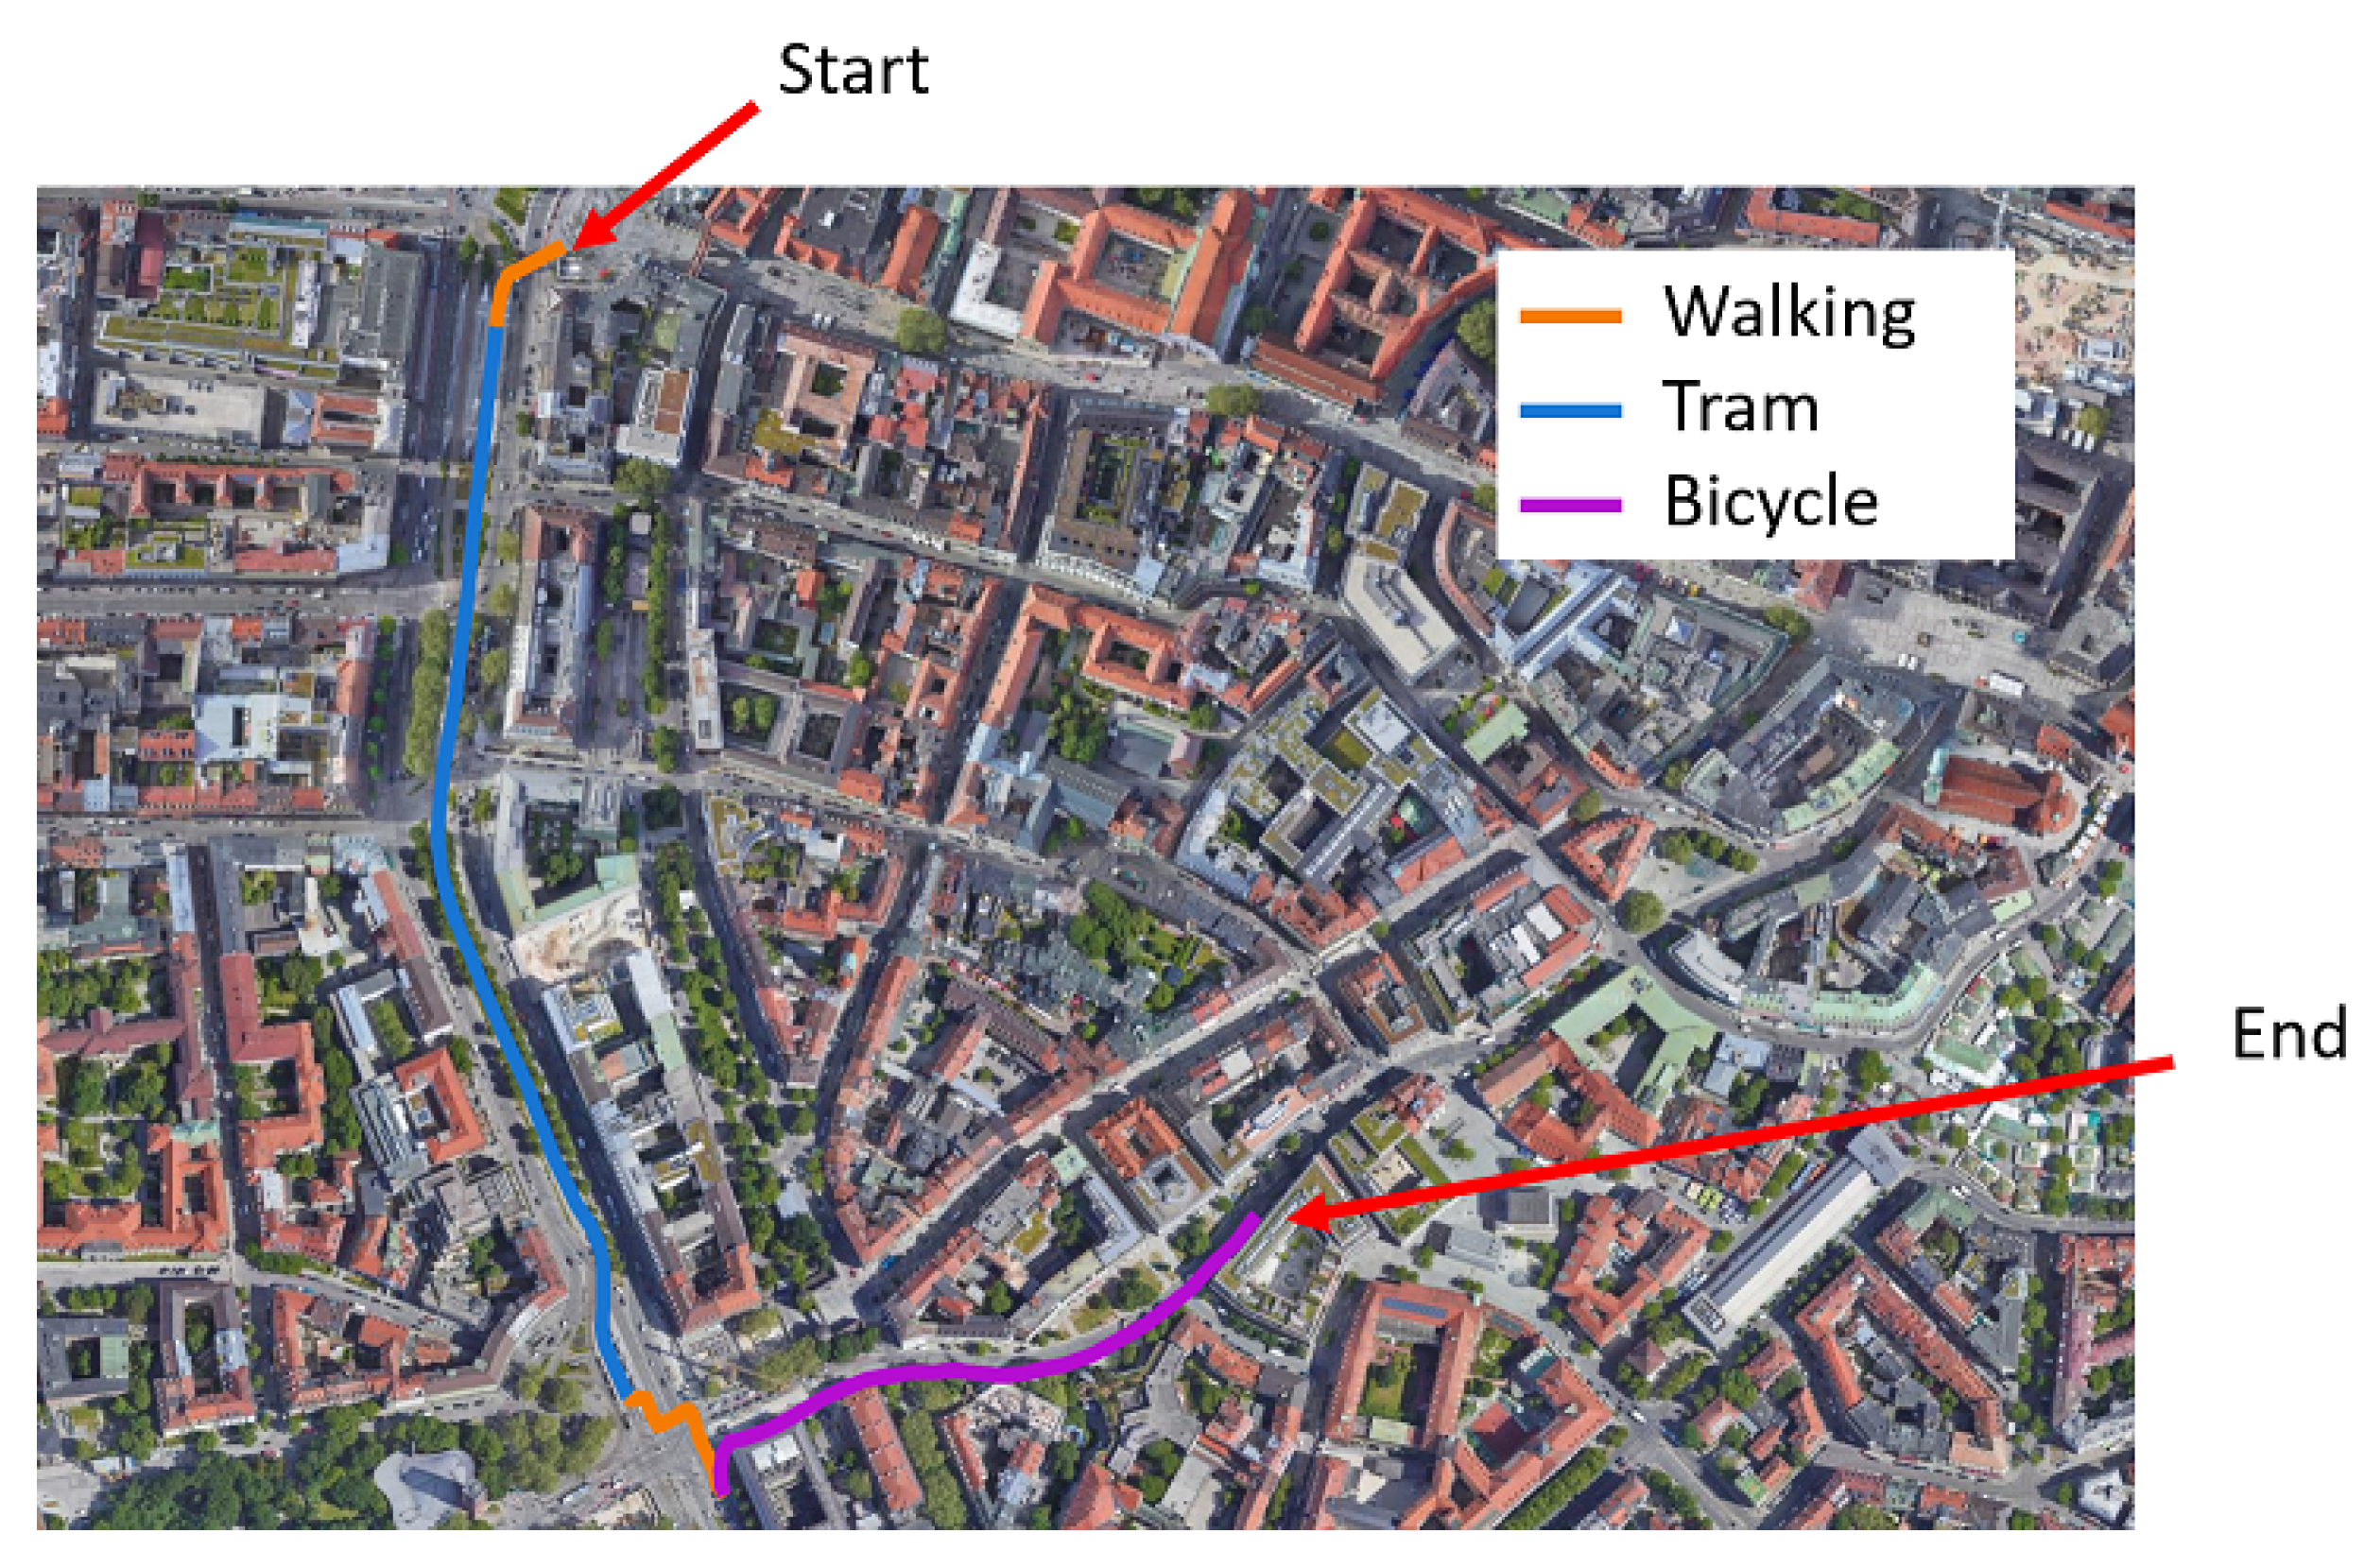
Figure 2 and
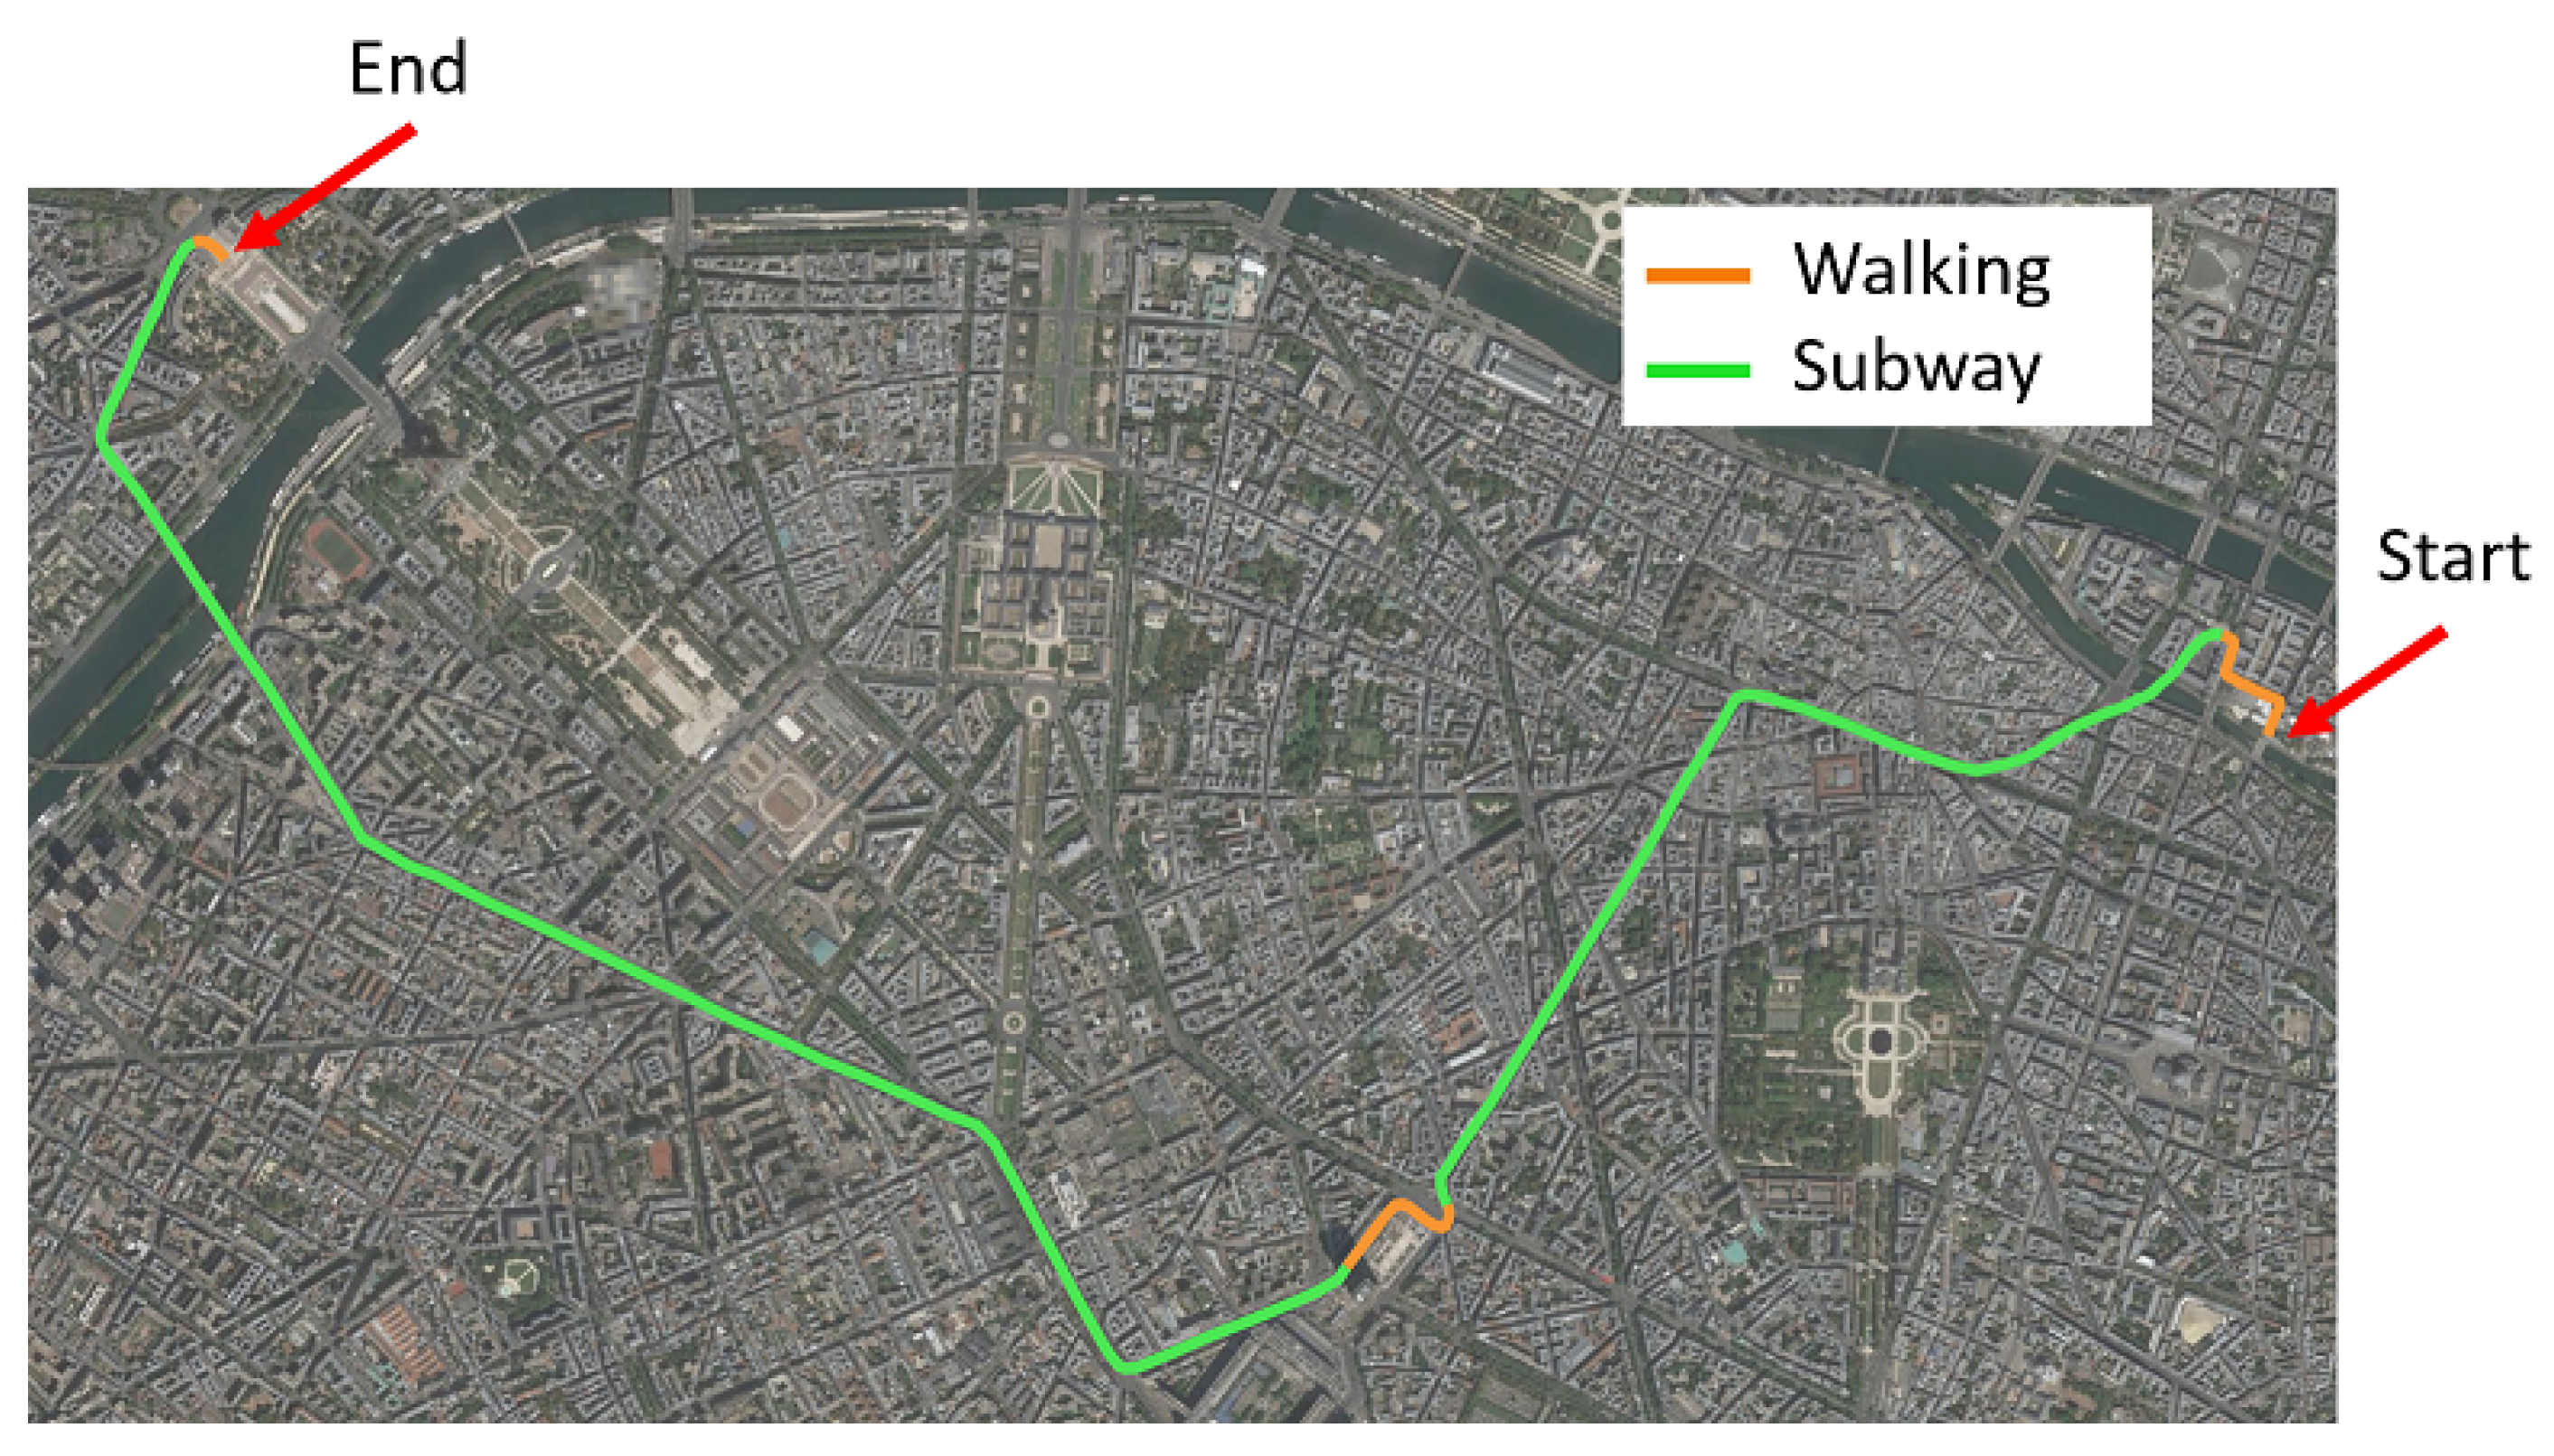
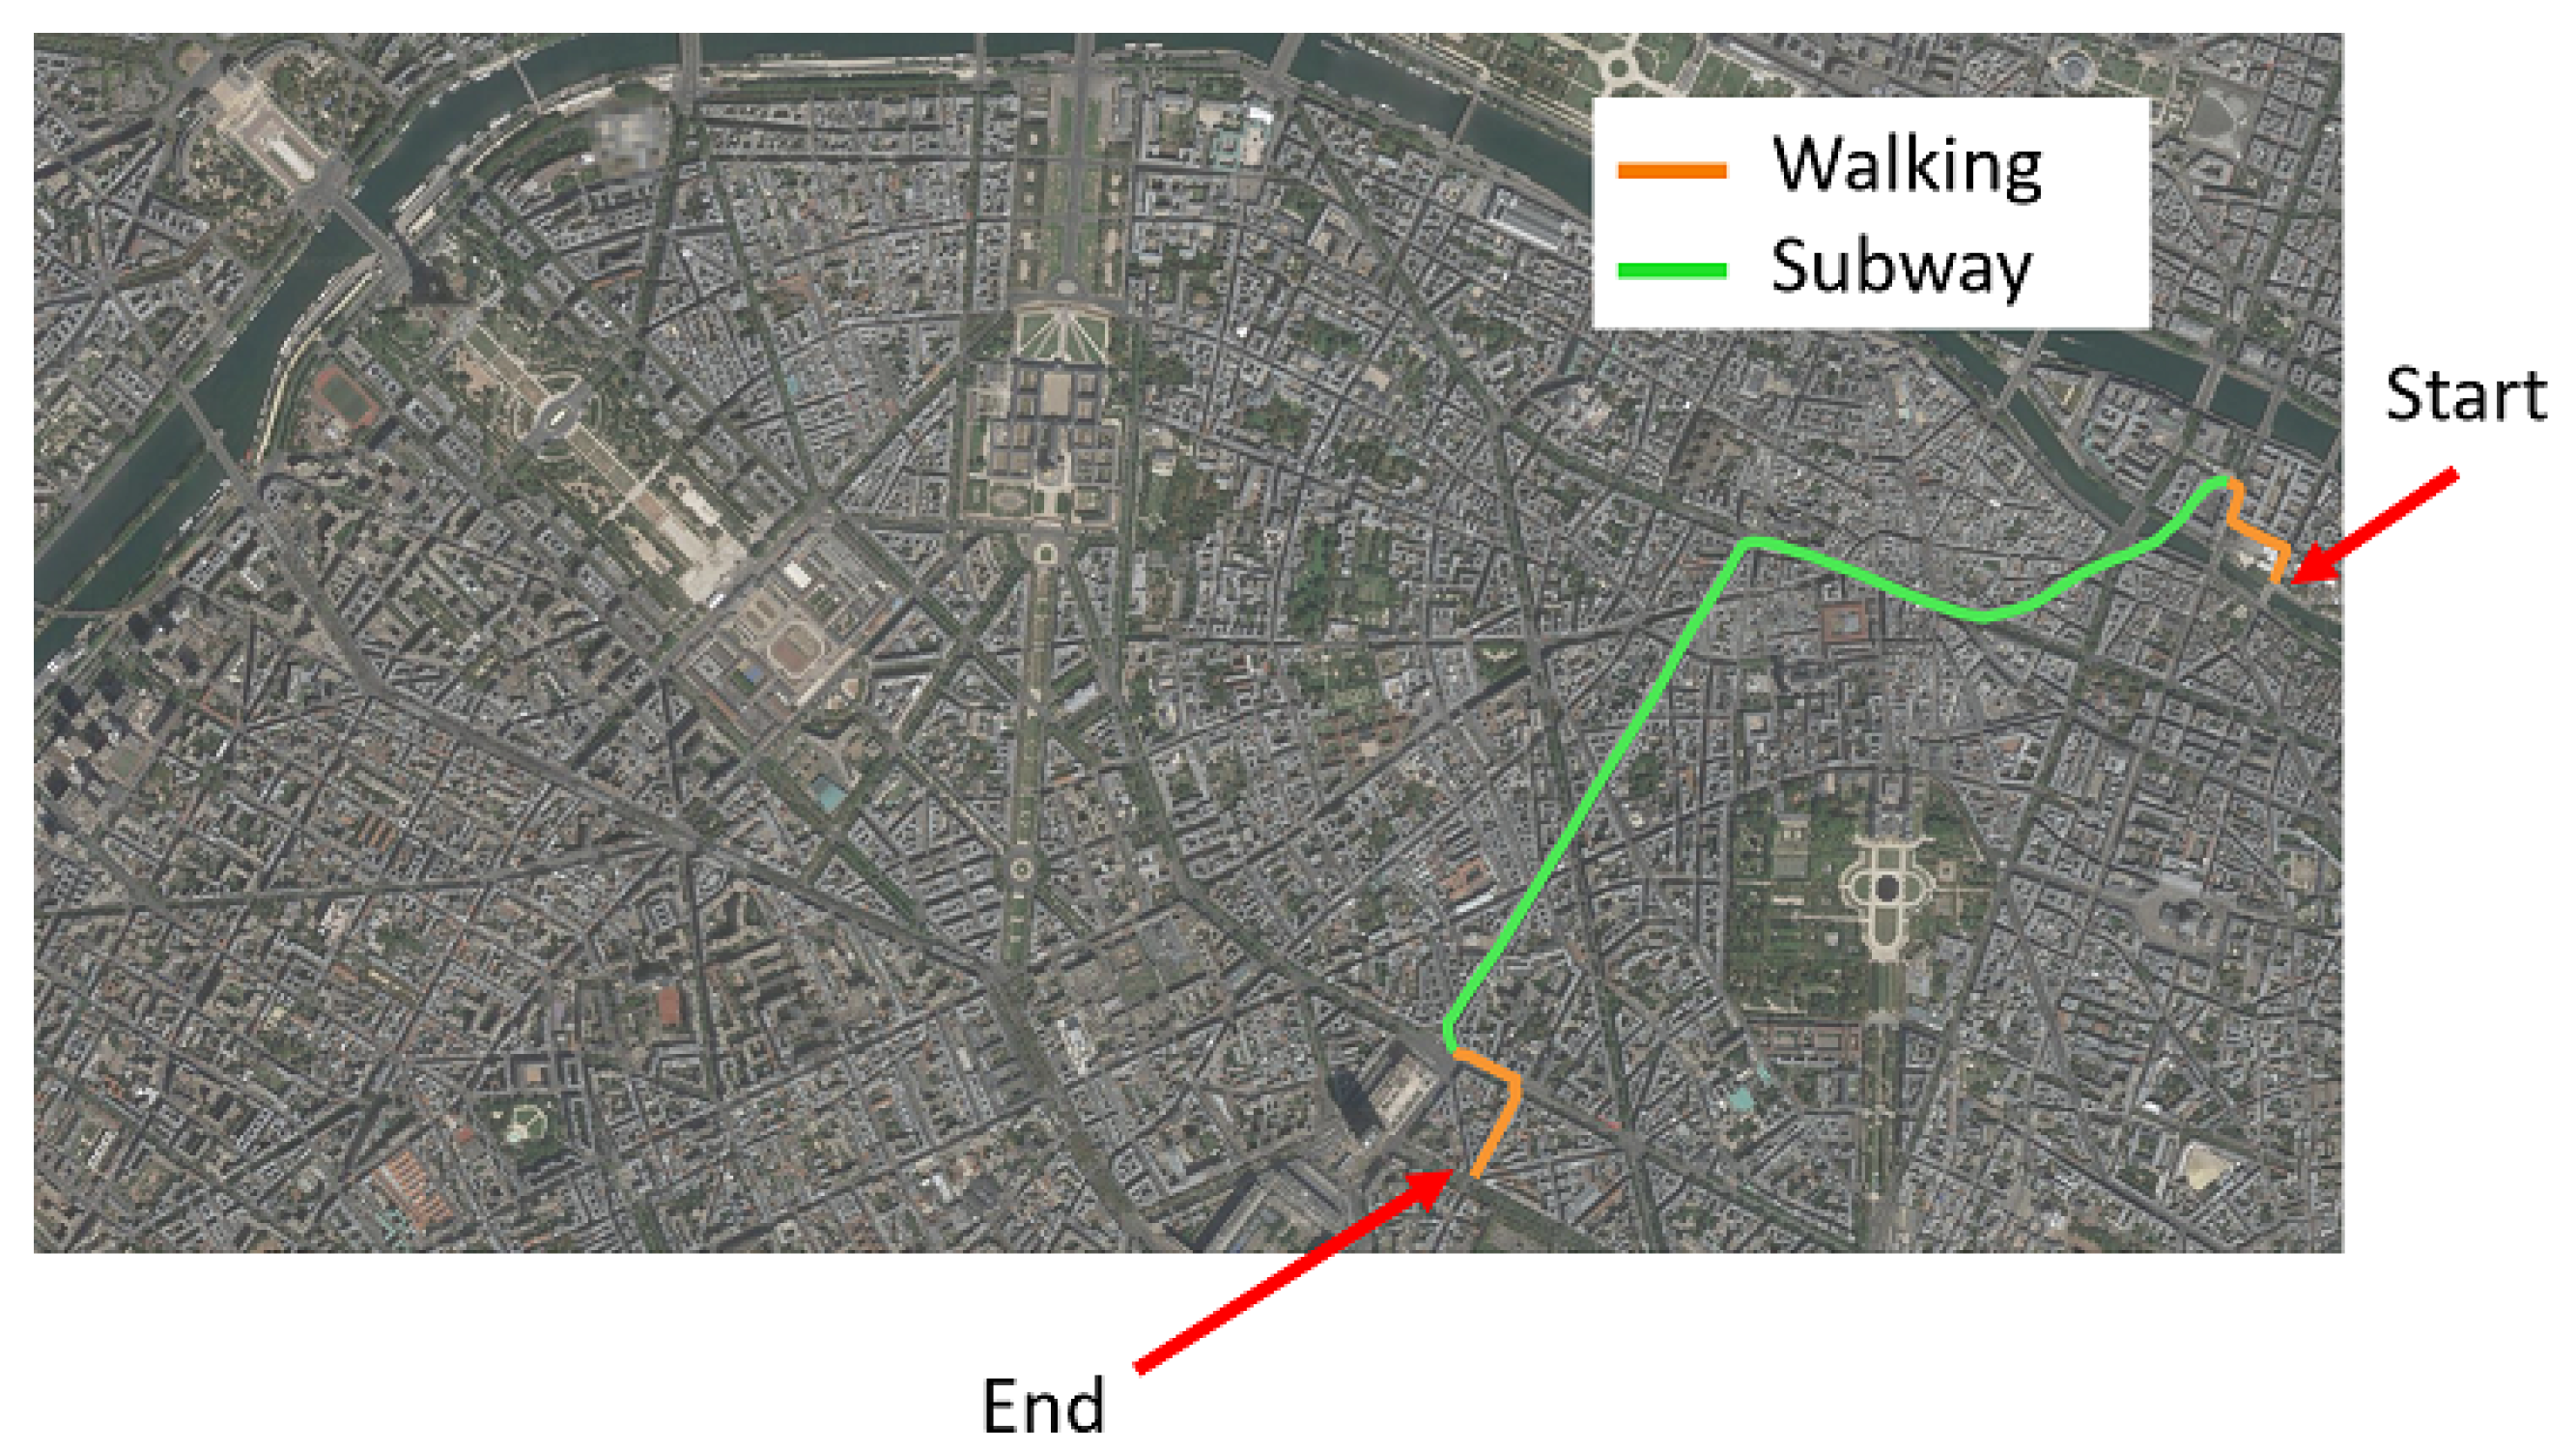
Figure 3 show the trajectories in Munich and Paris, respectively.
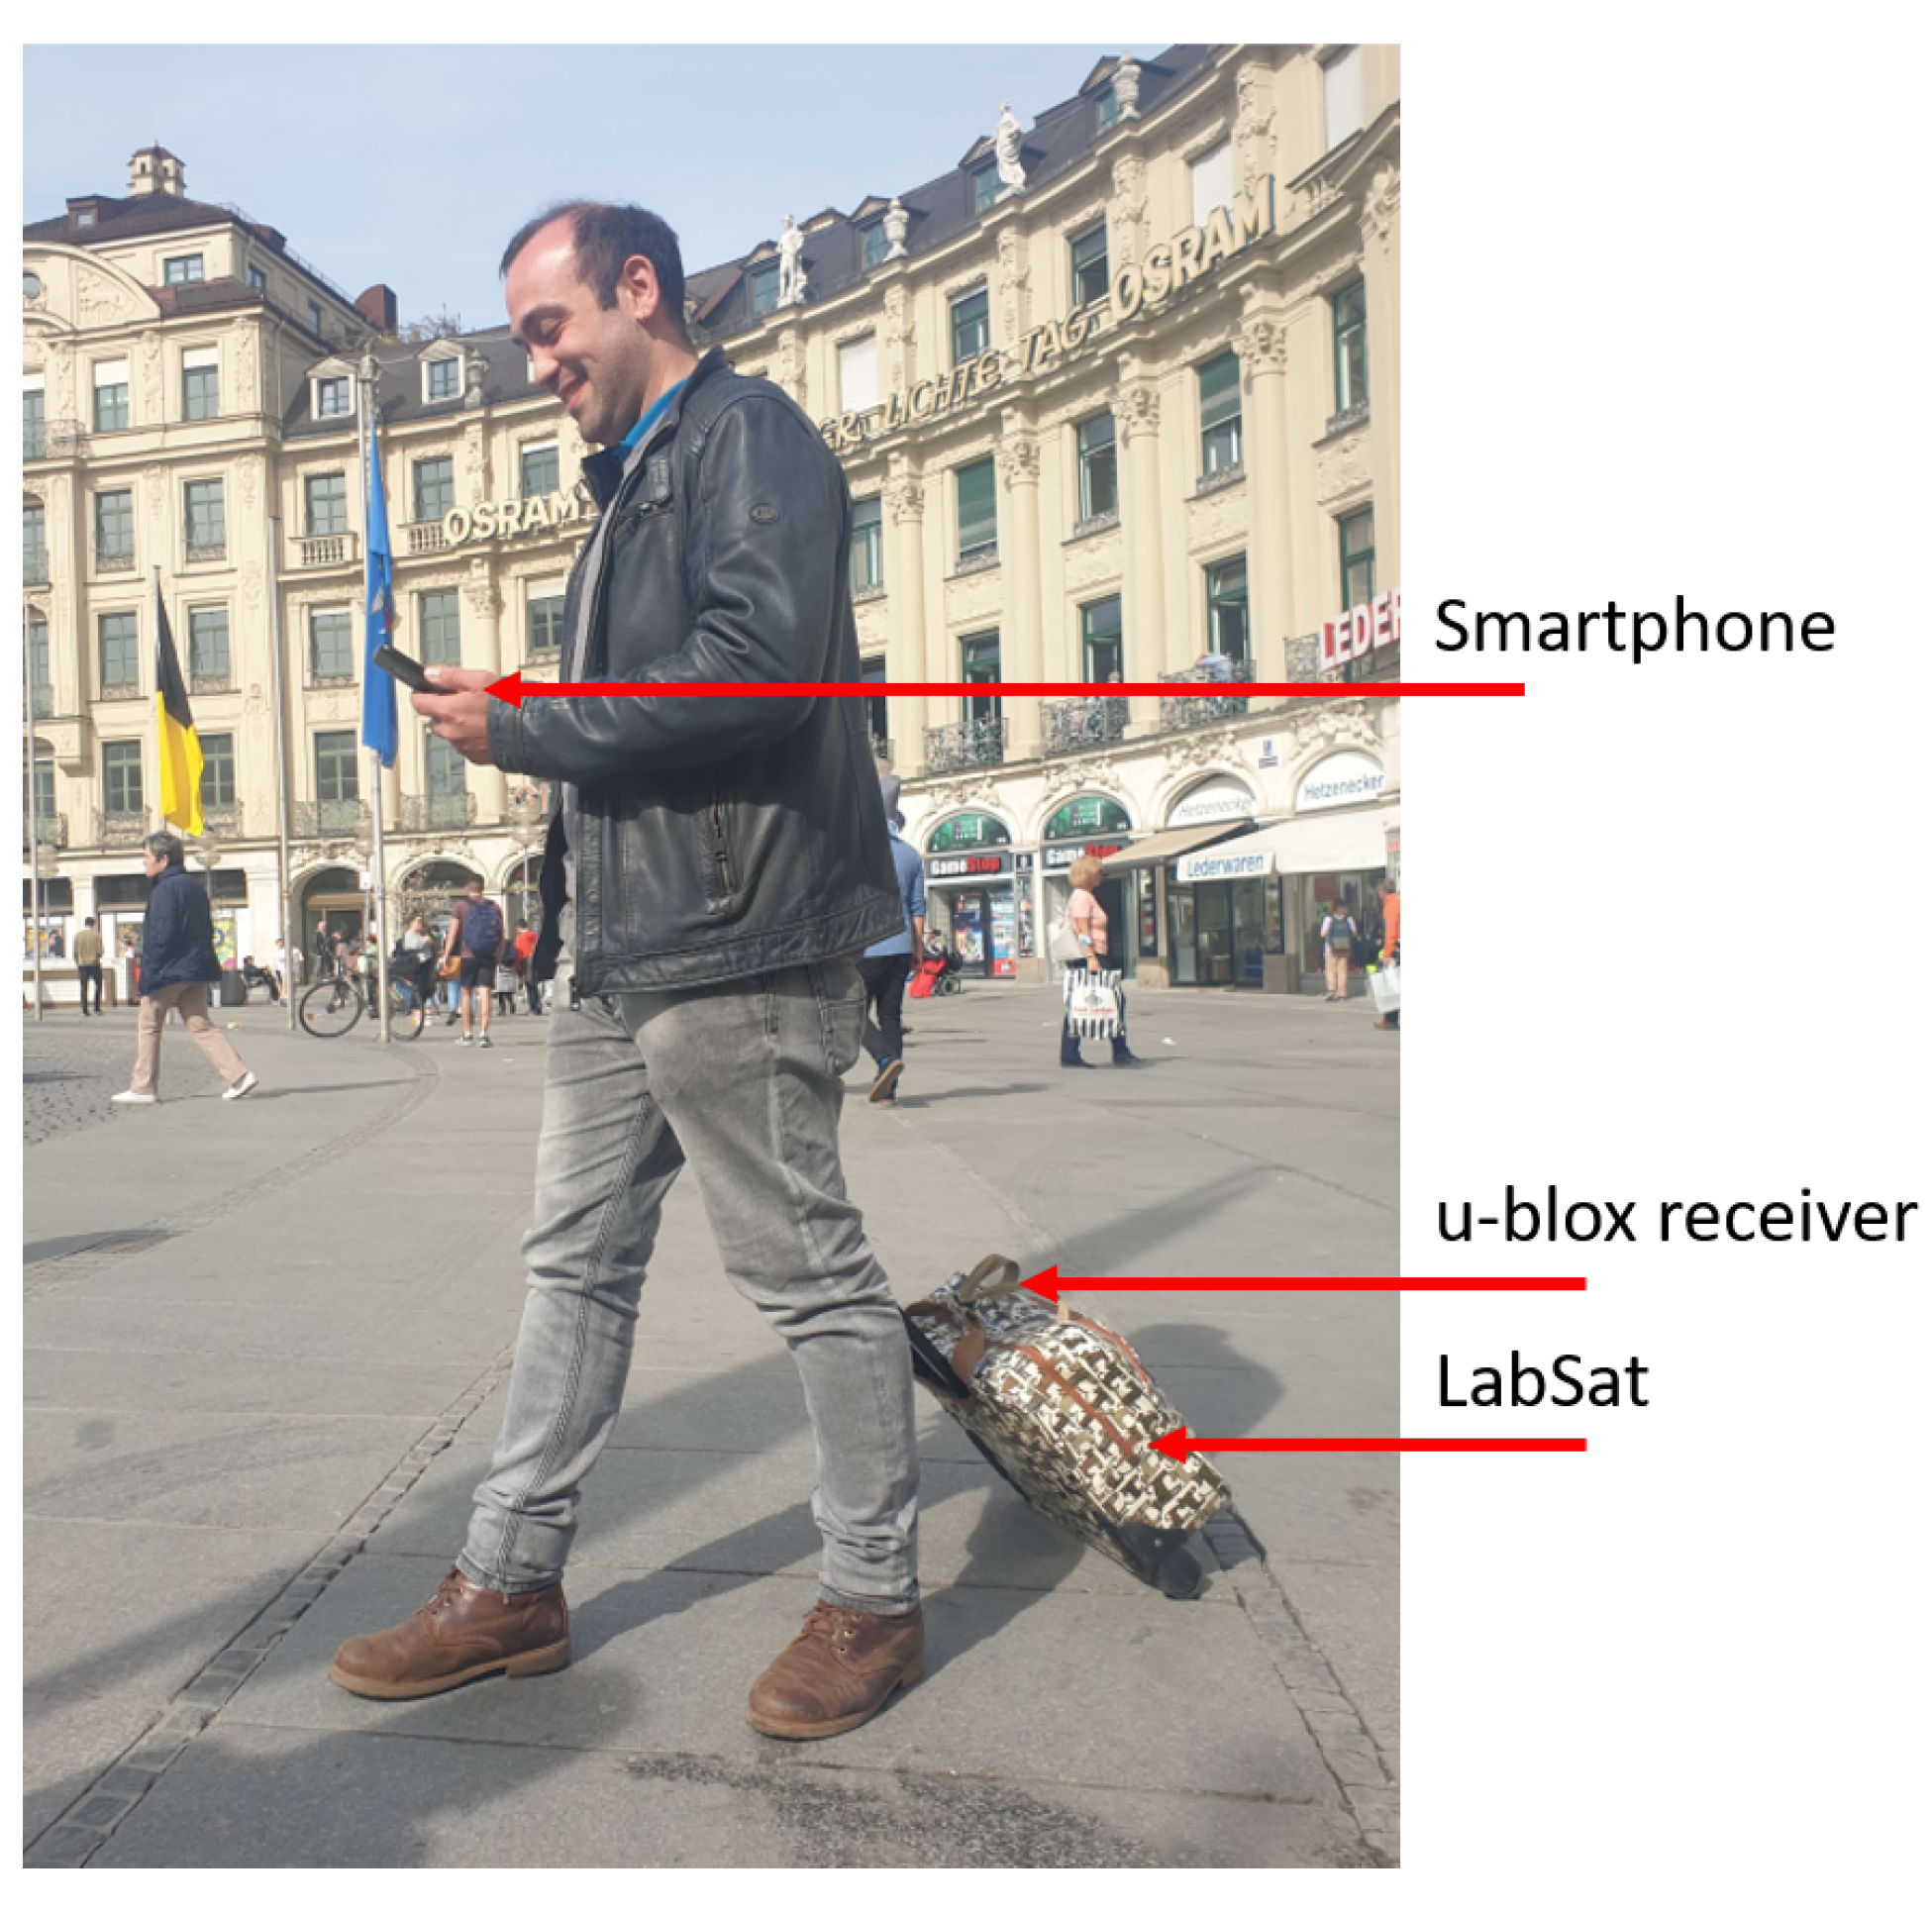
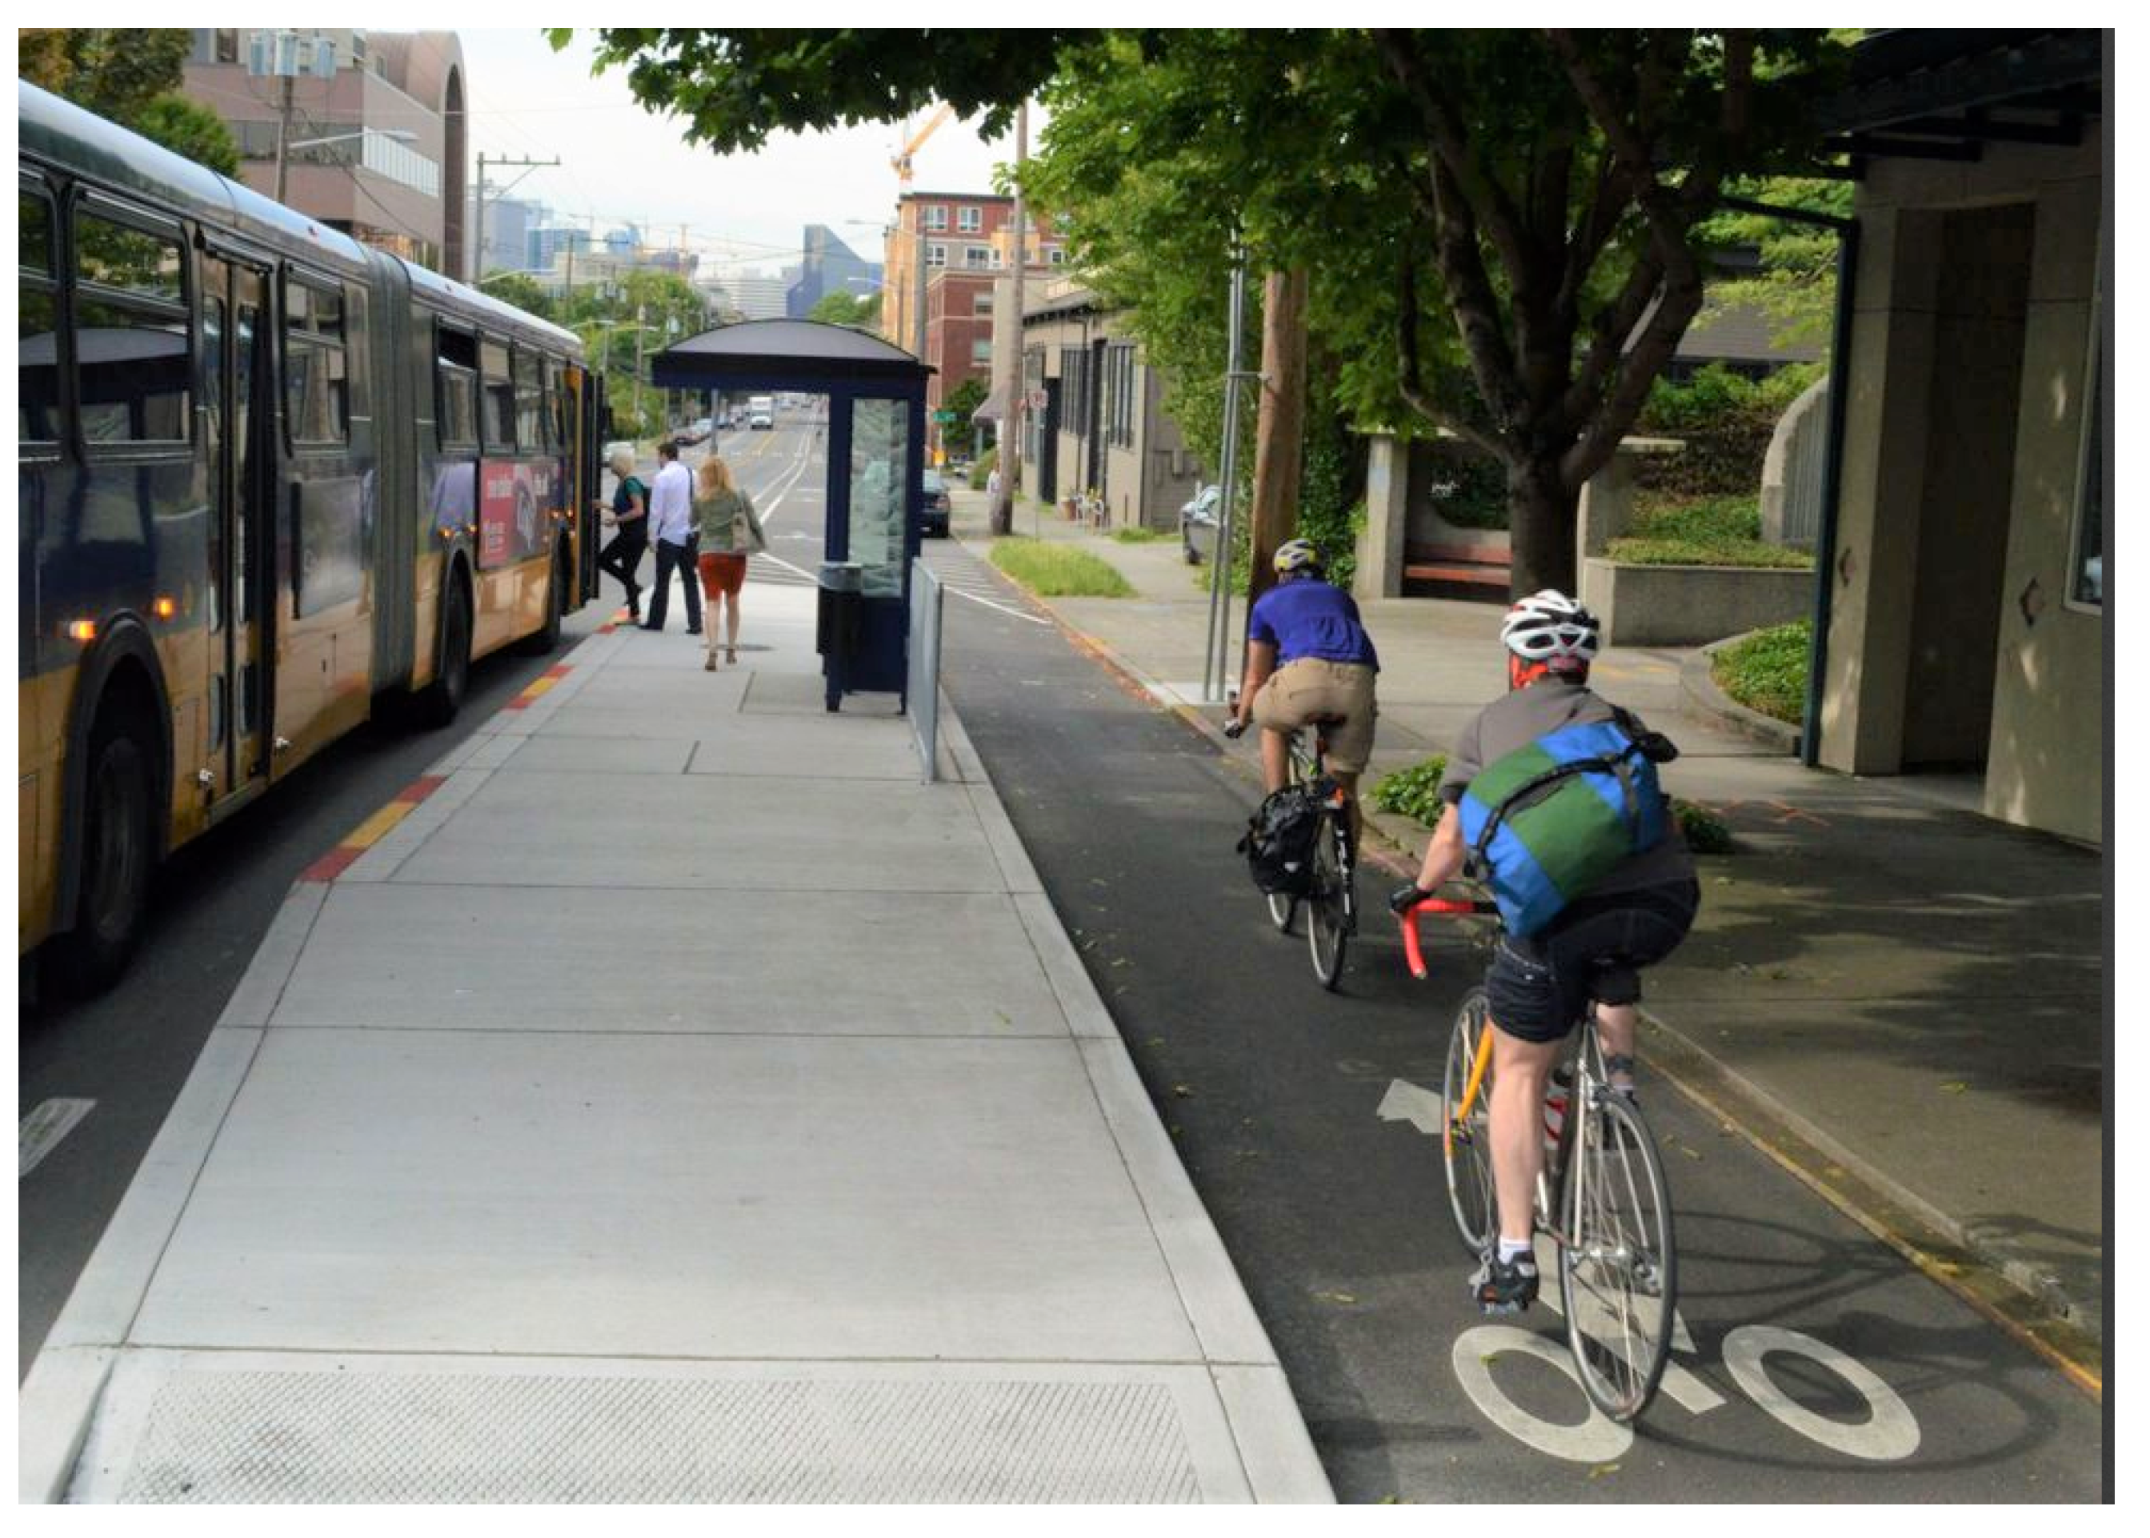
During the above described journeys, the smartphone was held in the hand, as
Figure 4 shows. The journey in Munich takes 36 min and the journey in Paris takes 44 min.
We used a smartphone Samsung Galaxy S20 to record the accelerometer, gyroscope and barometer signals, as well as the GNSS-computed position and velocity during the journeys. In the suitcase, we had a u-blox EVK-M8T (in the following u-blox) and a LabSat 2 (in the following LabSat). We worked with the GPS L1 signal. The LabSat was connected to a power battery of 12 V and 8 Ah and to a computer to be executed, as well as the u-blox.
2.2. Step 2: Generation of the Attack
The spoofing attacks we generated for this work were of the receiver-based spoofer type (see
Section 1). We used a software synchronized by the real satellite constellation and a Spirent GSS6560 (in the following Spirent) connected to a passive GPS L1 antenna to generate the faulty navigation signal. The legitimate satellites’ constellation has been taken from the LabSat.
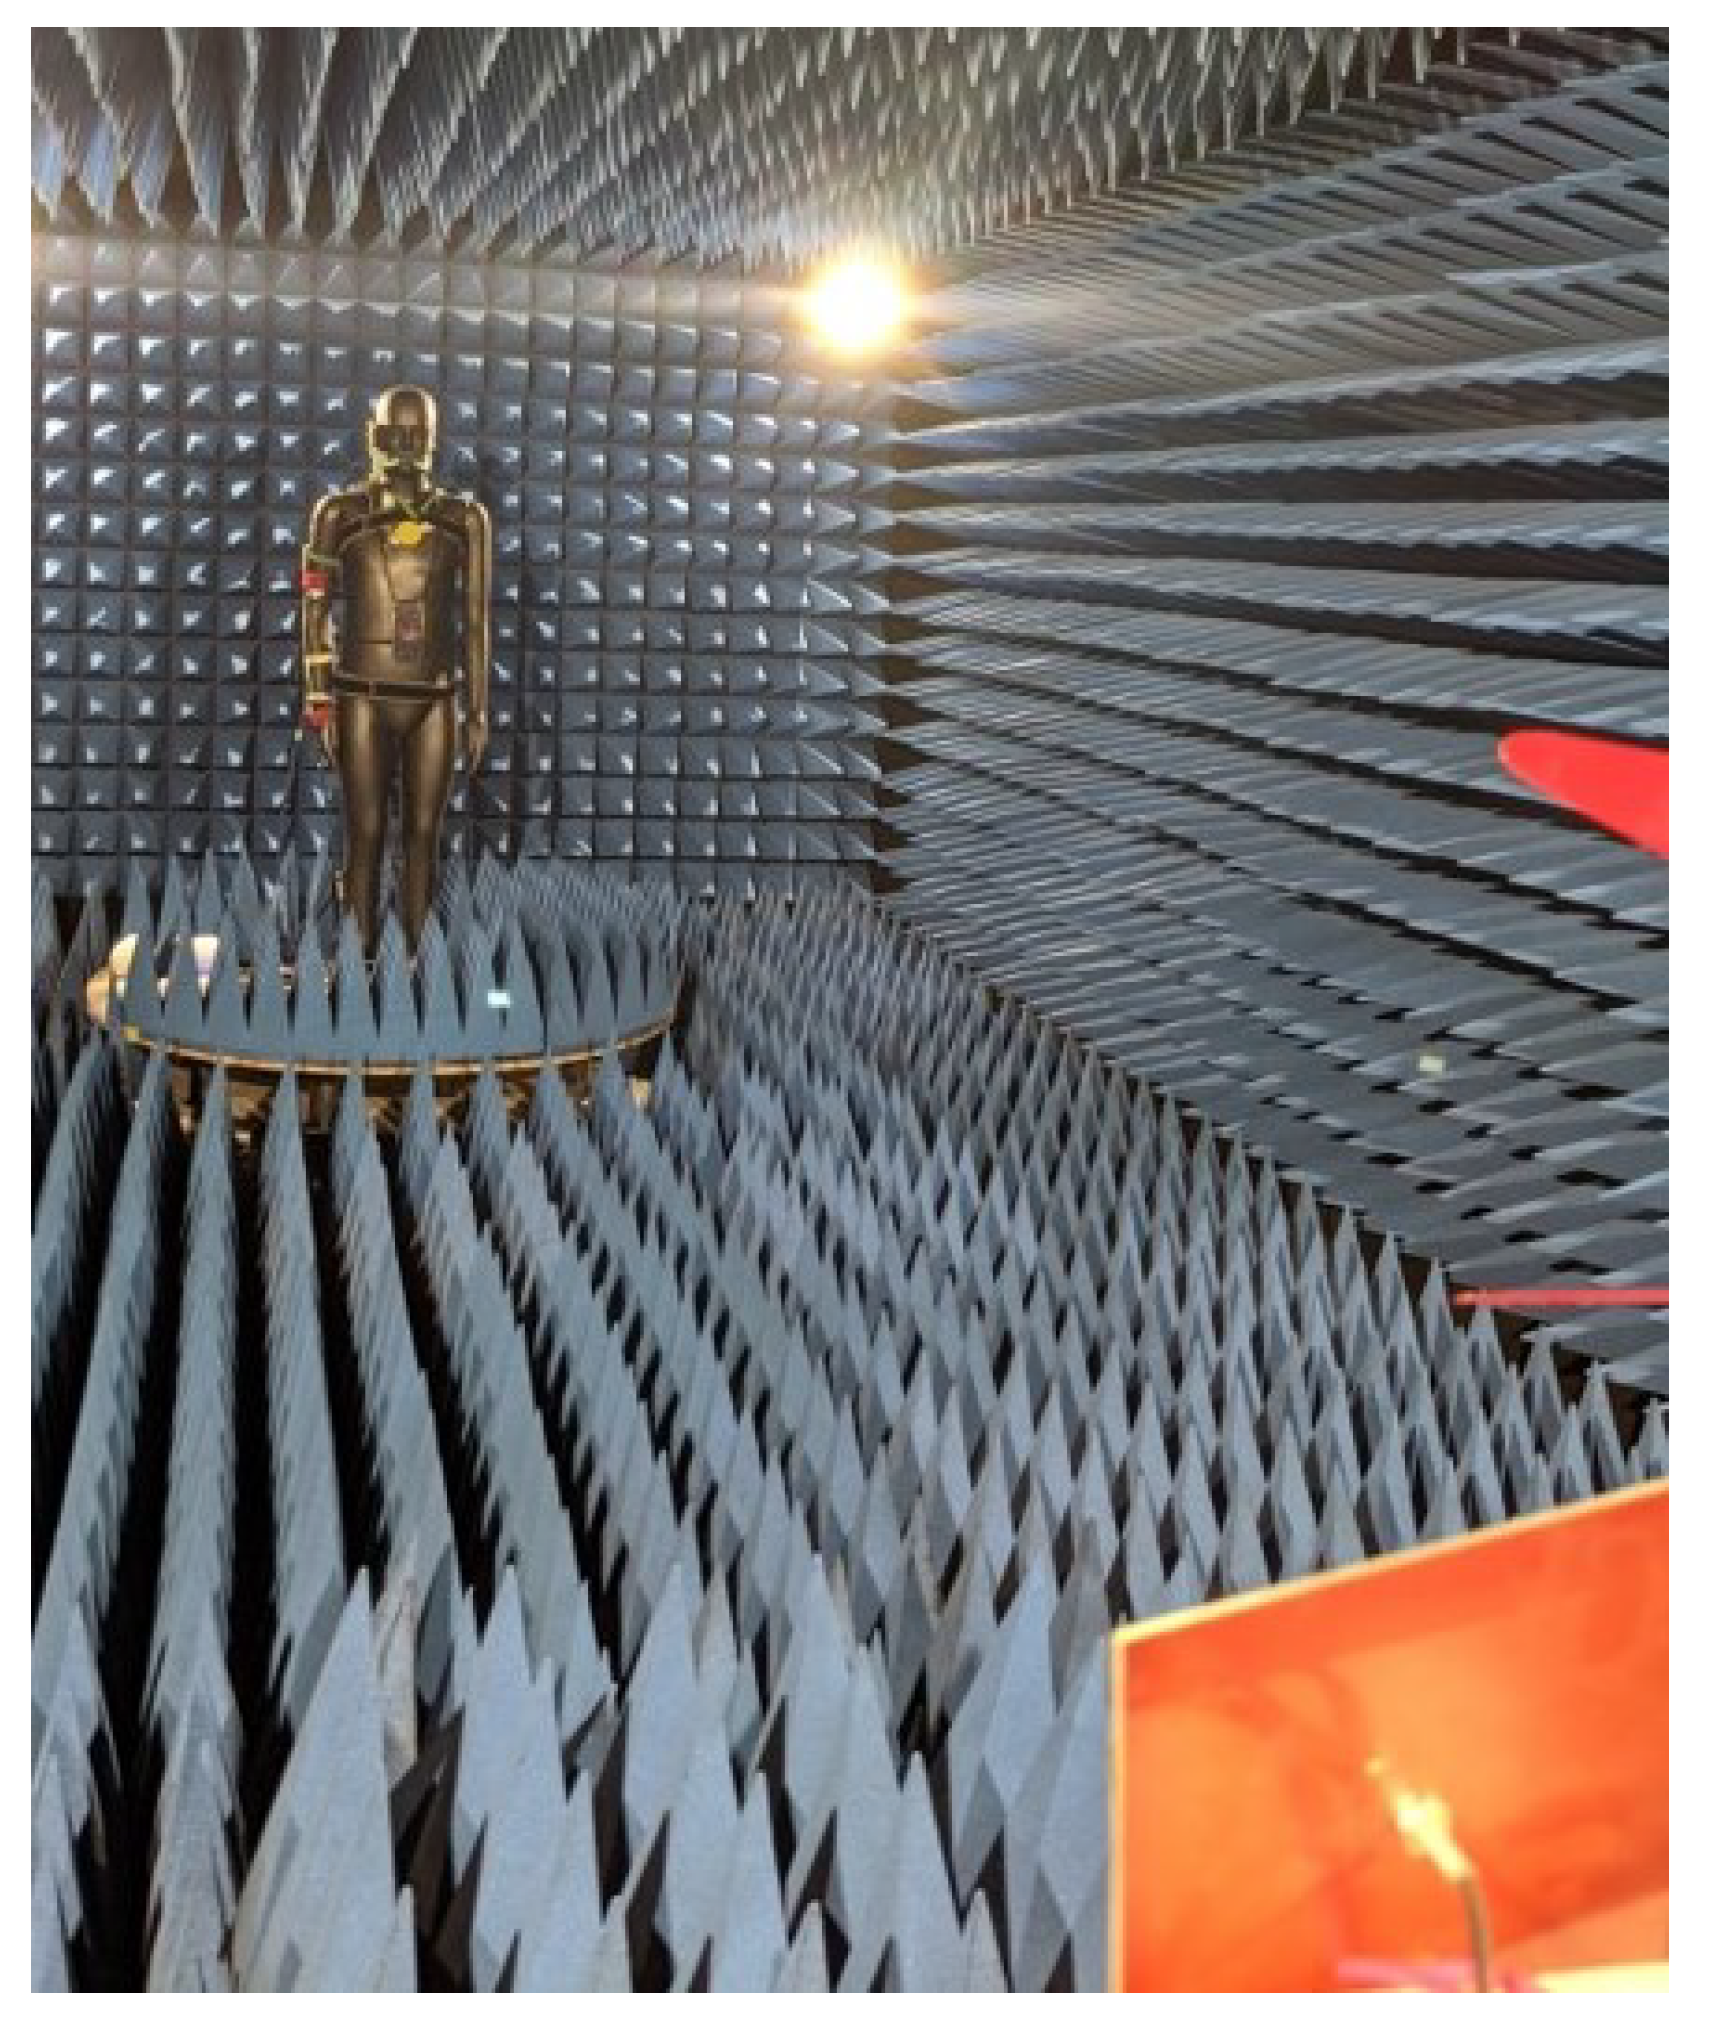
The attacks werecarried out in a post-processing step in an anechoic chamber. An anechoic chamber is an isolated room prepared to avoid the reflection of the electromagnetic waves inside the room (see
Figure 5). We used an anechoic chamber because it is forbidden to radiate in the GNSS band outdoors.
We introduced the attacks during the journeys; that means the journeys contain both legitimate and faulty navigation signals. The legitimate navigation signal was recorded by the LabSat during the data collection, and it is synchronized with the signals recorded by smartphone, e.g., accelerometer, magnetometer and barometer signals. The faulty navigation signal has been synchronized using the legitimate navigation signal and modified with the Spirent.
The faulty and the legitimate navigation signals are combined with a splitter (see
Figure 1). As a control measure, during the attack in the anechoic chamber we measured the carrier-to-noise ratio detected at the smartphone’s place using a u-blox EVK-M8T placed near the smartphone. The carrier-to-noise ratio value is between 20 dB/Hz and 40 dB/Hz, which recreates realistic conditions for the attack.
3. Deceiving the Ticketing System
In this section, we explain the spoofing attacks we prepared for the trajectories depicted in
Figure 2 and
Figure 3 and we present two complementary methods to detect the deceit.
Usually, the methods of identifying transport modes that mainly rely on the GNSS position and velocity provided by the smartphone are prone to confuse transport modes that have similar velocities and move in close spaces with similar trajectories. A well-known challenging case is differentiating buses and bicycles, since the bicycle lanes are usually adjacent and parallel to the bus lanes, as shown in
Figure 6. The accuracy of the GNSS position is degraded in urban scenarios due to multiple paths in urban canyons or scattering originated by the tree leaves, as shown in
Figure 6. Therefore, the delivered position is in many cases not accurate enough to distinguish the bus from the bicycle lanes.
With our recorded journey in Munich shown in
Figure 2, we aim at recreating the aforementioned scenario. Therefore, we spoofed the GNSS’s legitimate navigation signal to make the e-ticketing system believe the passenger did not step on a bus (yellow line in
Figure 2) in Sendlinger Tor, but after leaving the tram she took the bicycle and was driving for a couple of minutes towards Viktualienmarkt over the bicycle lane parallel to the bus lane. Then, the passenger finished her journey. In this case, the bus ticket from Sendlinger Tor to Viktualienmarkt should not be included in the consolidated bill.
Figure 7 shows the modified journey.
Another challenging scenario for the methods for identifying transport modes that mainly rely on GNSS are the stations and the underground transport modes, such as the subway. In these scenarios, the GNSS reception is either highly degraded or not available. With our recorded journey in Paris shown in
Figure 3, we aim at deceiving the e-ticketing system by making it believe the passenger did not commute in Montparnasse from Metro 4 to Metro 6 and continued until Trocadero, but she finished her journey in Montparnasse, went out of the station and walked until her destiny. In this case, the subway ticket corresponding to Metro 6 should not be included in the consolidated bill.
Figure 8 shows the modified journey.
3.1. Multisensor-Based Transport Mode Identification
In this section, we present a unique method designed to detect attacks to the satellite signal that induce errors in the transport mode identification. Existing solutions use the position and the velocity provided by GNSSs to identify the transport mode [
5]. The position and velocity can also be used as input for artificial intelligence [
10] or machine learning algorithms [
11]. Other existing solutions combine GNSSs with information about the traffic network, such as surrounding railway or bus stops, to identify the transport mode [
12]. Lastly, there are multisensor solutions that do not use GNSSs, such as [
13], which uses accelerometer and magnetometer data processed with a convolutional neural network.
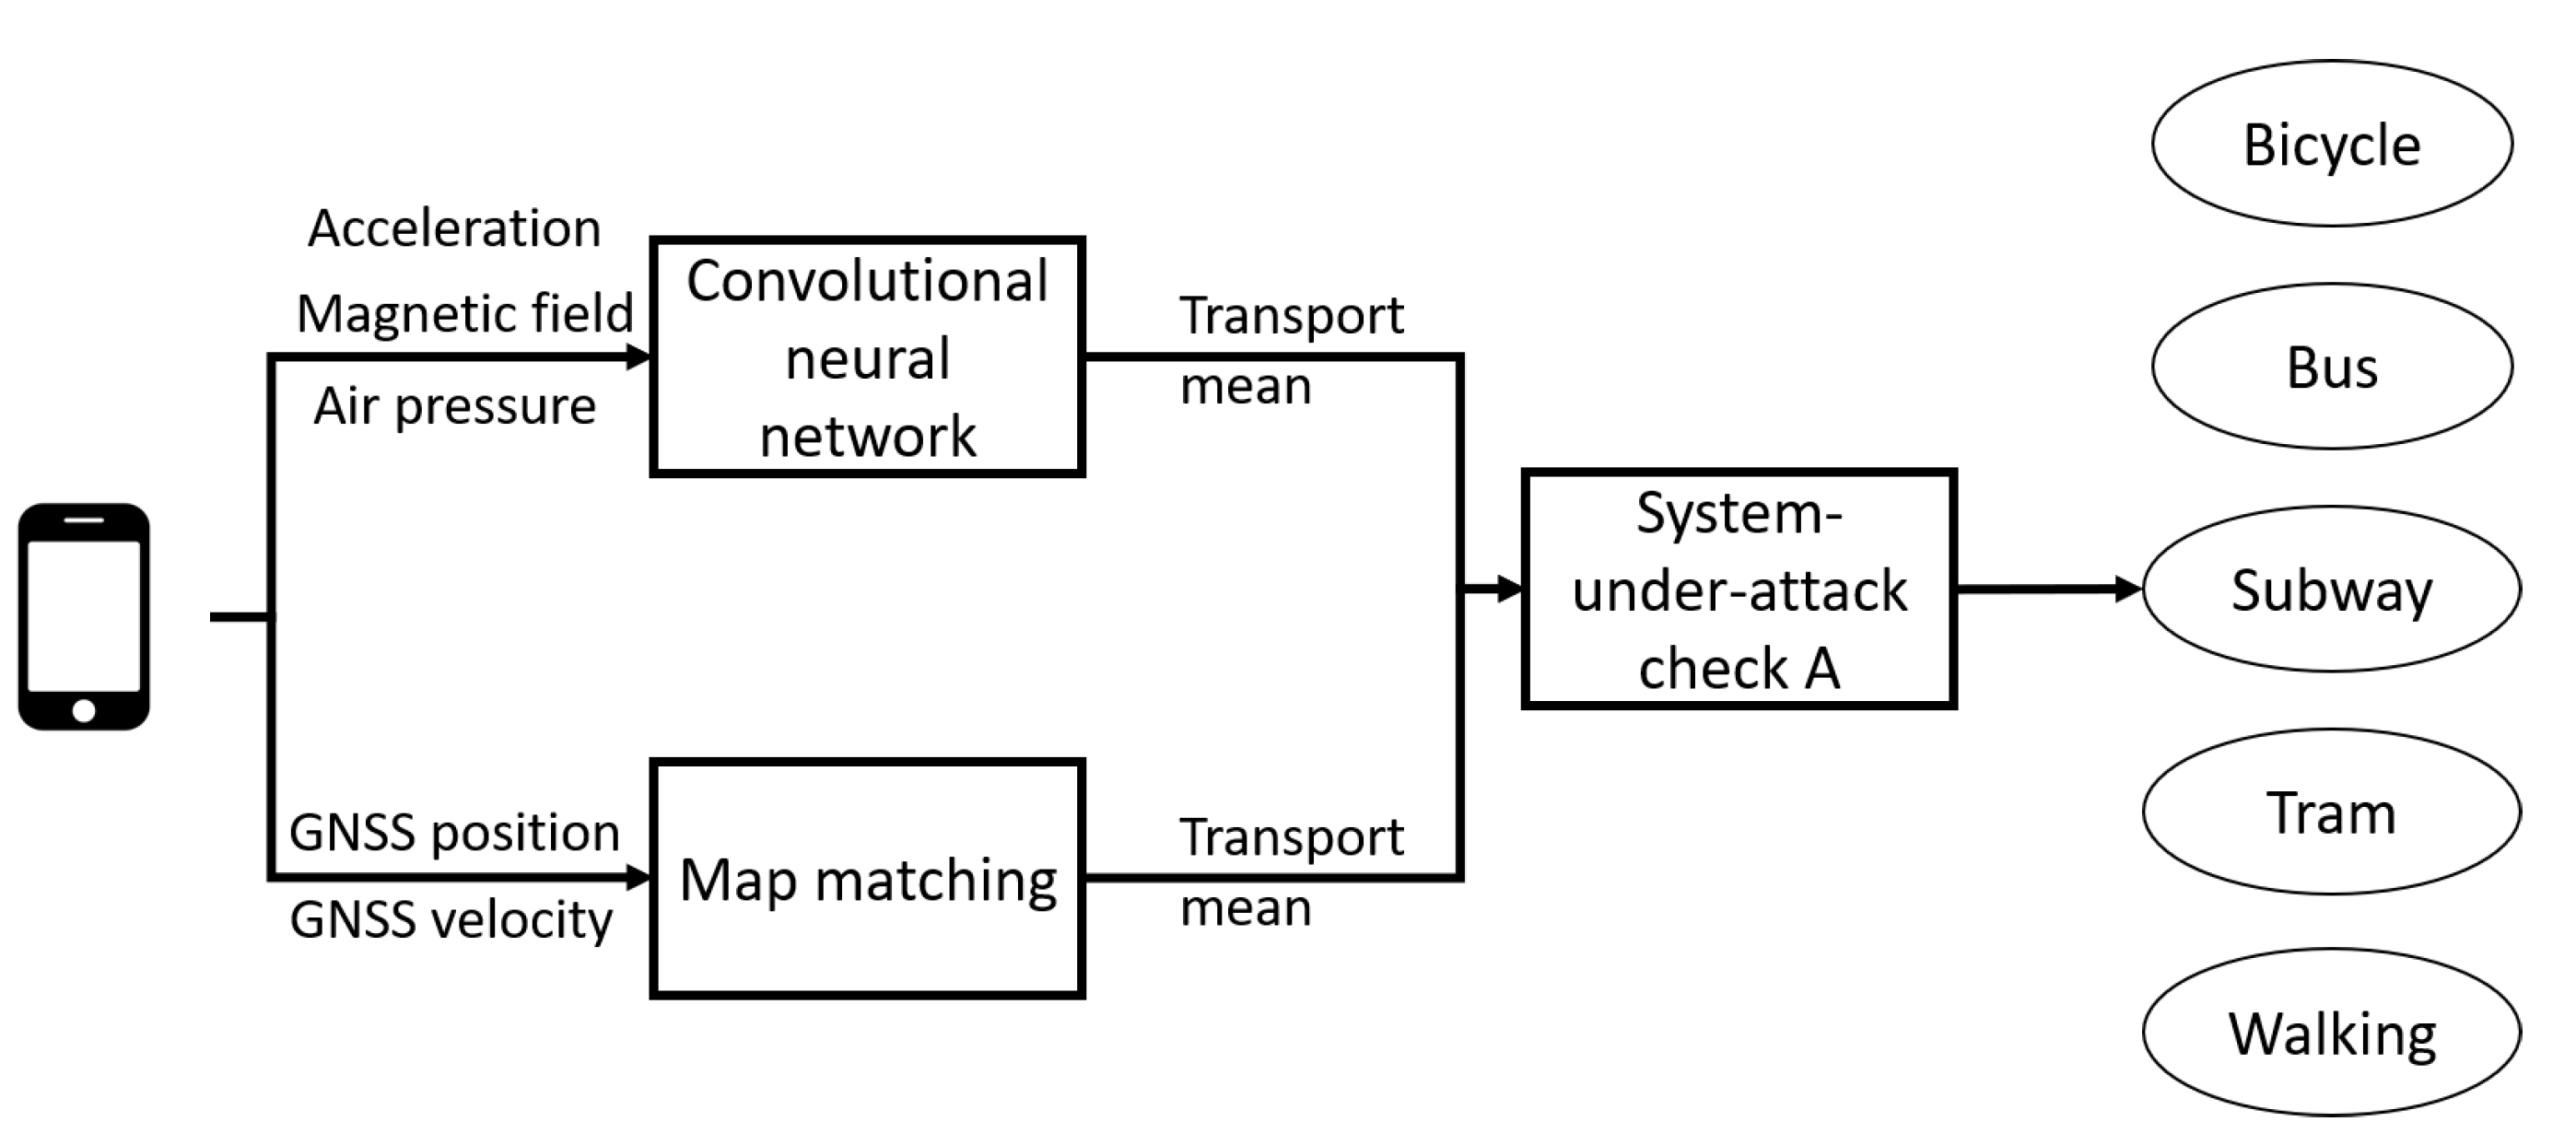
The presented method makes use of sensors embedded in the smartphone, particularly the accelerometer, the magnetometer and the barometer at 50 Hz, and of the out-of-the-box GNSS position and the GNSS velocity at 1 Hz.
Figure 9 shows the flow diagram of the multisensor-based transport mode identification.
On the one hand, the identification of transport modes is carried out with a convolutional neural network using the signals of the accelerometer, the magnetometer and the barometer. On the other hand, in parallel, the identification of transport modes is carried out based on map matching. To this end, the GNSS position and GNSS velocity are correlated with the available map of the bus, tram and subway stops/stations. The predefined trajectories of the bus, tram and subway are included in the map.
Under normal circumstances, the output of both subsystems of the parallel detection is congruent. However, under attack, the output of both parallel systems differs. In the case of non-coincident outputs for a long period of time, the map-matching subsystem, which is only based on GNSSs, is switched off since it is considered under attack.
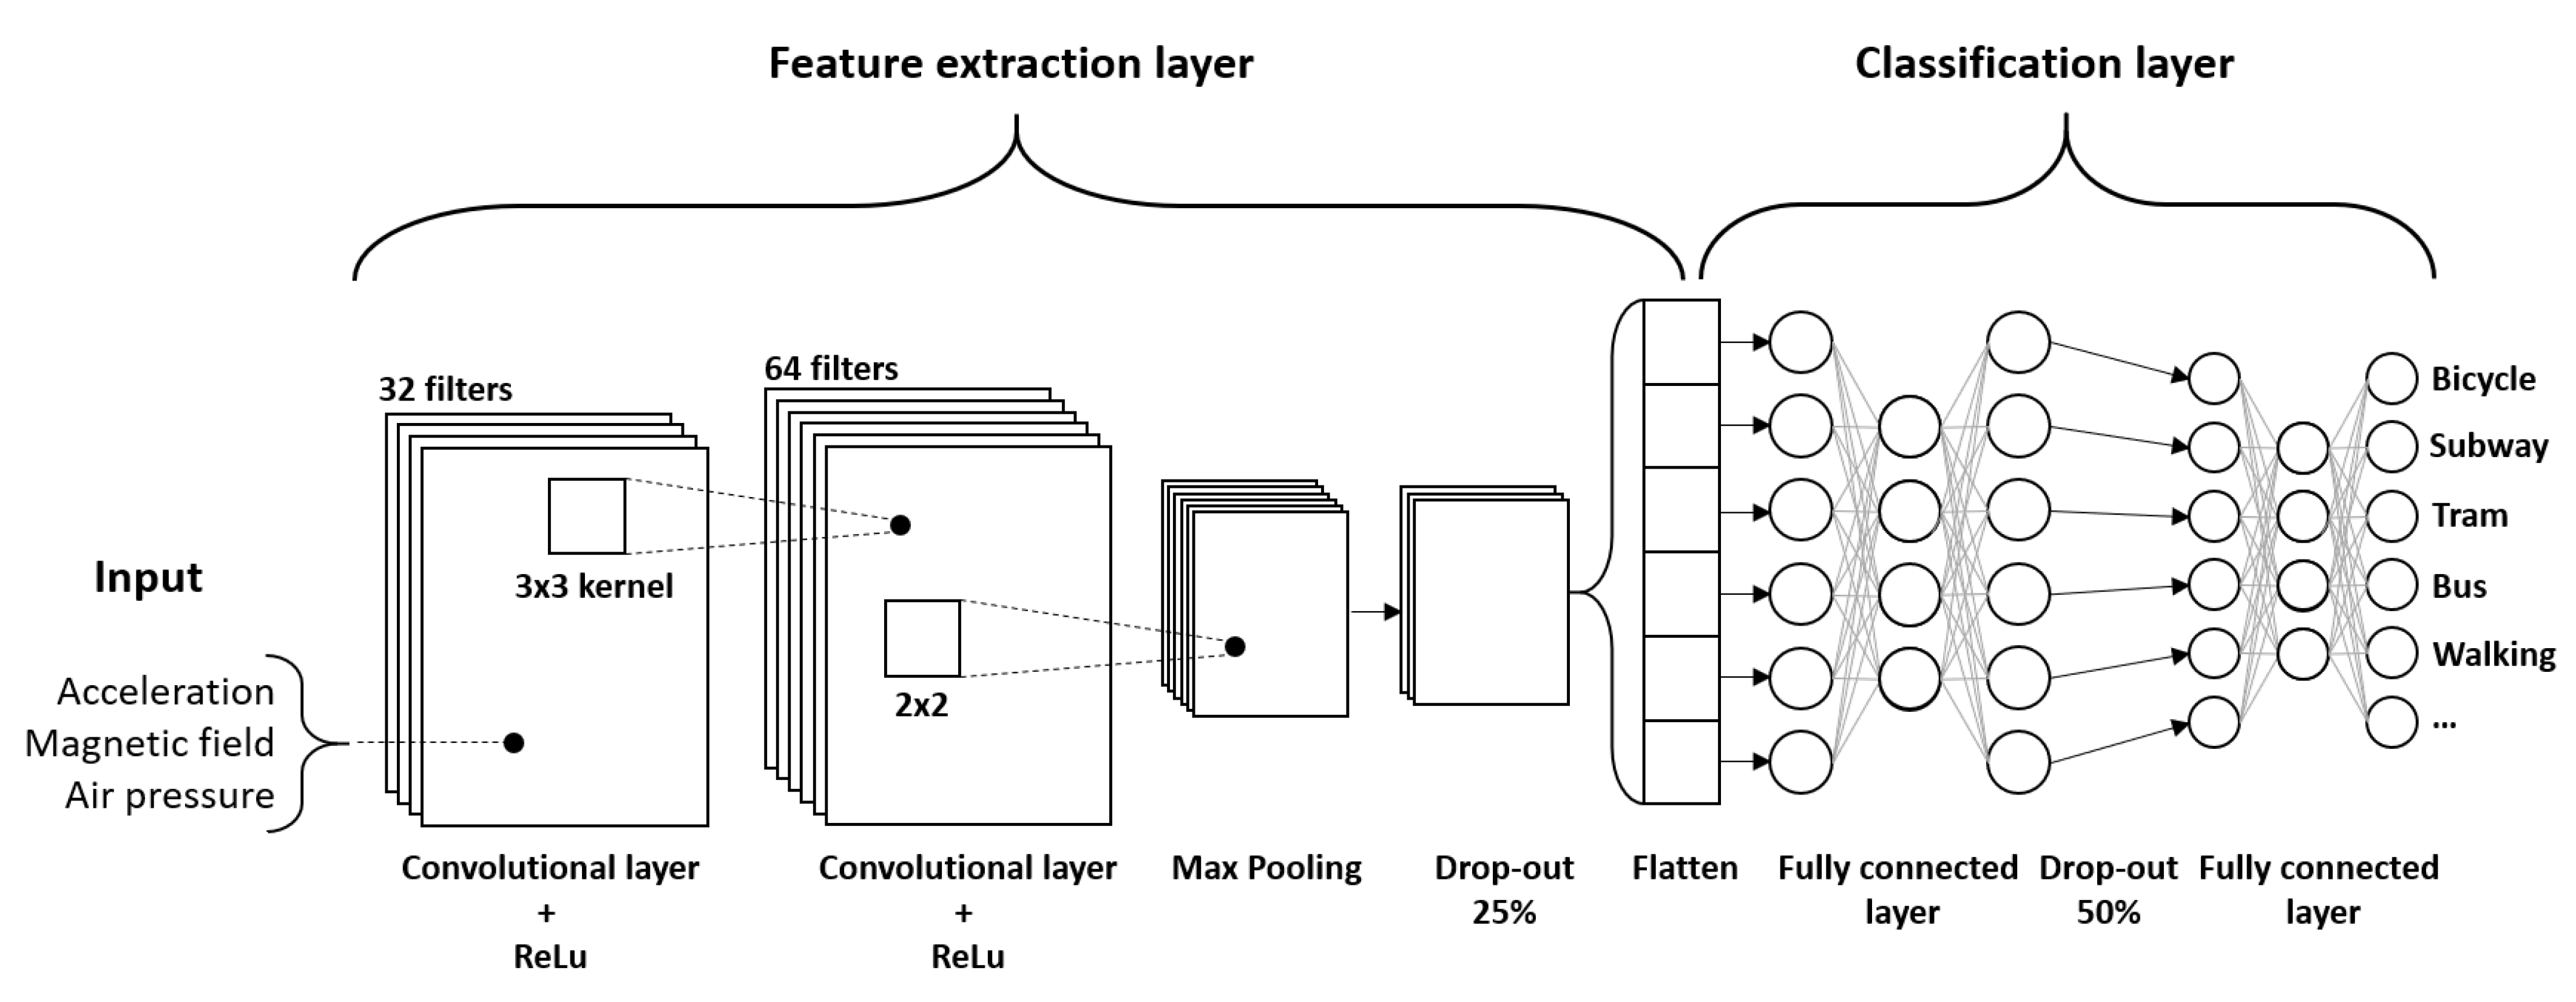
3.1.1. Convolutional Neural Network
For the convolutional neural network subsystem depicted in
Figure 9, we use the information of the accelerometer, the magnetometer and the barometer embedded in the smartphone to identify the currently used transport mode.
For the algorithm depicted in
Figure 10, the input is a coded image containing information of the acceleration, magnetic field and air pressure. The first layer of the feature extraction contains 32 filters that are applied with a 3 × 3 pixel kernel. The activation layer chosen is ReLu to eliminate possible negative values that may appear after the convolution operation with the filters. A second layer of filters is used to extract higher-order features and detect more complex patterns than with only one layer. This layer contains 64 filters that are applied with a 3 × 3 pixel kernel. Again, the activation layer is ReLu.
The third activation layer is a maximum pooling layer applied with a 2 × 2 pixel kernel. The next layer is a 25% drop-out layer, in which the connections between neurons are removed with a 25% probability. The last part is the flatten layer, where the features obtained are serialized to serve as input for the next stage.
After the feature extraction comes the classification layer. This stage consists of three different layers. The first is a fully connected neural network consisting of 128 neurons and a ReLu activation function. The second is a 50% drop-out layer. Finally, there is a layer that performs the classification between transport modes, with a softmax activation function.
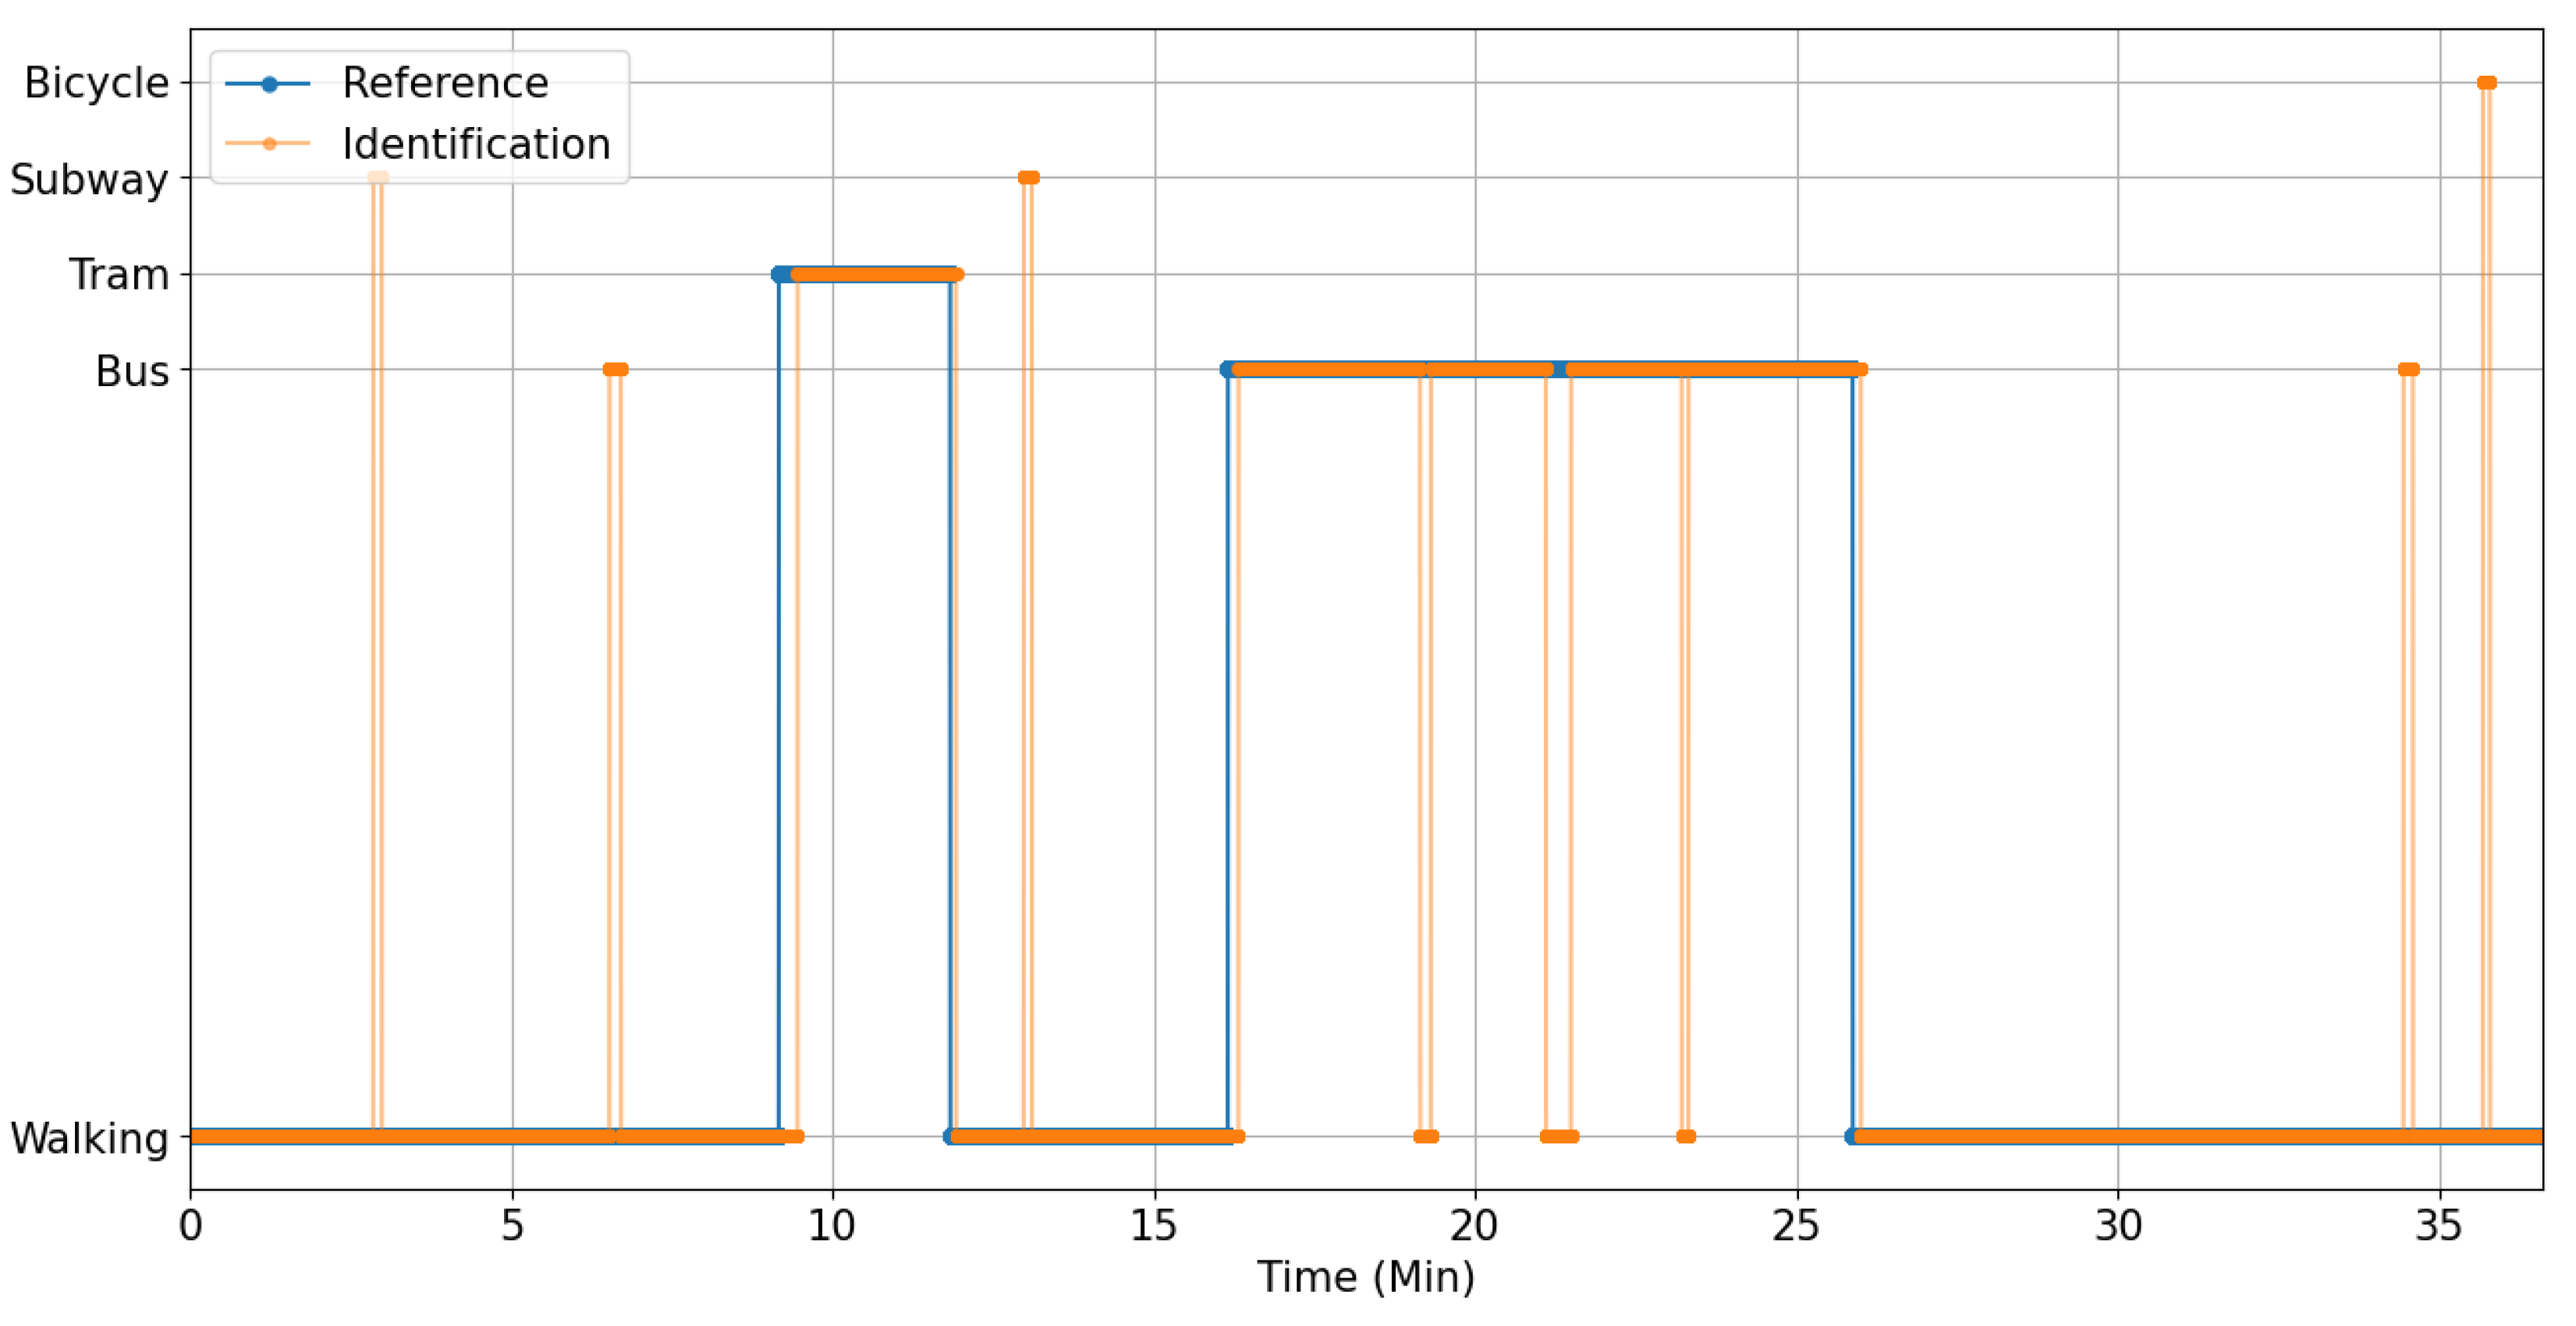
Figure 11 shows the output of the identification of transport modes based on the accelerometer, the magnetometer and the barometer signals corresponding to the journey recorded in Munich shown in
Figure 2. This figure shows how the transport modes are correctly identified with the multisensor approach. There are, however, some outliers indicating confusion between different transport modes that can be afterwards eliminated comparing the multisensor identification and the only-GNSS-based identification.
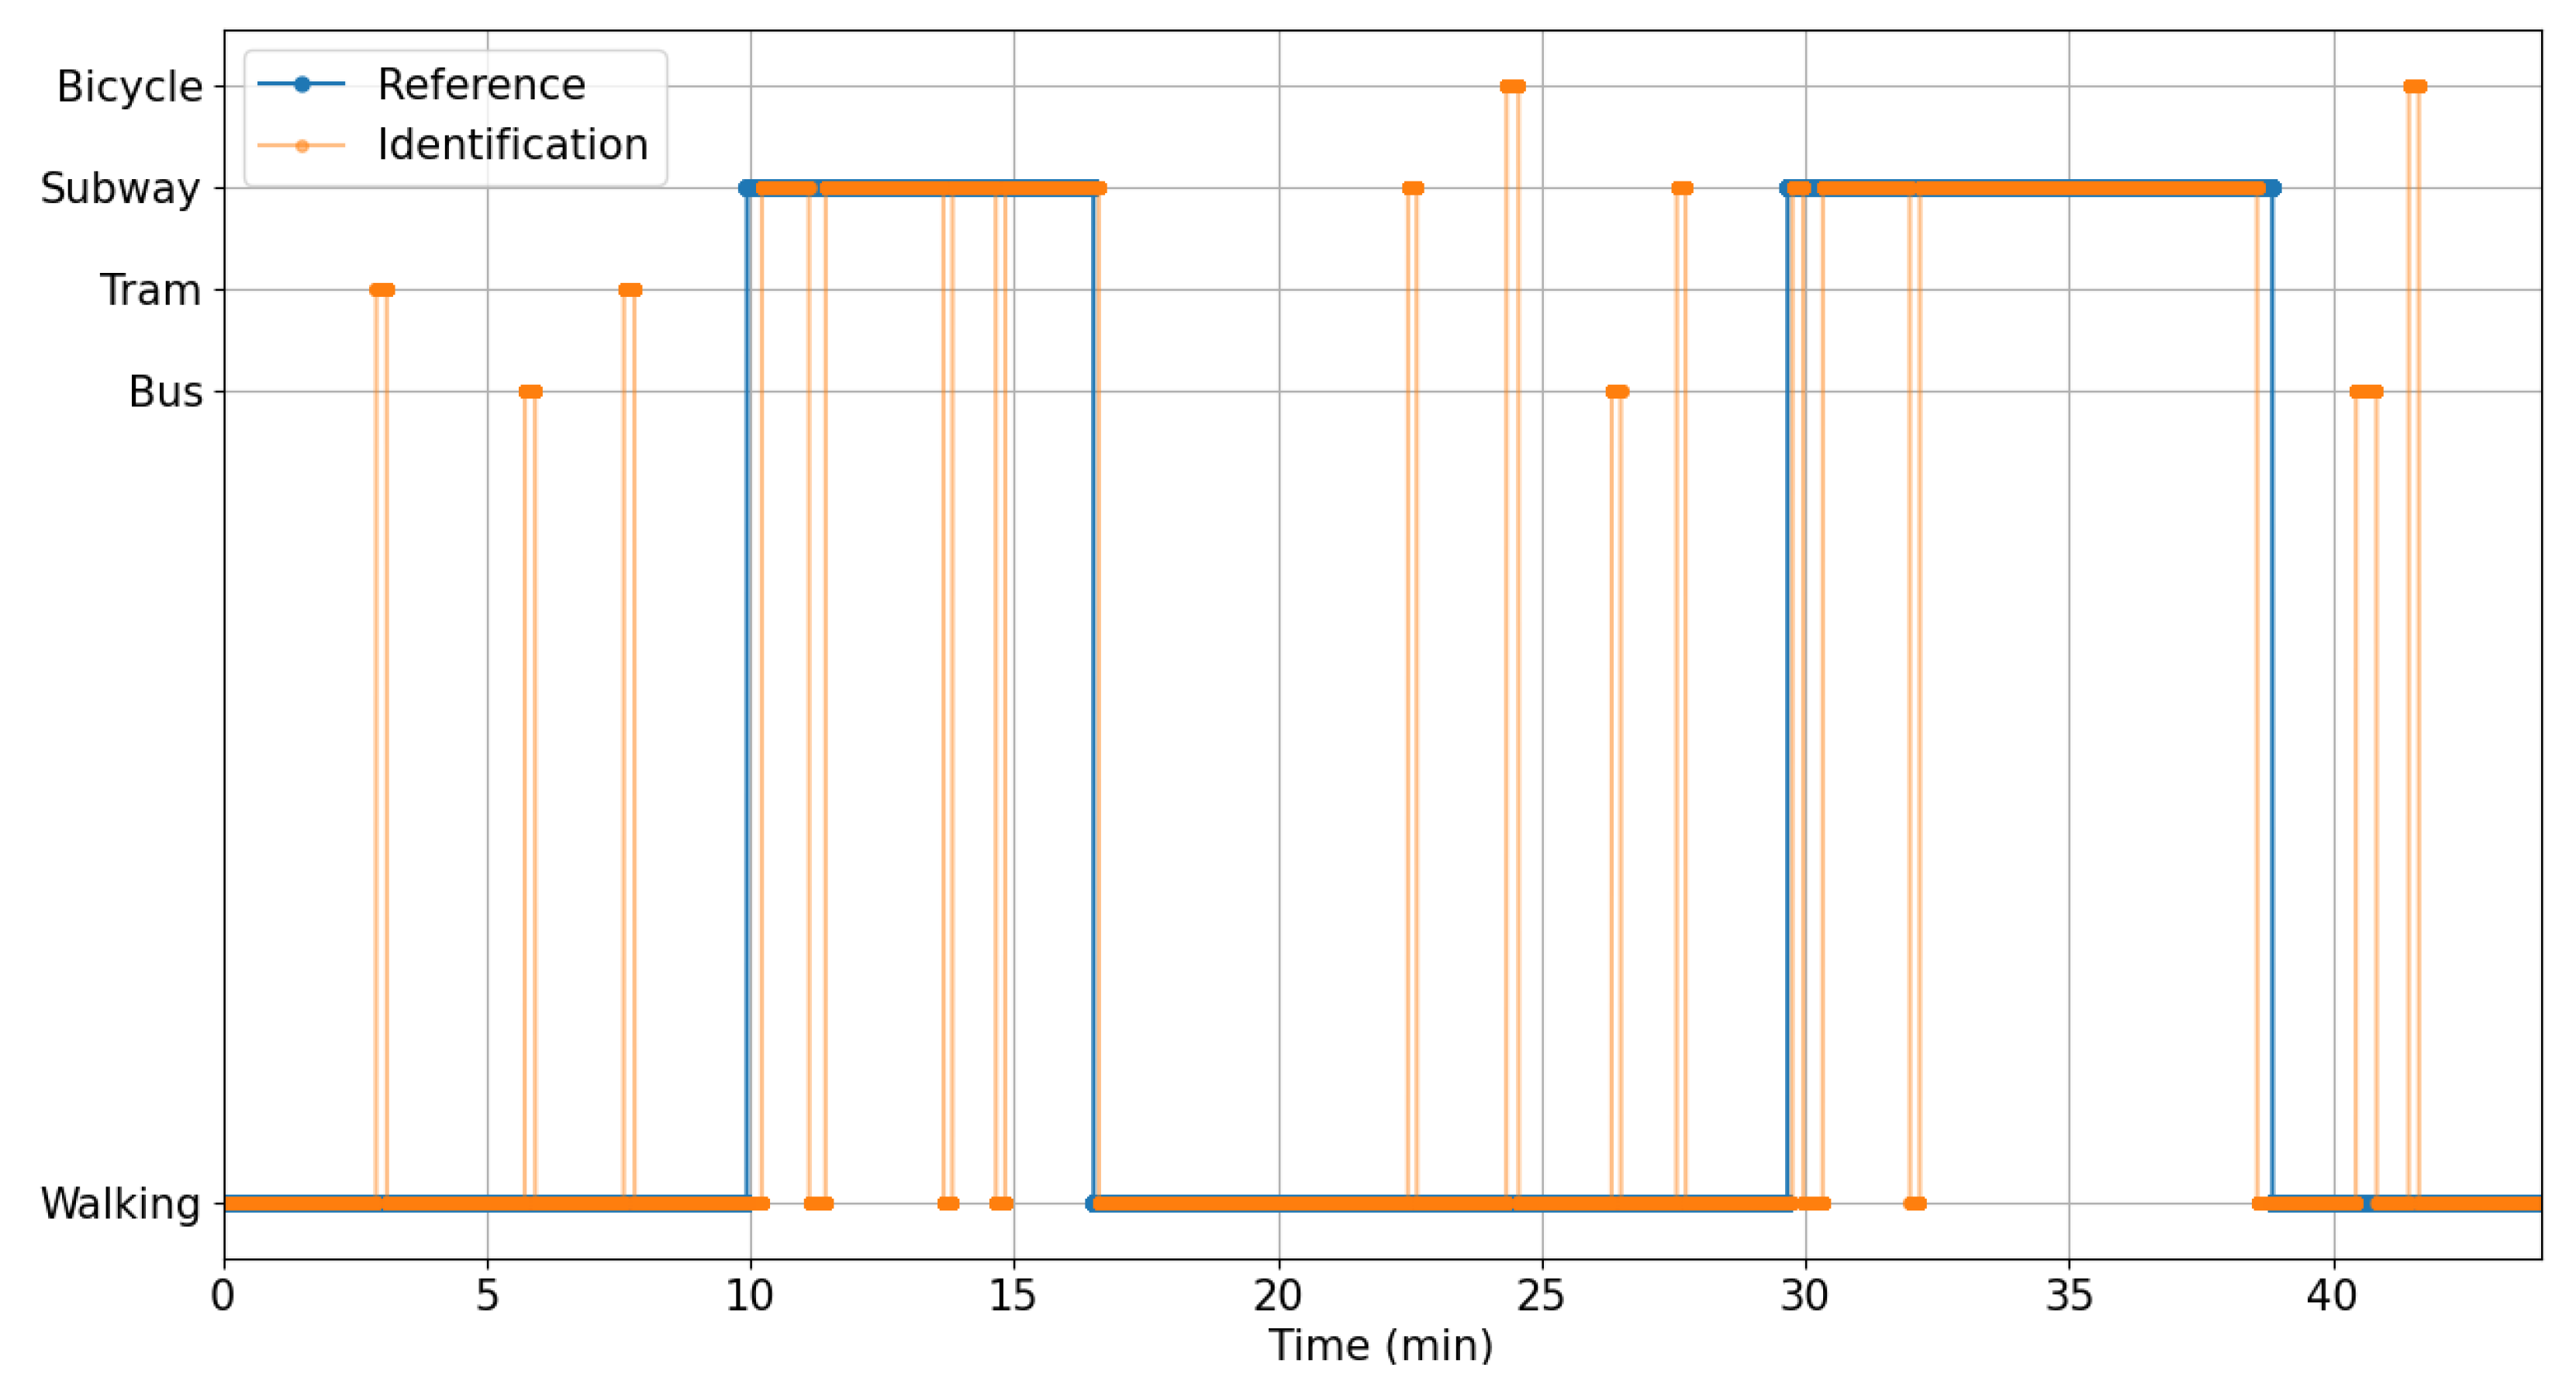
Figure 12 shows the output of the identification of transport modes based on the accelerometer, the magnetometer and the barometer signals corresponding to the journey recorded in Paris shown in
Figure 3. This figure shows how the transport modes are correctly identified with the multisensor approach. There are, however, some outliers indicating confusion between different transport modes that can be afterwards eliminated comparing the multisensor identification and the only-GNSS-based identification.
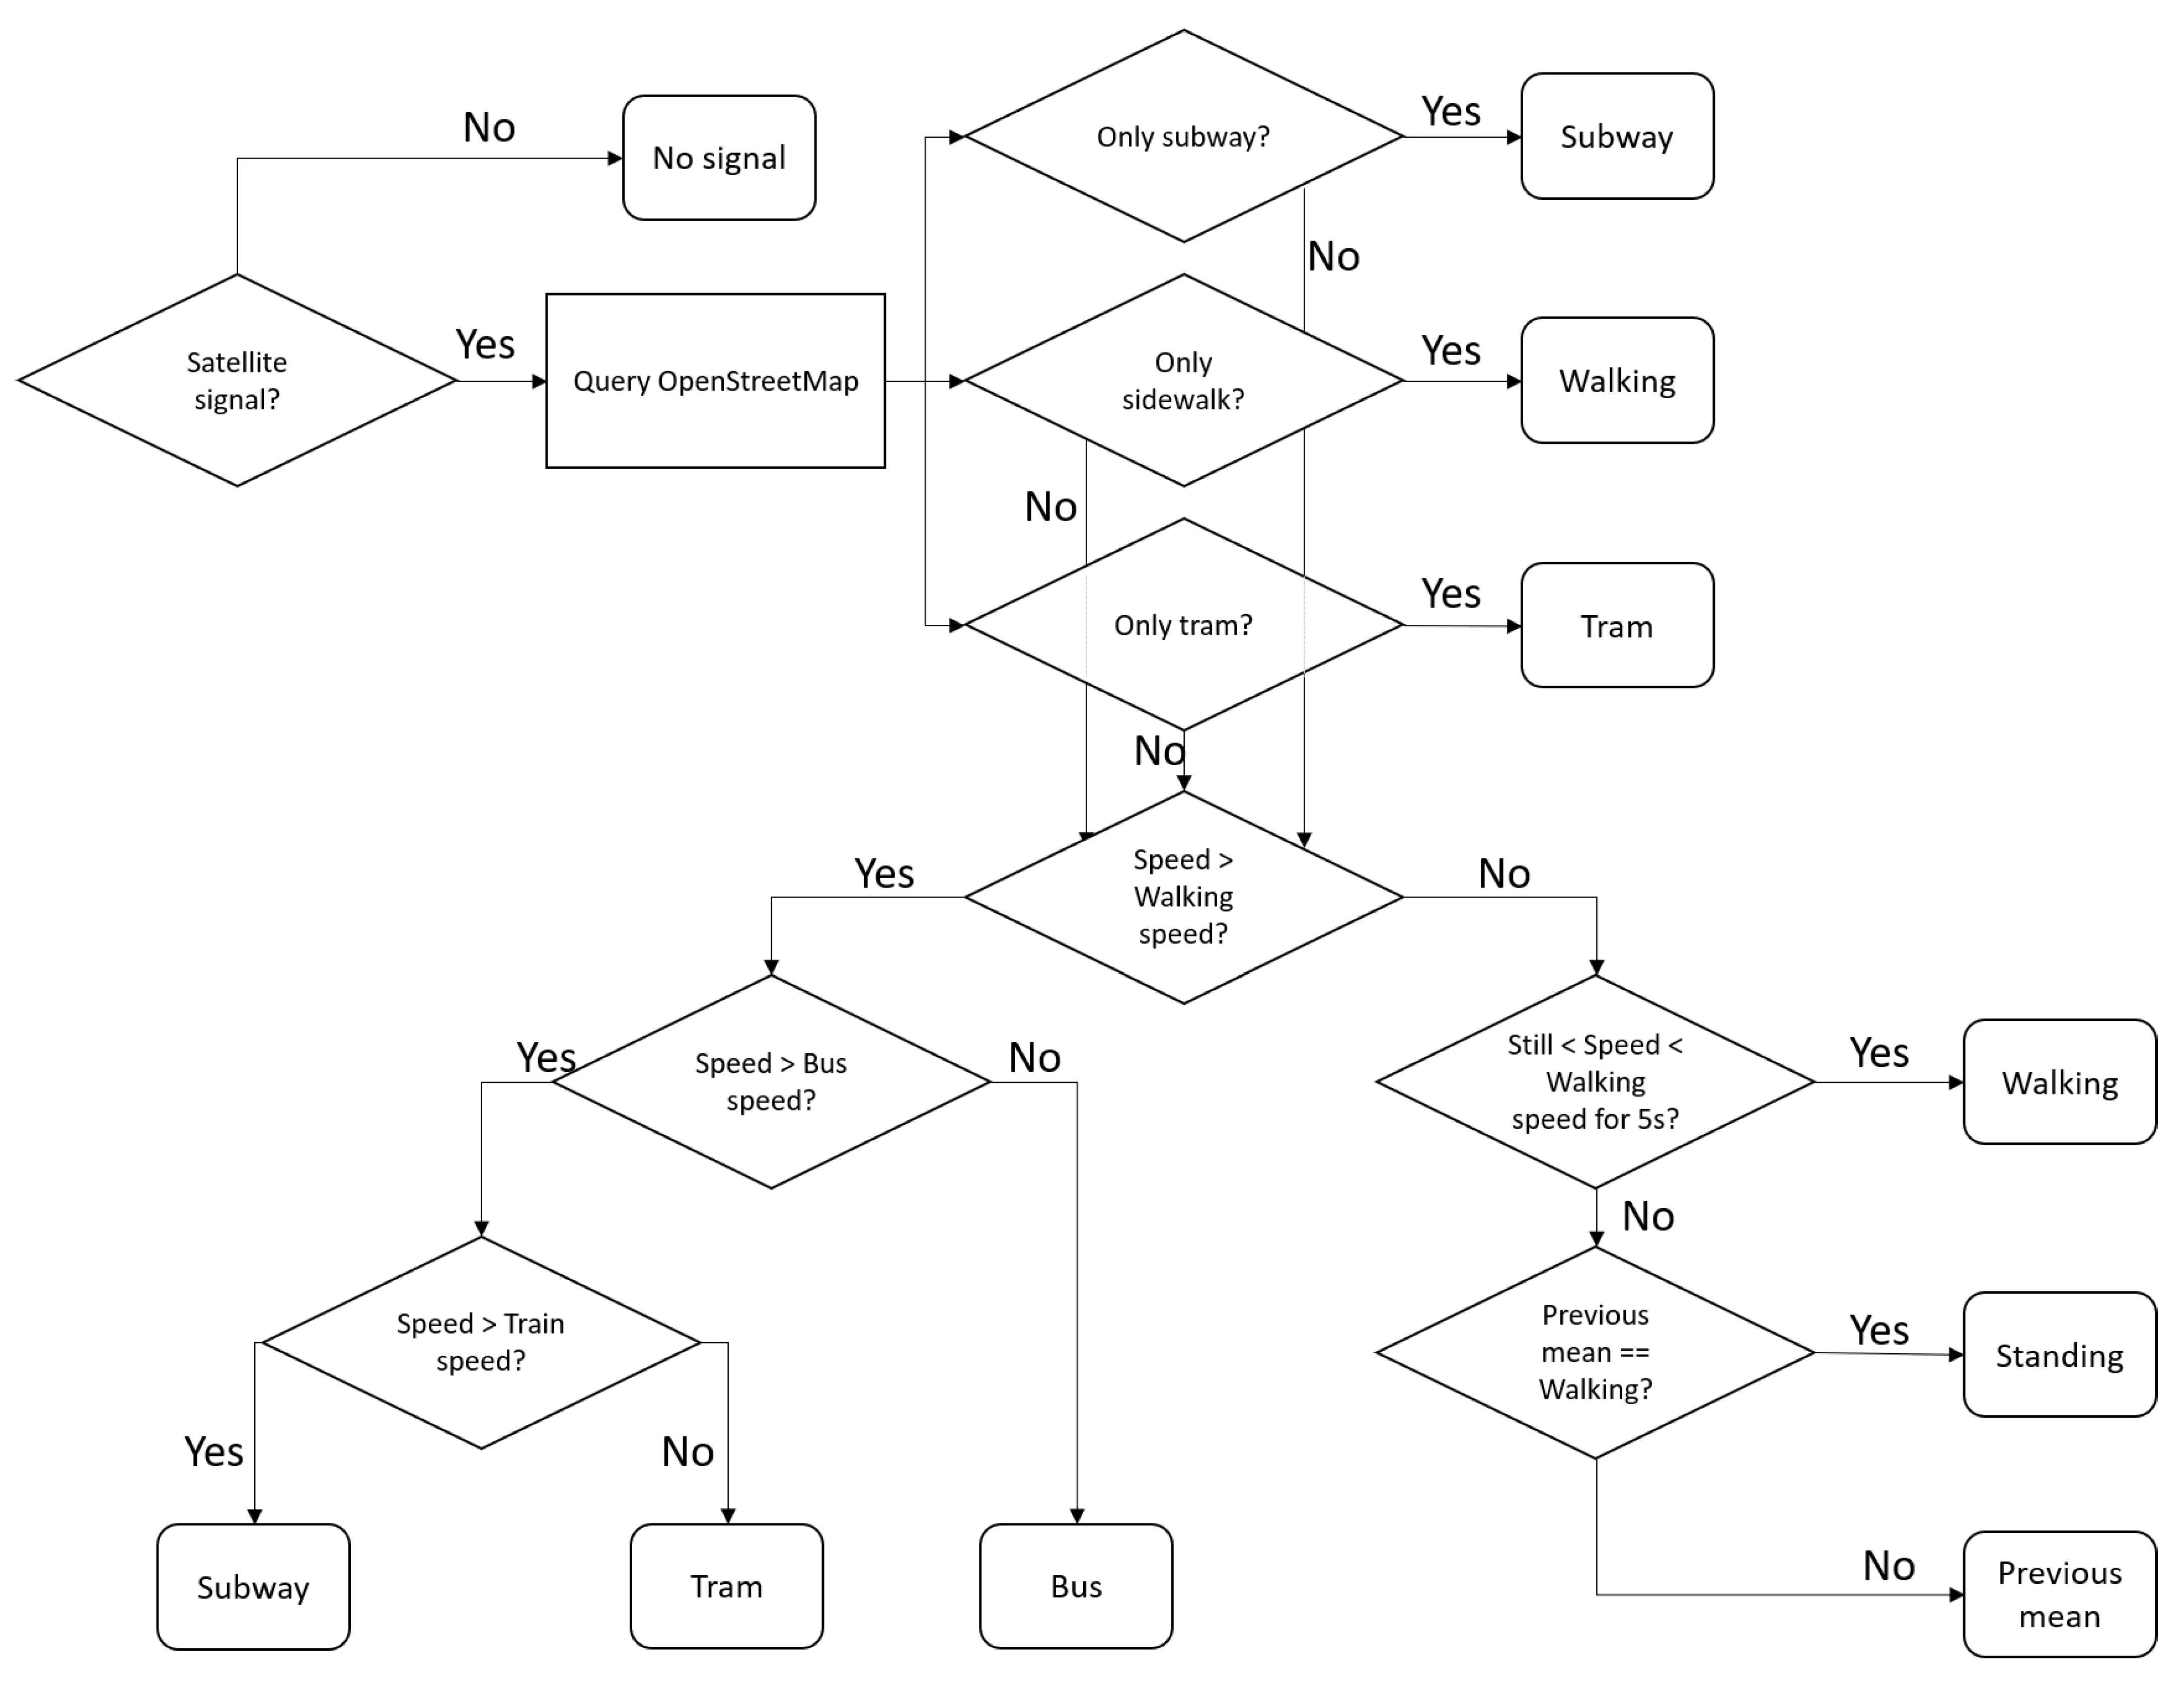
3.1.2. Map Matching
For the map-matching subsystem depicted in
Figure 9, we use an only-GNSS-based map-matching algorithm to identify the currently used transport mode. The map-matching algorithm is an algorithm that matches geographic coordinates to a logical model of the real world, e.g., a map. As depicted in
Figure 9, the map-matching algorithm uses only the GNSS position and GNSS velocity. We use the OpenStreetMap to match the current position with the surrounding types of path, i.e., railway, road and sidewalk. In case of ambiguities because many types of path are at the same location, we use the velocity averaged over the last 5 s to distinguish between different possibilities. There is rarely only one type of path, since it is a common urban design that the sidewalks and roads and even the rails of the tram are deployed at the same spot in parallel, as shown in
Figure 6.
The limiting factor of only using the GNSS position and the GNSS velocity is that the identification of all transport modes detected with the multisensor approach is not possible. For example, in scenarios of no satellite reception, such as in stations or subways, no detection is possible. This approach is heavily influenced by the map as well, in this case the OpenStreetMap. Sometimes the information of all bicycle lanes is not included; therefore, we excluded the transport mode of the bicycle.
Figure 13 shows the block diagram of our map-matching algorithm.
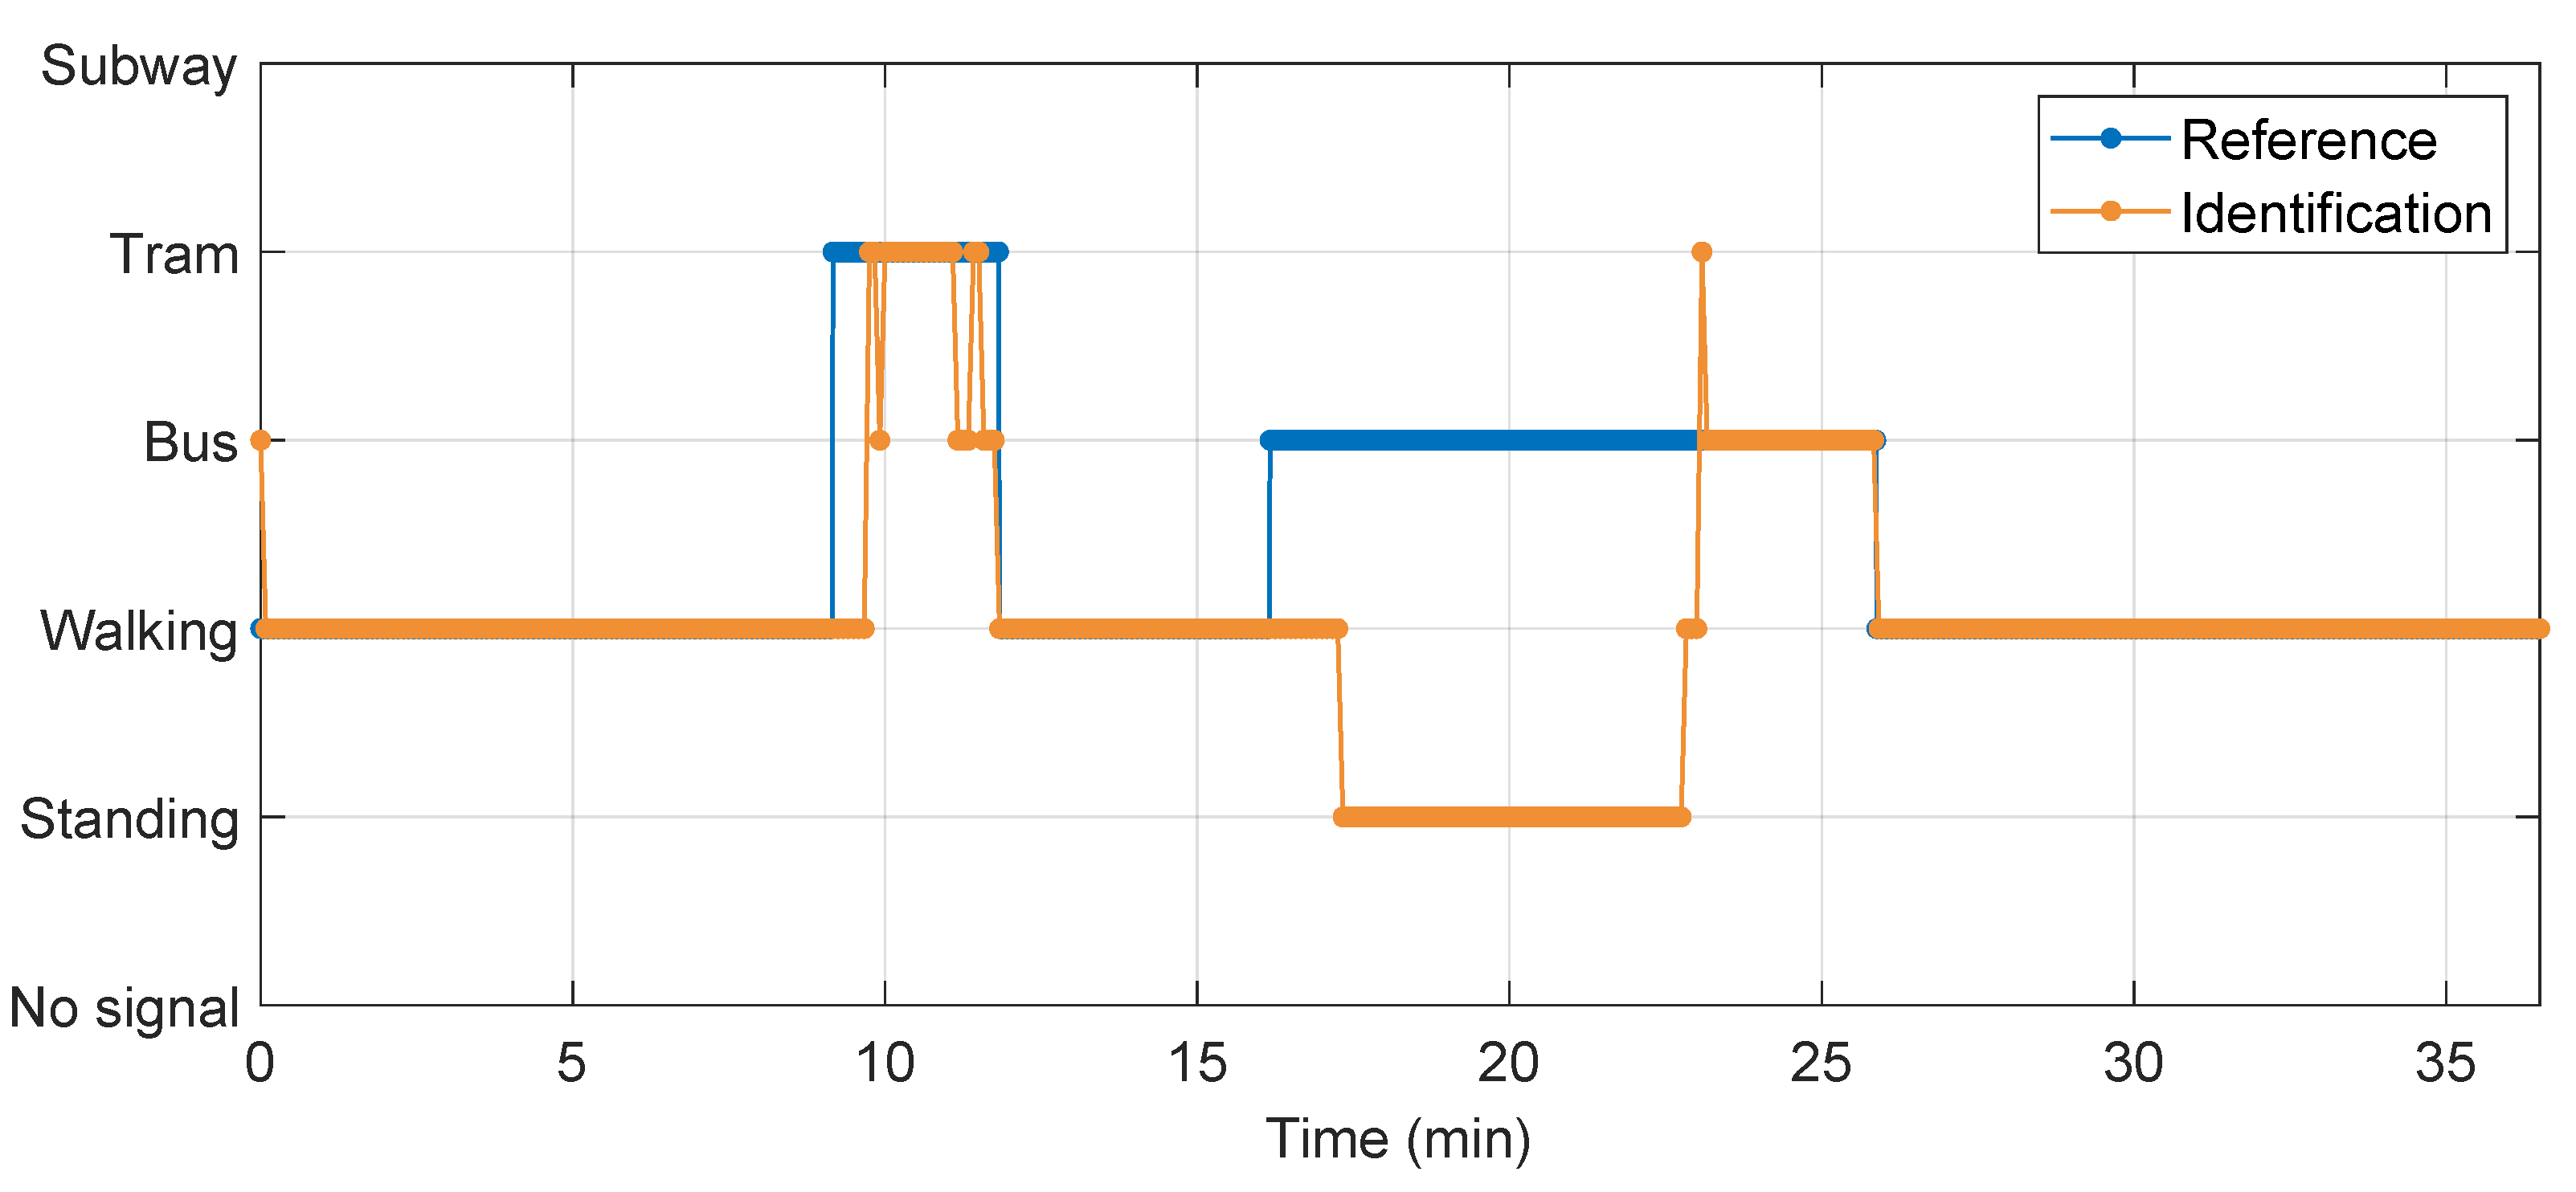
Figure 14 shows the output of the identification of transport modes based on GNSSs corresponding to the journey recorded in Munich shown in
Figure 2. This figure shows confusion mainly between the tram and bus due to their very close and parallel tracks and similar velocities. From the minute 16 until the minute 26, the passenger was in the bus; however, the bus did not start the journey until minute 23. The fact that the bus is detected with the multisensor approach in
Figure 11 is due to the fact that the motor of the bus was on while waiting at the initial bus stop and the vibration was detected. However, the velocity is zero, since the bus is still at the bus stop; therefore, the only-GNSS-based approach detects standing.
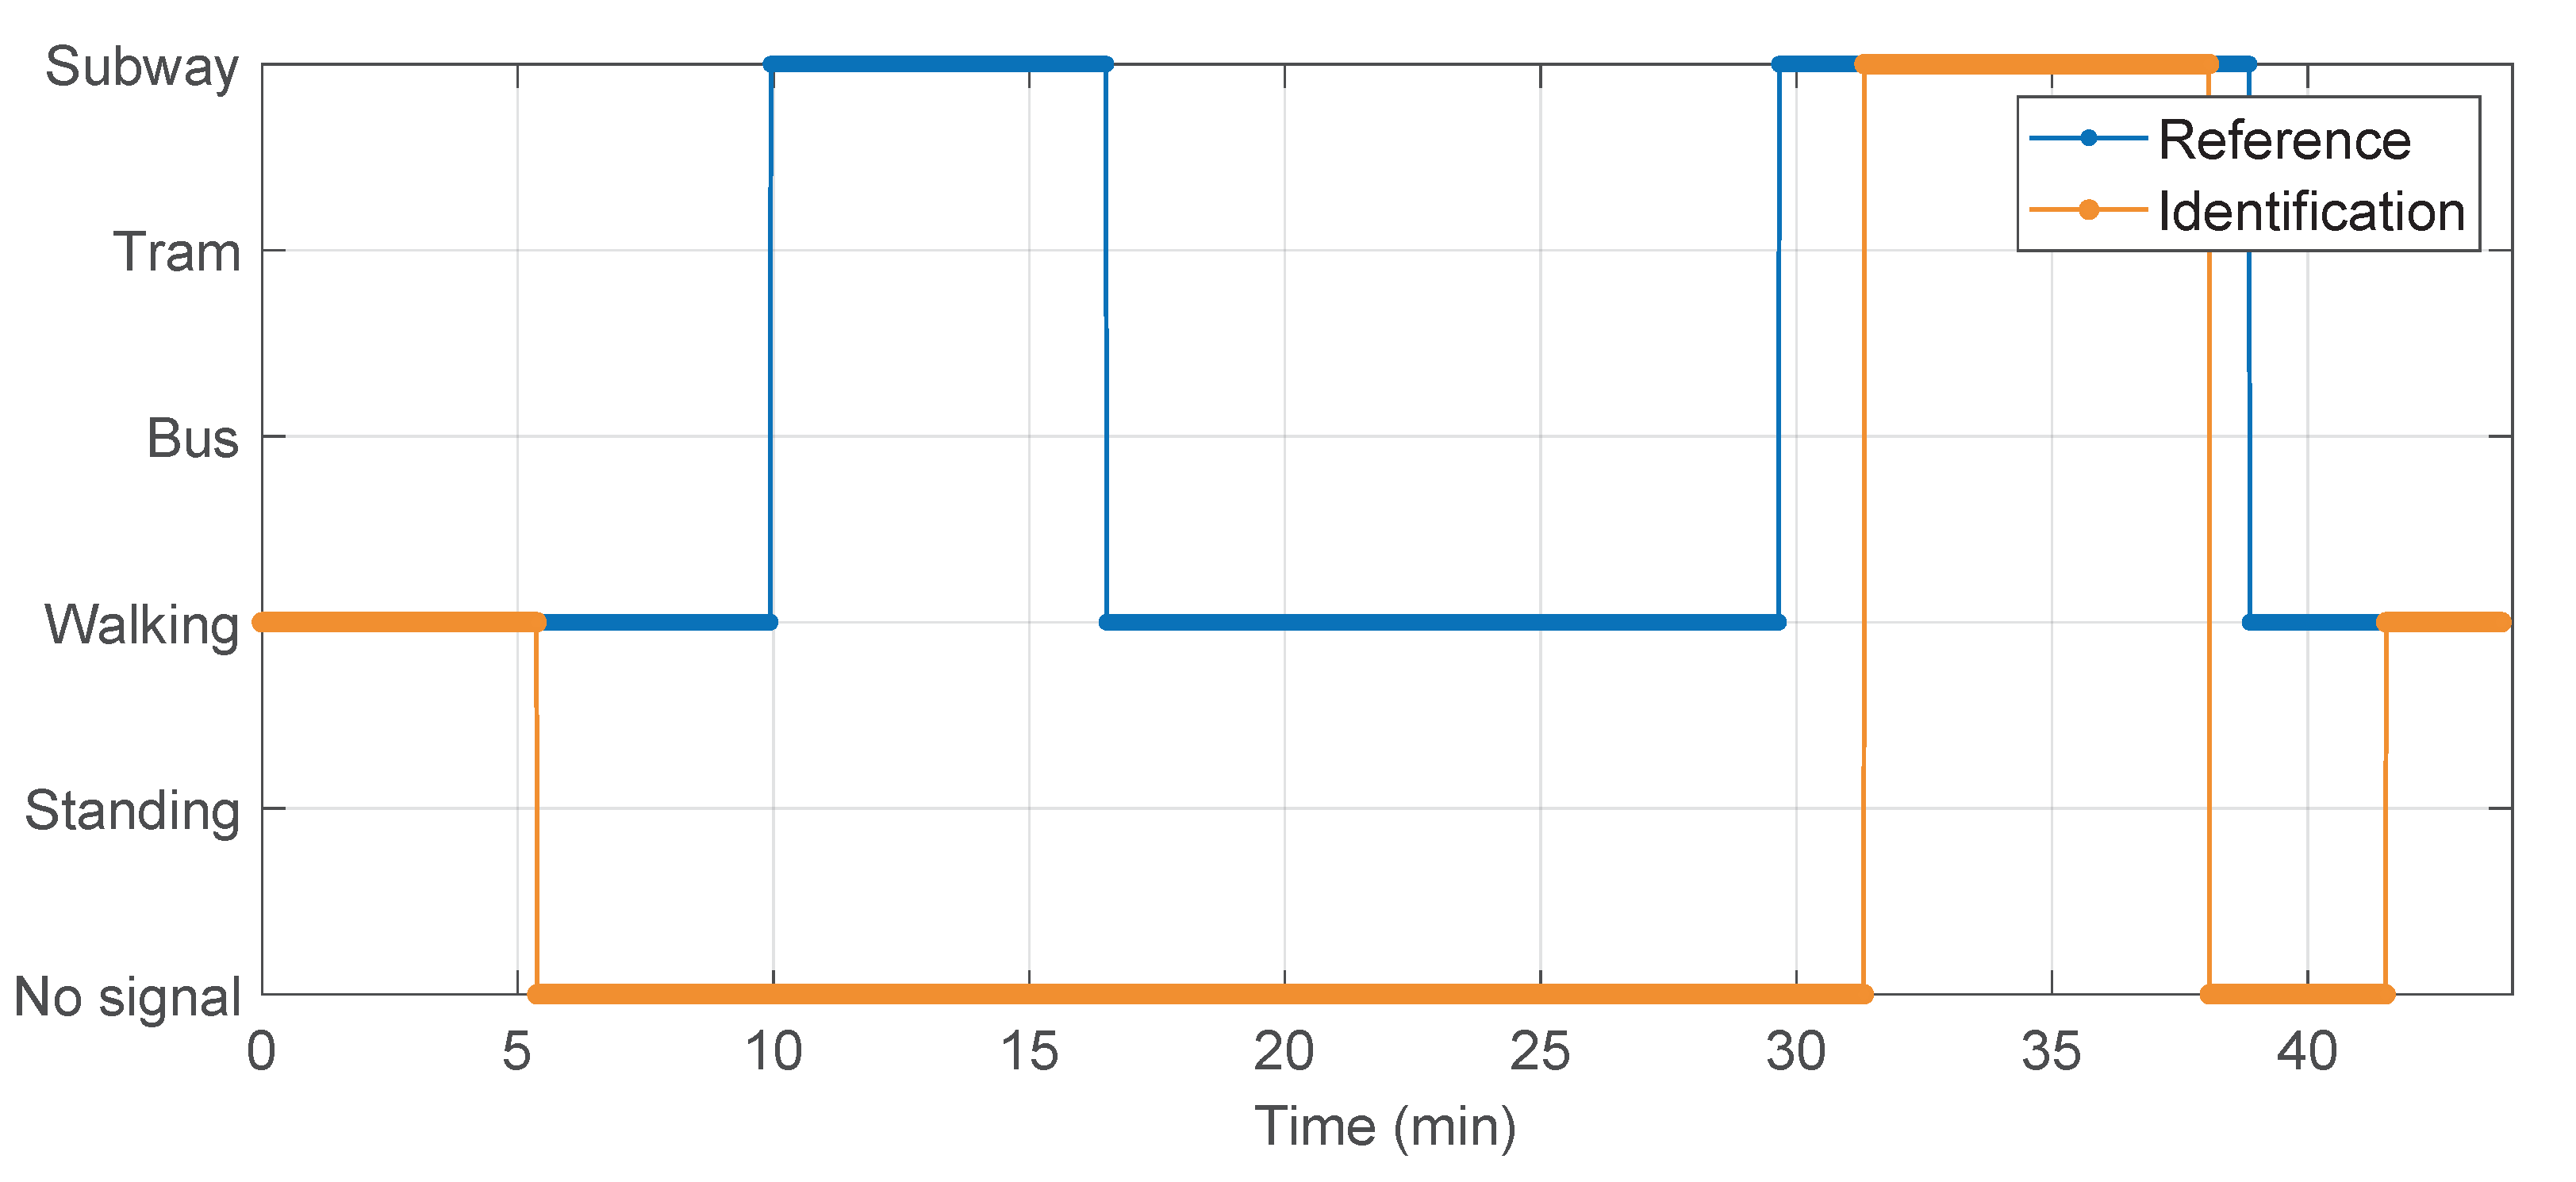
Figure 15 shows the output of the identification of transport modes based on GNSSs corresponding to the journey recorded in Paris shown in
Figure 3. This figure shows that during a great part of the journey there was no satellite reception. After minute 5, the passenger enters the station to catch the subway; thus, the reception is lost. The walking part missing from minute 16 until minute 30 occurs in the station as well. However, the subway line travels for some stations at a ground level; thus, there is again satellite reception from minute 31 until minute 37.
3.1.3. System-Under-Attack Check A
The faulty navigation signal we generated for the journey, recorded in Munich, was introduced at minute 16 and consists of a modified GNSS position and GNSS velocity. The modifications were performed with the aim of replicating a bicycle trajectory. To this end, the GNSS position was moved from the bus lane to the bicycle lane and the GNSS velocity was reduced to 20 km/h. The length of the journey was reduced as well.
As a result of the faulty navigation signal, the multisensor-based identification of transport modes obtains non-coincident outputs from minute 16 on; thus, the system is considered under attack and the identification of transport modes only based on the acceleration, the magnetic field and the air pressure are taken into account.
The faulty navigation signal we generated for the journey, recorded in Paris, was introduced at minute 21 and consists of a modified GNSS position and GNSS velocity. The modifications were performed with the aim of shortening the journey. To this end, the GNSS position was modified to leave the station at Montparnasse and walk 500 m in the south direction and the GNSS velocity was reduced to 4 km/h to replicate walking.
As a result of the faulty navigation signal, the multisensor-based identification of transport modes obtains non-coincident outputs from minute 21 on; thus, the system is considered under attack and the identification of transport modes only based on the acceleration, the magnetic field and the air pressure are taken into account.
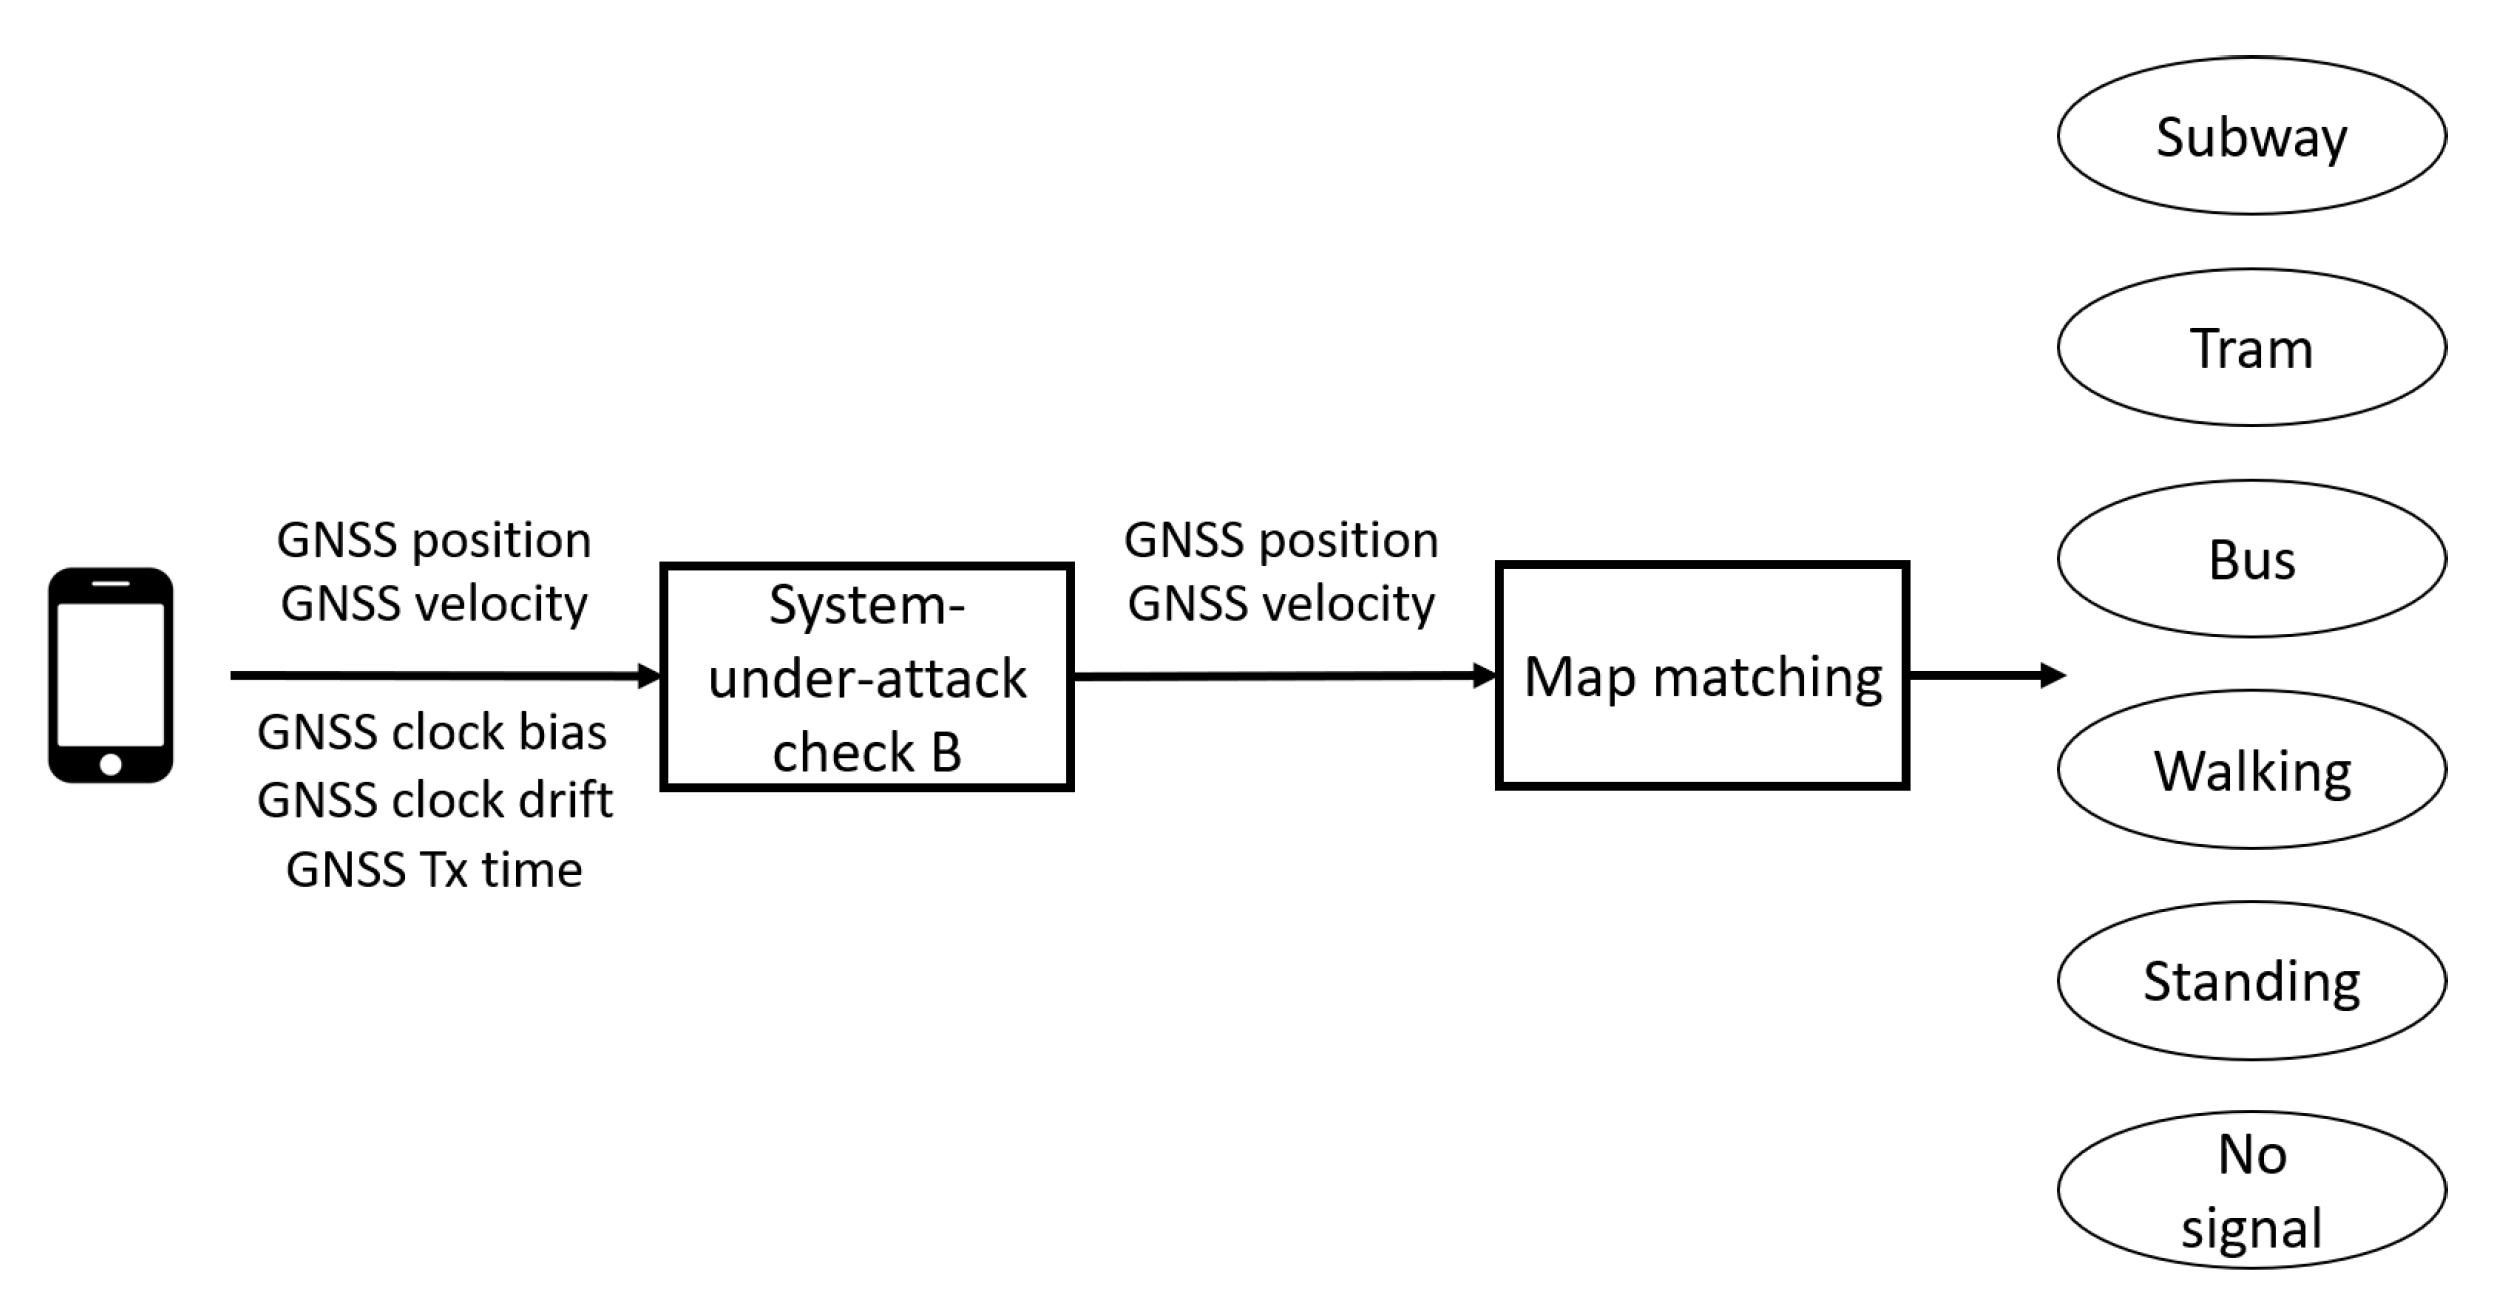
3.2. Only-GNSS-Based Transport Mode Identification
In this section, we present an alternative method to detect attacks to the satellite signal that are prone to induce errors in the identification of transport modes. The presented method makes use of the drift between the GNSS receiver clock of the smartphone and the GPS time (only the GPS constellation is used; therefore, we call it in the following GPS time) to check whether the system is under attack and uses the out-of-the-box GNSS position and GNSS velocity at 1 Hz to identify the currently used transport mode.
Figure 16 shows the flow diagram of the only-GNSS-based transport mode identification.
3.2.1. System-Under-Attack Check B
Positioning satellites are equipped with atomic clocks with a stable drift synchronized with each other [
14]. The GNSS receiver clock of the smartphone is not synchronized with the GPS time. Therefore, there is an offset between the GPS time and the GNSS receiver clock of the smartphone [
14].
However, in the case of an attack, the offset between the GPS time and the GNSS receiver clock of the smartphone suddenly changes when the attack starts, since the smartphone does not receive the legitimate navigation signal from the satellites anymore but rather the faulty navigation signal from another transmitter.
The transmitter of the faulty navigation signal requires an atomic clock and needs to synchronize its oscillator with GPS time to avoid a sudden change in the offset between clocks. This is unlikely to happen for the purpose of deceiving the e-ticketing system.
Therefore, the continuous observation of the offset between the GPS time and the GNSS receiver clock of the smartphone allows detecting the attack. In [
15], the authors explain the limitations of commercial off-the-shelf receivers and why and how the clock bias can be used to detect attacks. This method does not require additional hardware or software, and the required information is provided by the navigation chip. Furthermore, in [
16] the authors experimentally demonstrate how the clock bias analysis allows for the detection of such attacks.
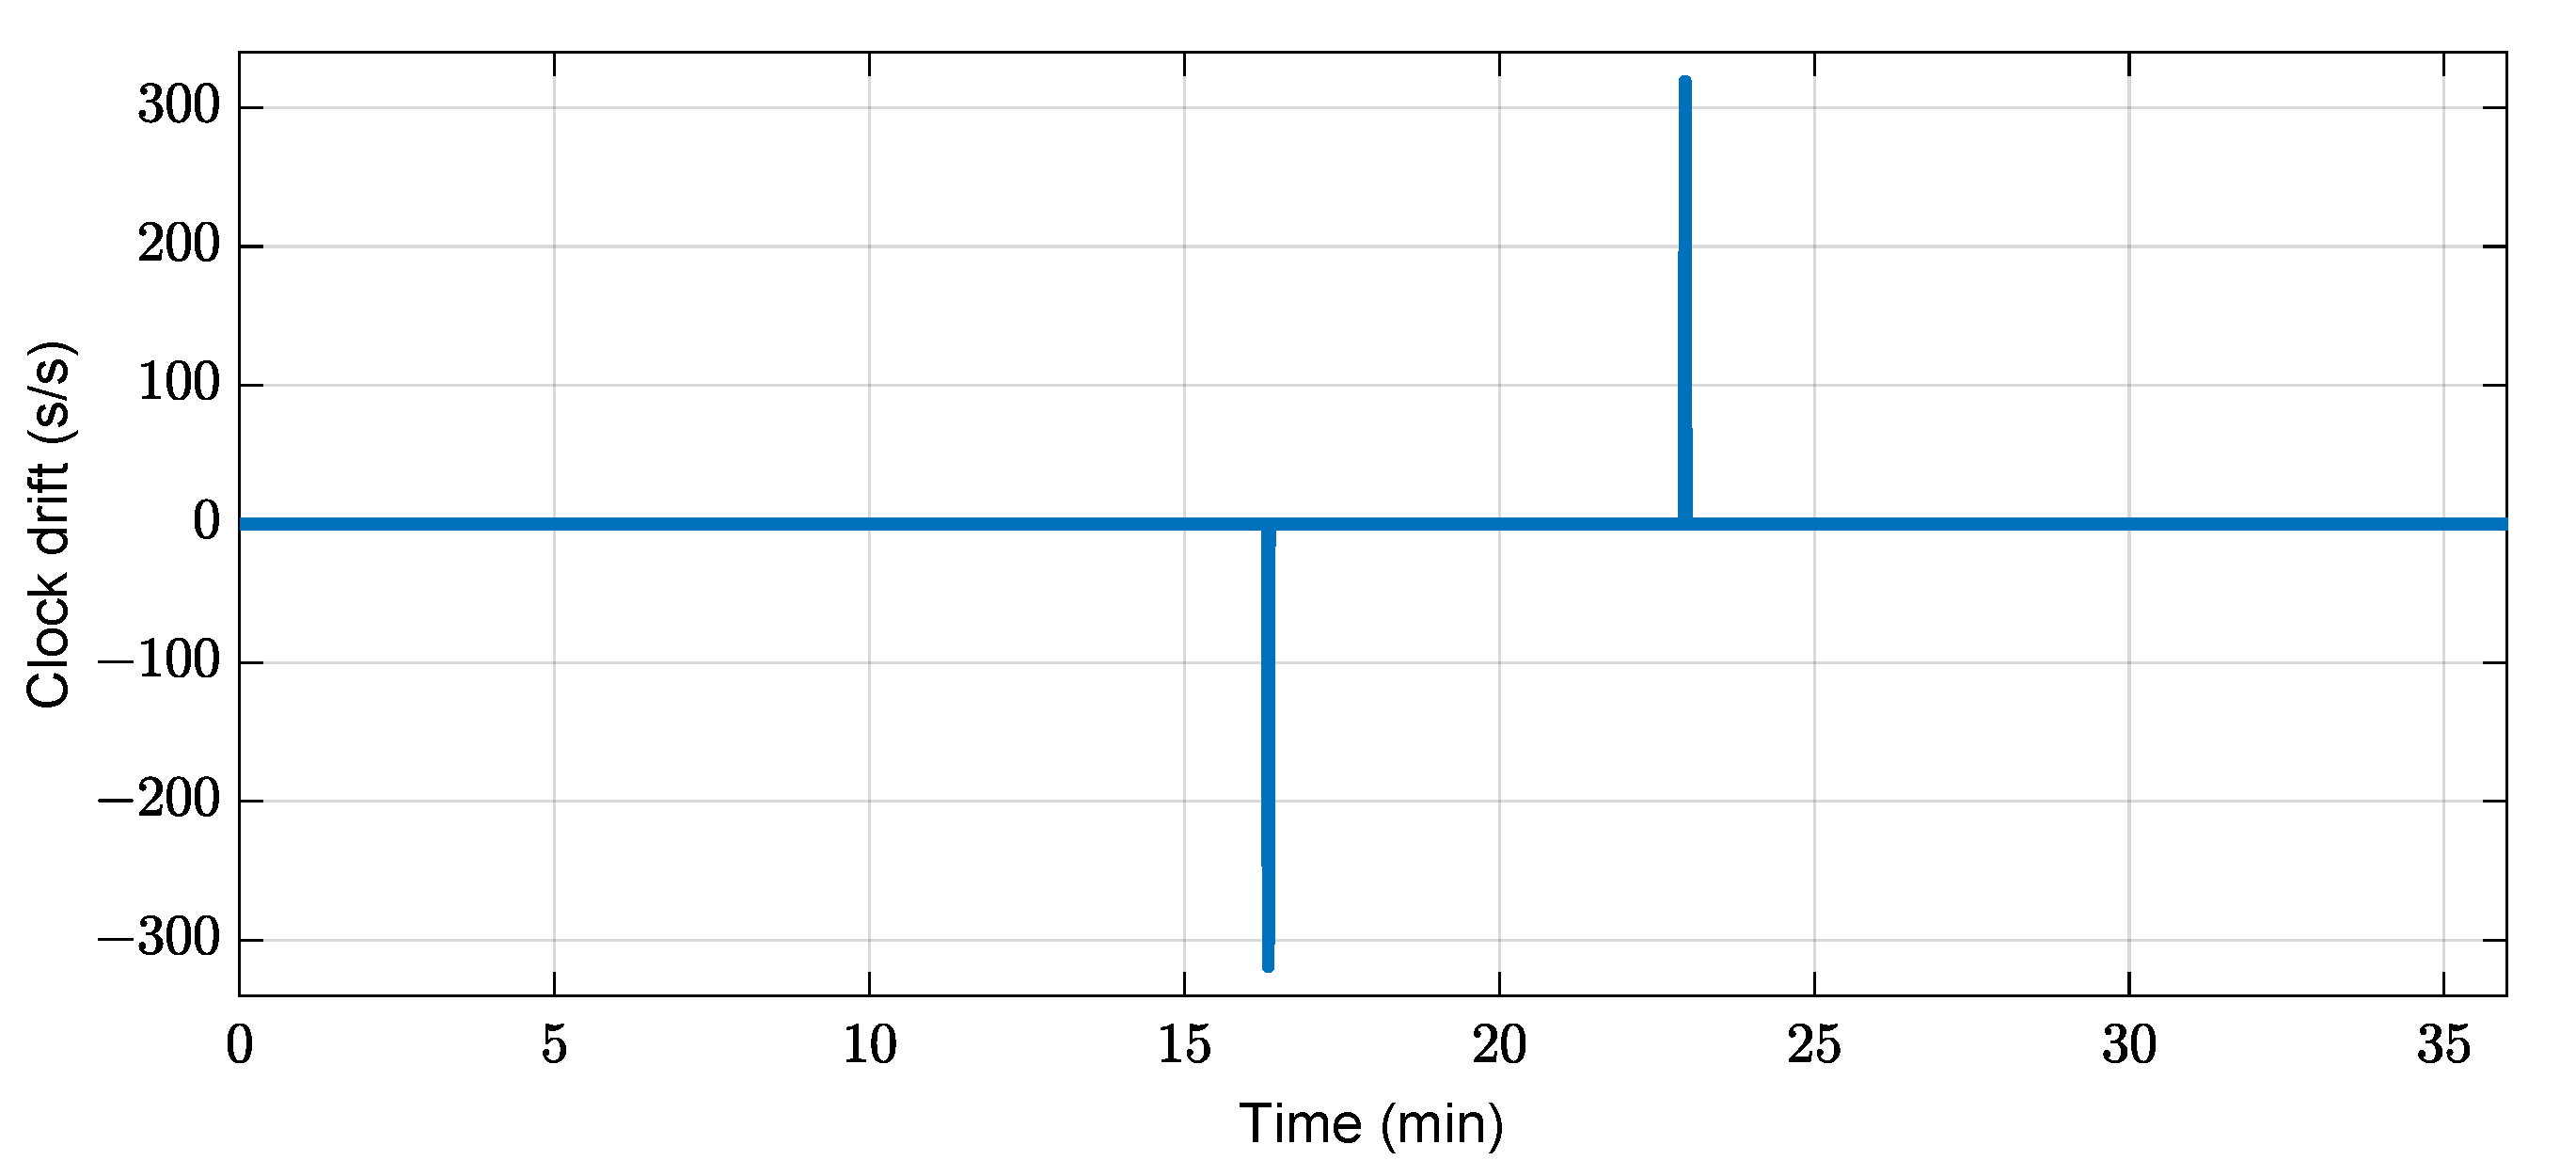
Figure 17 shows an outlier when there is a variation between the GNSS receiver clock of the smartphone and the GPS time. This happens when the spoofing attack starts and ends. The faulty navigation signal we generated for the journey recorded in Munich was introduced at minute 16 and it lasted until minute 23.
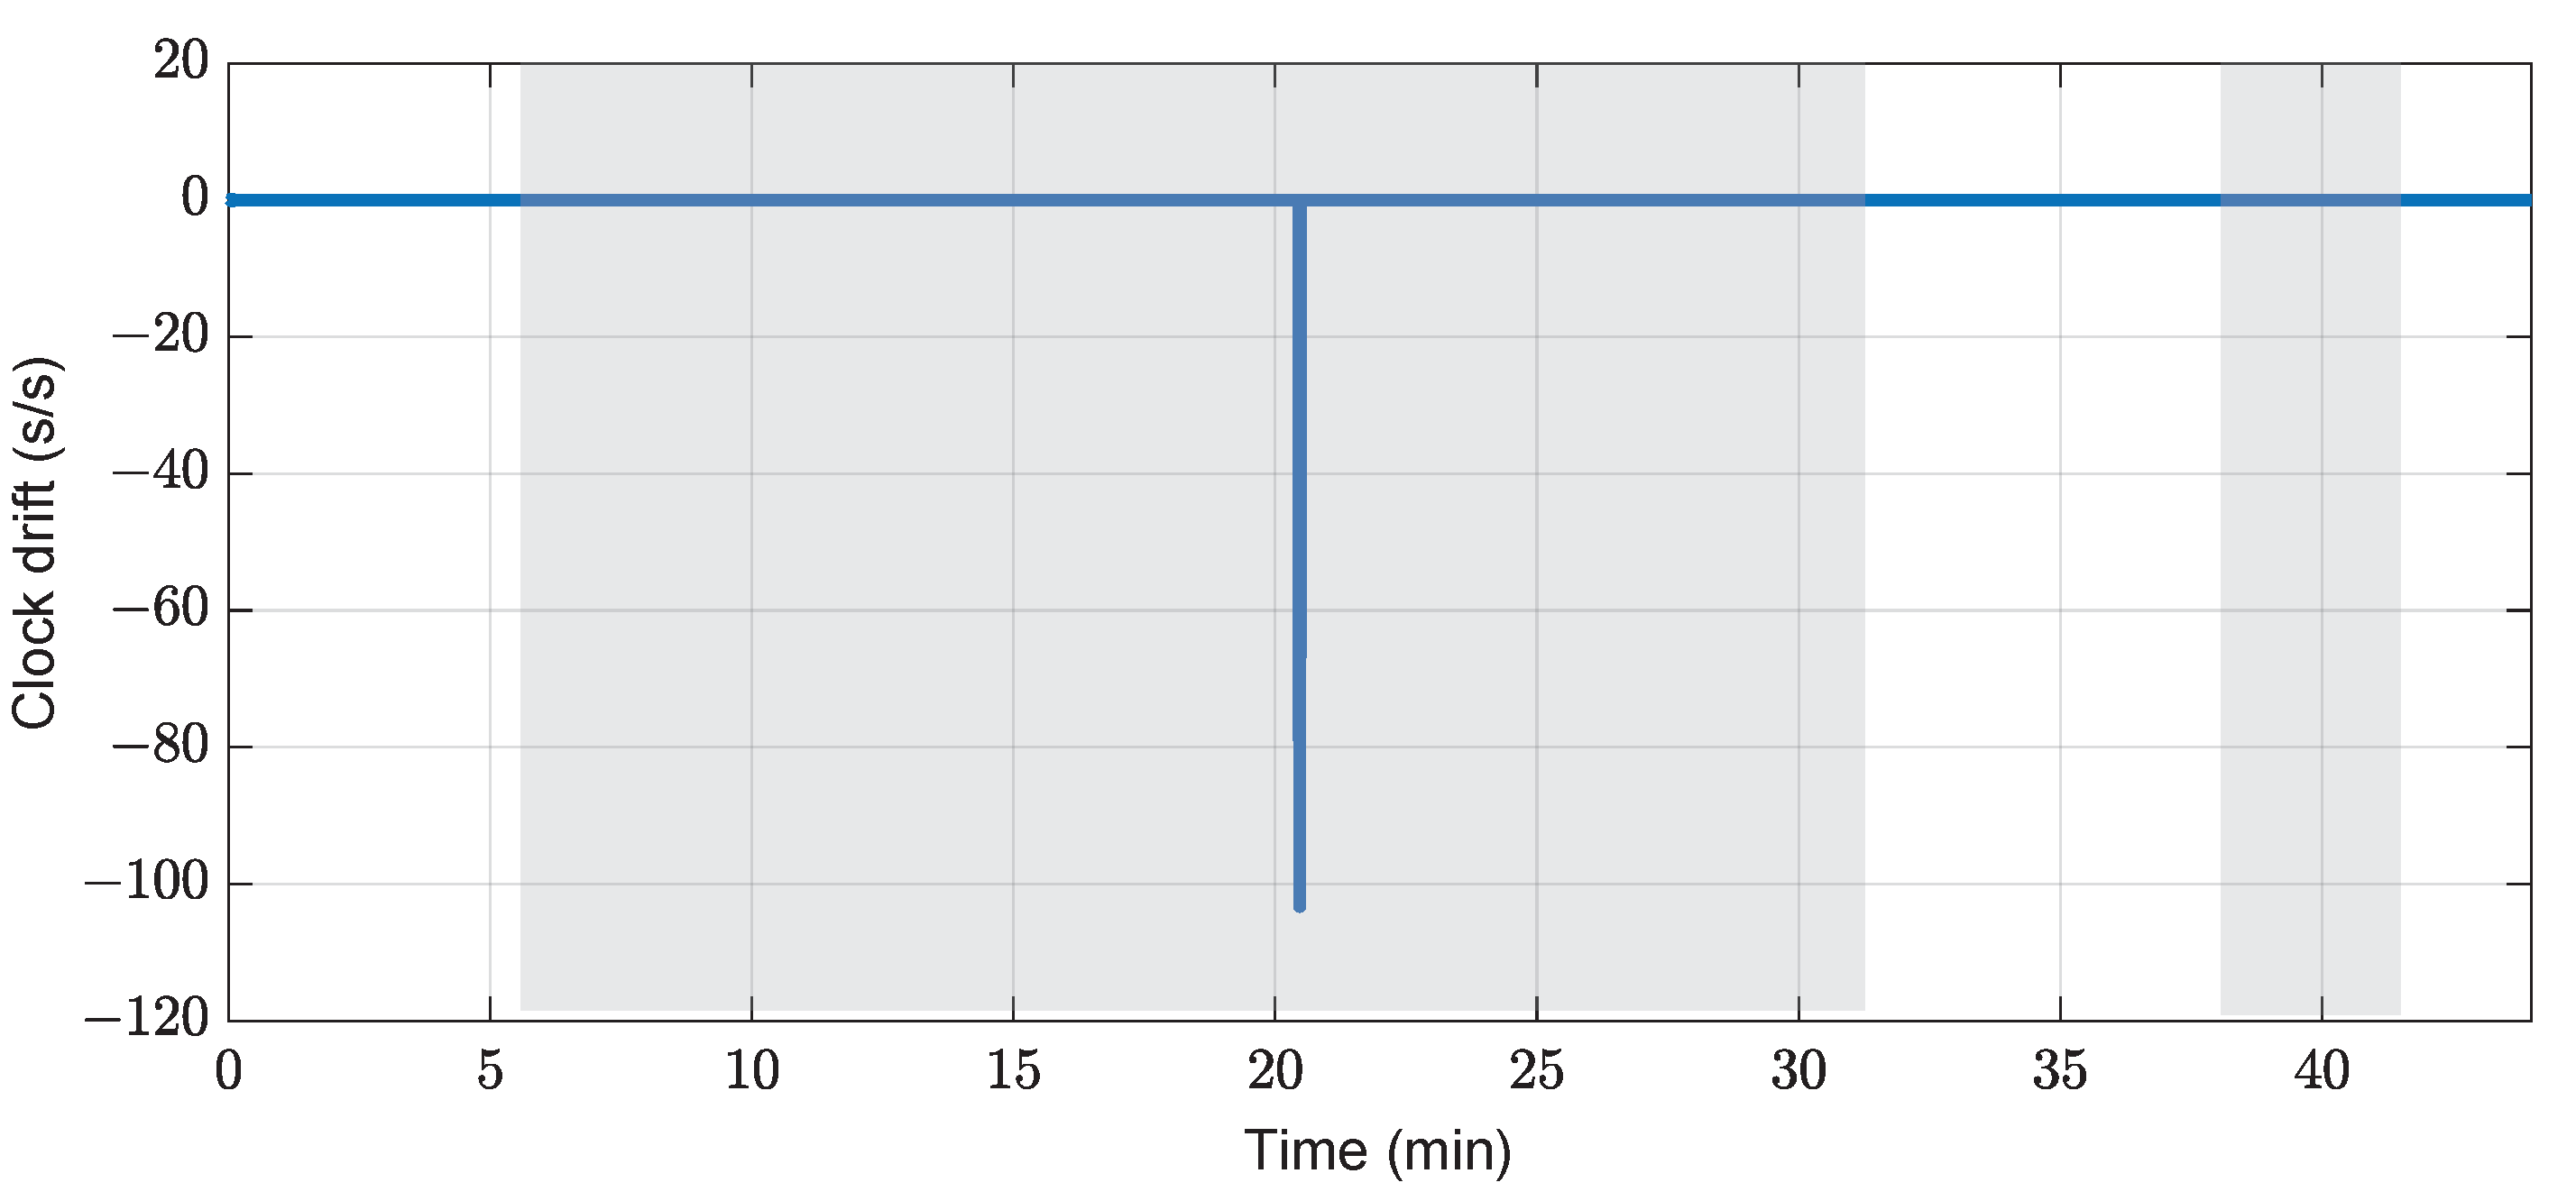
Figure 18 shows an outlier when there is a variation between the GNSS receiver clock of the smartphone and the GPS time. This happens when the spoofing attack starts and ends. The faulty navigation signal we generated for the journey recorded in Paris was introduced at minute 21 and it lasted until the end of the journey. From minute 6 until minute 32 (see
Figure 15) there was no satellite reception. The periods of no satellite reception have been indicated in
Figure 18 with a gray shadow. The signal loss yields to no signal interruption because the out-of-the-box GNSS solution of the smartphone extrapolates the offset between the clocks during the period of no reception.
The attack starts under no satellite reception conditions at minute 21. The introduction of the faulty navigation signal produces an outlier in the offset of the clocks, as shown in
Figure 18.
However, there are limitations of the method of detecting the attack based on the GNSS receiver clock: if the attack occurs exactly at the same time as the smartphone recovers the GNSS reception, e.g., when leaving an underground station, there is no possibility of differentiating between an attack and the pure recovery of GNSS reception. Nonetheless, the out-of-the-box GNSS navigation signal provided by the smartphone is usually extrapolated from the last received GNSS signal to cover the periods of no reception.
3.2.2. Map Matching
The only-GNSS-based identification of transport modes will be calculated only in the case that the system is not under attack. If the system is not considered under attack, the identification of transport modes is carried out using the out-of-the-box GNSS position and GNSS velocity with the map-matching algorithm explained in
Section 3.1.2. The figures of the transport modes identified correspond to
Figure 14 and
Figure 15.
4. Discussion
In
Section 3, we have presented two different methods to make the smartphone-based transport identification of transport modes resilient under GNSS-based attacks, particularly spoofing. We have demonstrated that the identification of transport modes only based on the GNSS position and velocity is vulnerable, because the GNSS legitimate navigation signal can be replaced by a faulty navigation signal.
The multisensor-based identification of transport modes has the advantage of using sensors that are embedded in commercial smartphones, such as the accelerometer, magnetometer, barometer and GNSS receiver. The combination of different and independent sources of information has three main advantages. First, the map matching (GNSS-based) solves ambiguities, such as the outliers outputted by the convolutional neural network (accelerometer-, magnetometer- and barometer-based) shown in
Figure 11 and
Figure 12. Second, the system-under-attack check B is simply based on the long-term incongruities between the outputs of the convolutional neural network and the map matching. By default, the system decides that the GNSS signal has been attacked because this is more likely to happen than that the accelerometer, magnetometer and barometer are all malfunctioning simultaneously. Third, the transport mode identification can also be realized in scenarios where the satellite reception is not possible, such as stations or underground, as shown in
Figure 15, using only the convolutional neural network.
The only-GNSS-based identification of transport modes has the advantage of being computationally cheap, since the information required for the identification of transport modes is only the out-of-the-box GNSS position and GNSS velocity at 1 Hz. This reduces considerably the amount of data that has to be either processed in the smartphone or transmitted to the cloud, compared with the multisensor method. Both the GNSS position and GNSS velocity are always available provided the smartphone has satellite reception. The system-under-attack check B only requires checking for outliers between the GPS time and the GNSS receiver clock of the smartphone, as
Figure 17 and
Figure 18 show. Likewise, if there is no satellite reception, the attack might not be detected, since outliers between the GPS time and the GNSS receiver clock of the smartphone can also be due to losing the satellite reception, e.g., entering a roofed station or using the subway.
The system-under-attack check B, based on the GNSS receiver clock, can also be applied to the multisensor-based identification of transport modes as a redundancy to confirm whether the GNSS is under attack.


 ,
, 


