
Efficiency of Regional Airports: Insights on the Effect of Airline Type and Seasonal Variations in Traffic

Abstract
:1. Introduction
2. Literature Review
- RQ1. What is the impact of the operation of low-cost airlines on airport efficiency?
- RQ2. What is the impact of the operation of charter flights on airport efficiency?
- RQ3. How does seasonality influence airport efficiency?
3. Contextual Setting
4. Methodology and Data
4.1. First Stage: Data Envelopment Analysis
- If MPI = 1, the airport efficiency has remained the same;
- If MPI > 1, the airport has shown a positive productivity from year t to year t + 1;
- If MPI < 1, the airport productivity change from year t to year t + 1 is negative.
4.2. Second Stage: Tobit Regression Analysis
5. Data Analysis and Results
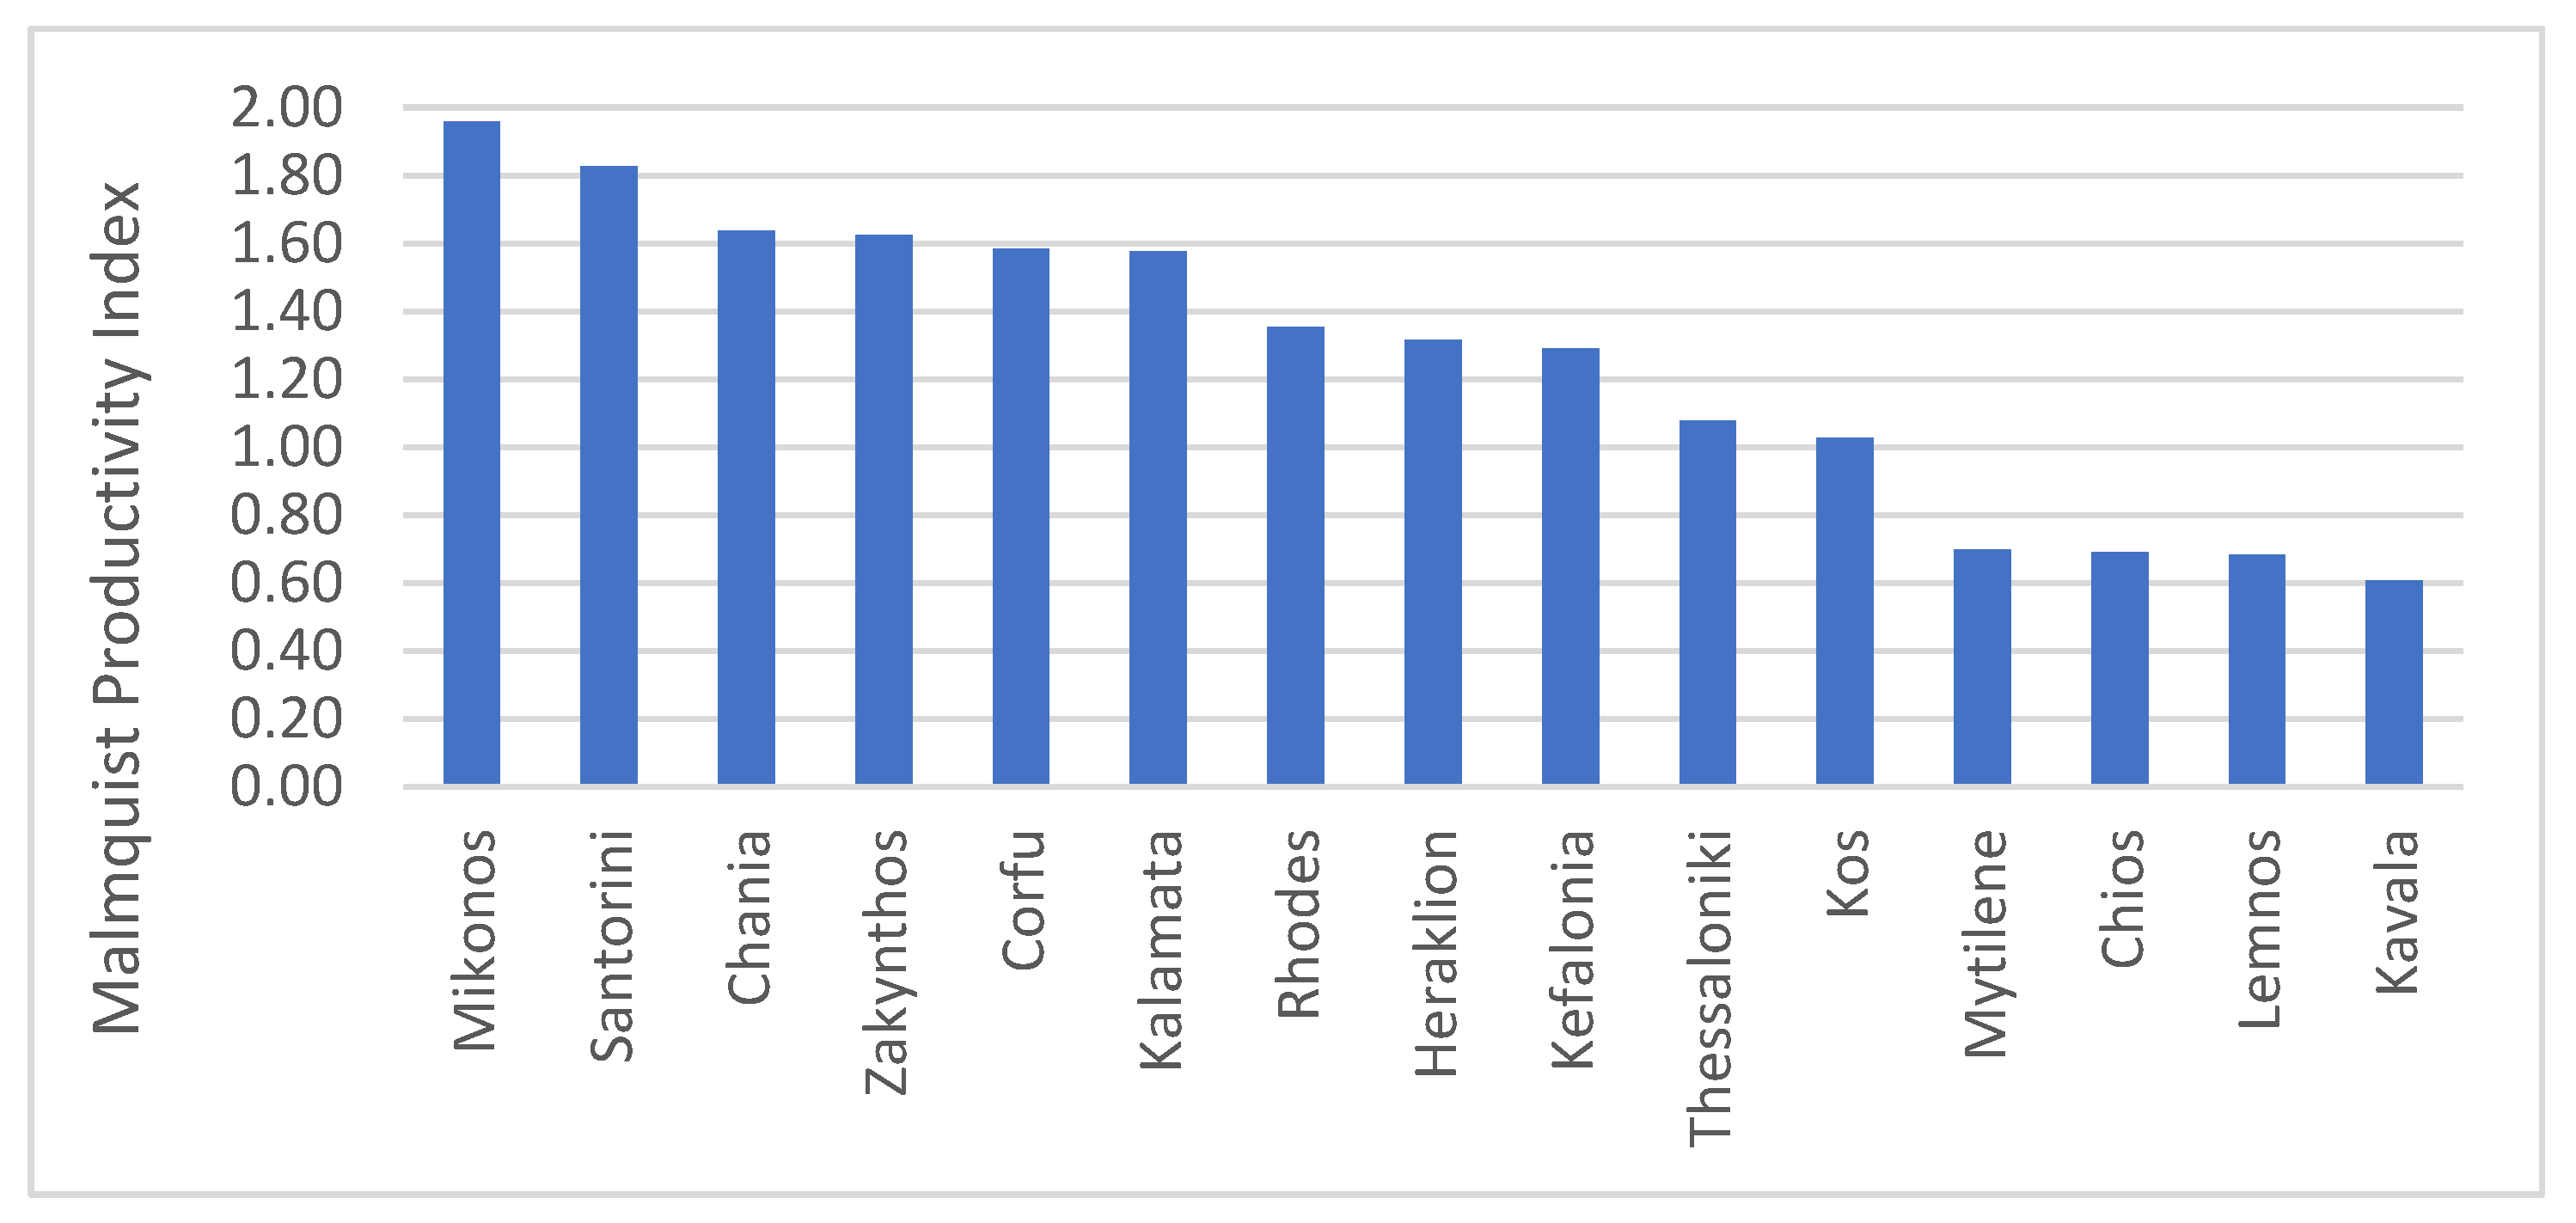
5.1. DEA Scores
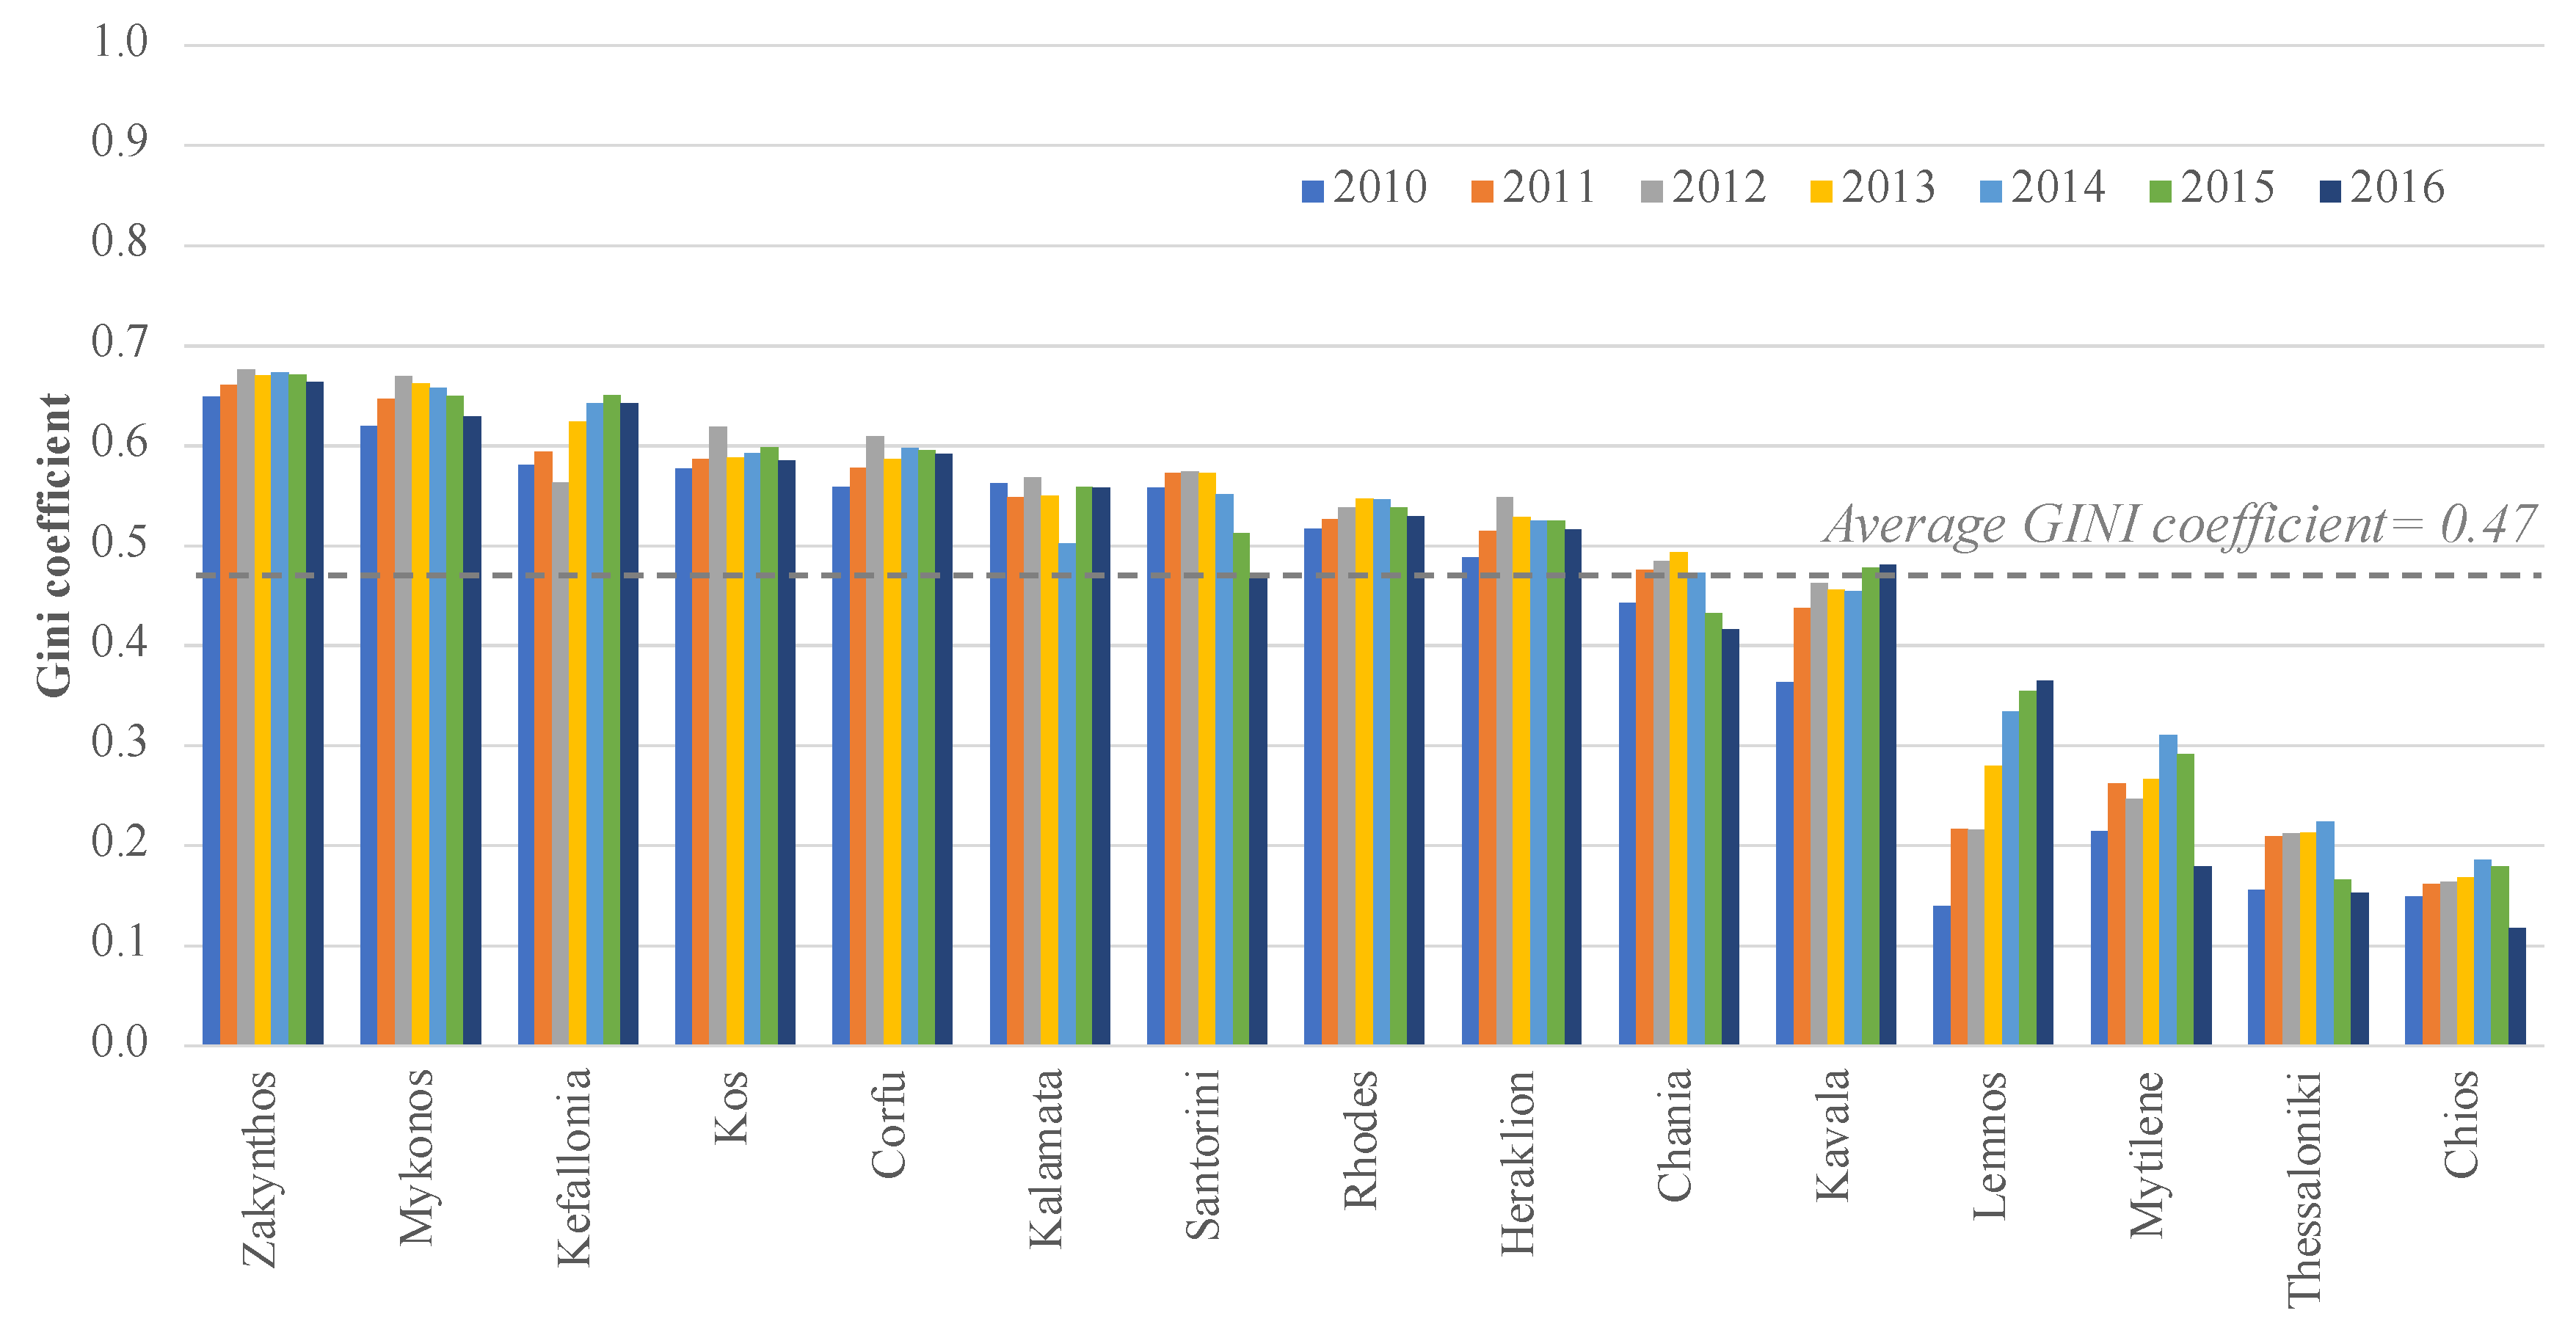
5.2. Seasonality
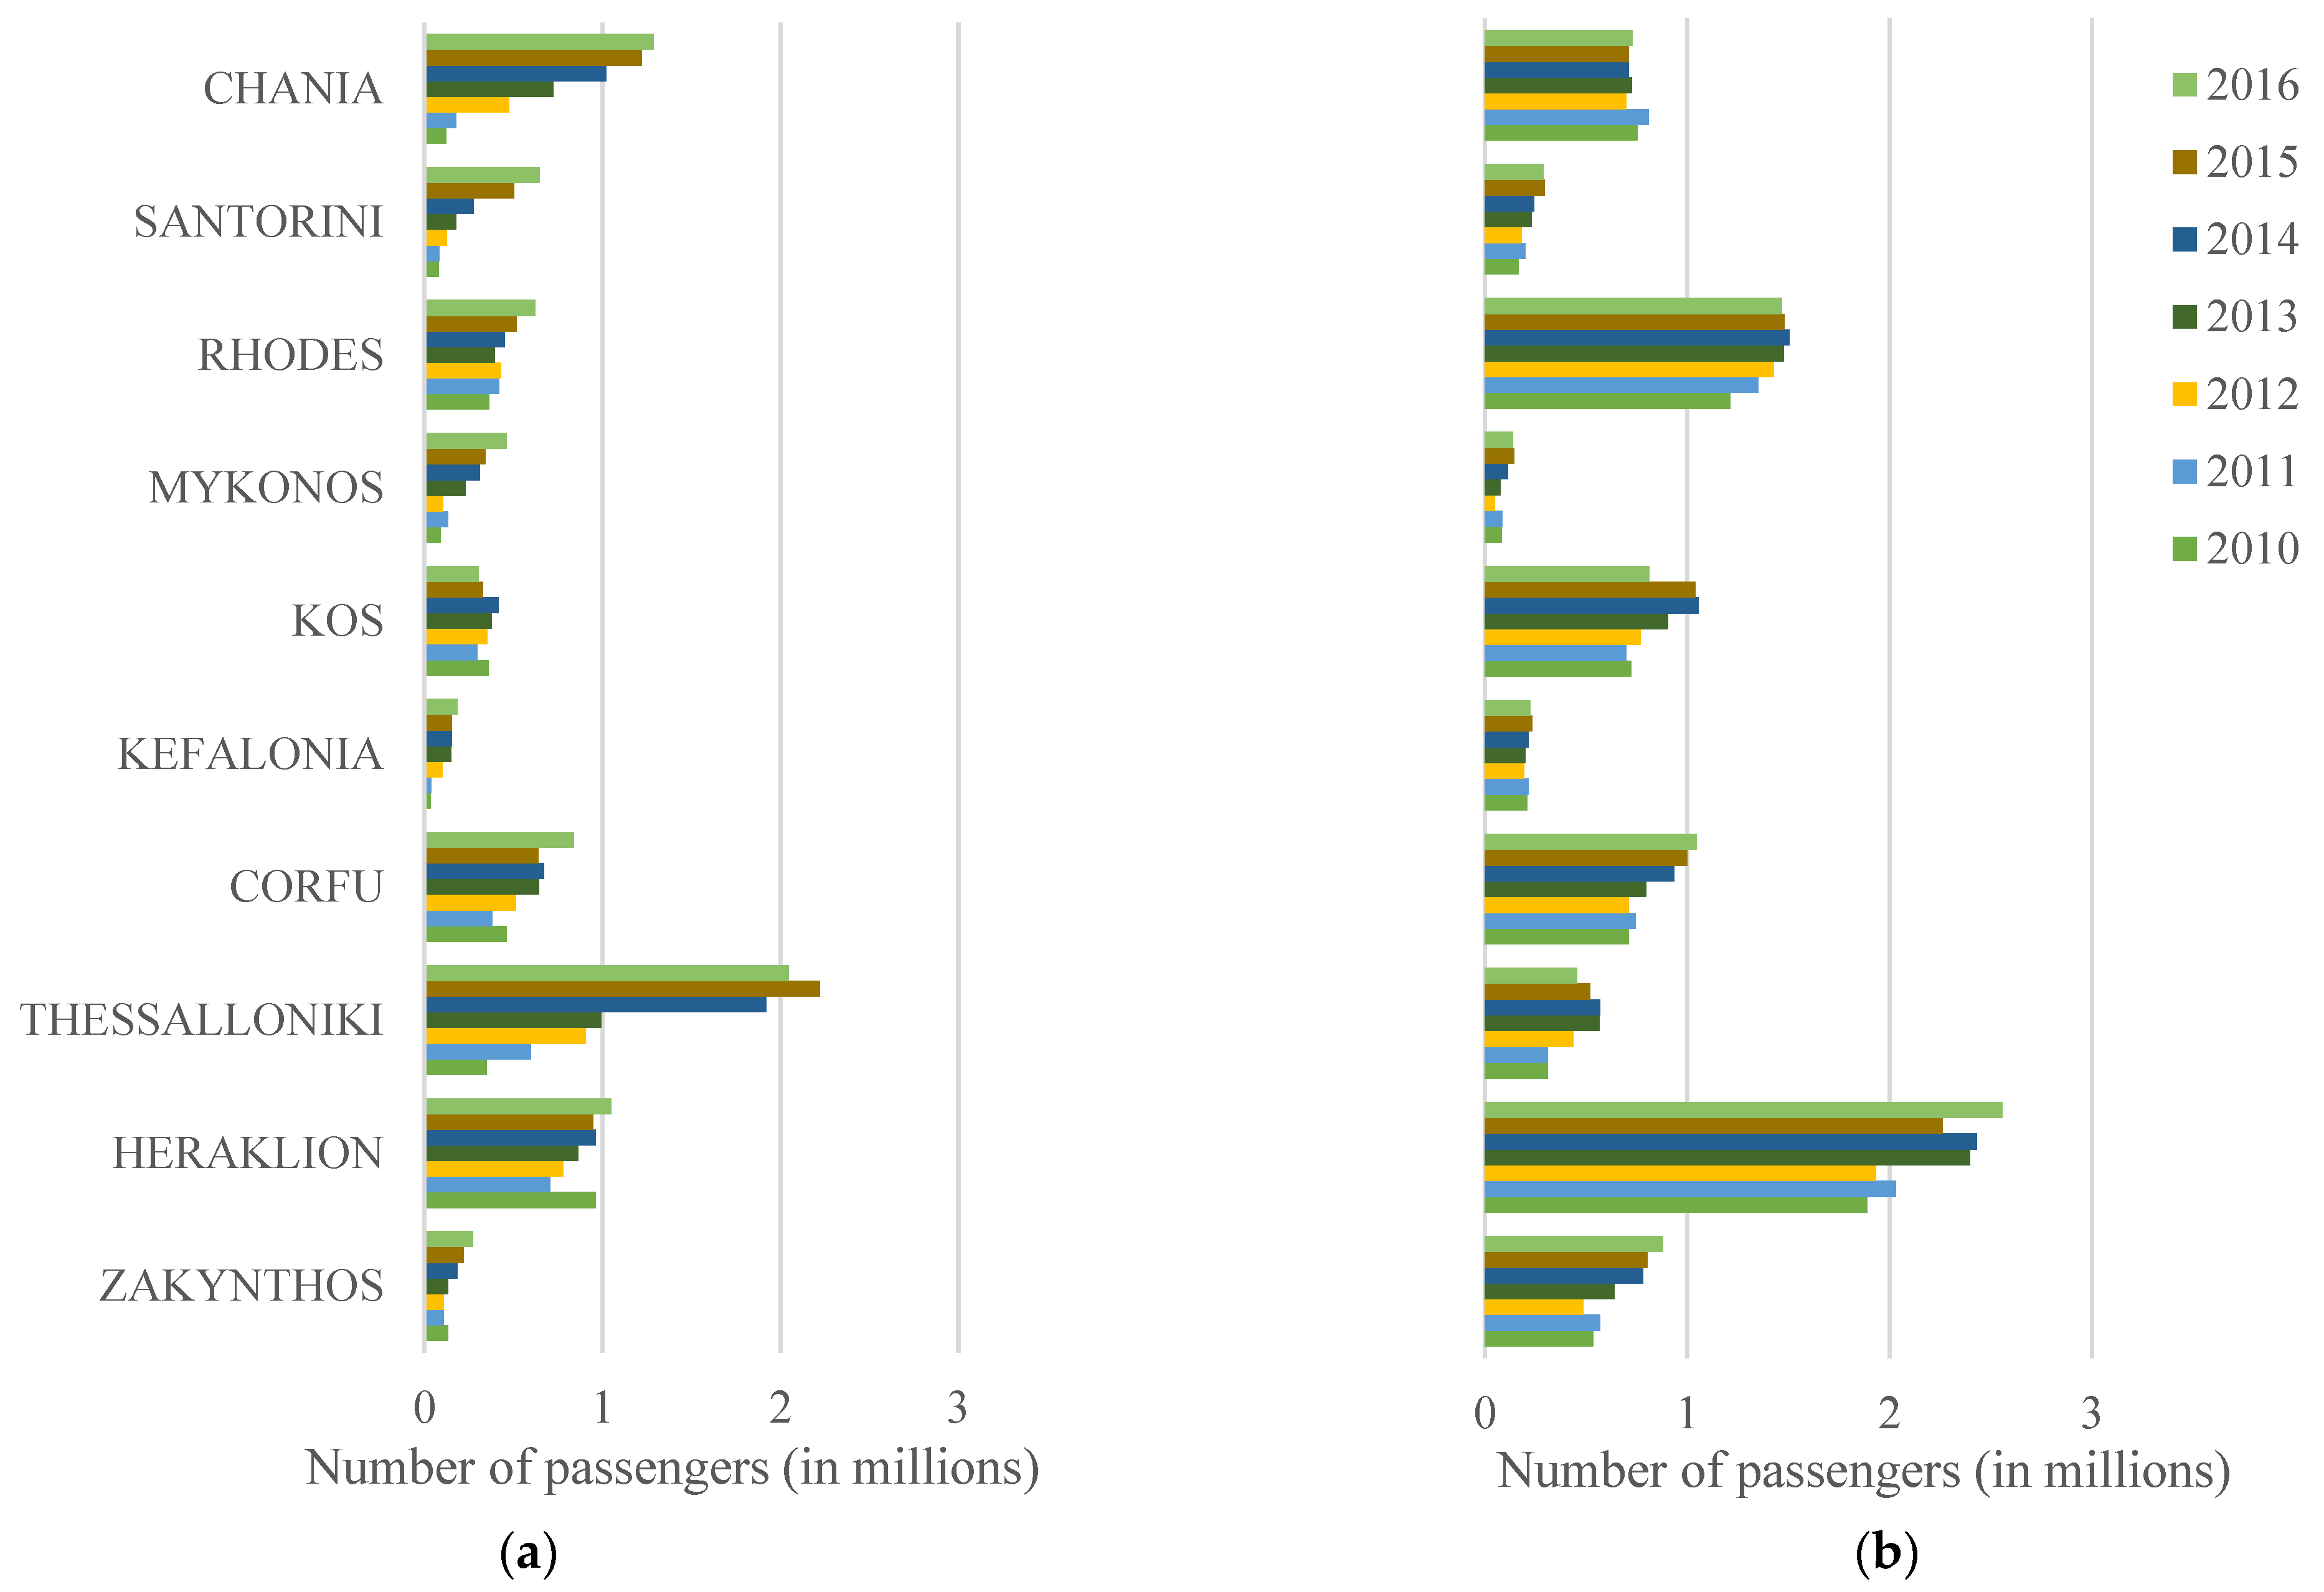
5.3. Airline Type
5.4. Second-Stage Results
6. Conclusions
Author Contributions
Funding
Institutional Review Board Statement
Informed Consent Statement
Data Availability Statement
Conflicts of Interest
References
- Halpern, N.; Bråthen, S. Impact of airports on regional accessibility and social development. J. Transp. Geogr. 2011, 19, 1145–1154. [Google Scholar] [CrossRef]
- Kazda, A.; Hromádka, M.; Mrekaj, B. Small regional airports operation: Unnecessary burdens or key to regional development. Transp. Res. Procedia 2017, 28, 59–68. [Google Scholar] [CrossRef]
- Strickland, J. Current challenges and future prospects for EU secondary airports. Policy Dep. B Struct. Cohes. Policies 2015. Available online: https://www.europarl.europa.eu/RegData/etudes/STUD/2015/540373/IPOL_STU(2015)540373_EN.pdf (accessed on 19 September 2022).
- Karlaftis, M.G. Demand forecasting in regional airports: Dynamic Tobit models with GARCH errors. Sitraer 2008, 7, 100–111. [Google Scholar]
- Lucas, P.; Lioutov, I. Seasonal Markets. In Airport Council International World Report; Airport Council International: Montreal, QC, Canada, 2018. [Google Scholar]
- Zuidberg, J. Exploring the determinants for airport profitability: Traffic characteristics, low-cost carriers, seasonality and cost efficiency. Transp. Res. Part A Policy Pract. 2017, 101, 61–72. [Google Scholar] [CrossRef]
- International Air Transport Association (IATA). More Connectivity and Improved Efficiency—2018 Airline Industry Statistics Released. 2019. Available online: https://www.iata.org/en/pressroom/pr/2019-07-31-01/ (accessed on 9 October 2020).
- Dobruszkes, F.; Givoni, M.; Vowles, T. Hello major airports, goodbye regional airports? Recent changes in European and US low-cost airline airport choice. J. Air Transp. Manag. 2017, 59, 50–62. [Google Scholar] [CrossRef]
- Graham, A. Understanding the low cost carrier and airport relationship: A critical analysis of the salient issues. Tour. Manag. 2013, 36, 66–76. [Google Scholar] [CrossRef]
- Červinka, M. Small regional airport performance and low cost carrier operations. Transp. Res. Procedia 2017, 28, 51–58. [Google Scholar] [CrossRef]
- Humphreys, I.; Ison, S.; Francis, G. A review of the airport-low cost airline relationship. Rev. Netw. Econ. 2006, 5, 413–420. [Google Scholar] [CrossRef]
- Francis, G.; Humphreys, I.; Ison, S. Airports’ perspectives on the growth of low-cost airlines and the remodeling of the airport–airline relationship. Tour. Manag. 2004, 25, 507–514. [Google Scholar] [CrossRef]
- De Neufville, R. Management of multi-airport systems: A development strategy. J. Air Transp. Manag. 1995, 2, 99–110. [Google Scholar] [CrossRef]
- Dziedzic, M.; Njoya, E.T.; Warnock-Smith, D.; Hubbard, N. Determinants of air traffic volumes and structure at small European airports. Res. Transp. Econ. 2020, 79, 100749. [Google Scholar] [CrossRef]
- Oum, T.H.; Yan, J.; Yu, C. Ownership forms matter for airport efficiency: A stochastic frontier investigation of worldwide airports. J. Urban Econ. 2008, 64, 422–435. [Google Scholar] [CrossRef]
- Yoshida, Y.; Fujimoto, H. Japanese-airport benchmarking with the DEA and endogenous-weight TFP methods: Testing the criticism of overinvestment in Japanese regional airports. Transp. Res. Part E Logist. Transp. Rev. 2004, 40, 533–546. [Google Scholar] [CrossRef]
- Scotti, D.; Malighetti, P.; Martini, G.; Volta, N. The impact of airport competition on technical efficiency: A stochastic frontier analysis applied to Italian airport. J. Air Transp. Manag. 2012, 22, 9–15. [Google Scholar] [CrossRef]
- Barros, C.P.; Wanke, P.; Nwaogbe, O.R.; Azad, M.A.K. Efficiency in nigerian airports. Case Stud. Transp. Policy 2017, 5, 573–579. [Google Scholar] [CrossRef]
- Chen, Y.-H.; Lai, P.-L. Determining the relationship between ownership and technical efficiency by using a dynamic stochastic production frontier approach. J. Air Transp. Manag. 2018, 75, 61–67. [Google Scholar] [CrossRef]
- Adler, N.; Volta, N. Ranking methods within data envelopment analysis. In The Palgrave Handbook of Economic Performance Analysis; Palgrave Macmillan: Cham, Switzerland, 2019; pp. 189–224. [Google Scholar]
- Farrell, M.J. The measurement of productive efficiency. J. R. Stat. Soc. Series A 2019, 120, 253–281. [Google Scholar] [CrossRef]
- Sowlati, T.; Paradi, J.C. Establishing the “practical frontier” in data envelopment analysis. Omega 2004, 32, 261–272. [Google Scholar] [CrossRef]
- Paraschi, E.P.; Georgopoulos, A.; Papatheodorou, A. Abiotic determinants of airport performance: Insights from a global survey. Transp. Policy 2019, 85, 33–53. [Google Scholar] [CrossRef]
- Iyer, K.C.; Jain, S. Performance measurement of airports using data envelopment analysis: A review of methods and findings. J. Air Transp. Manag. 2019, 81, 101707. [Google Scholar] [CrossRef]
- Lai, P.-L.; Potter, A.; Beynon, M. The Development of Benchmarking Techniques in Airport Performance Evaluation Research. Transp. J. 2012, 51, 305–337. [Google Scholar] [CrossRef]
- Liebert, V.; Niemeier, H.M. A survey of empirical research on the productivity and efficiency measurement of airports. J. Transp. Econ. Policy 2013, 47, 157–189. [Google Scholar]
- Abbott, M. Reform and efficiency of New Zealand’s airports. Util. Policy 2015, 36, 1–9. [Google Scholar] [CrossRef]
- Barros, C.P.; Dieke, P.U. Performance evaluation of Italian airports: A data envelopment analysis. J. Air Transp. Manag. 2007, 13, 184–191. [Google Scholar] [CrossRef]
- Bazargan, M.; Vasigh, B. Size versus efficiency: A case study of US commercial airports. J. Air Transp. Manag. 2003, 9, 187–193. [Google Scholar] [CrossRef]
- Carlucci, F.; Cirà, A.; Coccorese, P. Measuring and explaining airport efficiency and sustainability: Evidence from Italy. Sustainability 2018, 10, 400. [Google Scholar] [CrossRef]
- Coto-Millán, P.; Casares-Hontañón, P.; Inglada, V.; Agüeros, M.; Pesquera, M.; Badiola, A. Small is beautiful? The impact of economic crisis, low cost carriers, and size on efficiency in Spanish airports (2009–2011). J. Air Transp. Manag. 2014, 40, 34–41. [Google Scholar] [CrossRef]
- Coto-Millán, P.; Inglada, V.; Fernández, X.L.; Inglada-Pérez, L.; Pesquera, M. The “effect procargo” on technical and scale efficiency at airports: The case of Spanish airports (2009–2011). Util. Policy 2016, 39, 29–35. [Google Scholar] [CrossRef]
- Curi, C.; Gitto, S.; Mancuso, P. New evidence on the efficiency of Italian airports: A bootstrapped DEA analysis. Socio-Econ. Plan. Sci. 2011, 45, 84–93. [Google Scholar] [CrossRef]
- Fragoudaki, A.; Giokas, D.; Glyptou, K. Efficiency and productivity changes in Greek airports during the crisis years 2010–2014. J. Air Transp. Manag. 2016, 57, 306–315. [Google Scholar] [CrossRef]
- Merkert, R.; Mangia, L. Management of airports in extreme winter conditions—Some lessons from analysing the efficiency of Norwegian airports. Res. Transp. Bus. Manag. 2012, 4, 53–60. [Google Scholar] [CrossRef]
- Merkert, R.; Mangia, L. Efficiency of Italian and Norwegian airports: A matter of management or of the level of competition in remote regions? Transp. Res. Part A Policy Pract. 2014, 62, 30–38. [Google Scholar] [CrossRef]
- Ülkü, T. A comparative efficiency analysis of Spanish and Turkish airports. J. Air Transp. Manag. 2015, 46, 56–68. [Google Scholar] [CrossRef]
- Pels, E.; Nijkamp, P.; Rietveld, P. Inefficiencies and scale economies of European airport operations. Transp. Res. Part E Logist. Transp. Rev. 2003, 39, 341–361. [Google Scholar] [CrossRef]
- Ablanedo-Rosas, J.H.; Gemoets, L.A. Measuring the efficiency of Mexican airports. J. Air Transp. Manag. 2010, 16, 343–345. [Google Scholar] [CrossRef]
- Perelman, S.; Serebrisky, T. Measuring the technical efficiency of airports in Latin America. Util. Policy 2012, 22, 1–7. [Google Scholar] [CrossRef]
- Lin, L.; Hong, C. Operational performance evaluation of international major airports: An application of data envelopment analysis. J. Air Transp. Manag. 2006, 12, 342–351. [Google Scholar] [CrossRef]
- Graham, A. The objectives and outcomes of airport privatisation. Res. Transp. Bus. Manag. 2011, 1, 3–14. [Google Scholar] [CrossRef]
- Willner, J.; Parker, D. The performance of public and private enterprise under conditions of active and passive ownership and competition and monopoly. J. Econ. 2007, 90, 221–253. [Google Scholar] [CrossRef]
- Gillen, D.; Lall, A. Developing measures of airport productivity and performance: An application of data envelopment analysis. Transp. Res. Part E Logist. Transp. Rev. 1997, 33, 261–273. [Google Scholar] [CrossRef]
- Sarkis, J. An analysis of the operational efficiency of major airports in the United States. J. Oper. Manag. 2000, 18, 335–351. [Google Scholar] [CrossRef]
- Gerber, P. Success factors for the privatisation of airports—An airline perspective. J. Air Transp. Manag. 2002, 8, 29–36. [Google Scholar] [CrossRef]
- Barros, C.P. Airports in Argentina: Technical efficiency in the context of an economic crisis. J. Air Transp. Manag. 2008, 14, 315–319. [Google Scholar] [CrossRef]
- Tsui, W.H.K.; Balli, H.O.; Gilbey, A.; Gow, H. Operational efficiency of Asia–Pacific airports. J. Air Transp. Manag. 2014, 40, 16–24. [Google Scholar] [CrossRef]
- Karanki, F.; Lim, S.H. The effects of use agreements on airport efficiency. J. Air Transp. Manag. 2020, 84, 101767. [Google Scholar] [CrossRef]
- Adler, N.; Golany, B. Evaluation of deregulated airline networks using data envelopment analysis combined with principal component analysis with an application to Western Europe. Eur. J. Oper. Res. 2001, 132, 260–273. [Google Scholar] [CrossRef]
- Barros, C.P.; Dieke, P.U.C. Measuring the economic efficiency of airports: A Simar–Wilson methodology analysis. Transp. Res. Part E Logist. Transp. Rev. 2008, 44, 1039–1051. [Google Scholar] [CrossRef]
- Tapiador, F.J.; Mateos, A.; Martí-Henneberg, J. The geographical efficiency of Spain’s regional airports: A quantitative analysis. J. Air Transp. Manag. 2008, 14, 205–212. [Google Scholar] [CrossRef]
- Assaf, A. The cost efficiency of Australian airports post privatisation: A Bayesian methodology. Tour. Manag. 2010, 31, 267–273. [Google Scholar] [CrossRef]
- Tsekeris, T. Greek airports: Efficiency measurement and analysis of determinants. J. Air Transp. Manag. 2011, 17, 140–142. [Google Scholar] [CrossRef]
- Chang, Y.-C.; Yu, M.-M.; Chen, P.-C. Evaluating the performance of Chinese airports. J. Air Transp. Manag. 2013, 31, 19–21. [Google Scholar] [CrossRef]
- Ripoll-Zarraga, A.E.; Raya, J.M. Tourism indicators and airports’ technical efficiency. Ann. Tour. Res. 2020, 80, 102819. [Google Scholar] [CrossRef]
- Yu, M.-M. Measuring physical efficiency of domestic airports in Taiwan with undesirable outputs and environmental factors. J. Air Transp. Manag. 2004, 10, 295–303. [Google Scholar] [CrossRef]
- Martín, J.C.; Román, C.; Voltes-Dorta, A. Scale economies and marginal costs in Spanish airports. Transp. Res. Part E Logist. Transp. Rev. 2011, 47, 238–248. [Google Scholar] [CrossRef]
- Fragoudaki, A.; Giokas, D. Airport performance in a tourism receiving country: Evidence from Greece. J. Air Transp. Manag. 2016, 52, 80–89. [Google Scholar] [CrossRef]
- Huynh, T.M.; Kim, G.; Ha, H.-K. Comparative analysis of efficiency for major Southeast Asia airports: A two-stage approach. J. Air Transp. Manag. 2020, 89, 101898. [Google Scholar] [CrossRef]
- Ha, H.-K.; Wan, Y.; Yoshida, Y.; Zhang, A. Airline market structure and airport efficiency: Evidence from major Northeast Asian airports. J. Air Transp. Manag. 2013, 33, 32–42. [Google Scholar] [CrossRef]
- Button, K.; Kramberger, T.; Grobin, K.; Rosi, B. A note on the effects of the number of low-cost airlines on small tourist airports’ efficiencies. J. Air Transp. Manag. 2018, 72, 92–97. [Google Scholar] [CrossRef]
- Choo, Y.Y.; Oum, T.H. Impacts of low cost carrier services on efficiency of the major U.S. airports. J. Air Transp. Manag. 2013, 33, 60–67. [Google Scholar] [CrossRef]
- Fernández, X.L.; Coto-Millán, P.; Díaz-Medina, B. The impact of tourism on airport efficiency: The Spanish case. Util. Policy 2018, 55, 52–58. [Google Scholar] [CrossRef]
- Fragoudaki, A.; Giokas, D. Airport efficiency in the dawn of privatization: The case of Greece. J. Air Transp. Manag. 2020, 86, 101821. [Google Scholar] [CrossRef]
- Merkert, R.; Assaf, A.G. Using DEA models to jointly estimate service quality perception and profitability—Evidence from international airports. Transp. Res. Part A Policy Pract. 2015, 75, 42–50. [Google Scholar] [CrossRef]
- Pyrialakou, V.D.; Karlaftis, M.G.; Michaelides, P.G. Assessing operational efficiency of airports with high levels of low-cost carrier traffic. J. Air Transp. Manag. 2012, 25, 33–36. [Google Scholar] [CrossRef]
- Gutiérrez, E.; Lozano, S. Efficiency assessment and output maximization possibilities of European small and medium sized airports. Res. Transp. Econ. 2016, 56, 3–14. [Google Scholar] [CrossRef]
- Chutiphongdech, T.; Vongsaroj, R. Technical efficiency and productivity change analysis: A case study of the regional and local airports in Thailand. Case Stud. Transp. Policy 2022, 10, 870–890. [Google Scholar] [CrossRef]
- Bottasso, A.; Conti, M.; Piga, C. Low-cost carriers and airports’ performance: Empirical evidence from a panel of UK airports. Ind. Corp. Chang. 2012, 22, 745–769. [Google Scholar] [CrossRef]
- Williams, G. Will Europe’s charter carriers be replaced by “no-frills” scheduled airlines? J. Air Transp. Manag. 2001, 7, 277–286. [Google Scholar] [CrossRef]
- Castillo-Manzano, J.I.; Castro-Nuño, M.; López-Valpuesta, L.; Pedregal, D.J. Measuring the LCC effect on charter airlines in the Spanish airport system. J. Air Transp. Manag. 2017, 65, 110–117. [Google Scholar] [CrossRef]
- Wu, C.; Hayashi, Y. The effect of LCCs operations and scheduled services deregulation on air charter business in Japan. J. Transp. Geogr. 2014, 41, 37–44. [Google Scholar] [CrossRef]
- World Tourism Organization. International Tourism Highlights, 2019 Ed.; World Tourism Organization: Madrid, Spain, 2019. [Google Scholar]
- Tembleque-Vilalta, M.; Suau-Sanchez, P. A model to analyse the profitability of long-haul network development involving non-hub airports: The case of the Barcelona–Asian market. Case Stud. Transp. Policy 2016, 4, 188–197. [Google Scholar] [CrossRef]
- Psaraki-Kalouptsidi, V.; Kalakou, S. Assessment of efficiency of Greek airports. J. Airpt. Manag. 2011, 5, 170–186. [Google Scholar]
- Hellenic Civil Aviation Authority (HCAA). Air Traffic Statistics 2019. 2019. Available online: http://www.ypa.gr/profile/statistics/2019/ (accessed on 10 October 2020).
- Charnes, A.; Cooper, W.W.; Rhodes, E. Measuring the efficiency of decision making units. Eur. J. Oper. Res. 1978, 2, 429–444. [Google Scholar] [CrossRef]
- Banker, R.D.; Charnes, A.; Cooper, W.W.; Maindiratta, A. A comparison of DEA and translog estimates of production frontiers using simulated observations from a known technology. In Applications of Modern Production Theory: Efficiency and Productivity; Springer: Dordrecht, The Netherlands, 1988; pp. 33–55. [Google Scholar]
- Cooper, W.W.; Seiford, L.M.; Zhu, J. Data envelopment analysis: History, Models. In Handbook on Data Envelopment Analysis; International Series in Operations Research & Management Science; Springer: New York, NY, USA, 2011; pp. 1–40. [Google Scholar]
- Simar, L.; Wilson, P.W. Sensitivity Analysis of Efficiency Scores: How to Bootstrap in Nonparametric Frontier Models. Manag. Sci. 1998, 44, 49–61. [Google Scholar] [CrossRef] [Green Version]
- Simar, L.; Wilson, P.W. A general methodology for bootstrapping in non-parametric frontier models. J. Appl. Stat. 2000, 27, 779–802. [Google Scholar] [CrossRef]
- Simar, L.; Wilson, P.W. Estimation and inference in two-stage, semi-parametric models of production processes. J. Econom. 2007, 136, 31–64. [Google Scholar] [CrossRef]
- Malmquist, S. Index numbers and indifference surfaces. Trab. Estad. 1953, 4, 209–242. [Google Scholar] [CrossRef]
- Fare, R.; Färe, R.; Fèare, R.; Grosskopf, S.; Lovell, C.K. Production Frontiers; Cambridge University Press: Cambridge, UK, 1994. [Google Scholar]
- Timmer, M.P.; Los, B. Localized Innovation and Productivity Growth in Asia: An Intertemporal DEA Approach. J. Prod. Anal. 2005, 23, 47–64. [Google Scholar] [CrossRef]
- Asmild, M.; Paradi, J.C.; Aggarwall, V.; Schaffnit, C. Combining DEA window analysis with the Malmquist index approach in a study of the Canadian banking industry. J. Product. Anal. 2004, 21, 67–89. [Google Scholar] [CrossRef]
- Adler, N.; Liebert, V. Joint impact of competition, ownership form and economic regulation on airport performance and pricing. Transp. Res. Part A Policy Pract. 2014, 64, 92–109. [Google Scholar] [CrossRef]
- Forsyth, P.; Guiomard, C.; Niemeier, H.-M. COVID-19, the collapse in passenger demand and airport charges. J. Air Transp. Manag. 2020, 89, 101932. [Google Scholar] [CrossRef] [PubMed]
- Serrano, F.; Kazda, A. The future of airports post COVID-19. J. Air Transp. Manag. 2020, 89, 101900. [Google Scholar] [CrossRef]
- Suau-Sanchez, P.; Voltes-Dorta, A.; Cugueró-Escofet, N. An early assessment of the impact of COVID-19 on air transport: Just another crisis or the end of aviation as we know it? J. Transp. Geogr. 2020, 86, 102749. [Google Scholar] [CrossRef] [PubMed]


| Author | Inputs | Outputs | ||||||||||||||||||
| Airport area | Operational characteristics | Airside | Landside | Financial Data | ||||||||||||||||
| Runway | Apron | Terminal | Gates/Bridges | Baggage claim | Check-in desks | Car parking area | Labor | Capital | Operations | Other Costs | Passengers | Aircraft | Cargo | WLU | Environmental | Revenues | Other | |||
| Ablanedo-Rosas and Gemoets [39] | ● | ● | ● | ● | ||||||||||||||||
| Adler and Golany [50] | ● | ● | ● | ● | ||||||||||||||||
| Assaf [53] | ● | ● | ● | ● | ● | |||||||||||||||
| Barros [47] | ● | ● | ● | ● | ● | ● | ● | |||||||||||||
| Barros and Dieke [28,51] | ● | ● | ● | ● | ● | ● | ● | ● | ||||||||||||
| Bazargan and Vasigh [29] | ● | ● | ● | ● | ● | ● | ● | ● | ● | |||||||||||
| Button et al. [62] | ● | ● | ● | ● | ● | ● | ||||||||||||||
| Carlucci et al. [30] | ● | ● | ● | ● | ● | ● | ● | |||||||||||||
| Chang et al. [55] | ● | ● | ● | ● | ● | ● | ||||||||||||||
| Chen and Lai [19] | ● | ● | ||||||||||||||||||
| Choo and Oum [63] | ● | ● | ● | ● | ● | |||||||||||||||
| Coto-Millán et al. [31] | ● | ● | ● | ● | ● | ● | ||||||||||||||
| Coto-Millán et al. [32] | ● | ● | ● | ● | ● | ● | ||||||||||||||
| Curi et al. [33] | ● | ● | ● | ● | ● | ● | ||||||||||||||
| Fernández et al. [64] | ● | ● | ● | ● | ● | ● | ||||||||||||||
| Fragoudaki and Giokas [59] | ● | ● | ● | ● | ● | ● | ||||||||||||||
| Fragoudaki and Giokas [65] | ● | ● | ● | ● | ● | ● | ||||||||||||||
| Fragoudaki et al. [34] | ● | ● | ● | ● | ● | ● | ||||||||||||||
| Ha et al. [61] | ● | ● | ● | ● | ● | |||||||||||||||
| Huynh et al. [60] | ● | ● | ● | ● | ● | ● | ||||||||||||||
| Karanki et al. [49] | ● | ● | ● | ● | ● | ● | ● | ● | ||||||||||||
| Lin and Hong [41] | ● | ● | ● | ● | ● | ● | ||||||||||||||
| Martin et al. [58] | ● | ● | ● | ● | ● | ● | ● | |||||||||||||
| Merkert and Assaf [66] | ● | ● | ● | ● | ● | ● | ● | |||||||||||||
| Merkert and Mangia [35] | ● | ● | ● | ● | ● | ● | ● | ● | ● | ● | ||||||||||
| Merkert and Mangia [36] | ● | ● | ● | ● | ● | ● | ● | ● | ● | ● | ||||||||||
| Oum et al. [15] | ● | ● | ● | ● | ● | ● | ● | |||||||||||||
| Pels et al. [38] | ● | ● | ● | ● | ● | ● | ● | ● | ● | |||||||||||
| Perelman and Serebrisky [40] | ● | ● | ● | ● | ● | ● | ● | |||||||||||||
| Pyrialakou et al. [67] | ● | ● | ● | ● | ● | ● | ● | ● | ● | ● | ||||||||||
| Ripoll-Zarraga and Raya [56] | ● | ● | ● | ● | ● | ● | ● | |||||||||||||
| Sarkis [45] | ● | ● | ● | ● | ● | ● | ● | ● | ||||||||||||
| Scotti et al. [17] | ● | ● | ● | ● | ● | ● | ● | ● | ● | |||||||||||
| Tsekeris [54] | ● | ● | ● | ● | ● | ● | ● | |||||||||||||
| Tsui et al. [48] | ● | ● | ● | ● | ● | ● | ||||||||||||||
| Ülkü [37] | ● | ● | ● | ● | ● | ● | ● | |||||||||||||
| Yoshida and Fujimoto [16] | ● | ● | ● | ● | ● | ● | ● | |||||||||||||
| Yu [57] | ● | ● | ● | ● | ● | ● | ● | |||||||||||||
| No. | Airport | Airport Code | Ownership Status (after 2017) | Annual Passenger Traffic (in 2016) | Passenger Traffic in Peak Period (in 2016) [%] |
|---|---|---|---|---|---|
| 1 | Heraklion | HER | Public | 6,742,746 | 69% |
| 2 | Thessaloniki | SKG | Private | 5,687,325 | 44% |
| 3 | Rhodes | RHO | Private | 4,942,386 | 71% |
| 4 | Chania | CHQ | Private | 2,953,278 | 61% |
| 5 | Corfu (Kerkira) | CFU | Private | 2,764,559 | 76% |
| 6 | Kos | KGS | Private | 1,901,495 | 75% |
| 7 | Santorini | JTR | Private | 1,685,695 | 66% |
| 8 | Zakynthos | ZTH | Private | 1,415,712 | 85% |
| 9 | Mikonos | JMK | Private | 999,026 | 81% |
| 10 | Kefalonia | ELF | Private | 538,199 | 83% |
| 11 | Mytilene | MJT | Private | 411,285 | 46% |
| 12 | Kavala | KVA | Private | 258,239 | 70% |
| 13 | Kalamata | KLX | Public | 227,980 | 73% |
| 14 | Chios | JKH | Public | 196,130 | 41% |
| 15 | Lemnos | LXS | Public | 87,232 | 69% |
| Symbols | Meaning |
|---|---|
| θ0 | Efficiency score showing the proportional increase in output levels of the DMU 0 (airport 0) |
| ε | Small positive number (0<ε<<1) |
| m | Number of inputs (i = 1,2,…, m) |
| s | Number of outputs (r = 1,2,…, s) |
| Input slack variables | |
| Output slack variables | |
| m | Number of inputs (i = 1,2,…, m) |
| s | Number of outputs (r = 1,2,…, s) |
| n | Number of DMUs (airports) (j = 1,2,…, n) |
| λj | Intensity factor showing the contribution of airport j in the derivation of the efficiency of airport 0 |
| xij | Amount of input i used by airport j |
| yrj | Amount of output r produced by airport j |
| Variable | # Of Observations | Mean | Std. Dev. | Minimum | Maximum |
|---|---|---|---|---|---|
| First stage: DEA | |||||
| Inputs (year 2016): | |||||
| Runway length (m) | 15 | 2533 | 490 | 1511 | 3348 |
| Passengers terminal size (m2) | 15 | 14,815 | 15,036 | 1200 | 49,150 |
| Apron size (m2) | 15 | 56,802 | 37,383 | 8000 | 140,000 |
| Number of check-in counters | 15 | 10.75 | 14.33 | 2 | 40 |
| Outputs (year 2016): | |||||
| Aircraft movements | 15 | 16,545 | 15,137 | 2684 | 48,622 |
| Passengers (in thousands) | 15 | 2054 | 2088 | 87 | 6743 |
| Cargo (in tonnes) | 15 | 711,338 | 8,198,538 | 0 | 1,530,787.7 |
| Second stage: Tobit model explanatory variables(years 2010–2016) | |||||
| Market share of LCCs | 105 | 0.186 | 0.116 | 0.000 | 0.465 |
| Market share of CCs | 105 | 0.321 | 0.159 | 0.054 | 0.671 |
| GINI coefficient | 105 | 0.470 | 0.166 | 0.118 | 0.676 |
| Airport Location (=1 for island airports) | 105 | 0.800 | 0.402 | 0.000 | 1.000 |
| 2010 | 2011 | 2012 | 2013 | 2014 | 2015 | 2016 | Average | |||||||||
|---|---|---|---|---|---|---|---|---|---|---|---|---|---|---|---|---|
| Airport | CRS | VRS | CRS | VRS | CRS | VRS | CRS | VRS | CRS | VRS | CRS | VRS | CRS | VRS | CRS | VRS |
| SKG | 1.000 | 1.000 | 0.920 | 0.920 | 0.905 | 0.905 | 0.838 | 0.838 | 0.936 | 0.936 | 0.966 | 0.966 | 1.000 | 1.000 | 0.938 | 0.938 |
| KGS | 0.912 | 0.931 | 0.928 | 0.946 | 0.789 | 0.831 | 0.884 | 0.921 | 0.944 | 0.999 | 0.909 | 0.962 | 0.807 | 0.853 | 0.882 | 0.920 |
| HER | 0.735 | 0.808 | 0.772 | 0.848 | 0.721 | 0.781 | 0.806 | 0.842 | 0.839 | 0.861 | 0.844 | 0.865 | 0.939 | 0.963 | 0.808 | 0.853 |
| JKH | 1.000 | 1.000 | 0.777 | 0.859 | 0.682 | 0.700 | 0.750 | 0.750 | 0.695 | 0.695 | 0.748 | 0.748 | 0.803 | 0.803 | 0.779 | 0.794 |
| MJT | 0.899 | 1.000 | 0.712 | 0.801 | 0.671 | 0.740 | 0.694 | 0.762 | 0.732 | 0.801 | 0.718 | 0.784 | 0.618 | 0.687 | 0.721 | 0.796 |
| JTR | 0.584 | 0.585 | 0.583 | 0.585 | 0.530 | 0.531 | 0.588 | 0.590 | 0.733 | 0.734 | 0.856 | 0.857 | 0.969 | 0.970 | 0.692 | 0.693 |
| CHQ | 0.617 | 0.629 | 0.615 | 0.621 | 0.578 | 0.619 | 0.628 | 0.693 | 0.722 | 0.815 | 0.794 | 0.900 | 0.868 | 0.983 | 0.689 | 0.751 |
| RHO | 0.584 | 0.607 | 0.630 | 0.661 | 0.573 | 0.603 | 0.631 | 0.664 | 0.684 | 0.719 | 0.688 | 0.724 | 0.742 | 0.781 | 0.647 | 0.680 |
| CFU | 0.364 | 0.365 | 0.380 | 0.382 | 0.394 | 0.395 | 0.433 | 0.434 | 0.490 | 0.492 | 0.501 | 0.503 | 0.568 | 0.570 | 0.447 | 0.449 |
| KLX | 0.347 | 0.524 | 0.323 | 0.487 | 0.328 | 0.496 | 0.386 | 0.583 | 0.563 | 0.855 | 0.493 | 0.745 | 0.591 | 1.000 | 0.433 | 0.670 |
| JMK | 0.304 | 0.334 | 0.298 | 0.326 | 0.302 | 0.331 | 0.342 | 0.375 | 0.467 | 0.513 | 0.505 | 0.554 | 0.591 | 0.649 | 0.401 | 0.440 |
| ZTH | 0.258 | 0.258 | 0.272 | 0.273 | 0.258 | 0.258 | 0.297 | 0.298 | 0.352 | 0.352 | 0.375 | 0.376 | 0.419 | 0.419 | 0.319 | 0.319 |
| ELF | 0.280 | 0.302 | 0.256 | 0.276 | 0.272 | 0.293 | 0.282 | 0.304 | 0.296 | 0.323 | 0.307 | 0.332 | 0.333 | 0.362 | 0.289 | 0.313 |
| KVA | 0.317 | 0.329 | 0.299 | 0.312 | 0.197 | 0.204 | 0.200 | 0.208 | 0.196 | 0.202 | 0.194 | 0.198 | 0.176 | 0.176 | 0.225 | 0.233 |
| LXS | 0.234 | 0.271 | 0.179 | 0.204 | 0.161 | 0.183 | 0.158 | 0.180 | 0.173 | 0.196 | 0.174 | 0.198 | 0.153 | 0.173 | 0.176 | 0.201 |
| Explanatory Variables | Model 1: CRS | Model 2: CRS & Cluster-Robust Standard Errors | Model 3: VRS | Model 4: VRS & Cluster-Robust Standard Errors | ||||
|---|---|---|---|---|---|---|---|---|
| Coef (Std Error) | t-Value | Coef (Std Error) | t-Value | Coef (Std Error) | t-Value | Coef (Std Error) | t-Value | |
| Constant | 0.694 *** (0.075) | 9.246 | 0.694 *** (0.188) | 3.687 | 0.768 *** (0.082) | 9.351 | 0.768 *** (0.197) | 3.900 |
| Low cost airlines | 1.062 *** (0.233) | 4.559 | 1.062 * (0.464) | 2.289 | 1.022 *** (0.255) | 4.015 | 1.022 * (0.472) | 2.166 |
| Charter air traffic | 0.439 * (0.206) | 2.135 | 0.439 (0.418) | 1.049 | 0.437 * (0.224) | 1.905 | 0.437 * (0.431) | 1.015 |
| Seasonality | −1.215 *** (0.223) | −5.449 | −1.215 *** (0.285) | −4.263 | −1.157 *** (0.243) | −4.747 | −1.157 *** (0.279) | −4.149 |
| Island location | 0.130 * (0.057) | 2.284 | 0.130 (0.116) | 1.116 | 0.067 (0.062) | 1.077 | 0.067 (0.159) | 0.42 |
| logSigma | −1.506 *** (0.070) | −21.401 | −1.506 *** (0.131) | −11.487 | −1.421 *** (0.071) | −19.899 | −1.421 *** (0.111) | −12.789 |
| Number of observations | 105 | 105 | 105 | 105 | ||||
Publisher’s Note: MDPI stays neutral with regard to jurisdictional claims in published maps and institutional affiliations. |
© 2022 by the authors. Licensee MDPI, Basel, Switzerland. This article is an open access article distributed under the terms and conditions of the Creative Commons Attribution (CC BY) license (https://creativecommons.org/licenses/by/4.0/).
Share and Cite
Pagoni, I.; Koumoutsidi, A. Efficiency of Regional Airports: Insights on the Effect of Airline Type and Seasonal Variations in Traffic. Future Transp. 2022, 2, 774-792. https://doi.org/10.3390/futuretransp2040043
Pagoni I, Koumoutsidi A. Efficiency of Regional Airports: Insights on the Effect of Airline Type and Seasonal Variations in Traffic. Future Transportation. 2022; 2(4):774-792. https://doi.org/10.3390/futuretransp2040043
Chicago/Turabian StylePagoni, Ioanna, and Annitsa Koumoutsidi. 2022. "Efficiency of Regional Airports: Insights on the Effect of Airline Type and Seasonal Variations in Traffic" Future Transportation 2, no. 4: 774-792. https://doi.org/10.3390/futuretransp2040043