Article

The Influence of Public Transportation Stops on Bike-Sharing Destination Trips: Spatial Analysis of Budapest City

1
Department of Transport Technology and Economics, Faculty of Transportation Engineering and Vehicle Engineering, Budapest University of Technology and Economics, Műegyetem rkp. 3., H-1111 Budapest, Hungary
2
Department of Disaster Risk Management, Faculty of Graduate Studies, An-Najah National University, Nablus P400, Palestine
*
Author to whom correspondence should be addressed.
Future Transp. 2022, 2(3), 688-697; https://doi.org/10.3390/futuretransp2030038
Submission received: 28 May 2022 / Revised: 2 July 2022 / Accepted: 20 July 2022 / Published: 2 August 2022
(This article belongs to the Special Issue Future Mobility and Transport Applications)

Abstract

:
This research looks at how spatial factors of public transportation influence the use of bike-sharing in an urban context. Based on a grid-cell-based method, ordinary least square regression and geographically weighted regression (GWR) are developed to reveal the link between the spatial distribution of bus, tram, rail stops, and bike-sharing trips. The public transportation coverage in Budapest City is rated as excellent, with all parts of the city covered within a 5 km radius. We find that areas with a high proportion of public transportation stops have a significantly higher number of bike-sharing trips. Bike-sharing trips are concentrated near regional railway stations, the central business district, and surrounding zones. The connection between bike-sharing and trams/rails appears to be stronger than the connection between bike-sharing and buses. According to the findings, nearly one-third of public transportation stops have accessible bike docks within 125 m walking distance. In GWR analysis, the coefficients of bus stops are increasing towards the center of the city, while the coefficients of tram/rail stops are decreasing. Finally, by examining the priority zones for establishing more bike-sharing facilities, it is discovered that the eastern side of the city requires more development than the western side because it has a high number of bike-sharing trips but no adequate facilities near public transportation facilities.

1. Introduction

Cycling may reduce traffic congestion, emissions, and land use of transport in cities. Furthermore, it promotes an active lifestyle and improves health. Thus, cities are adopting cycling programs to contribute to livability, and sustainability [1,2]. Accordingly, biking is becoming more and more trendy, but municipalities have difficulties integrating cycling infrastructure and services into the transportation systems. Bike-sharing has gained increasing traction in the public discourse [3]. Bike-sharing systems (BSS) are not only eco-friendly, but they also enhance the public environment by taking up less space and providing a low-cost mode of transportation, which is vital in developing countries [4].
A BSS can be a feeder, increasing the accessibility of public transportation and helping to promote multimodal travel chains. In this regard, the modal share of public transportation can expand because travelers travel longer distances using bicycles than on foot [5]. This integration is referred to as “Bike-and-Ride” (B + R), which offers a convenient change between the two modes and supports multimodal travel chains. Multimodal travel chains combine the advantages of public transportation and cycling, especially over longer distances. Therefore, developing bike-sharing facilities near stations increases public transportation use, and reduces private car use, congestion, and environmental impact [6,7,8]. The built environment and its land use influence the final model of the BSS and how it should be integrated [9].
This study measures the influence of bike-sharing and public transportation systems based on the spatial aspects, station proximity, as well as geographic distribution factors in Budapest City. Spatial Autoregressive, Geographic Weighted Regression, Ordinary Least Squares, as well as Buffer Zone Analysis were developed. These methods are conducted to find the relationships, gaps, and connectivity in the bike-and-ride system.
The growing popularity of bike-and-ride may help to improve the accessibility of public transportation stops. The time, inconvenience, and quality associated with trips to and from these stops significantly reduce the attractiveness of public transportation in comparison to the private car [8,10].
The primary reasons for riders to choose a BSS are ease and closeness to BSS stations [11], in addition to its affordability and availability of bikes [12,13]. Similarly, it was found that people are less likely to ride a bike if distances increase [14,15]. A study conducted in the United States investigated the factors that contributed to an increase in bike-and-ride activities for the San Francisco Bay Area Rapid Transit system. It was discovered that cycling plays a significant role in accessing rail stations, they must be safe, secure, and well-designed [16].
Mugion et al. confirmed that improved public transportation service quality directly results in a higher percentage of trips for BSS services and can help to reduce private vehicle trips [17]. Kager, et al. demonstrated that using bicycles and public transportation services together can be considered an individual mode of transportation [18]. Chen et al. determined how many BSS stations there are and where they are in relation to the desired boundaries of a single metro station [19]. In order to design BSS networks on a neighborhood scale, that is, within the catchment area of a few nearby public transportation stations, Lin et al. developed a hub network approach [20].
Chow and Sayarshad used multi-objective optimization to propose a framework for simulating a symbiotic BSS network design problem in the presence of a coexisting public transportation network [21]. When choosing the exact station locations, it was taken into account the ideal distance between the building entrance/exit and the bike station. Shu et al. conducted a questionnaire survey to determine commuters’ walking distances to the stations [22]. The findings revealed that the walking distance varied depending on the land use. The optimal and manageable distances between the building’s entrance/exit and the station, according to the findings, were between 100 and 200 m.
Concerning the modeling approach, most of the previous research applied traditional regression models to examine how built environment factors influence bike ridership. A few research studies have attempted to address this autocorrelation problem over the last few years. For instance, Faghih-Imani and Elurub [23] and Shen et al. [24] applied two spatial regression models, including spatial error and spatial lag models, to consider the impacts of spatial and temporal variables on bike usage. Zhang et al. [25] used a spatial multiple regression model to examine the spatial relationship between neighboring stations. It is worthwhile to note that these studies mainly used global spatial regression models, where the coefficient of each variable is the same in all areas. It means they ignore the effects of spatial heterogeneity. GWR, as a local-based regression model, provides an effective tool to address this spatial non-stationary issue. In the transport domain, GWR is also widely used to explore the local effects of related factors on taxi ridership [26] public transportation usage rate [27,28], parking demand [29], traffic states [30], and crashes [31]. They all suggested that this model has better goodness of fitting than global regression models. However, limited studies applied this model to analyze the spatial association between the built environment and bike-sharing usage as well as per our knowledge no research has developed this method to find the land use classifications and road/rail facilities to investigate the impact on bike-sharing destinations.
The main contributions of our research are to analyze the spatial relationship between public transportation stops/stations with bike-sharing trips, by measuring the level of proximity of the facilities, as well as a location prioritization of new interventions. As per our knowledge, no research has taken into consideration the direct connectivity between bike-sharing and public transportation stops in terms of proximity based on the geographical regression. In addition, a scoring method of prioritization is developed for future stops. Methods are elaborated in section two, which is then followed by the Results and Discussion section. Finally, conclusions and future steps are proposed.

2. Methods

2.1. Grids

We used a grid-cell-based method (1 km × 1 km) to reveal the spatial distribution of the trip destinations in terms of density per zone. This grid is recommended in the literature [32,33] and provides smaller zones in the area and larger amounts. There are 531 grids in the analysis, which is higher than the number of districts (23), and sub-districts (203).

2.2. Models

To analyze the influence of public transportation on BSS use, we carry out several analyses:

2.2.1. Ordinary Least Square (OLS) Model

First, an ordinary least square model is developed to find the effects of public transportation stops on the destination of trips.
A general regression method that is normally utilized to identify and examine the relationship between the predicting and response variables is the multiple linear regression model based on ordinary least squares (OLS). The model presupposes that each observation is independent and that all observations have the same relationship between predicting and responding variables. It acknowledges the following function,
y i = β i 0 + β i 1 x i 1 + β i 2 x i 2 + + β i k x i k + ε i
where y i symbolizes the i-th observation of the response variable; β i k is the coefficient of the k-th predicting variable for the i-th observation; x i k represents the k-th predicting variable for the i-th observation; ε i is a random error term.

2.2.2. Geographically Weighted Regression (GWR) Model

Second, Geographic Weighted Regression and spatial regression techniques are used for comparison aspects as well as better spatial visualization of the coefficients. This is a weighted linear regression model with the weight determined by the distance between two observations [34].
The GWR model is a spatial extension of the traditional OLS model, with the function as below,
y i = β i 0 u i , v i + n k = 1 β i k u i , v i x i k + ε i
where y i denotes the i-th term of the response variable; β i k is the coefficient of the k-th predicting factor for the i-th term; x i k represents the k-th predicting factor for the i-th term; ε i is a random error term; ( u i , v i ) denotes the spatial coordinates of the i-th term [35].
In the GWR model, the influence of predicting variables on the response factor varies spatially. A predicting variable has a local coefficient at each bike station. Weights w i j are given to other data points based on their distances from the studied data point when estimating the model’s coefficients at a single data point. By minimizing the weighted sum of squares, the coefficients of the predicting variables in the GWR model are calculated. Below is a schematic of the objective function.
j = 1 n w i j y i β i 0 k = 1 p β i k x i k 2
After the evaluation of bike-sharing trips spatially integrated into the public transportation stops, the next step is to estimate the proximity of bike docks with respect to the public transportation stops as well. In this regard, two types of analysis are conducted:
(1)
The coverage of the public transportation stops in Budapest City by applying the buffer zone levels: 5 km, 6 km, and 7.5 km. These values are chosen as the suggestions of Refs. [34], [36], [24], respectively.
(2)
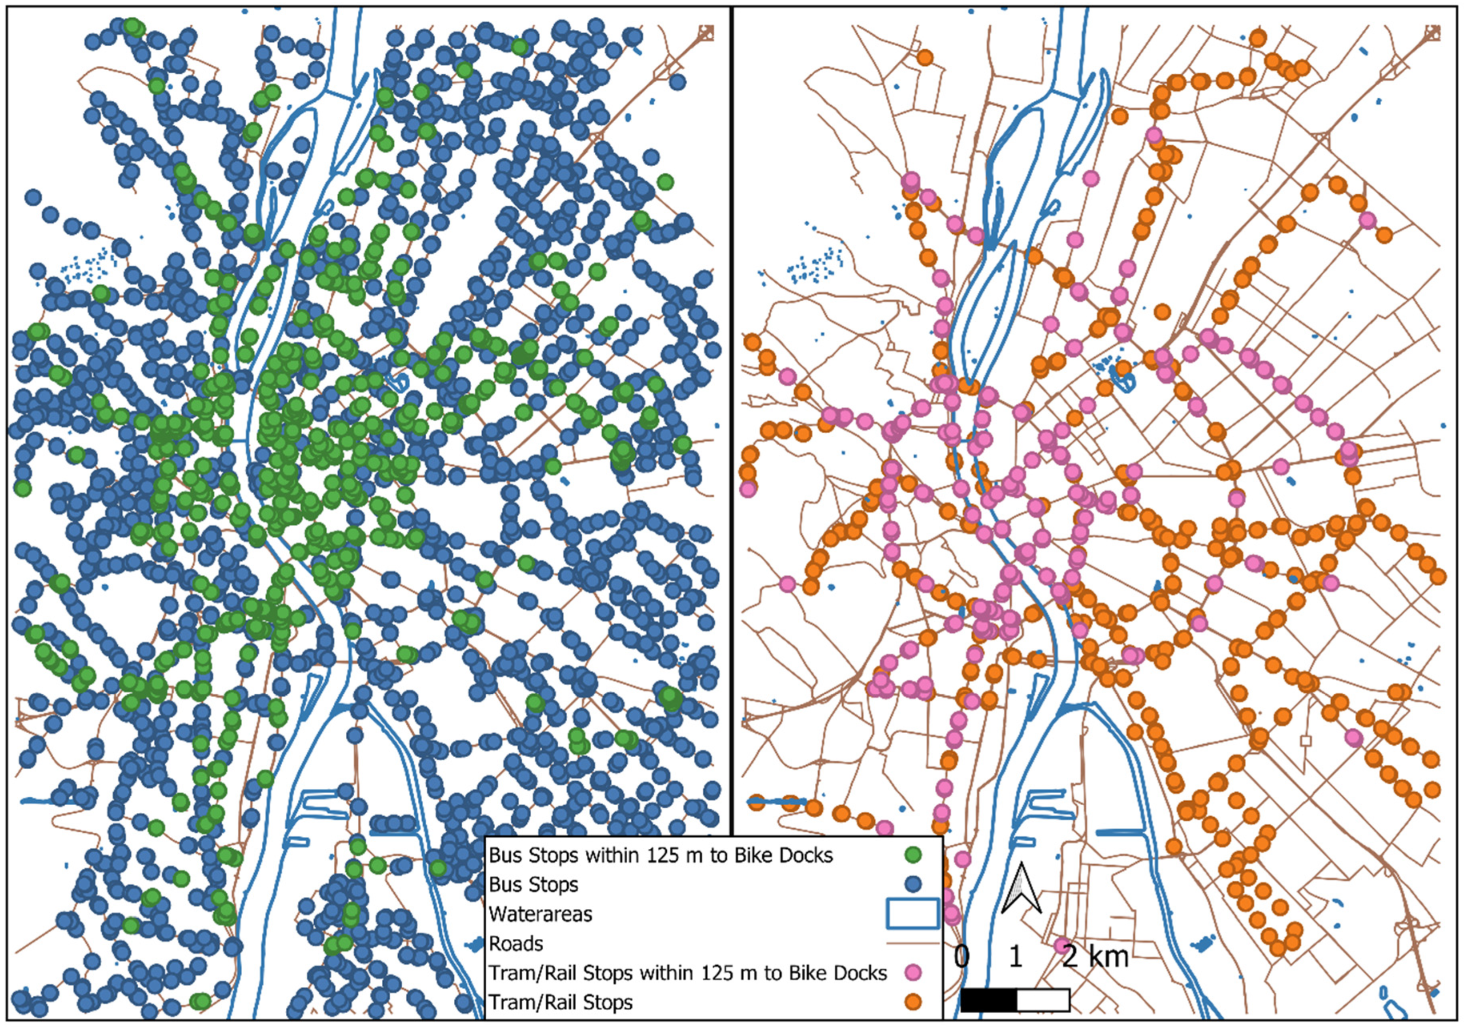
The accessibility of public transportation stops when cycling by applying the buffer zone levels: 125, 200, and 300 m from the bike docks to find how accessible the public transportation stops are with an acceptable walking distance from a bike dock to a public transport stop location. These values above are chosen as the findings of Shu et al. [22] as 70% of people find the acceptable walking distance is within 100 m, with an average value of 124 m. Böcker et al. [37] stated that bike-sharing ridership is higher if the destination bike dock is within a 200 m range of metro/rail stations, while Yang et al. [38] used a buffer radius of 300 m.

3. Results and Discussion

3.1. Research Area

Budapest was selected as the site of this study because it offers the chance to examine how well public transportation and bike-sharing systems work together. The city occupies an area of 525.2 km2 and is home to about 1.7 million people [39]. Budapest serves crucial administrative and economic roles for Hungary and is a popular tourist destination. Over 1 million students attend various colleges and universities [40]. Budapest serves as a transportation hub that handles both intra-urban and inter-urban traffic because of its central functions and location on important thoroughfares. Four metro lines, 260 bus routes, and 30 tram lines make up its public transportation system, which accommodates about five million daily trips [41]. The case of Budapest is especially intriguing since it has one of the highest public transport modal shares in Europe with 45% and only four European cities with a population of over 1 million had a higher share [42]. The share of cycling in Budapest increased from 7.5% in 2016 to 12% in 2022 [43,44]. The city promotes options for intermodal transportation. There are 31 Park-and-Ride locations throughout the city’s outskirts and nearby municipalities [45]. There are eleven bike-sharing operators in the city [46], conducting more than two thousand trips per day [47].

3.2. Data

The bike-sharing data analyzed in this study were provided by the Donkey Republic Bike-sharing Company in Budapest. This dataset contains the destination of 47,630 bike-sharing trips within two consecutive weeks (12–25 September 2021) after lifting the restrictions of COVID-19 [48], in good weather conditions. Other data attributes are gathered from different sources; locations of bike-sharing stations and capacity (the Donkey Republic Company, Budapest, Hungary), locations of public transportation stops, locations of bike docks, road networks, and districts (Open Street Maps). In total, the number of bus stops is 2967, tram and rail stops are 691, and bike-sharing stations are 184 with a capacity of 737 bikes and 1520 bike docks.

3.3. Analysis of the Models

The OLS and GWR models are constructed and the results are discussed. First, the OLS model is shown in Table 1.
Results show that the public transportation stop variables are significant in the model. The existence of trams or rail stops has more influence in attracting bike-sharing trips than bus stops. The ratio of variances between variables with and without multi-collinearity is explained by the variance inflation factor (VIF). The greater the VIF, the more severe the collinearity, and the reciprocal of tolerance. Since there is no VIF critical value table, the empirical rule according to which there is no multi-collinearity when 0 < VIF < 10 is typically applied. The predictive variables’ VIF values are less than 10, which shows that there is no obvious multi-collinearity in the models. The bike-sharing trip model’s R-squared value is 0.77, meaning that the model adequately explained about 77% of the variance in the response variables. The residuals were subjected to the Moran’s I test, which revealed significant test results for the model with p-values less than 0.01. The residuals’ positive spatial autocorrelation is indicated by the positive Moran’s I values.
The GWR model is used to fit the data in order to address the problem of spatial autocorrelation and investigate the variation in the relationship between predicting variables and response variables. It is found that R-squared = 0.79 (higher than OLS), while AIC is 689.57 (lower than OLS). This indicates that the GWR model outperforms the OLS model. In Figure 1, the spatial distribution of coefficients of bus stops and tram/rail stops are represented.
The bike-sharing trips are concentrated in the Central Business District (CBD) area and the surrounding zones. Moreover, the shape of the coefficients takes the direction of ring roads around the city center. In Budapest, the CBD area is a touristic and commercial hub that attracts thousands of people on a daily basis. It is worth mentioning that in the southeast of the city, there is a concentration of bike-sharing trips that are related to the bus stop locations. This area includes parts of District 9, as well as Districts 19 and 20. These districts contain several companies, hospitals, green areas, and office locations.
On the other hand, the coefficients of tram/rail stops indicate that bike-sharing trips are concentrated in the main rail stations that connect the City of Budapest with other surrounding regions, cities, or towns. On the eastern side of the Danube river, the bike-sharing trips are concentrated in the zones where the rail stations of Nyugati Palyaudvar, Keleti Palyaudvar, and Ferencvaros Palyaudvar locations. On the western side, the bike-sharing trips are highly concentrated near all rail stations in the area.
The coefficient values for the bus stops range between −13.8 (Green Zones) and 113.5 (Red Zones). The higher values indicate more concentrated bike-sharing trips at these zones based on the number of existing stops. For the rail/tram stops, the coefficient values range between −107.0 (Green Zones) and 81.0 (Red Zones). Again, higher values indicate more bike-sharing trips at these zones based on the rail/tram stops. We observe that the red zones for both bus and rail/tram stops are distributed in the inner central zones of the city, in addition to the southern-eastern zones. However, there is a difference in the distribution of the coefficients in the outer zones between the bus and rail/tram stops. This is explained mainly by the existence of the rail stations as they attract more riders than the buses, which is in line with the OLS analysis. The negative values do not mean that the number of bike-sharing trips is negative, as there is overlapping between three layers; the coefficients of the bus stops, the coefficients of rail/tram stops, and the intercept values.

3.4. Coverage and Proximity Analysis

It is interesting to mention that the public transportation stops of buses, trams, and rails cover 100% of Budapest City in the buffer zones of 7.5, 6, and 5 km. More specifically, each mode on its own covers the whole city with its service, which leads to the fact that 100% of the bike docks are located within the coverage area of the public transportation systems. This helps in encouraging users to integrate between bikes and public transportation systems as the distance between the origins and bus or trams/rail stops is within 5 km.
For the proximity of bike docks to the public transportation stops/stations, we conducted buffer zones to cover 125, 200, and 300 m for bus stops and tram/rail stops. The following Table 2 shows the results:
At the chosen levels of buffer areas, it is found that tram/rail stops or stations have better accessibility than bus stops. This explains the initial results of the OLS model as the bike-sharing trips are located more in the zones that have tram stops (higher coefficient). With the most acceptable walking distance (125 m), the results show that one out of four bus stops, and one out of three tram stops have accessible bike docks. For the 300 m proximity, half of the stops have accessibility to bike docks. The Figure below represents the three levels and the empty areas that need an allocation of bike docks.
As shown in Figure 2, the central zones are somehow good in the accessibility of public transportation of buses, rails, and trams. It is clearly observable that the neighborhoods need a lot of work in adding bike docks to get more integration between the two systems. More specifically, on the level of 125 m, which is the most acceptable walking distance, the bus stops are accessible by 23.2% of the bike docks in the city as shown by the green dots, while the blue dots mean that these bus stops are not accessible by 125 m of walking distance from the bike-sharing docks. Similarly, the pink dots indicate excellent accessibility to rail/tram stops within 125 m of walking distance from the bike-sharing docks. As mentioned in [16], a better biking infrastructure, more specifically better stations or docks, will lead to more integration and usage of the system of Bike-and-Ride.

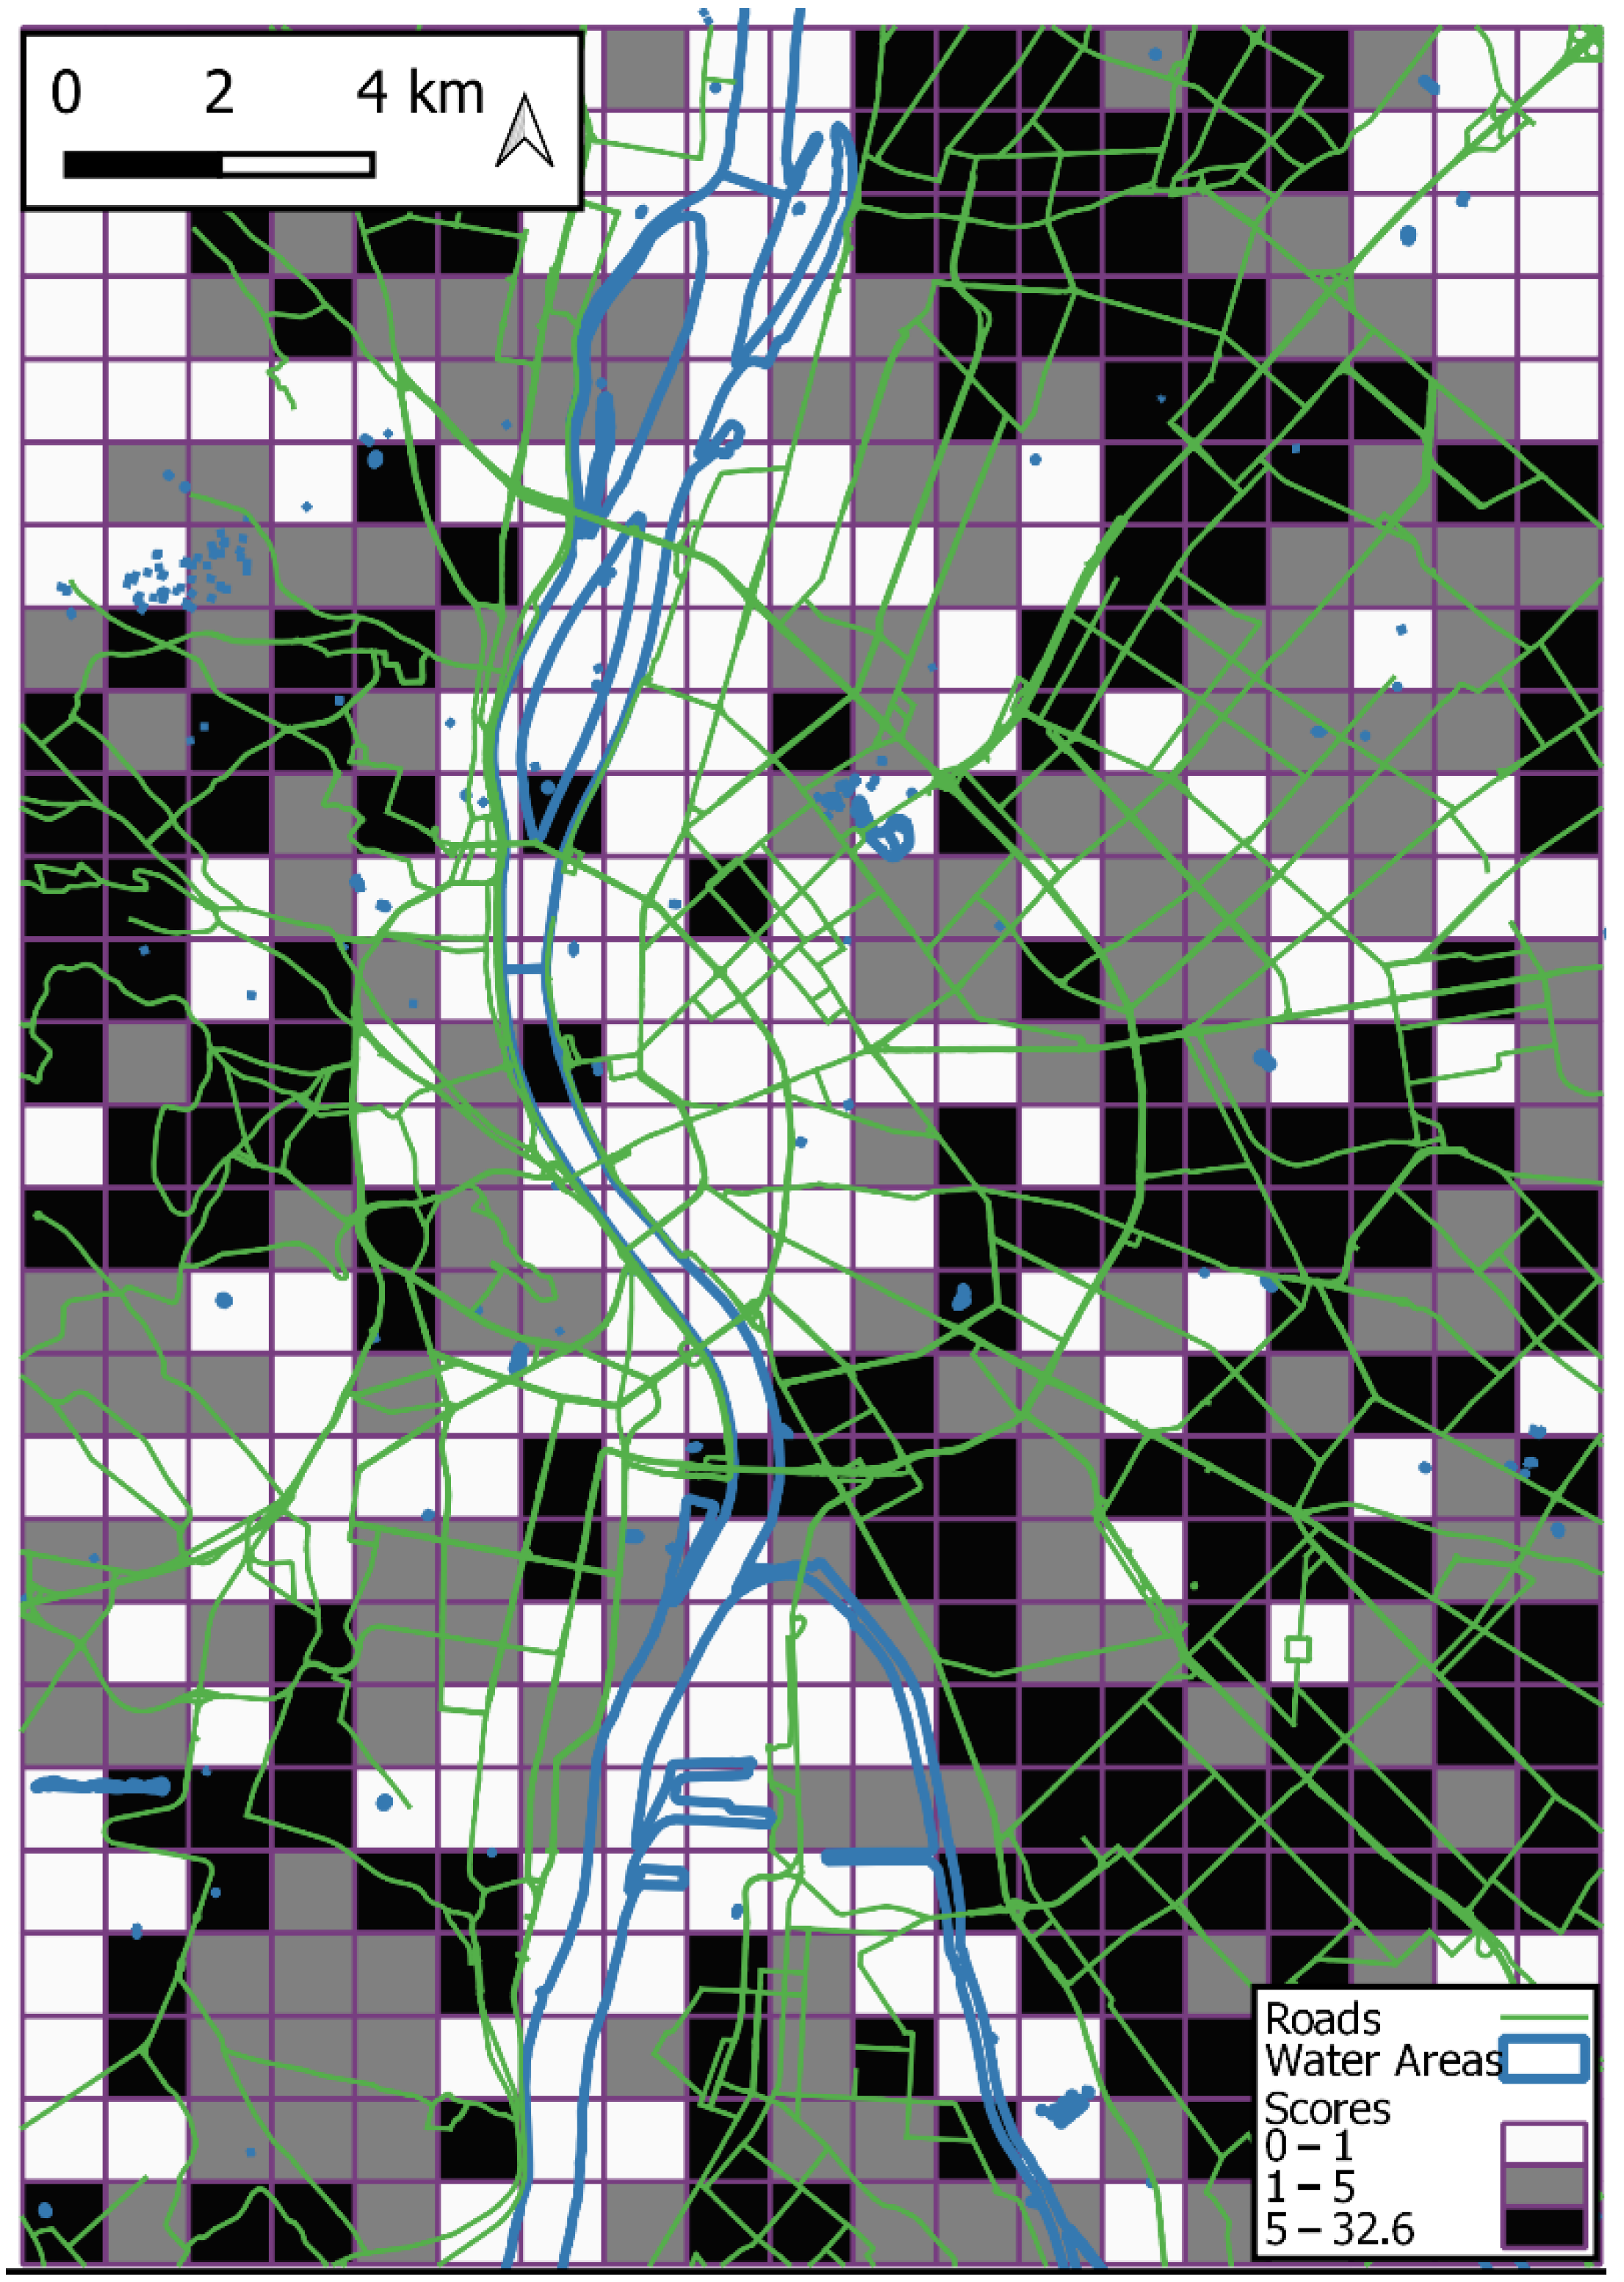
3.5. Priority Analysis for Future Interventions

To know where to establish more bike docks, we evaluated the zones based on our own developed criteria to prioritize the zones that need bike docks.
The priority process is as follows:
(1)
Calculate the number of bus stops and tram/rail stops in each zone that are not within 125 m proximity of bike docks.
(2)
From the equation of ordinary least squares, we multiply each bus stop by 1, and tram/rail stop by 2.32 (the division of coefficients of tram/rail stops over bus stops).
(3)
Summarize the score of stops in each zone.
The scoring results vary from 0 to 32.6. In this regard, we applied three quantiles (intervals) of classifications to make three levels of prioritizing, as shown in Figure 3. It was discovered that the zones near the Danube River have the lowest scores or the lowest prioritizing, as shown in the white zones. These squares indicate good connectivity between the two systems of bike-sharing and public transport. The zones in grey are distributed all over the city, which indicates a fair need for better infrastructure to have higher integration (connectivity). Finally, the black zones demonstrate an urgent need for development. The eastern side of the city (Pest Side) needs more development than the western side (Buda Side). We can summarize that there is a necessity to make more physical interventions in the neighborhoods or around water areas than in the city center.

4. Conclusions

This study offers insights into the ways in which spatial factors of public transportation affect the use of bike-sharing in an urban context. A strong connection between buses, tram/rail stop location density, and BSS use was found. Using the ordinary least squares model, we found that in areas with a high proportion of PT stops, a significantly higher number of trips can be observed. In terms of accuracy, the GWR model outperforms the OLS model. The bike-sharing trips are concentrated in the CBD area and the surrounding zones, where bus stops are located. Moreover, the bus stops coefficients’ shape takes the direction of ring roads around the city center, while the coefficients of tram/rail stops indicate that bike-sharing trips are concentrated in the main rail stations that connect the City of Budapest with other surrounding regions, cities, or towns. In terms of coverage, Budapest City’s public transportation network is excellent in reaching all over the city in a 5 km service area. Proximity to bus and rail stops promotes the use of bike-sharing. The connection of bike-sharing to light rail seems to be stronger than to buses. With the most acceptable walking distance (125 m), the results show that one out of four bus stops, and one out of three tram stops have accessible bike docks. The zones near the center and vital touristic hubs need lower physical interventions than the neighborhoods. The limitations of this research are that the dataset is narrowed by a few factors in the analysis, while there are several variables still needing to be investigated, such as the quality of the public transport and bike-sharing systems, land use classifications, and points of interest. Further research may focus on the potential of location–allocation of the Bike-and-Ride system in regards to infrastructure and mobility based on bike users’ behavior.

Author Contributions

Conceptualization, A.J.; methodology, A.J. and L.A.B.; software, A.J. and L.A.B.; validation, A.J., L.A.B. and B.C.; formal analysis, A.J. and L.A.B.; investigation, A.J. and L.A.B.; resources, A.J., L.A.B. and B.C.; data curation, A.J. and L.A.B.; writing—original draft preparation, A.J.; writing—review and editing, A.J., L.A.B. and B.C.; visualization, A.J. and L.A.B.; supervision, B.C. All authors have read and agreed to the published version of the manuscript.

Funding

This research received no external funding.

Institutional Review Board Statement

Not applicable.

Informed Consent Statement

Not applicable.

Data Availability Statement

The data presented in this study are available on request from the corresponding author. The data are not publicly available due to the privacy issues of the provider.

Acknowledgments

The authors gratefully acknowledge the data provided by The Donkey Republic Biking Company.

Conflicts of Interest

The authors declare no conflict of interest.

References

  1. Nielsena, T.A.S.; Skov-Petersen, H.; Carstensen, T.A. Urban planning practices for bikeable cities—The case of Copenhagen. Urban Res. Pract. 2013, 6, 110–115. [Google Scholar] [CrossRef]
  2. Jaber, A.; Juhász, J.; Csonka, B. An Analysis of Factors Affecting the Severity of Cycling Crashes Using Binary Regression Model. Sustainability 2021, 13, 6945. [Google Scholar] [CrossRef]
  3. Gao, J.; Sha, A.; Huang, Y.; Hu, L.; Tong, Z.; Jiang, W. Evaluating the cycling comfort on urban roads based on cyclists’ perception of vibration. J. Clean. Prod. 2018, 192, 531–541. [Google Scholar] [CrossRef]
  4. Si, H.; Shi, J.; Wu, G.; Chen, J.; Zhao, X. Mapping the bike sharing research published from 2010 to 2018: A scientometric review. J. Clean. Prod. 2019, 213, 415–427. [Google Scholar] [CrossRef]
  5. Jäppinen, S.; Toivonen, T.; Salonen, M. Modelling the potential effect of shared bicycles on public transport travel times in Greater Helsinki: An open data approach. Appl. Geogr. 2013, 43, 13–24. [Google Scholar] [CrossRef]
  6. Pritchard, J.P.; Tomasiello, D.B.; Giannotti, M.; Geurs, K. Potential impacts of bike-and-ride on job accessibility and spatial equity in São Paulo, Brazil. Transp. Res. Part A Policy Pract. 2019, 121, 386–400. [Google Scholar] [CrossRef]
  7. Handy, S.L.; van Wee, B.; Kroesen, M. Promoting Cycling for Transport: Research Needs and Challenges. Transp. Rev. 2014, 34, 4–24. [Google Scholar] [CrossRef]
  8. Martens, K. Promoting bike-and-ride: The Dutch experience. Transp. Res. Part A Policy Pract. 2007, 41, 326–338. [Google Scholar] [CrossRef]
  9. El-Assi, W.; Mahmoud, M.S.; Habib, K.N. Effects of built environment and weather on bike sharing demand: A station level analysis of commercial bike sharing in Toronto. Transportation 2017, 44, 589–613. [Google Scholar] [CrossRef]
  10. Barabino, B. Automatic recognition of “low-quality” vehicles and bus stops in bus services. Public Transp. 2018, 10, 257–289. [Google Scholar] [CrossRef]
  11. Bachand-Marleau, J.; Lee, B.H.Y.; El-Geneidy, A.M. Better Understanding of Factors Influencing Likelihood of Using Shared Bicycle Systems and Frequency of Use. Transp. Res. Rec. J. Transp. Res. Board 2012, 2314, 66–71. [Google Scholar] [CrossRef]
  12. Chen, Y.; Wang, D.; Chen, K.; Zha, Y.; Bi, G. Optimal pricing and availability strategy of a bike-sharing firm with time-sensitive customers. J. Clean. Prod. 2019, 228, 208–221. [Google Scholar] [CrossRef]
  13. Jaber, A.; Csonka, B. Temporal Travel Demand Analysis of Irregular Bike-Sharing Users. In HCI in Mobility, Transport, and Automotive Systems; Lecture Notes in Computer Science; Springer: Cham, Switzerland, 2022; Volume 13335, pp. 517–525. [Google Scholar]
  14. Goetzke, F.; Rave, T. Bicycle use in Germany: Explaining differences between municipalities with social network effects. Urban Stud. 2010, 48, 427–437. [Google Scholar] [CrossRef]
  15. Yao, Y.; Jiang, X.; Li, Z. Spatiotemporal characteristics of green travel: A classification study on a public bicycle system. J. Clean. Prod. 2019, 238, 117892. [Google Scholar] [CrossRef]
  16. Cervero, R.; Caldwell, B.; Cuellar, J. Bike-and-Ride: Build It and They Will Come. J. Public Transp. 2013, 16, 83–105. [Google Scholar] [CrossRef]
  17. Mugion, R.G.; Toni, M.; Raharjo, H.; Pietro, L.D.; Sebathu, S.P. Does the service quality of urban public transport enhance sustainable mobility? J. Clean. Prod. 2018, 174, 1566–1587. [Google Scholar] [CrossRef]
  18. Kager, R.; Bertolini, L.; Brömmelstroet, M.T. Characterisation of and reflections on the synergy of bicycles and public transport. Transp. Res. Part A Policy Pract. 2016, 85, 208–219. [Google Scholar] [CrossRef]
  19. Chen, J.; Chen, X.; Jiang, H.; Zhu, S.; Li, X.; Li, Z. Determining the Optimal Layout Design for Public Bicycle System within the Attractive Scope of a Metro Station. Math. Probl. Eng. 2015, 2015, 456013. [Google Scholar] [CrossRef]
  20. Lin, J.-R.; Yang, T.-H.; Chang, Y.-C. A hub location inventory model for bicycle sharing system design: Formulation and solution. Comput. Ind. Eng. 2013, 65, 77–86. [Google Scholar] [CrossRef]
  21. Chow, J.Y.; Sayarshad, H.R. Symbiotic network design strategies in the presence of coexisting transportation networks. Transp. Res. Part B Methodol. 2014, 62, 13–34. [Google Scholar] [CrossRef]
  22. Shu, S.; Bian, Y.; Rong, J.; Xu, D. Determining the exact location of a public bicycle station—The optimal distance between the building entrance/exit and the station. PLoS ONE 2019, 14, e0212478. [Google Scholar] [CrossRef]
  23. Faghih-Imani, A.; Elurub, N. Incorporating the impact of spatio-temporal interactions on bicycle sharing system demand: A case study of New York CitiBike system. J. Transp. Geogr. 2016, 54, 218–227. [Google Scholar] [CrossRef]
  24. Shen, Y.; Zhang, X.; Zhao, J. Understanding the usage of dockless bike sharing in Singapore. Int. J. Sustain. Transp. 2018, 12, 686–700. [Google Scholar] [CrossRef]
  25. Zhang, Y.; Thomas, T.; Brussel, M.; van Maarseveen, M. Exploring the impact of built environment factors on the use of public bikes at bike stations: Case study in Zhongshan, China. J. Transp. Geogr. 2017, 58, 59–70. [Google Scholar] [CrossRef]
  26. Li, B.; Cai, Z.; Jiang, L.; Su, S.; Huang, X. Exploring urban taxi ridership and local associated factors using GPS data and geographically weighted regression. Cities 2019, 87, 68–86. [Google Scholar] [CrossRef]
  27. Cardozo, O.D.; García-Palomares, J.C.; Gutiérrez, J. Application of geographically weighted regression to the direct forecasting of transit ridership at station-level. Appl. Geogr. 2012, 34, 548–558. [Google Scholar] [CrossRef]
  28. Chiou, Y.-C.; Jou, R.-C.; Yang, C.-H. Factors affecting public transportation usage rate: Geographically weighted regression. Transp. Res. Part A Policy Pract. 2015, 78, 161–177. [Google Scholar] [CrossRef]
  29. Pu, Z.; Li, Z.; Ash, J.; Zhu, W.; Wang, Y. Evaluation of spatial heterogeneity in the sensitivity of on-street parking occupancy to price change. Transp. Res. Part C Emerg. Technol. 2017, 77, 67–79. [Google Scholar] [CrossRef]
  30. Pan, Y.; Chen, S.; Niu, S.; Ma, Y.; Tang, K. Investigating the impacts of built environment on traffic states incorporating spatial heterogeneity. J. Transp. Geogr. 2020, 83, 102663. [Google Scholar] [CrossRef]
  31. Huang, Y.; Wang, X.; Patton, D. Examining spatial relationships between crashes and the built environment: A geographically weighted regression approach. J. Transp. Geogr. 2018, 69, 221–233. [Google Scholar] [CrossRef]
  32. Koller, B.; Hegglin, D.; Schnyder, M. A grid-cell based fecal sampling scheme reveals: Land-use and altitude affect prevalence rates of Angiostrongylus vasorum and other parasites of red foxes (Vulpes vulpes). Parasitol. Res. 2019, 118, 2235–2245. [Google Scholar] [CrossRef] [PubMed]
  33. Hou, H.; Estoque, R.C.; Murayama, Y. Spatiotemporal analysis of urban growth in three African capital cities: A grid-cell-based analysis using remote sensing data. J. Afr. Earth Sci. 2016, 123, 381–391. [Google Scholar] [CrossRef]
  34. Wang, X.; Cheng, Z.; Trépanier, M.; Sun, L. Modeling bike-sharing demand using a regression model with spatially varying coefficients. J. Transp. Geogr. 2021, 93, 103059. [Google Scholar] [CrossRef]
  35. Brunsdon, C.; Fotheringham, A.S.; Charlton, M.E. Geographically Weighted Regression: A Method for Exploring Spatial Nonstationarity. Geogr. Anal. 1996, 28, 281–298. [Google Scholar] [CrossRef]
  36. Radzimski, A.; Dzięcielski, M. Exploring the relationship between bike-sharing and public transport in Poznań, Poland. Transp. Res. Part A Policy Pract. 2021, 145, 189–202. [Google Scholar] [CrossRef]
  37. Böcker, L.; Anderson, E.; Uteng, T.P.; Throndsen, T. Bike sharing use in conjunction to public transport: Exploring spatiotemporal, age and gender dimensions in Oslo, Norway. Transp. Res. Part A Policy Pract. 2020, 138, 389–401. [Google Scholar] [CrossRef]
  38. Yang, H.; Zhang, Y.; Zhong, L.; Zhang, X.; Ling, Z. Exploring spatial variation of bike sharing trip production and attraction: A study based on Chicago’s Divvy system. Appl. Geogr. 2020, 115, 102130. [Google Scholar] [CrossRef]
  39. Mahdi, A.; Hamadneh, J.; Esztergár-Kiss, D. Modeling of Travel Behavior in Budapest: Leisure Travelers. In Proceedings of the 24th EURO Working Group on Transportation Meeting, EWGT 2021, Aveiro, Portugal, 8–10 September 2021. [Google Scholar]
  40. KSH. Data of Population by Main Characteristics of Education by Region from Microcensus 2016. 2019. Available online: https://statinfo.ksh.hu/Statinfo/haViewer.jsp (accessed on 31 March 2022).
  41. Obaid, M.; Torok, A. Macroscopic Traffic Simulation of Autonomous Vehicle Effects. Vehicles 2021, 3, 187–196. [Google Scholar] [CrossRef]
  42. Bucsky, P. Modal share changes due to COVID-19: The case of Budapest. Transp. Res. Interdiscip. Perspect. 2020, 8, 100141. [Google Scholar] [CrossRef]
  43. Fraboni, F.; Prati, G.; Casu, G.; Angelis, M.D.; Pietrantoni, L. A cluster analysis of cyclists in Europe: Common patterns, behaviours, and attitudes. Transportation 2021, 49, 591–620. [Google Scholar] [CrossRef]
  44. Haustein, S.; Nielsen, T.A.S. European mobility cultures: A survey-based cluster analysis across 28 European countries. J. Transp. Geogr. 2016, 54, 173–180. [Google Scholar] [CrossRef]
  45. Ortega, J.; Hamadneh, J.; Esztergár-Kiss, D.; Tóth, J. Simulation of the Daily Activity Plans of Travelers Using the Park-and-Ride System and Autonomous Vehicles: Work and Shopping Trip Purposes. Appl. Sci. 2020, 10, 2912. [Google Scholar] [CrossRef]
  46. Mátrai, T.; Tóth, J. Cluster Analysis of Public Bike Sharing Systems for Categorization. Sustainability 2020, 12, 5501. [Google Scholar] [CrossRef]
  47. Soltani, A.; Mátrai, T.; Camporeale, R.; Allan, A. Exploring Shared-Bike Travel Patterns Using Big Data: Evidence in Chicago and Budapest. In Computational Urban Planning and Management for Smart Cities, Proceedings of the 16th International Conference on Computers in Urban Planning and Urban Management (CUPUM 2019), Wuhan, China, 8–12 July 2019; Springer: Cham, Switzerland, 2019; pp. 1–14. [Google Scholar]
  48. Jaber, A.; Csonka, B.; Juhasz, J. Long Term Time Series Prediction of Bike Sharing Trips: A Case Study of Budapest City. In Proceedings of the 2022 Smart City Symposium Prague (SCSP), Prague, Czech Republic, 26–27 May 2022. [Google Scholar]
Figure 1. Coefficients of Bus, Tram/Rail stops.
Futuretransp 02 00038 g001
Figure 2. The Proximity of 125 m buffer between PT stops and Bike docks.
Futuretransp 02 00038 g002
Figure 3. Priority Levels of New Bike Docks.
Futuretransp 02 00038 g003
Table 1. Parameter results of OLS model.
Predicting VariableCoefficientp-Value
Intercept−24.22580.3259
Bus Stops13.12930.00043
Tram and Rail Stops30.52130.00016
R-squared = 0.77, AIC = 701.15
Table 2. Proximity of PT to Bike docks.
Accessibility DistanceBus StopsTram Stops
125 m23.2%35.7%
200 m33.0%46.9%
300 m42.6%53.4%
Publisher’s Note: MDPI stays neutral with regard to jurisdictional claims in published maps and institutional affiliations.

