Article

Transit Quality of Service Assessment Using Smart Data

1
Laboratory of Transportation and Ambient Mobility Systems, Department of Civil Engineering, University of Patras, Panepistimioupoli Patron, 265 04 Patras, Greece
2
Cosys-Grettia, University Gustave Eiffel, IFSTTAR, F-77447 Marne-la-Vallee, France
*
Author to whom correspondence should be addressed.
Future Transp. 2022, 2(2), 414-424; https://doi.org/10.3390/futuretransp2020023
Submission received: 11 March 2022 / Revised: 12 April 2022 / Accepted: 16 April 2022 / Published: 2 May 2022

Abstract

:
In this paper we assess the transit quality of service (QoS) from a user’s standpoint, using smart data. A number of bus lines with different characteristics, operating in the Metropolitan Area of Athens, were chosen as a case study. The data used were gathered by an Automatic Passenger Counting (APC) system. APC technologies provide exact temporalized passenger counting along the line for each service, thus assisting to better understand causalities of delays and avoid operational problems. By employing archived APC data from buses running on crosstown routes between 15 January 2019 and 15 April 2019 we conducted a statistical analysis to explore occupancies and assess QoS, including under a social distancing scenario. The passenger distribution along the stops, the bus’s occupancy level, the stops that are maximum occupancy points and their rate of occurrence and, lastly, the passenger’s average trip length during the day and the week are examined.

1. Introduction

Public Transportation Systems play a determinant role in mobility and provide people with access across different community services. Public Transit is a viable solution to mobility issues, such as traffic and parking congestion, energy consumption, air, and noise pollution. Bus networks are of vital importance in medium-sized cities, where rail transportation is not available, but also, in larger metropolitan areas, where they function as feeders or serve low-demand connections. A shift from cars to buses would preserve mobility at a lower cost in both economic and environmental terms. Several external and internal factors have a great impact on Public Bus Ridership, with the quality of service being the main internal one.
Currently, the COVID-19 spread has greatly affected the Public Transportation Services. Not only the government’s guidelines, successive lockdowns, and changes in working habits, but also the population’s concern about public health and hygiene, have led to a significant reduction of Public Transport use. New requirements, such as social distancing, must be considered in Public Transport strategic, operational, and tactical planning, with the key factor being the service capacity [1]. Several researches have been conducted regarding the impact of the pandemic on the Public Transport System, and the main findings refer to the restrictions on Public Transport use, the Smart Card avoidance, and the need to improve Public Transport capacity and hygiene for the future [2,3].
Jenelius and Cebecauer [4] examined ticket validations from public transport authorities from Stockholm, Västra Götaland, and Skåne in Sweden in the period March–May 2020. They found that public transport ridership has been hit hard by COVID-19 compared with other modes. The decrease in ridership, which was largest in Stockholm (ca 60%) and smallest in Västra Götaland (ca. 40%), is attributed to the reduced number of active public transport travelers. It was also found that travelers switched from 30-day period tickets to single tickets and travel funds, while sales of short period tickets dropped to almost zero.
Through a map-based analysis, Tiikkaja and Viri [5] studied changes in public bus transport in Tampere, Finland in January and May 2020. Results indicate that there was a great decrease in public transport ridership in most parts of Tampere. Public transport frequencies were decreased but maintained at a sufficient level, while fill rates were smaller in other parts of Tampere, except eastern bus routes. Rasca et al. [6]) analyzed ridership data in Agder and Oslo, Norway and Innsbruck, and Vienna, Austria combined with public data on the pandemic development (number of cases per day, measures taken to limit contagion) in the period from January 2019 to February 2021.
Their research findings indicate that ridership decrease was directly proportional to regional infection rates, the second wave of the pandemic had a lower impact on public transport ridership, and that the post-lockdown ridership recovery in smaller urban areas was more rapid. Aparicio et al. [7] combined subway, metro, bus, and tramways passenger trip data in Lisbon, Portugal in a pre-pandemic month and a post-pandemic month. They revealed that public transportation demand was considerably lower in those stations located in areas outside of Lisbon municipality and in zones with lower incomes.
Existing literature about the impact of COVID on public transportation indicates that there has been a massive reduction in its use. Ridership has been found to be associated with the Quality of Service [8]. The Quality of Service (QoS) is defined as the overall measured or perceived performance of transit service from the passenger’s point of view [9]. The concept of the Quality of Service is widely applied in field pf smart cities [10], telecommunications [11,12], and UAVs [13]. To restore the public’s eroded trust in the public transportation systems, mitigation measures such as social distancing were taken. In this paper we examine the impact of social distancing on the transit Quality of Service based on bus data, deriving from an Automated Passenger Counting (APC) system, which is installed on the busses of Athens.
The remaining paper is organized as follows: In Section 2 the literature review is presented, in Section 3 the study field, dataset, and methodology are presented, in Section 4 the methodology is presented, and in Section 4 the analysis results are presented. Conclusions are provided in Section 5.

2. Literature Review

APC data are becoming more available since APC devices have been increasingly installed in vehicles and data accessibility is easier. The use of APC data can greatly impact both passengers and agencies and improve the quality of Public Transport services [14]. Hammerle et al. [15] proved how useful APC data can be in evaluating Public Transport services. There are plenty of technologies that are used to collect data depending on the need and purpose of their usage, such as passive thermal, digital cameras with three-dimensional vision, etc. [16]. APC systems prevail from manual traffic data collectors, as they capture passengers both at the entry and exit level [17].
APC data are used in inferring the transit route level [18] but also in developing an interactive data analytics platform in order to assess service quality and determine service problems [19]. To better understand bus bunching in different spatial and temporal levels, Feng and Figliozzi [20], with the use of APC data, were able to aid agencies in developing efficient strategies in order to improve their level of service. Last but not least, APC data were used in creating a systematic evaluation framework to quantify the impacts of combined Public Transport services [21].
The use of APC data in dynamic models for the estimation of up-to-minute bus service information has been proved to be a significant tool. Patnaik et al. [22] created a regression model that estimates bus travel times and arrival information for passengers. Another dynamic model was developed to not only better inform passengers, but also to examine the variability on bus travel times for more accurate scheduling provision [23]. Chen and Chen [24] simulated passenger demand and bus operation for fixed routes, using APC data, to predict and prevent irregularities on the bus routes. APC dynamic data were deployed to develop a bus travel time model in order to cope with poor scheduling and misleading information of bus arrival and departure times to passengers [25]. Similarly, Nuzzolo et al. [26] showed how to use APC data in a mesoscopic model to upgrade Origin–Destination (OD) matrices. Ji et al. [27] used APC data to derive OD flow matrices to estimate transit route passenger OD flow matrices.
More recent studies employ the use of APC data to examine different aspects of public transport usage. Jenelius [28] used real-time and historic APC data to extract personalized predictive public transport crowding information in the public transport network in Stockholm. Berrebi et al. [29] examined the consistency of APC data to analyze ridership trends. With the use of data from four transit agencies, they found that the APC data are consistent and complete. Martinez et al. [30] combined APC data and GTFS feed from the transit agencies from two metropolitan areas in the USA to develop ridership models and identify social distancing violations. Egu and Bonel [31] used APC data to estimate the fare irregularity rate in Lyon. Kumar et al. [32] examined the quantification of the increased possibility of disease spread from passenger interaction when traveling between different origin–destination pairs and the evaluation of an aggregate measure quantifying the relative risk of boarding at a particular stop of the transit route with the use of APC data in Minnesota.
Table 1 summarizes the contribution of selected recent studies. While APC data have been used to deal with issues raised by the pandemic, it is necessary to conduct a study which would employ APC data and explore the impact of social distancing on the Quality of Service.

3. Materials and Methods

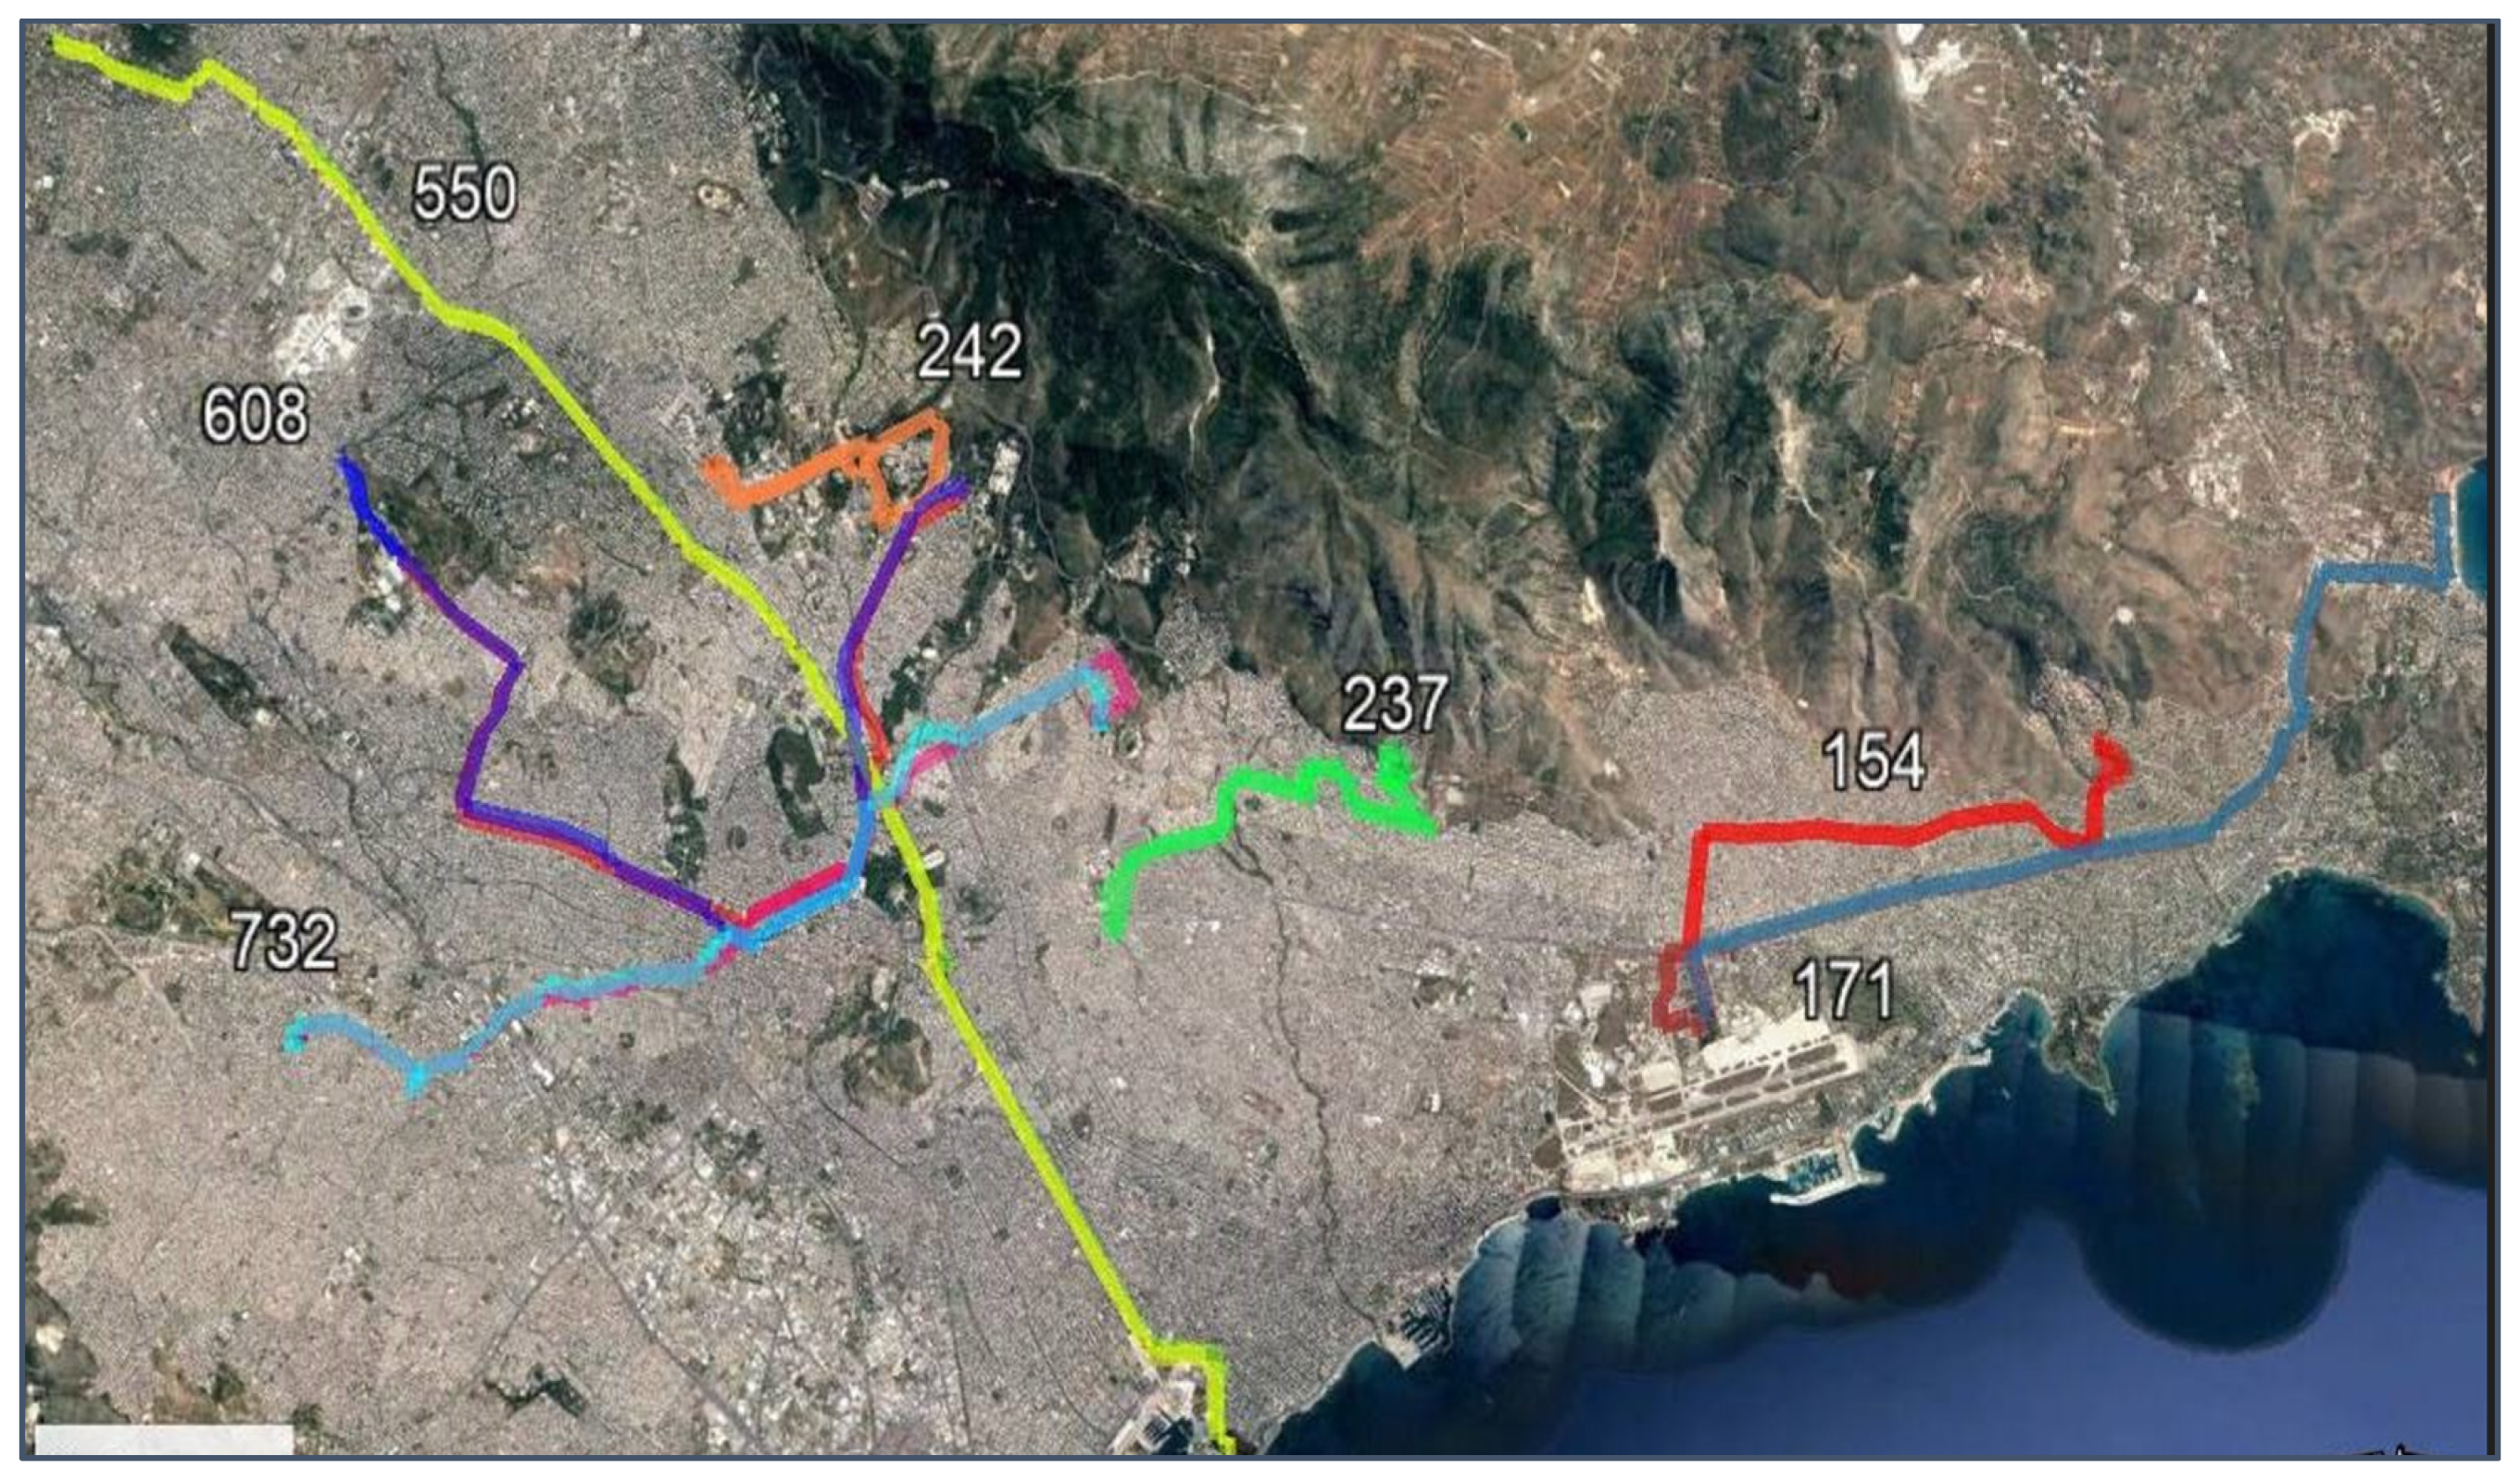
3.1. Field and Dataset

The Municipality of Athens covers an area of approximately 39 km2 and has a population of 660,000 people, while the Greater Urban Area of Athens covers an area of approximately 412 km2 and has a population of more than 3,000,000 people. The public transportation of Athens is governed by OASA S.A. and its subsidiaries OSY S.A., which is in charge of the approximately 300 bus lines and STASY S.A., which is responsible for the subway and tram transport.
The dataset received by the Athens Urban Transport Organization (OASA S.A.) includes spatiotemporal GPS data and archived data obtained by an APC system for the seven following bus lines: 154 (St. Elliniko—A. Glyfada—Pan/ma Voulas), 237 (Ano Ilioupoli—St. Dafnis), 242 (St. Katechaki—Polytechneioupoli), 732 (Ag. Fanourios—Akadimia—Z. Pigi), 171 (St. Elliniko—Varkiza), 550 (P. Faliro—Kifisia), and 608 (Galatsi—Akadimia—Nekr. Zografou). The route type, length, number of bus stops—from origin to destination and from destination to origin—and the period the data were collected are summarized in Table 1. For circular lines there is no differentiation between the number of stops, as the origin is also the destination. The bus lines are visualized in Figure 1.

3.2. Notation

The following notation is used in this paper.
α i m a x = Percentage that each stop appeared to be a Point of Maximum Occupancy
c = bus capacity
k = time period
M   = number of itineraries
n a i   = number of alighting passengers after each bus stop i
n b i   = number of boarding passengers after each bus stop i
n o b i   = number of passengers remaining on board after each bus stop i
ρ = bus occupancy rate during the service
z i m a x   = number of times each stop appeared to be a Point of Maximum Occupancy

4. Methodology

After a data cleaning procedure, boarding and alighting data per bus stop and bus service are extracted. Boarding/alighting data include the date, the departure and arrival time of the bus, and the boarding/alighting passenger volumes at each bus stop. We conducted three types of statistical analyses: (i) per bus stop, (ii) per time of the day, and (iii) per day.
Over the years, researchers have suggested various ways to assess the Quality of Service of a transit system. Polzin et al. [33] used service coverage, service span, frequency, and travel demand as performance measures. Hensher et al. [34] introduced the Service Quality Index, which takes into account 13 attributes (Bus travel time, bus fare, ticket type, frequency, time of arrival at the bus stop, time walking to the bus stop, seat availability on the bus, information at the bus stop, access to the bus, bus stop facilities, temperature on the bus, the driver’s attitude, and general cleanliness on board). With the use of APC/AVL data, Pi et al. [19] analyzed the system’s performance with the use of passenger waiting time, stop-skipping frequency, bus bunching level, bus travel time, on-time performance, and bus fullness. The Transit Capacity and Quality of Service Manual (TCQSM) introduces many indicators for the assessment of the Quality of Service [35]. The Payload Quality of Service is measured in a scale from A to F, with A indicating the best Quality of Service and F the worst. Quality of Service A corresponds to up to 50% of seated load, B corresponds to up to 80% of seated load, C corresponds to up to 100%, D corresponds to up to 125%, E corresponds to up to 150%, and F corresponds to higher than 150%.
In this study, we employ APC data from different bus lines that are part of Athens’ public transportation system in order to assess the provided Quality of Service. Our perspective is not only to cover the route of the bus line as a whole, but to focus on the bus stops as well as some that might offer lower a Quality of Service than others of the same line. To capture these complexities, we introduce the following indicators: occupancy rate, points of maximum occupancy, and passenger volumes per stop. Crowded busses and high volumes lower the Quality of Service. The occupancy rate offers insights as to whether the bus is crowded, the points of maximum occupancy demonstrate whether there are more passengers than seats in the bus, etc. In Section 5, we exemplarily present the results for the 171 bus line (from destination to origin) for Mondays to Fridays from 15 January 2019 to 28 February 2019. In the destination to origin direction, there are 34 bus stops, however one was not operational during the period studied, reducing the number to 33.
Based on the boarding and alighting data, we extract the average number of passengers boarding ( n _ b ), and alighting ( n _ α ) at each bus stop (i), the average number of passengers remaining on board after passing from the bus stop ( n _ o b i ) as well as the bus occupancy rate (ρ) during the service.
The number of passengers remaining on board after each bus stop is calculated in Equation (1).
n _ o b i = n _ o b i 1 + n _ b i n _ a i
The average occupancy rate ( ρ _ ) of the bus is calculated in Equation (2).
ρ _ = n _ o b i c
The bus occupancy rate refers to the seated and upright passengers in the bus. In this study we examine two thresholds for the bus occupancy rate. The first one is at 40% and is considered to be a threshold for level of service change, as at this point, all bus seats are occupied, and the passengers have to travel standing upright. Based on the TCSQM, the first threshold corresponds to level C. The second one is at 20%, which demonstrates that half of the seats are occupied for social distancing. Based on the TCSQM, the first threshold corresponds to level A. Even though the dataset comes from a period before the pandemic of COVID-19, it is important to see how such a measure would influence the Quality of Service.
The percentage that each stop appeared to be a Point of Maximum Occupancy ( α i m a x ) is calculated in Equation (3).
α i m a x = z i m a x M
Following the analysis per stop, we calculate the average distance covered by passengers per time period. The average distance covered by passengers per time period is presented in Table 2. The dataset is divided into a number of periods of time to better assess the passenger behavior. The time periods are selected in such a way so as to include hours with similar traffic conditions. Those represent different travel purposes, such as trips from home to work, and also different traffic contexts (peak and off-peak hours).
For the 154, 171, 237, and 242 bus lines, we select four groups:
  • k = 1 7:00 a.m.–10:00 a.m.
  • k = 2 10:00 a.m.–2:00 p.m.
  • k = 3 2:00 p.m.–6:00 p.m.
  • k = 4 6:00 p.m.–12:00 p.m.
For the 550, 608, and 732 bus lines, we select five groups:
  • k = 1 5:00 a.m.–7:00 a.m.
  • k = 2 7:00 a.m.–10:00 a.m.
  • k = 3 10:00 a.m.–2:00 p.m.
  • k = 4 2:00 p.m.–6:00 p.m.
  • k = 5 6:00 p.m.–12:00 p.m.
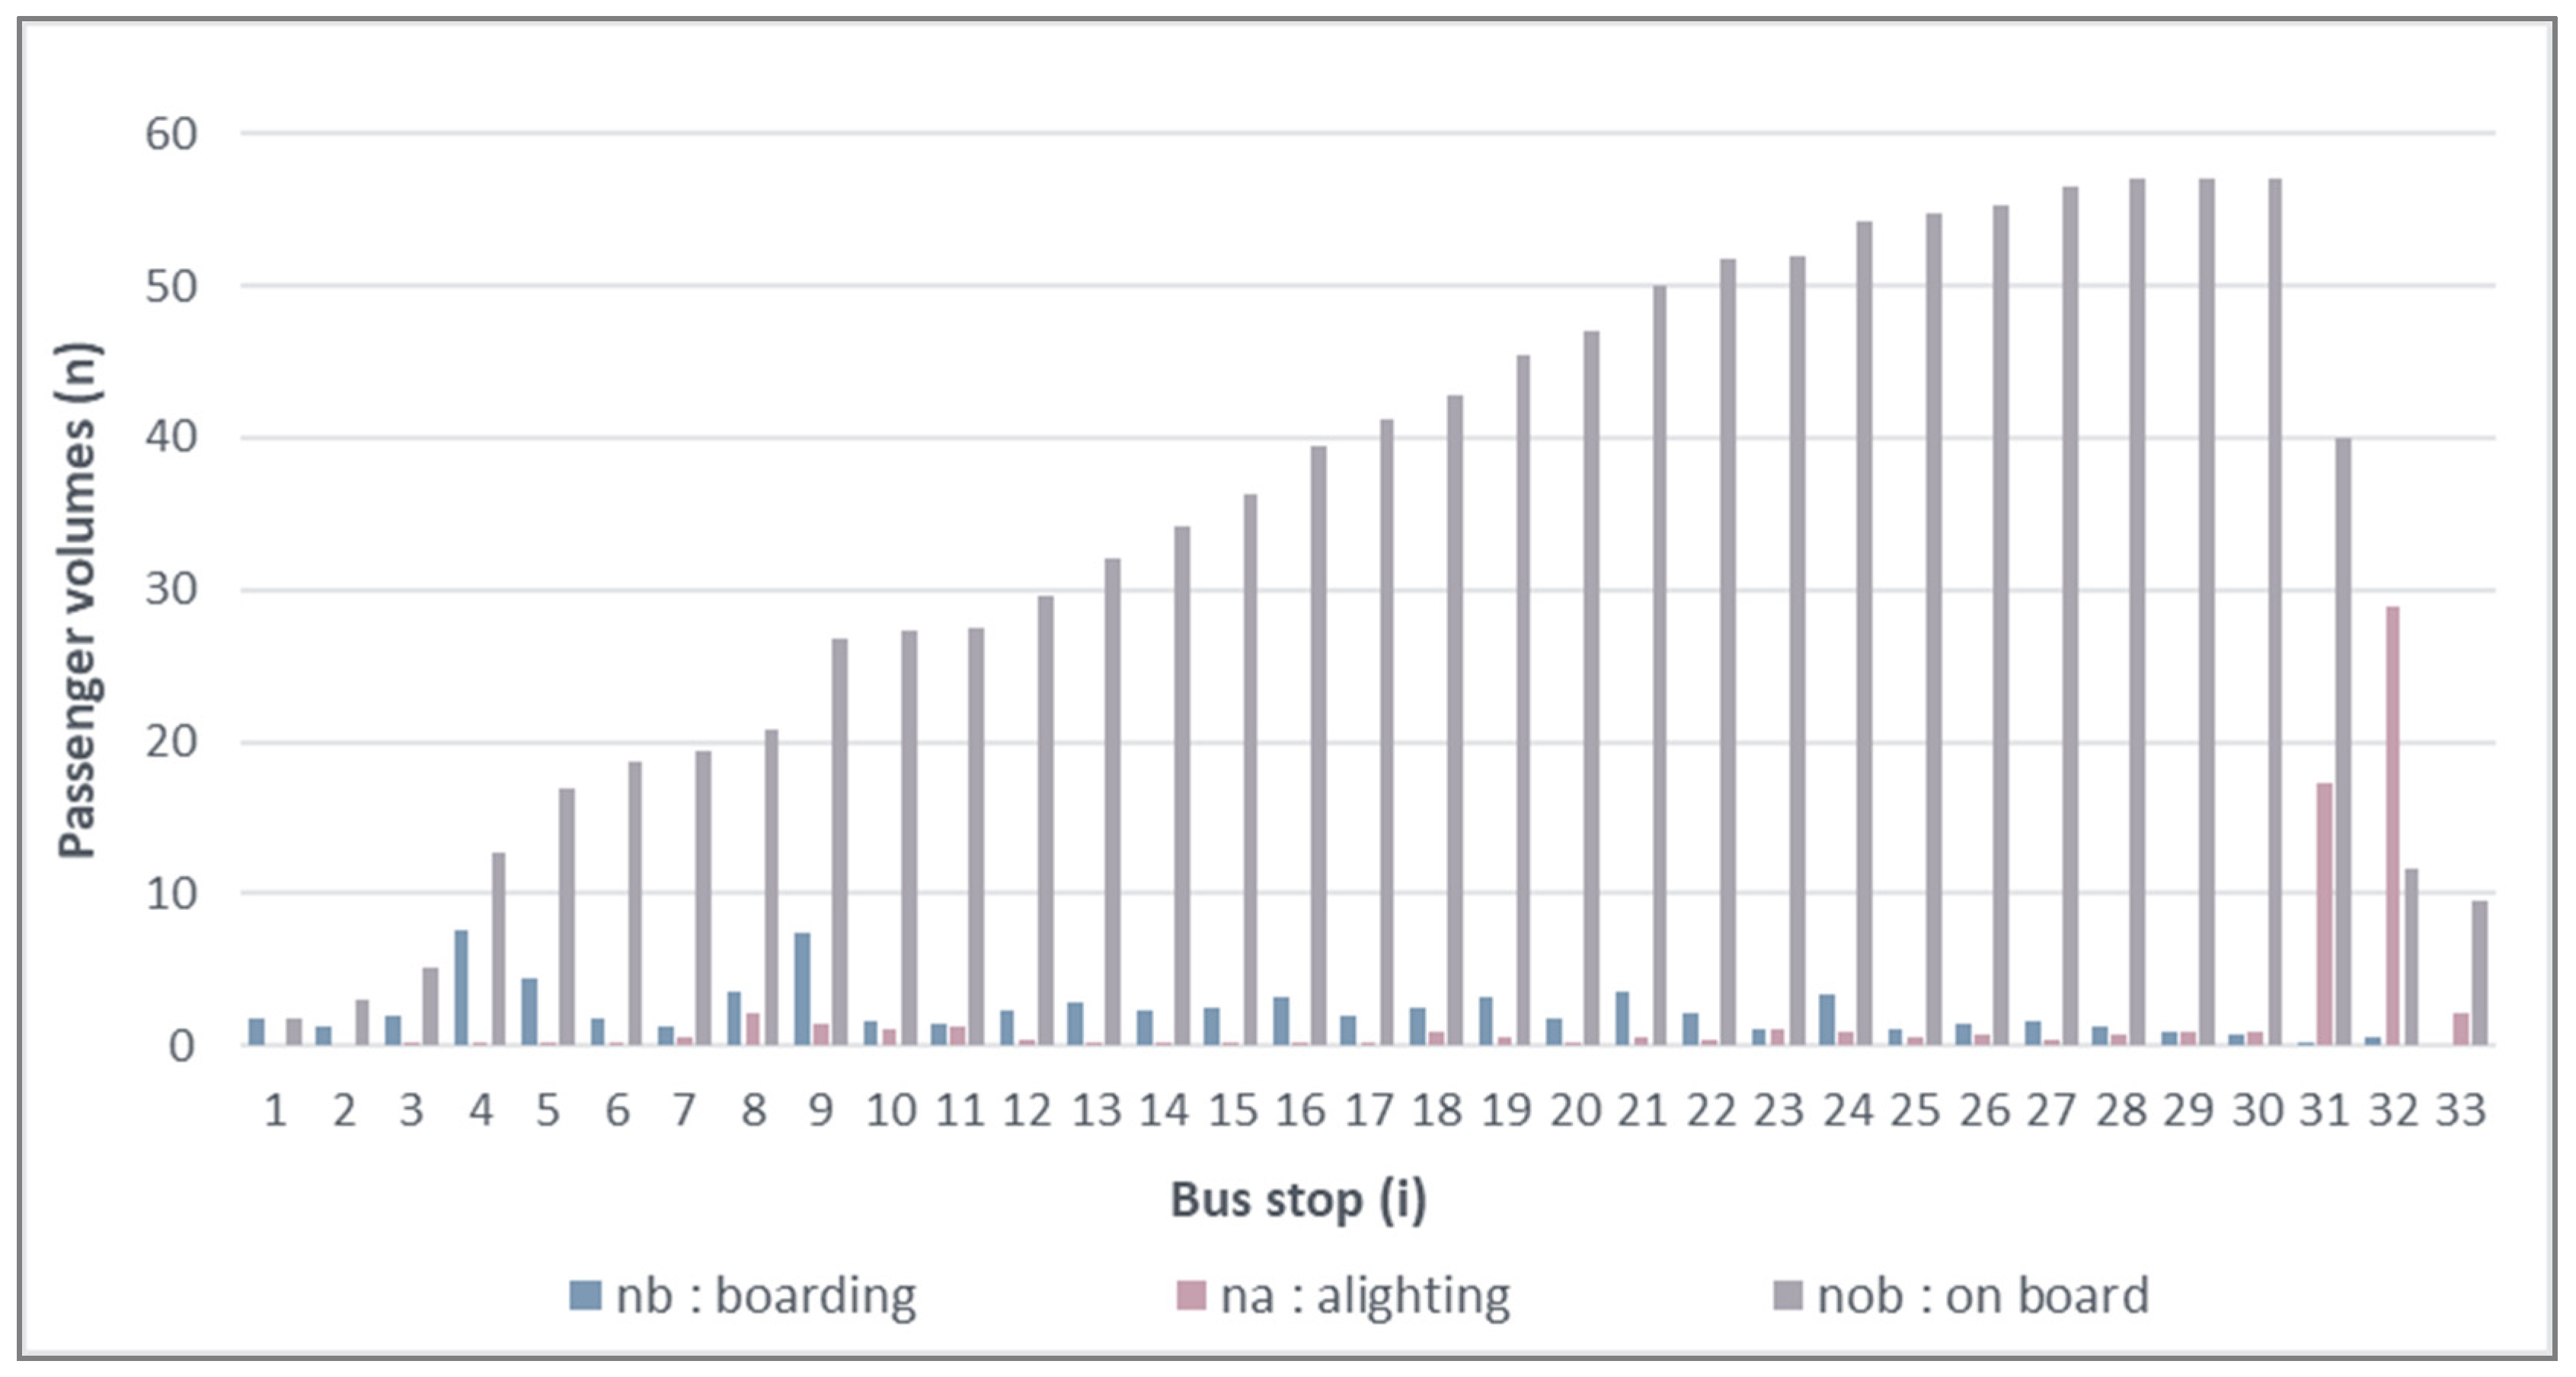
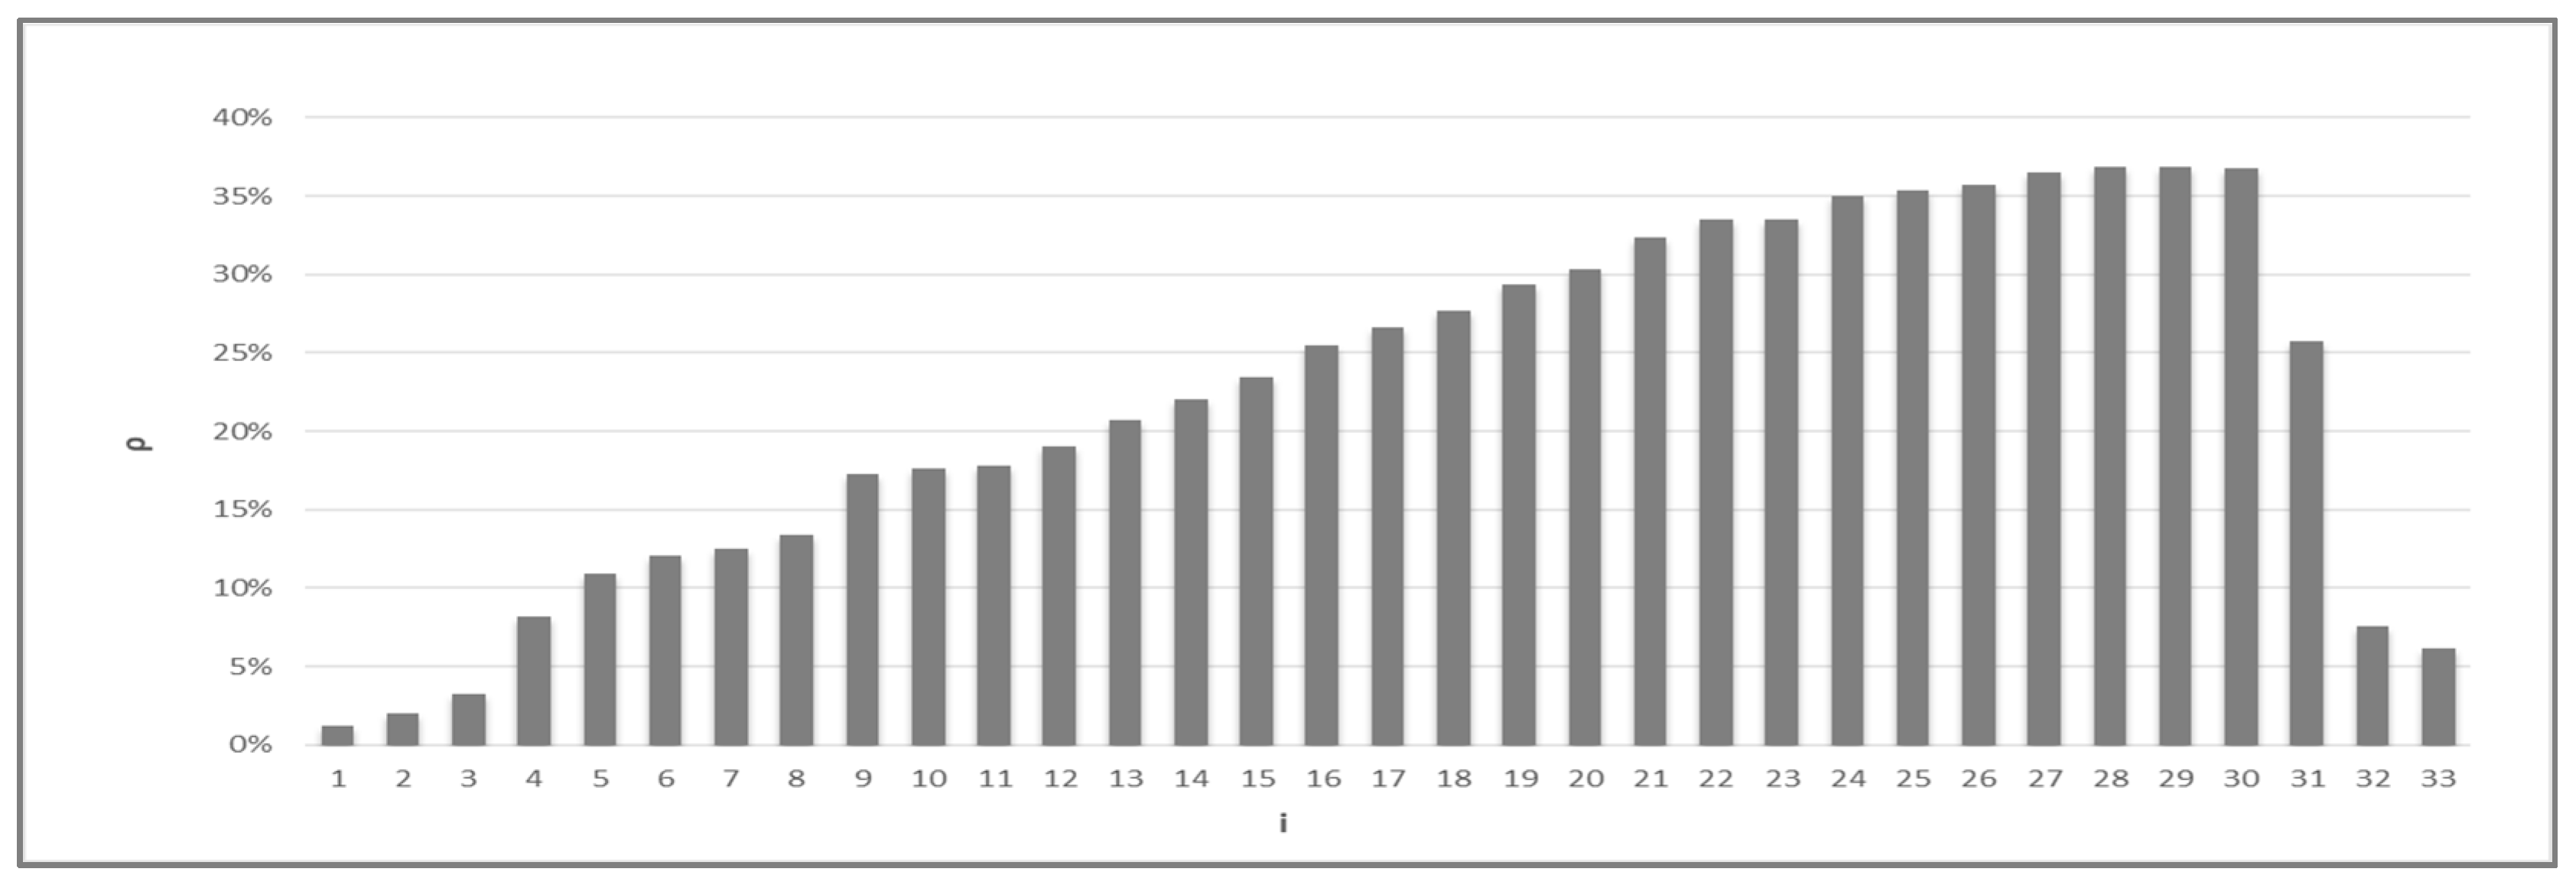
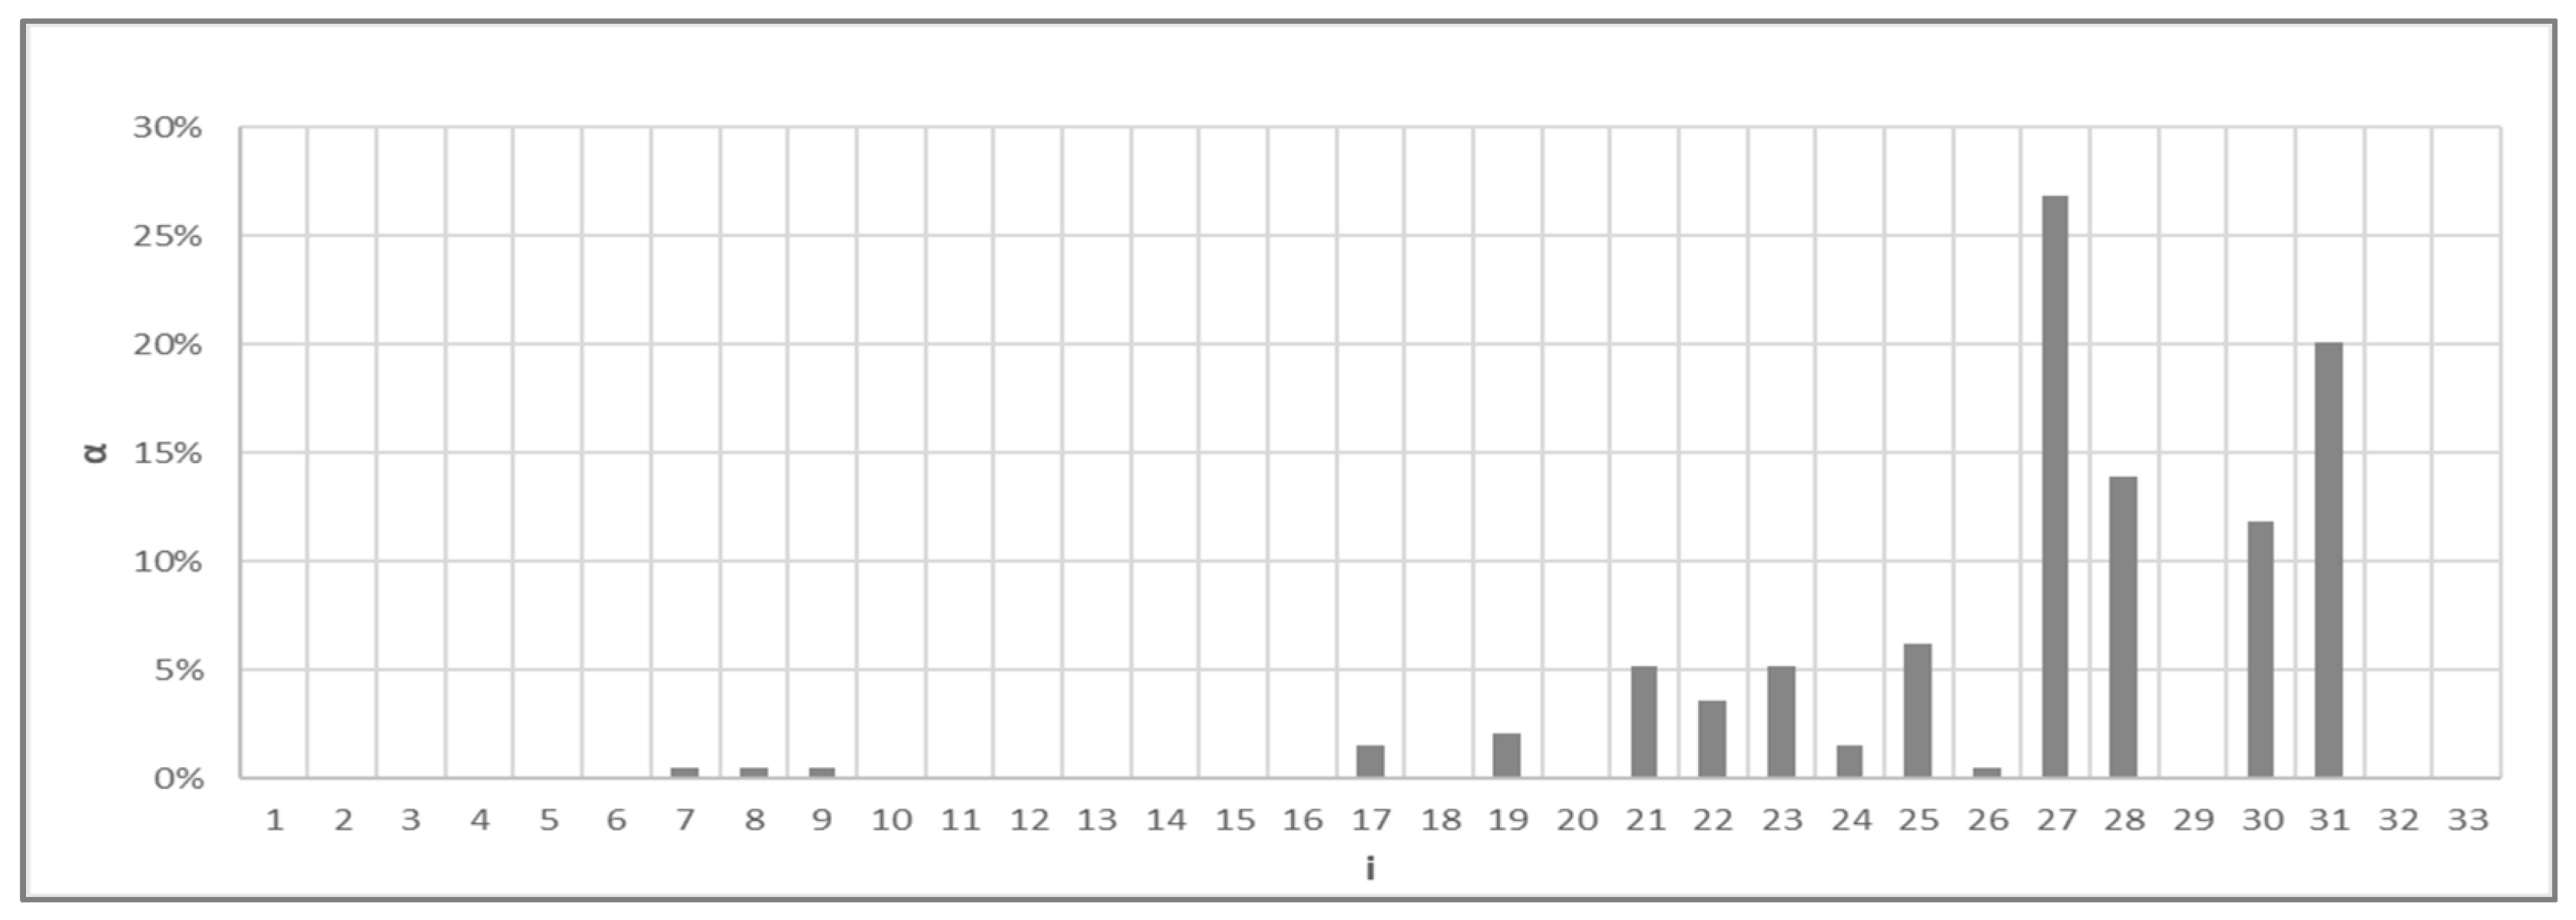
In the latter case, a group has been added, as the lines start operating two hours earlier than the previous ones. For each of these groups, we present the average travel distance covered by the passengers. Additionally, the average passenger distance is calculated per day of the week and is presented in Table 3. Increased passenger distances lead to lower perceived Quality of Service, in particular for the non-seated passengers.

5. Results

The 171 bus line displays a significant increase in the occupancy percentage, which is observed as we get closer to the last stops in comparison with the first ones. This may be attributed to the fact that the line connects Varkiza (a seaside suburb of Athens) to Elliniko Metro Station. As Figure 2 shows, most boarding passengers enter the bus at the beginning of the route, while most of them alight at the end of the route.
As a result, the vehicle occupancy, which is presented at Figure 3, increases steadily until the last stops, as it approaches Elliniko station.
Figure 4 presents the percentage that each stop had the maximum occupancy among all other stops, which means that in that specific route it was the Point of Maximum Occupancy. It seems that the last stops are most likely to be the Points of Maximum Occupancy. As demonstrated by Figure 2 and Figure 3, most of the passengers are directing to the last stops, approaching the Metro Station, leading to a comparatively higher occupancy rate at the last bus stops. This translates in a significant drop of the Quality of Service at the last bus stops, with more people being crowded inside the bus.
Figure 5 elaborates on the information presented in Figure 4 by demonstrating the occupancy percentage of the vehicle only at the stops where the maximum occupancy was observed. By examining these specific stops, we find that the number of passengers in the vehicle is kept at a fairly low level, well below the level of service change threshold. This means that there are more seats in the vehicle than onboard passengers. Nonetheless, the introduction of social distancing measures would have a negative impact on the Quality of Service, as most of these bus stops would find themselves with an occupancy level that is above the relevant threshold. This suggests that, in the case of such measures, the operator should monitor the demand for bus trips and, if it remains high, then more buses should be employed in order to maintain a high Quality of Service.
Stops That Were Not a Point of Maximum Occupancy on Any of the Examined Routes Have Been Omitted
The statistical analysis per day focuses on the average travel distance covered by passengers per day of the week. In Table 3, the passenger travel distance (km) per bus line and time period is presented. By examining the average value and standard deviation of the distance travelled, we notice that the distances are longer and with higher uncertainty in the time periods which are associated with trips from/to the work and school. This shows a fall in the Quality of Service during these time periods. This is not unexpected, as the traffic is heavier in these hours, with more vehicles circulating. In Table 4, we extend this analysis by presenting the average travel distance per passenger per day for all of the bus lines. The comparative table of travel distance per day shows that the passengers travel the longest on Mondays, while the rest of the days follow with small differences. This may be attributed to the heavier traffic conditions in the beginning of the week. The perceived Quality of Service worsens during the days and hours that longer average passenger distances are observed, particularly for those who travel in an upright position.
In the following Tables: O stands for Origin, D for Destination, M for Mean, and Sd for standard deviation.

6. Discussion

This study focused on the assessment of the Quality of Service offered by various bus lines operating in the wider Athens Area. Based on selected indicators, a drop in the Quality of service was observed at the last stops of the bus route, as the passenger volumes and, consequently, the occupancy rates increase. Moreover, it was observed that during rush hours (i.e., hours associated with travelling from/to work and schools), the Quality of Service drops. The introduction of social distancing measures would lower the Quality of Service even more, as the occupancy would remain at a level above the desired threshold.
If the number of buses were to increase that would mean that the occupancy level would fall, thus making the social distancing scenario successful. Based on these findings, it is suggested that the number of buses available in every line should increase in situations in which the Quality of Service falls.
Regarding the study limitations, we should note at this point that the data used did not include a social distancing event having taken place during the time the data were gathered. Thus, we did not take into consideration how the bus operator actually handled the situation and if the measures taken were successful at keeping a high Quality of Service. The study also has shortcomings, most notably associated with the availability of the archived APC data and missing data.

7. Managerial Insights

Dealing with the uncertainty caused by the COVID-19 pandemic has been a challenge for the transit agencies. The restrictive measures taken, such as the lockdowns, reduced ridership and subsequent revenues sharply. The recovery period brought new measures such as social distancing, which needs to be implemented so that high hygiene standards are maintained. This new reality highlights the need for the managing authorities of the transit agencies to adjust existing concepts such as the Quality of Service.
In this paper we suggest a reconceptualization of the Quality of Service given the constraints brought about by the need for social distancing. It is found that the level of service enjoyed by passengers falls once the social distancing measures are in place. For this reason, transit agencies should reconsider (i) the scheduling of their services, (ii) the capacity of the vehicles used, and (iii) examining the introduction of a complementary transport offer in rush hours to cover the demand without compromising the Quality of Service.

8. Conclusions

The present article undertook a statistical analysis of key bus traffic characteristics such as the passenger flows per bus stop, the bus occupancy, and the average distance covered per passenger. Moreover, the Quality of Service was assessed under the existence and non-existence of social distancing measures. The existence of social distancing measures was found to be of negative influence on the Quality of Service, with occupancy levels well above the acceptable threshold. The study findings are necessary to highlight the need for a different approach to passenger service given the pandemic mitigation measures. This different approach should entail a more efficient utilization of resources through scheduling and procurement so that public transport would maintain its attractiveness.
Future research includes a more detailed analysis, which will employ archived data from an Automatic Vehicle Location tracking system. This would help us determine the headway and, as a result, identify the rate at which the buses must depart from the first stop for the Quality of Service to be kept high. We should not forget to mention that looking into the peak hours would give us a better understanding of the situation the passengers are dealing with daily and, if needed, we could consider an increase of the bus frequency at those time-zones only. In the near future we could be looking at a platform utilizing real time integrated data from both AVL and APC tracking systems, which would provide information and act as a guide to the public transport managers.
Finally, AVL data can also be used in order to study the delays during the day of the bus lines. Moreover, traffic load data per hour and per day, knowledge of the road network, the unique characteristics of the various areas, and the demand should all be taken into consideration in order to identify and solve congestion problems through the redesign of the public transit network.

Author Contributions

Conceptualization, Z.C.; methodology, Z.C., I.B. and C.G.; software, I.B.; validation, Z.C. and I.B.; formal analysis, I.B.; investigation, I.B.; resources, Z.C.; data curation, I.B.; writing—original draft preparation, I.B.; writing—review and editing, I.B., Z.C., C.G. and M.G.; visualization, I.B.; supervision, Z.C.; project administration, Z.C. All authors have read and agreed to the published version of the manuscript.

Funding

This research received no external funding.

Institutional Review Board Statement

Not applicable.

Informed Consent Statement

Not applicable.

Data Availability Statement

The Athens Urban Transport Organization (OASA S.A.) retains the right of the data distribution.

Acknowledgments

The authors acknowledge the Athens Urban Transport Organization (OASA S.A.) for the provision of data.

Conflicts of Interest

The authors declare no conflict of interest.

References

  1. Gkiotsalitis, K.; Cats, O. Public transport planning adaption under the COVID-19 pandemic crisis: Literature review of research needs and directions. Transp. Rev. 2021, 41, 374–392. [Google Scholar] [CrossRef]
  2. Przybylowski, A.; Stelmak, S.; Suchanek, M. Mobility behaviour in view of the impact of the COVID-19 pandemic—Public transport users in Gdansk case study. Sustainability 2021, 13, 364. [Google Scholar] [CrossRef]
  3. Orro, A.; Novales, M.; Monteagudo, Á.; Pérez-López, J.B.; Bugarín, M.R. Impact on city bus transit services of the COVID-19 lockdown and return to the new Normal: The case of A Coruña (Spain). Sustainability 2020, 12, 7206. [Google Scholar] [CrossRef]
  4. Jenelius, E.; Cebecauer, M. Impacts of COVID-19 on public transport ridership in Sweden: Analysis of ticket validations, sales and passenger counts. Transp. Res. Interdiscip. Perspect. 2020, 8, 100242. [Google Scholar] [PubMed]
  5. Tiikkaja, H.; Viri, R. The effects of COVID-19 epidemic on public transport ridership and frequencies. A case study from Tampere, Finland. Transp. Res. Interdiscip. Perspect. 2021, 10, 100348. [Google Scholar] [CrossRef]
  6. Rasca, S.; Markvica, K.; Ivanschitz, B.P. Impacts of COVID-19 and pandemic control measures on public transport ridership in European urban areas–The cases of Vienna, Innsbruck, Oslo, and Agder. Transp. Res. Interdiscip. Perspect. 2021, 10, 100376. [Google Scholar] [CrossRef]
  7. Aparicio, J.T.; Arsenio, E.; Henriques, R. Understanding the impacts of the COVID-19 pandemic on public transportation travel patterns in the City of Lisbon. Sustainability 2021, 13, 8342. [Google Scholar] [CrossRef]
  8. Taylor, B.D.; Fink, C.N. The Factors Influencing Transit Ridership: A Review and Analysis of the Ridership Literature. Available online: https://escholarship.org/uc/item/3xk9j8m2 (accessed on 8 March 2022).
  9. TRB. Transit Capacity and Quality of Service Manual, 2nd ed.; Transportation Research Board: Washington, DC, USA, 2003. [Google Scholar]
  10. Alsamhi, S.H.; Ma, O.; Ansari, M.S.; Gupta, S.K. Collaboration of drone and internet of public safety things in smart cities: An overview of qos and network performance optimization. Drones 2019, 3, 13. [Google Scholar] [CrossRef] [Green Version]
  11. Alsamhi, S.H.; Rajput, N.S. An efficient channel reservation technique for improved QoS for mobile communication deployment using high altitude platform. Wirel. Pers. Commun. 2016, 91, 1095–1108. [Google Scholar] [CrossRef]
  12. Alsamhi, S.H.; Rajput, N.S. Implementation of call admission control technique in HAP for enhanced QoS in wireless network deployment. Telecommun. Syst. 2016, 63, 141–151. [Google Scholar] [CrossRef]
  13. Alsamhi, S.H.; Rajput, N.S. Performance and analysis of propagation models for efficient handoff in high altitude platform system to sustain QoS. In Proceedings of the 2014 IEEE Students’ Conference on Electrical, Electronics and Computer Science, Bhopal, India, 1–2 March 2014; pp. 1–6. [Google Scholar]
  14. Van Oort, N.; Cats, O. Improving public transport decision making, planning and operations by using big data: Cases from Sweden and the Netherlands. In Proceedings of the IEEE 18th International Conference on Intelligent Transportation Systems, Gran Canaria, Spain, 15–18 September 2015; pp. 19–24. [Google Scholar]
  15. Hammerle, M.; Haynes, M.; McNeil, S. Use of automatic vehicle location and passenger count data to evaluate bus operations: Experience of the Chicago Transit Authority, Illinois. Transp. Res. Rec. 2005, 1903, 27–34. [Google Scholar] [CrossRef]
  16. U.S. Department of Transportation. ITS Transit Fact Sheet. Available online: https://www.pcb.its.dot.gov/ (accessed on 5 March 2022).
  17. Wilson, N.H.; Zhao, J.; Rahbee, A. The Potential Impact of Automated Data Collection Systems on Urban Public Transport Planning; Springer: Cham, Switzerland, 2009; pp. 1–25. [Google Scholar]
  18. Ji, Y.; You, Q.; Jiang, S.; Zhang, H.M. Statistical inference on transit route-level origin–destination flows using automatic passenger counter data. J. Adv. Transp. 2015, 49, 724–737. [Google Scholar] [CrossRef]
  19. Pi, X.; Egge, M.; Whitmore, J.; Silbermann, A.; Qian, Z.S. Understanding transit system performance using avl-apc data: An analytics platform with case studies for the pittsburgh region. J. Public Transp. 2018, 21, 2. [Google Scholar] [CrossRef]
  20. Feng, W.; Figliozzi, M. Using archived AVL/APC bus data to identify spatial-temporal causes of bus bunching. In Proceedings of the 90th Transportation Research Board Annual Meeting, Washington, DC, USA, 23–27 January 2011; pp. 11–32. [Google Scholar]
  21. Fadaei, M.; Cats, O. Evaluating the impacts and benefits of public transport design and operational measures. Transp. Policy 2016, 48, 105–116. [Google Scholar] [CrossRef] [Green Version]
  22. Patnaik, J.; Chien, S.; Bladikas, A. Estimation of bus arrival times using APC data. J. Public Transp. 2004, 7, 1. [Google Scholar] [CrossRef] [Green Version]
  23. Chen, M.; Liu, X.; Xia, J.; Chien, S.I. A dynamic bus-arrival time prediction model based on APC data. Comput.-Aided Civ. Infrastruct. Eng. 2004, 19, 364–376. [Google Scholar] [CrossRef]
  24. Chen, W.Y.; Chen, Z.Y. A simulation model for transit service unreliability prevention based on AVL-APC data. In Proceedings of the International Conference on Measuring Technology and Mechatronics Automation, Hunan, China, 11–12 April 2009; pp. 184–188. [Google Scholar]
  25. Shalaby, A.; Farhan, A. Prediction model of bus arrival and departure times using AVL and APC data. J. Public Transp. 2004, 7, 3. [Google Scholar] [CrossRef] [Green Version]
  26. Nuzzolo, A.; Crisalli, U.; Comi, A.; Rosati, L. A mesoscopic transit assignment model including real-time predictive information on crowding. J. Intell. Transp. Syst. 2016, 20, 316–333. [Google Scholar] [CrossRef]
  27. Ji, Y.; Mishalani, R.G.; McCord, M.R. Transit passenger origin–destination flow estimation: Efficiently combining onboard survey and large automatic passenger count datasets. Transp. Res. Part C Emerg. Technol. 2015, 58, 178–192. [Google Scholar] [CrossRef]
  28. Jenelius, E. Personalized predictive public transport crowding information with automated data sources. Transp. Res. Part C Emerg. Technol. 2020, 117, 102647. [Google Scholar] [CrossRef]
  29. Berrebi, S.; Joshi, S.; Watkins, K. Cross-Checking Automated Passenger Counts for Ridership Analysis. J. Public Transp. 2021, 23, 5. [Google Scholar]
  30. Martinez, J.; Mukhopadhyay, A.; Ayman, A.; Wilbur, M.; Pugliese, P.; Freudberg, D.; Dubey, A. Predicting public transportation load to estimate the probability of social distancing violations. In Proceedings of the Workshop on AI for Urban Mobility at the 35th AAAI Conference on Artificial Intelligence, Online. 8–9 February 2021. [Google Scholar]
  31. Egu, O.; Bonnel, P. Can we estimate accurately fare evasion without a survey? Results from a data comparison approach in Lyon using fare collection data, fare inspection data and counting data. Public Transp. 2020, 12, 1–26. [Google Scholar] [CrossRef]
  32. Kumar, P.; Khani, A.; Lind, E.; Levin, J. Estimation and mitigation of epidemic risk on a public transit route using automatic passenger count data. Transp. Res. Rec. 2021, 2675, 94–106. [Google Scholar] [CrossRef]
  33. Polzin, S.E.; Pendyala, R.M.; Navari, S. Development of time-of-day–based transit accessibility analysis tool. Transp. Res. Record 2002, 1799, 35–41. [Google Scholar] [CrossRef]
  34. Hensher, D.A.; Houghton, E. Performance-based quality contracts for the bus sector: Delivering social and commercial value for money. Transp. Res. Part B Methodol. 2004, 38, 123–146. [Google Scholar] [CrossRef] [Green Version]
  35. Kittelson & Associates, Inc.; KFH Group, Inc.; Parsons Brinckerhoff Quade & Douglass, Inc.; Zaworski, K. Transit capacity and quality of service manual. In TCRP Report 100, 2nd ed.; Transportation Research Board: Washington, DC, USA, 2003. [Google Scholar]
Figure 1. Map of Athens with the bus lines considered (Source: Google Maps).
Futuretransp 02 00023 g001
Figure 2. L171: Passenger flows along the line: Average number of boarding, alighting, and onboard passengers per stop.
Futuretransp 02 00023 g002
Figure 3. L171: Percentage of vehicle occupancy after each stop.
Futuretransp 02 00023 g003
Figure 4. L171: Percentage that each stop appeared to be a Point of Maximum Occupancy.
Futuretransp 02 00023 g004
Figure 5. L171: Occupancy percentage in the vehicle at the stops where Maximum Occupancy was observed.
Futuretransp 02 00023 g005
Table 1. Contribution of recent studies.
StudyRegionResearch Question
Jenelius [28]Stockholm, SwedenPersonalized predictive public transport crowding information
Berrebi et al. [29]Portland, OR, USA
Miami, FL, USA
Minneapolis/St. Paul, MN, USA
Atlanta, GA, USA
Consistency of APC data for analysis of ridership trends
Martinez et al. [30]Two metropolitan areas in the USADevelopment of ridership models and identification of social distancing violations
Egu and Bonel [31]Lyon, FranceFare irregularity rate
Kumar et al. [32]Minneapolis/St. Paul, MN, USAExtraction of origin–destination demand
Table 2. Characteristics of bus lines.
LineLength (km)Type of RouteStops
O-D
Stops
D-O
CapacityPeriod
15416.2Circular51-10315 January 2019 to 15 April 2019
17113.1Linear373415515 January 2019 to 28 February 2019
23713.3Circular47-10315 January 2019 to 15 April 2019
2427.5Circular20-15515 January 2019 to 15 April 2019
55020.9Linear565615515 January 2019 to 28 February 2019
60815.5Linear424315515 January 2019 to 28 February 2019
73212.7Linear464510215 January 2019 to 15 April 2019
Table 3. Passenger travel distance (km) per bus line and time period.
Bus Line5:00–7:007:00–10:0010:00–14:0014:00–18:0018:00–00:00
MeanSdMeanSdMeanSdMeanSdMeanSd
154 4.10.83.90.44.50.84.00.4
171O⇒D 5.60.65.50.25.90.75.71.0
D⇒O 5.80.45.50.55.70.45.50.3
237 2.90.12.80.22.90.12.50.4
242 2.80.22.80.43.00.53.20.3
550O⇒D7.51.55.90.65.60.65.50.44.40.5
D⇒O5.41.85.41.25.81.05.31.05.71.0
608O⇒D3.00.33.10.22.80.12.70.12.60.2
D⇒O3.10.33.10.23.10.13.20.23.10.1
732O⇒D3.70.33.20.22.70.22.80.22.80.3
D⇒O3.50.42.90.22.90.23.20.23.10.2
Table 4. Travel distance (km) per passenger per day and bus line.
Bus LineMondayTuesdayWednesdayThursdayFridaySaturdaySunday
MSdMSdMSdMSdMSdMSdMSd
1544.40.54.30.34.20.74.00.64.00.94.61.2
171O⇒D5.41.25.50.46.00.25.70.35.60.65.50.26.20.2
D⇒O5.80.55.90.35.60.55.60.45.40.55.70.36.30.3
2373.00.12.70.42.60.12.90.12.90.12.70.12.70.07
2423.20.32.81.12.80.12.80.12.90.4
550O⇒D5.50.65.80.95.90.75.81.05.81.56.40.85.21.1
D⇒O4.42.06.11.05.20.26.11.55.50.67.70.04.90.9
608O⇒D3.10.22.90.22.90.12.70.22.70.22.80.23.00.2
D⇒O2.80.13.20.23.00.12.50.13.00.23.10.13.40.2
732O⇒D3.20.32.90.22.80.43.00.22.90.22.60.33.20.3
D⇒O3.10.13.10.22.80.23.10.23.00.22.80.23.50.4
Publisher’s Note: MDPI stays neutral with regard to jurisdictional claims in published maps and institutional affiliations.

