Review

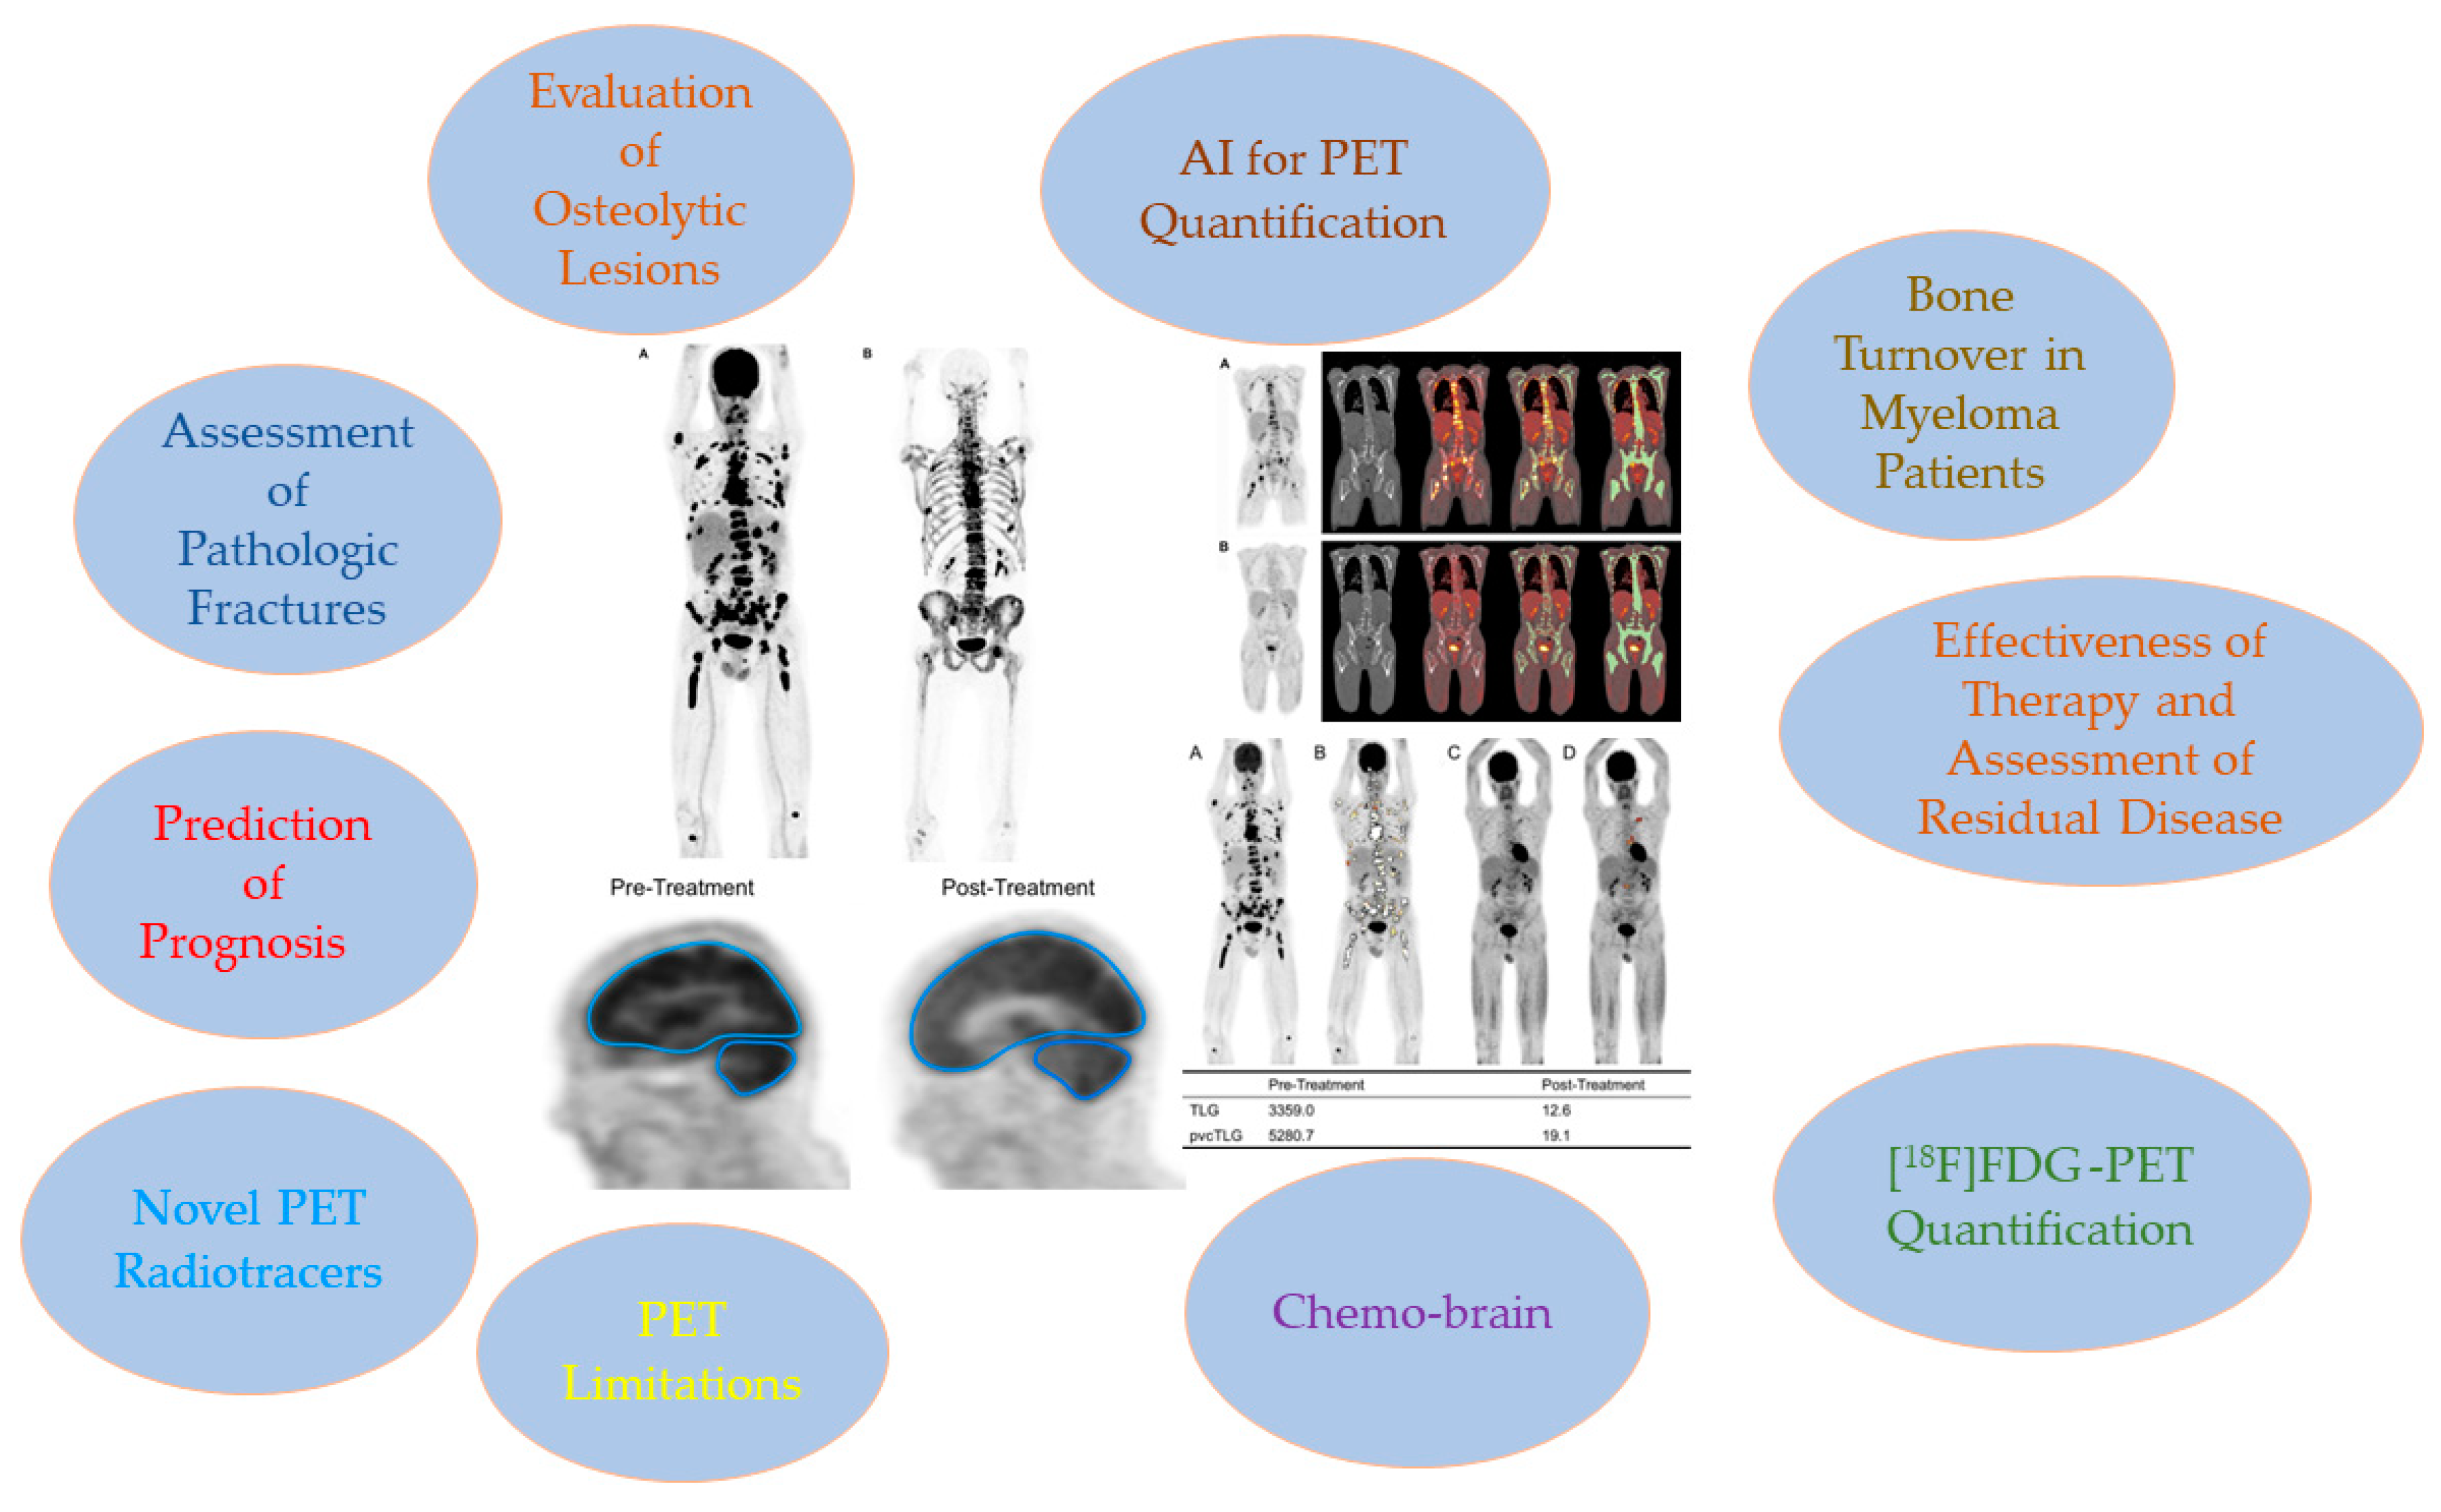
Significance of PET/CT Imaging in Myeloma Assessment: Exploring Novel Applications beyond Osteolytic Lesion Detection and Treatment Response

by
Mahdi Zirakchian Zadeh
Molecular Imaging and Therapy and Interventional Radiology Services, Department of Radiology, Memorial Sloan Kettering Cancer Center, New York, NY 10065, USA
Onco 2024, 4(1), 15-36; https://doi.org/10.3390/onco4010002
Submission received: 13 November 2023 / Revised: 30 December 2023 / Accepted: 2 January 2024 / Published: 9 January 2024

Abstract

:

Simple Summary

Until recently, 18F-fluorodeoxyglucose ([18F]FDG) PET/CT has primarily served in the evaluation of myeloma patients to identify osteolytic lesions and assess response to treatment. However, in recent years, new areas of myeloma disease have been investigated using PET/CT, including bone turnover, dual-time-point imaging, chemo brain, novel PET radiotracers, and artificial intelligence. This article aims to provide a comprehensive review of both conventional and novel roles of PET/CT in the assessment of myeloma.

Abstract

In multiple myeloma (MM), specific cytokines produced by plasma cells disrupt the equilibrium between osteoblasts and osteoclasts. As a result, MM patients experience an increase in osteoclast activity and a decrease in osteoblast activity. This disparity is fundamental to the development of myeloma bone disease. Lytic lesions, which are a feature of MM, can result in pathologic fractures and excruciating pain. For many years, whole-body X-ray radiography has been the standard imaging method for identifying lytic lesions. However, its sensitivity is limited because it can only detect lesions once the bone mass has been reduced by 30% to 50%. Hence, utilizing advanced and sensitive imaging modalities, such as positron emission tomography (PET) fused with computed tomography (CT), is crucial for the early detection of osteolytic lesions. Among radiotracers used in PET imaging, 1⁸F-fluorodeoxyglucose ([18F]FDG) is the most commonly employed in the field of oncology. Currently, most guidelines include [18F]FDG PET/CT in the assessment of myeloma patients, particularly for detecting osteolytic lesions, evaluating treatment response, and assessing extramedullary and residual disease. Nonetheless, in recent years, new applications of PET/CT for evaluating myeloma have been investigated. These include assessing aspects such as bone turnover, dual-time-point imaging (early and delayed scans), the impact of chemotherapy on the brain (commonly known as ‘chemo brain’), innovative PET radiotracers, and the use of artificial intelligence technology. This article aims to provide a comprehensive review of both conventional and innovative uses of PET/CT in evaluating multiple myeloma.

1. Introduction

While there have been remarkable strides in multiple myeloma (MM) treatment, resulting in unprecedented response rates and improved survival, patients continue to experience relapses, and achieving a complete cure remains a challenging goal [1]. Therefore, a comprehensive assessment process for MM patients, which involves a complete blood count with differentiation, serum chemistry analysis, assessments of creatinine, lactate dehydrogenase, β2-microglobulin levels, immunoglobulin studies, imaging, and a bone marrow examination, is necessary for the majority of the patients [2]. The hallmark of MM is the clonal expansion of plasma cells [3]. The plasma cells produce some cytokine that imbalances the interaction between osteoblasts and osteoclasts [4]. It has been shown that osteoclast activity in the bone marrow of MM patients increased while osteoblast activity decreased [4]. This disproportion is the core issue of bone complications in individuals with myeloma. Those afflicted with myeloma frequently exhibit osteolytic bone lesions, resulting in fractures and severe pain [5]. Fatigue and repeated infections are two additional common non-specific myeloma presentation symptoms [5]. Among malignant diseases, myeloma has the highest occurrence of bone involvement, with around 90% of patients developing bone lesions and up to 60% experiencing pathologic fractures throughout the course of their illness [5]. Any bone can be affected, although the spine (49%), skull (35%), pelvis (34%), ribs (33%), humeri (22%), femora (13%), and mandible (10%) have the highest number of lesions [6]. Most patients do not experience healing from these lytic lesions, and skeletal lesions might advance even when the disease is largely under control thanks to chemotherapy. [7].
For a long duration, whole-body X-ray (WBXR) imaging has been recognized as the premier imaging modality for detecting lytic lesions [8]. The 2017 National Comprehensive Cancer Network (NCCN) Clinical Practice Guidelines in Oncology recommended the use of a skeletal survey as a component of the initial diagnostic workup for MM [9]. It is now commonly understood that standard X-rays are not very effective at spotting lytic lesions, as these lesions do not show up until there is a 30% to 50% destruction in bone mass [8]. As a result, it becomes vital to employ advanced imaging techniques, such as positron emission tomography (PET) fused with computed tomography (CT), for the prompt detection of osteolytic lesions [8]. In 2021, NCCN guidelines suggested CT or PET/CT to be used in place of a skeletal survey [10]; in low-resource settings, where advanced imaging techniques are not available, a skeleton survey is still acceptable [10]. The International Myeloma Working Group (IMWG) has also recommended the use of more sophisticated imaging modalities in detecting osteolytic lesions at an earlier stage due to their higher sensitivity [11].
18F-fluorodeoxyglucose ([18F]FDG) is the most commonly used PET radiotracer for identifying cancers and their metastases [12]. Because cancer cells typically absorb glucose at a higher rate than normal cells, they also exhibit an increased uptake of [18F]FDG, which is a glucose analogue, when compared to healthy tissues. [18F]FDG PET/CT merges the functional imaging capabilities of PET with the structural evaluation provided by CT [13]. Beyond its cancer detection capabilities, this imaging modality can gauge the intensity and variability of different diseases across the body. [18F]FDG PET/CT has been extensively studied in evaluating myeloma patients, particularly in the detection of osteolytic lesions, evaluation of therapy response, and assessment of extramedullary and residual disease. Numerous studies have demonstrated that [18F]FDG PET/CT has great sensitivity and specificity ranges from 80% to 100% for identifying osteolytic myeloma lesions [11]. However, recent advancements have spurred further investigations into novel applications of PET/CT in myeloma assessment, such as assessing bone turnover, dual-time-point imaging or early and delayed scans, chemo brain, novel PET radiotracers, and artificial intelligence (AI) technology. This article aims to offer a comprehensive review of both traditional and innovative implementations of PET in the evaluation of MM (Figure 1).

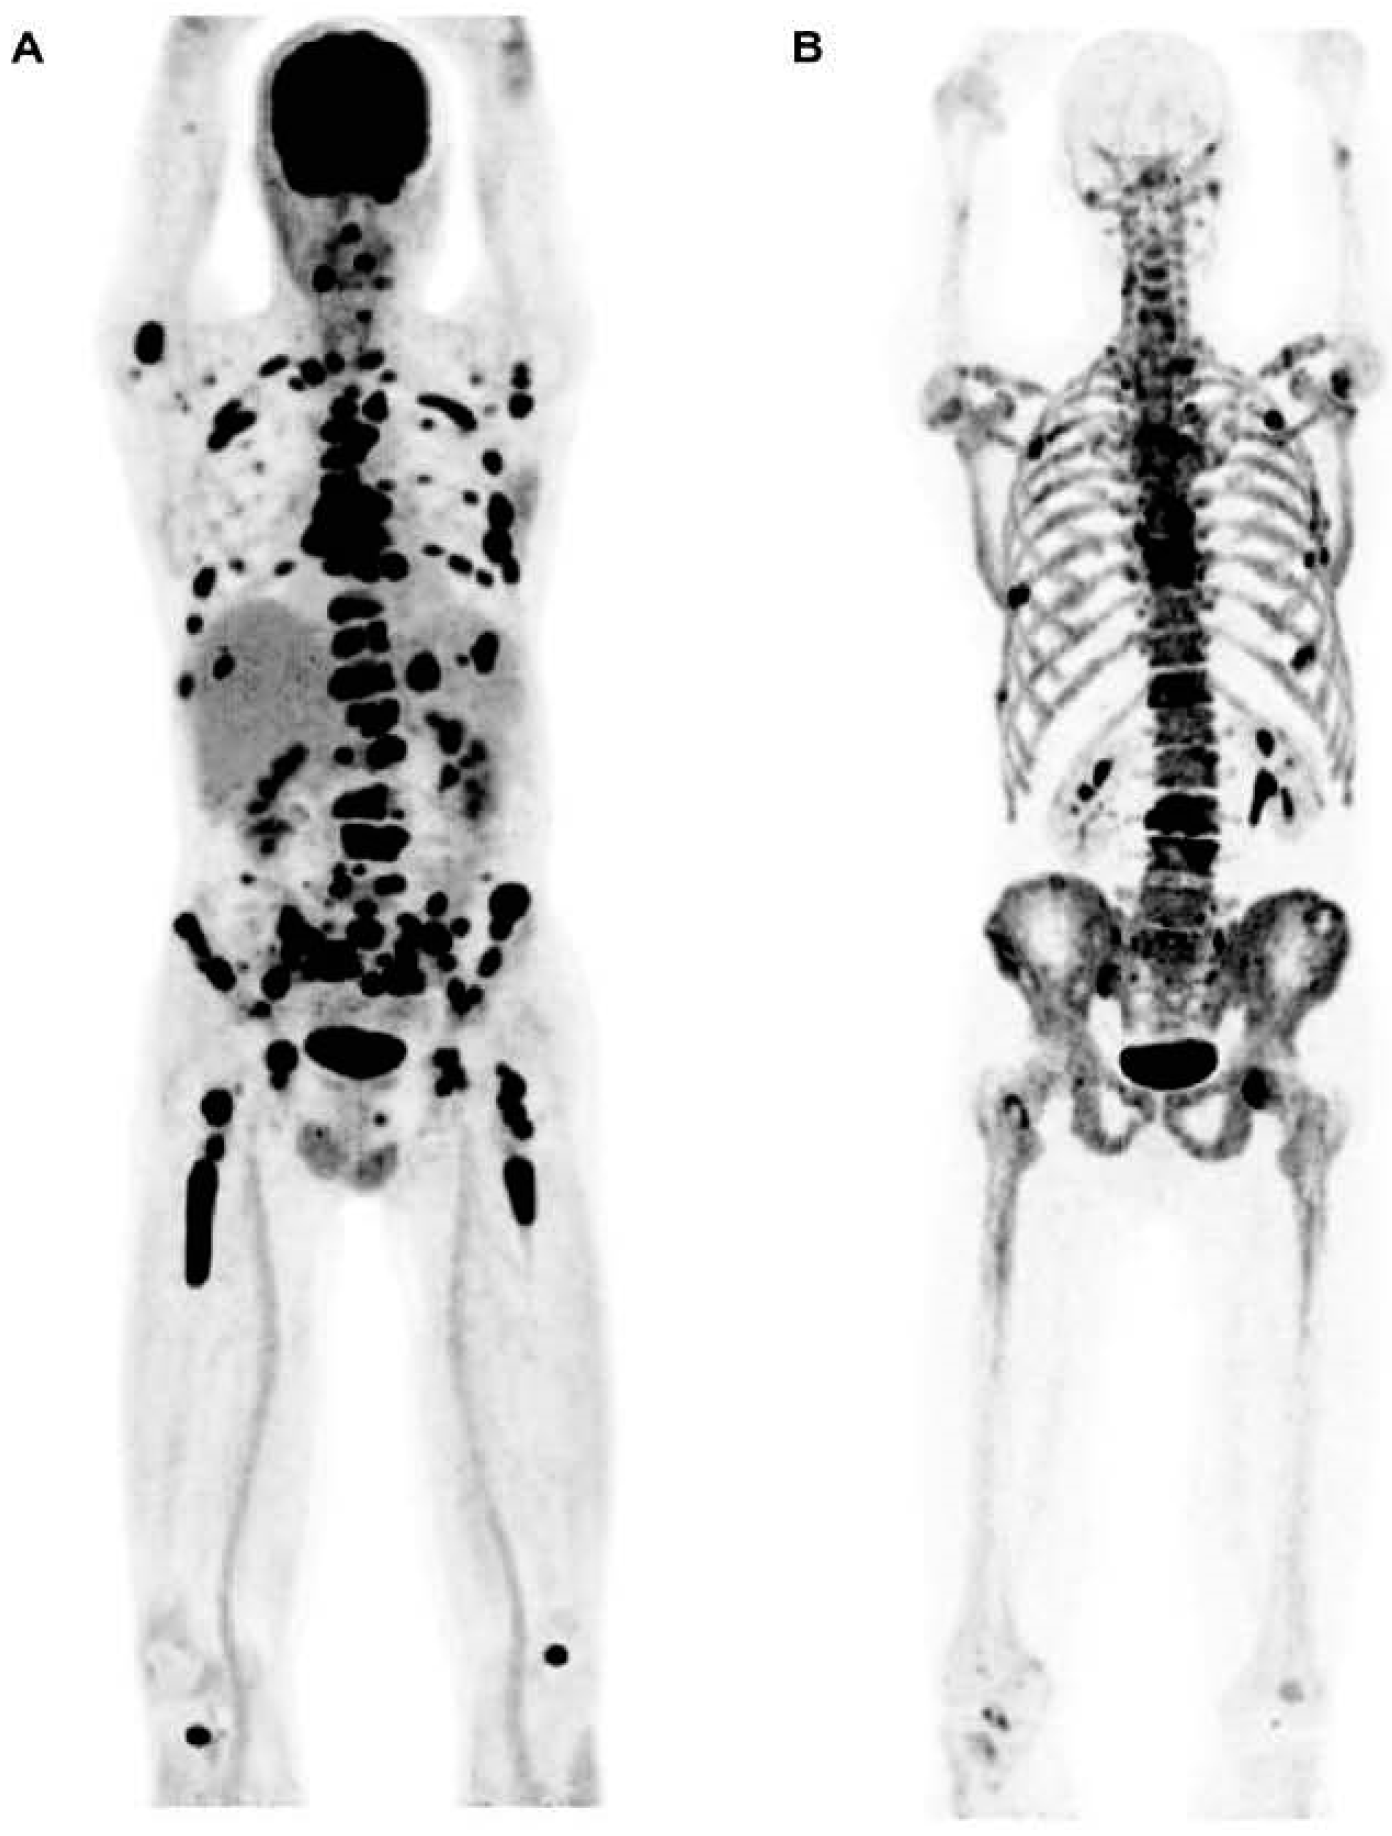
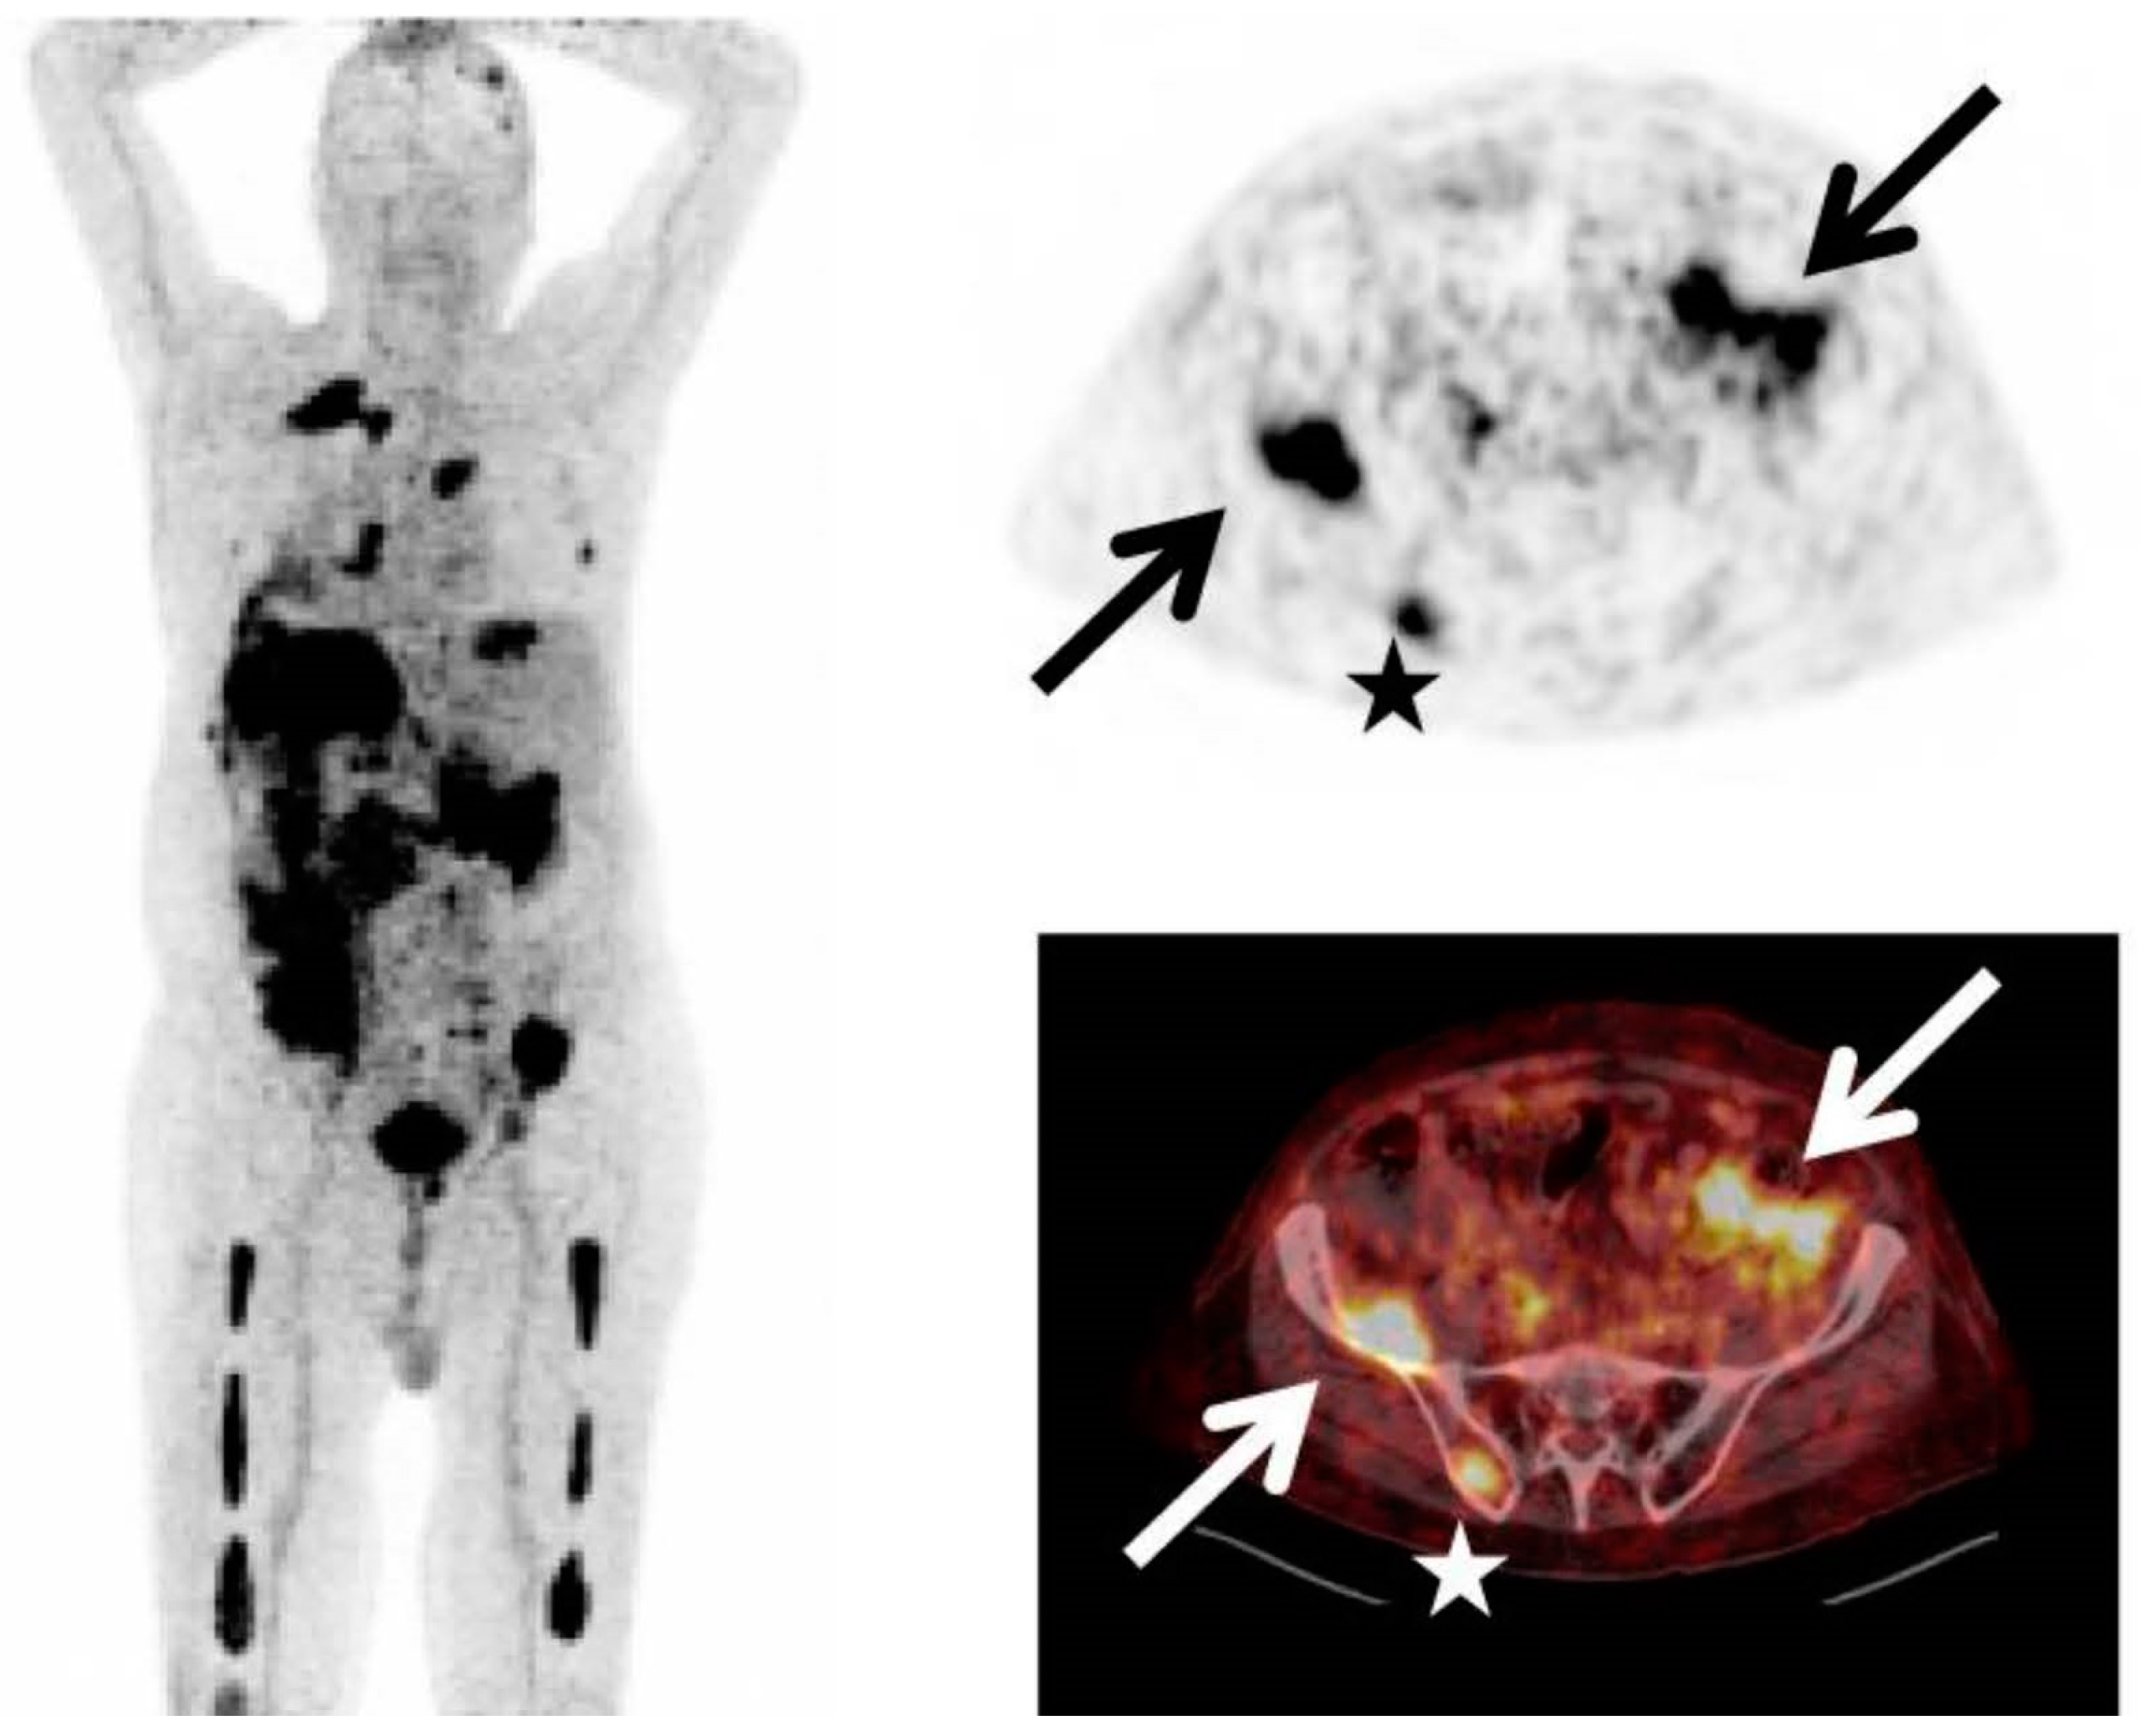
2. Assessment of Bone Disease in MM: An Examination of Osteolytic Lesions

The efficacy of [18F]FDG PET/CT in the evaluation of myeloma osteolytic lesions has been validated (Figure 2 and Figure 3), with recorded sensitivity and specificity ranging between 80% and 100% [8,11]. In a systemic review including eighteen studies with 798 patients, [18F]FDG PET exhibits higher sensitivity for detecting myeloma bone lesions compared to WBXR [14]. In another systemic review by Ragerlink et al. [15], all of the imaging modalities demonstrated a greater detection rate when compared to WBXR, showing up to an 80% increase in the rate of osteolytic lesion detection: MRI (1.12–1.82), CT (1.04–1.33), PET (1.00–1.58), and PET/CT (1.27–1.45). Some recent guidelines, including those from the European Myeloma Network and the 2016 update of the European Society of Medical Oncology guidelines, advocate for the use of whole-body low-dose CT as the preferred method to evaluate lytic bone lesions in MM [15]. There are, however, few studies that have prospectively compared whole-body low-dose CT with [18F]FDG PET/CT [11]. According to the latest IMWG consensus guideline, the initial diagnostic evaluation of myeloma patients can be performed by [18F]FDG PET/CT instead of low-dose whole-body CT (IV level of evidence) [11]. In addition, as per the NCCN guidelines, both low-dose CT and [18F]FDG PET/CT are considered appropriate options for the initial assessment of myeloma patients [10].
According to Bredella and colleagues, [18F]FDG PET/CT demonstrated an 85% sensitivity and a 92% specificity in detecting lytic lesions [16]. In another study conducted by Zamagni et al. on newly diagnosed multiple myeloma (NDMM) patients, [18F]FDG PET/CT revealed a higher number of lesions compared to WBXR in 16 out of 28 patients [17]. The researchers observed that in 46% of patients, [18F]FDG PET/CT exhibited better performance in detecting active lesions, whereas only in 8% of myeloma patients did WBXR demonstrate greater sensitivity than PET/CT for detecting osteolytic lesions [17]. Another study revealed that there was no substantial difference in treatment choices between various imaging techniques, despite the fact that whole-body MRI (WBMRI) demonstrated superior sensitivity in detecting bone myeloma lesions compared to 18F-FDG PET on a per-patient evaluation [18]. Consequently, the authors concluded that either approach ([18F]FDG PET or WBMRI) would be appropriate for early staging, with the choice depending on available resources and expertise [18]. In another study, both MR and [18F]FDG PET/CT imaging modalities demonstrated equivalent success in detecting localized lesions in the spine of myeloma patients [19]. It is important to note that a limitation of MR imaging is its restricted field of view, as up to one-third of patients may have osseous abnormalities detectable by [18F]FDG PET/CT in regions that MR imaging cannot explore [19].

3. Prediction of Prognosis

The progression of MM can vary, and unfortunately, it remains a life-threatening condition. Consequently, it is crucial to identify high-risk individuals at an early stage, making the search for precise prognostic myeloma markers of utmost importance [8]. In an investigation on myeloma patients who received autologous stem cell transplantation (ASCT), Zamagni and colleagues found that the presence of focal bone lesions (FLs) higher than three, along with the detection of extramedullary disease (EMD) using [18F]FDG PET/CT, adversely affected both progression-free survival (PFS) and overall survival (OS) [20]. Sachpekidis and colleagues conducted a research study on baseline [18F]FDG PET/CT scans in 47 NDMM patients. After ASCT, 34 of these patients, or 72.3%, had a subsequent PET/CT examination [21]. In a univariate survival analysis, the number of [18F]FDG -avid spots observed both before and after treatment, along with the presence of paramedullary disease (PMD) and extramedullary disease (EMD) prior to treatment, negatively influenced PFS [21]. In a multivariate survival evaluation, the count of distinct [18F]FDG -avid lytic lesions and the existence of EMD were indicators of a less favorable outcome, irrespective of the international staging system (ISS) or the existence of high-risk genetic factors [21].

Correlation of [18F]FDG PET and β2-Microglobulin

A pre-treatment serum β2-microglobulin level serves as an assessment of tumor load and stands as one of the foremost prognostic factors in MM [22]. In one study enrolling 24 myeloma patients, the pre-treatment β2-microglobulin strongly correlated with the presence of [18F]FDG-avid focal bone lesions (r: 0.869, p = 0.002) [22].

4. Importance of [18F]FDG PET/CT in Assessing Treatment Efficacy

Evaluating the response to treatment is a significant area where [18F]FDG PET/CT might offer greater utility compared to conventional imaging methods [23] (Figure 4 and Figure 5). By analyzing the metabolic behavior in areas with clonal plasma cell growth, [18F]FDG PET/CT can precisely gauge and quantitatively measure alterations in cancer cell activity following therapeutic interventions [24,25,26,27,28,29]. Furthermore, there is a robust correlation between negative [18F]FDG PET/CT results and a highly positive response to treatment in myeloma patients [20].

4.1. Baseline Parameters of [18F]FDG PET

In a scientific study involving MM patients, [18F]FDG PET/CT scans were performed either on the seventh day after the start of initial treatment or before the commencement of the first ASCT [26]. The study revealed that myeloma patients with high-risk genetic patterns, who still had more than three distinct lesions on PET/CT after the seventh day, faced decreased PFS and OS outcomes [26]. Likewise, there was a notable enhancement in both PFS and OS among instances where [18F]FDG avidity in focal lesions was eliminated prior to ASCT. Additionally, the research showed that [18F]FDG PET/CT scans could potentially predict a complete response, sometimes almost 18 months earlier than detections made through MR imaging or other structural imaging techniques [26]. In a different study with 239 patients who received ASCT after neoadjuvant therapy, those who had more than three focal lesions on the baseline [18F]FDG PET scan had lower OS and event-free survival (EFS) [25]. To be precise, eighty seven percent of patients with three or less [18F]FDG -avid lesions experienced an event-free 30-month survival, compared to only six percent of patients with more than three such lesions. Moreover, individuals who demonstrated a complete reduction in [18F]FDG PET uptake prior to undergoing a stem cell transplant exhibited enhanced rates of OS and EFS [25].

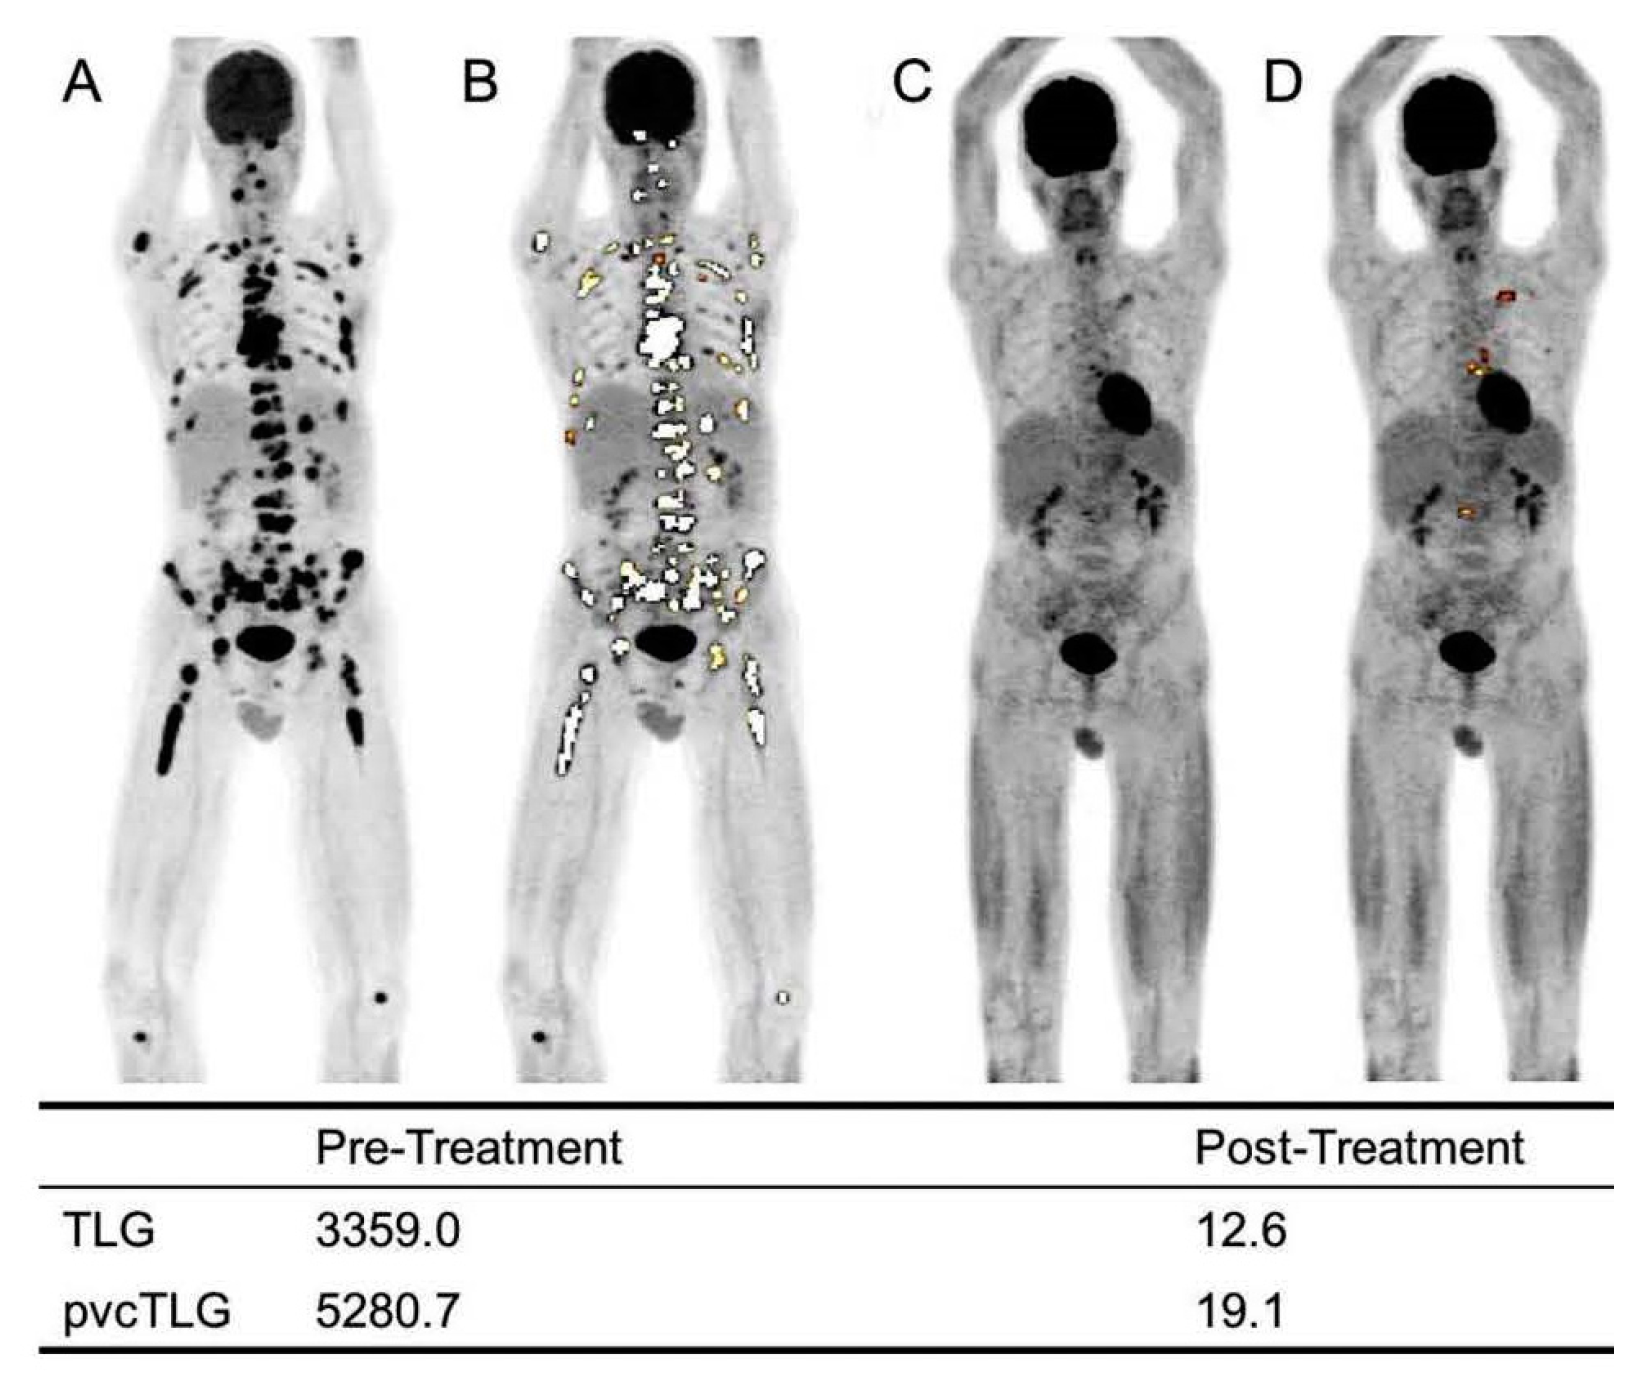
4.2. Assessment of Myeloma Patients after Treatment

Research studies have confirmed that a negative post-therapy PET/CT scan can predict the absence of relapse and a prolonged disease-free period [30]. Conversely, there is a connection between elevated post-treatment [18F]FDG uptake and shorter durations before experiencing a relapse [31]. As an example, an illustration comes from the work of Zamagni and co-authors [20], where the persistence of [18F]FDG avidity three months post-ASCT was indicative of a decreased PFS. After three months following ASCT, 65% of patients showed a negative result in their PET/CT scans. These individuals exhibited better rates of PFS at four years, reaching 66%, and OS at 89%, compared to patients with positive PET results [20]. Some studies conducted a comparison between PET and MR imaging to assess treatment response. Compared to contrast-enhanced MR imaging, [18F]FDG PET/CT indicated a faster return to normalcy in patients who achieved a complete or significant partial response to treatment. In one examination, PET/CT accurately detected positive treatment responses in 80% (16 out of 20) of patients, outperforming MR imaging which correctly identified positive responses in only 60% (12 out of 20) of patients [30]. In a separate study, Spinnato and fellow researchers examined 40 MM patients. They revealed that among those with favorable or full responses to therapy (27 patients, accounting for 67.5% of the group), the normalization process occurred more rapidly in PET/CT compared to MR imaging [32].

5. Identification of Minimal Residual Disease (MRD) in Myeloma

The focus on assessing and managing MRD has heightened due to recent advancements and the introduction of novel medications, which provide enhanced efficacy in treating MM [33]. IMWG has suggested the utilization of both sensitive bone marrow-based tests and functional imaging methods with the ability to identify MRD beyond the confines of the bone marrow [11]. The integration of these methods enables the determination of the complete elimination of tumor clones. Extensive research, including a comprehensive meta-analysis, has unveiled that the absence of metabolic activity detected by a negative [18F]FDG PET/CT scan following ASCT serves as a strong indicator of more favorable outcomes, contrasting with indications of persistent metabolic activity [8].
In a retrospective investigation, [18F]FDG PET/CT scans were examined both before and after therapy for patients who were and were not eligible for ASCT [34]. Even though 100 out of 189 patients (53%) had a full response, [18F]FDG PET/CT remained positive in 29 cases [34]. When compared to other patients, those with persistent [18F]FDG uptake had significantly shorter PFS and OS (median PFS: 44 months vs. 84 months [p = 0.0009], 5-year OS: 70% vs. 90% [p = 0.003]) [34].

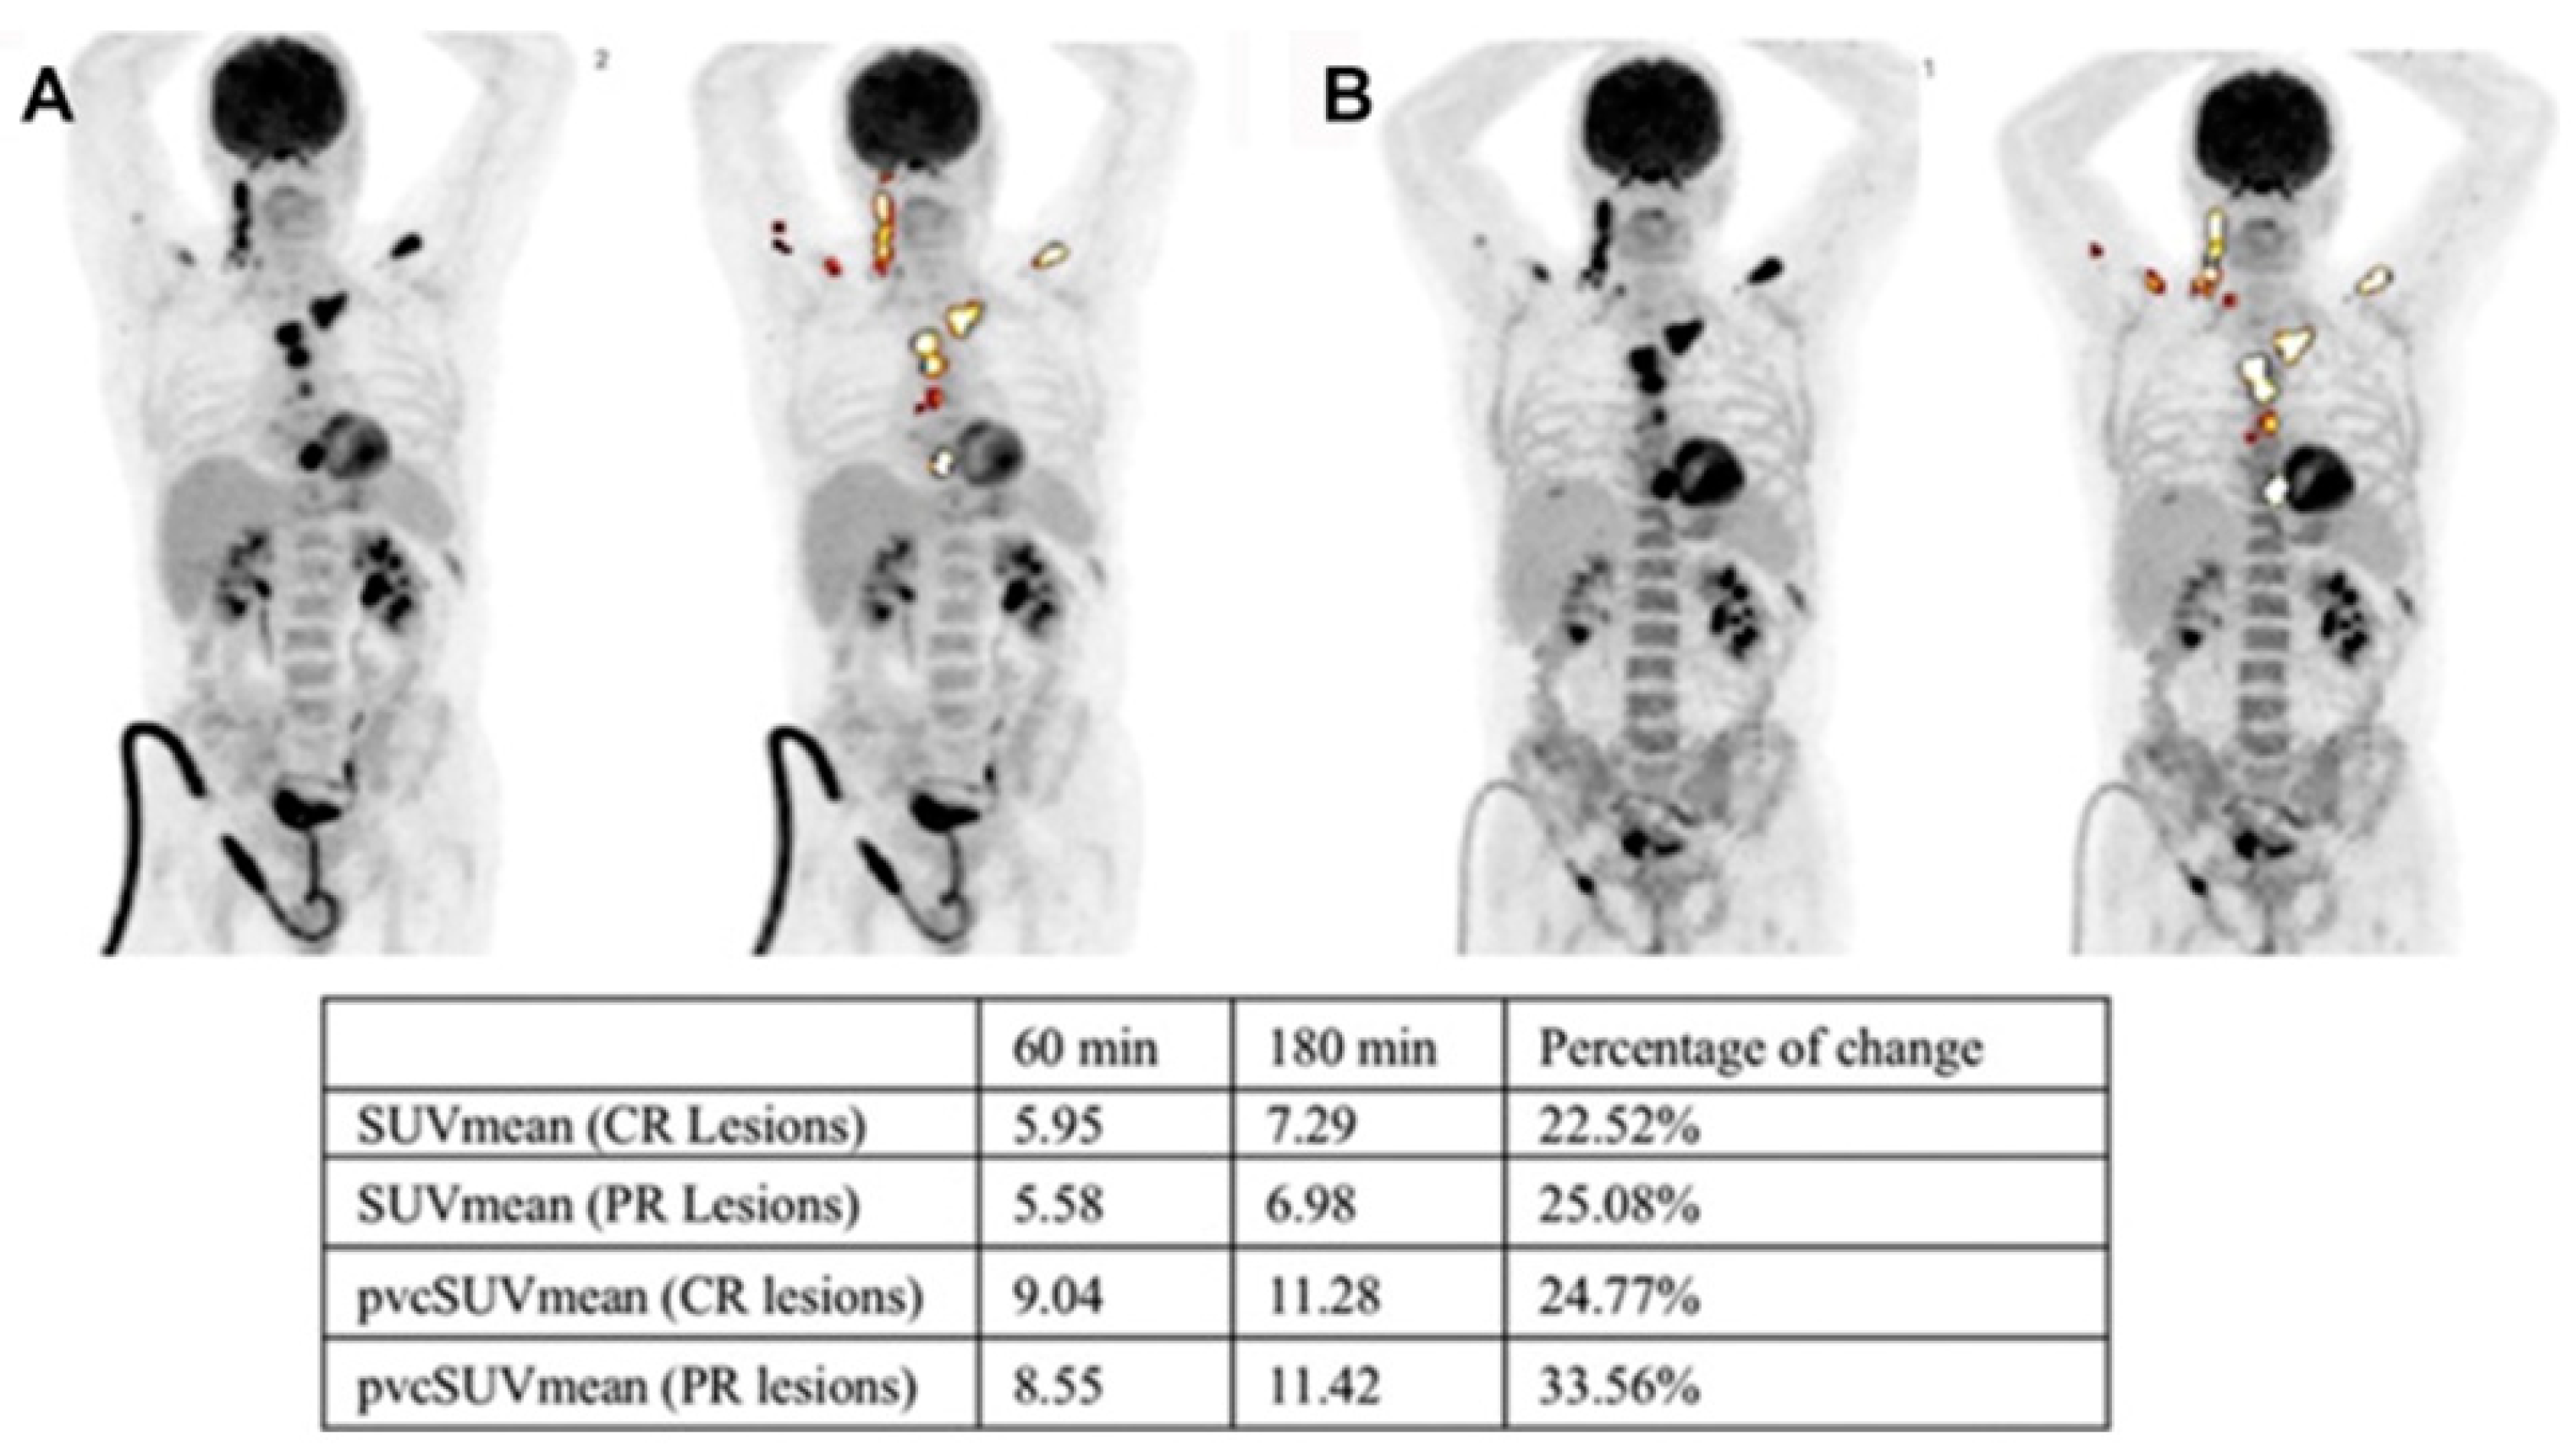
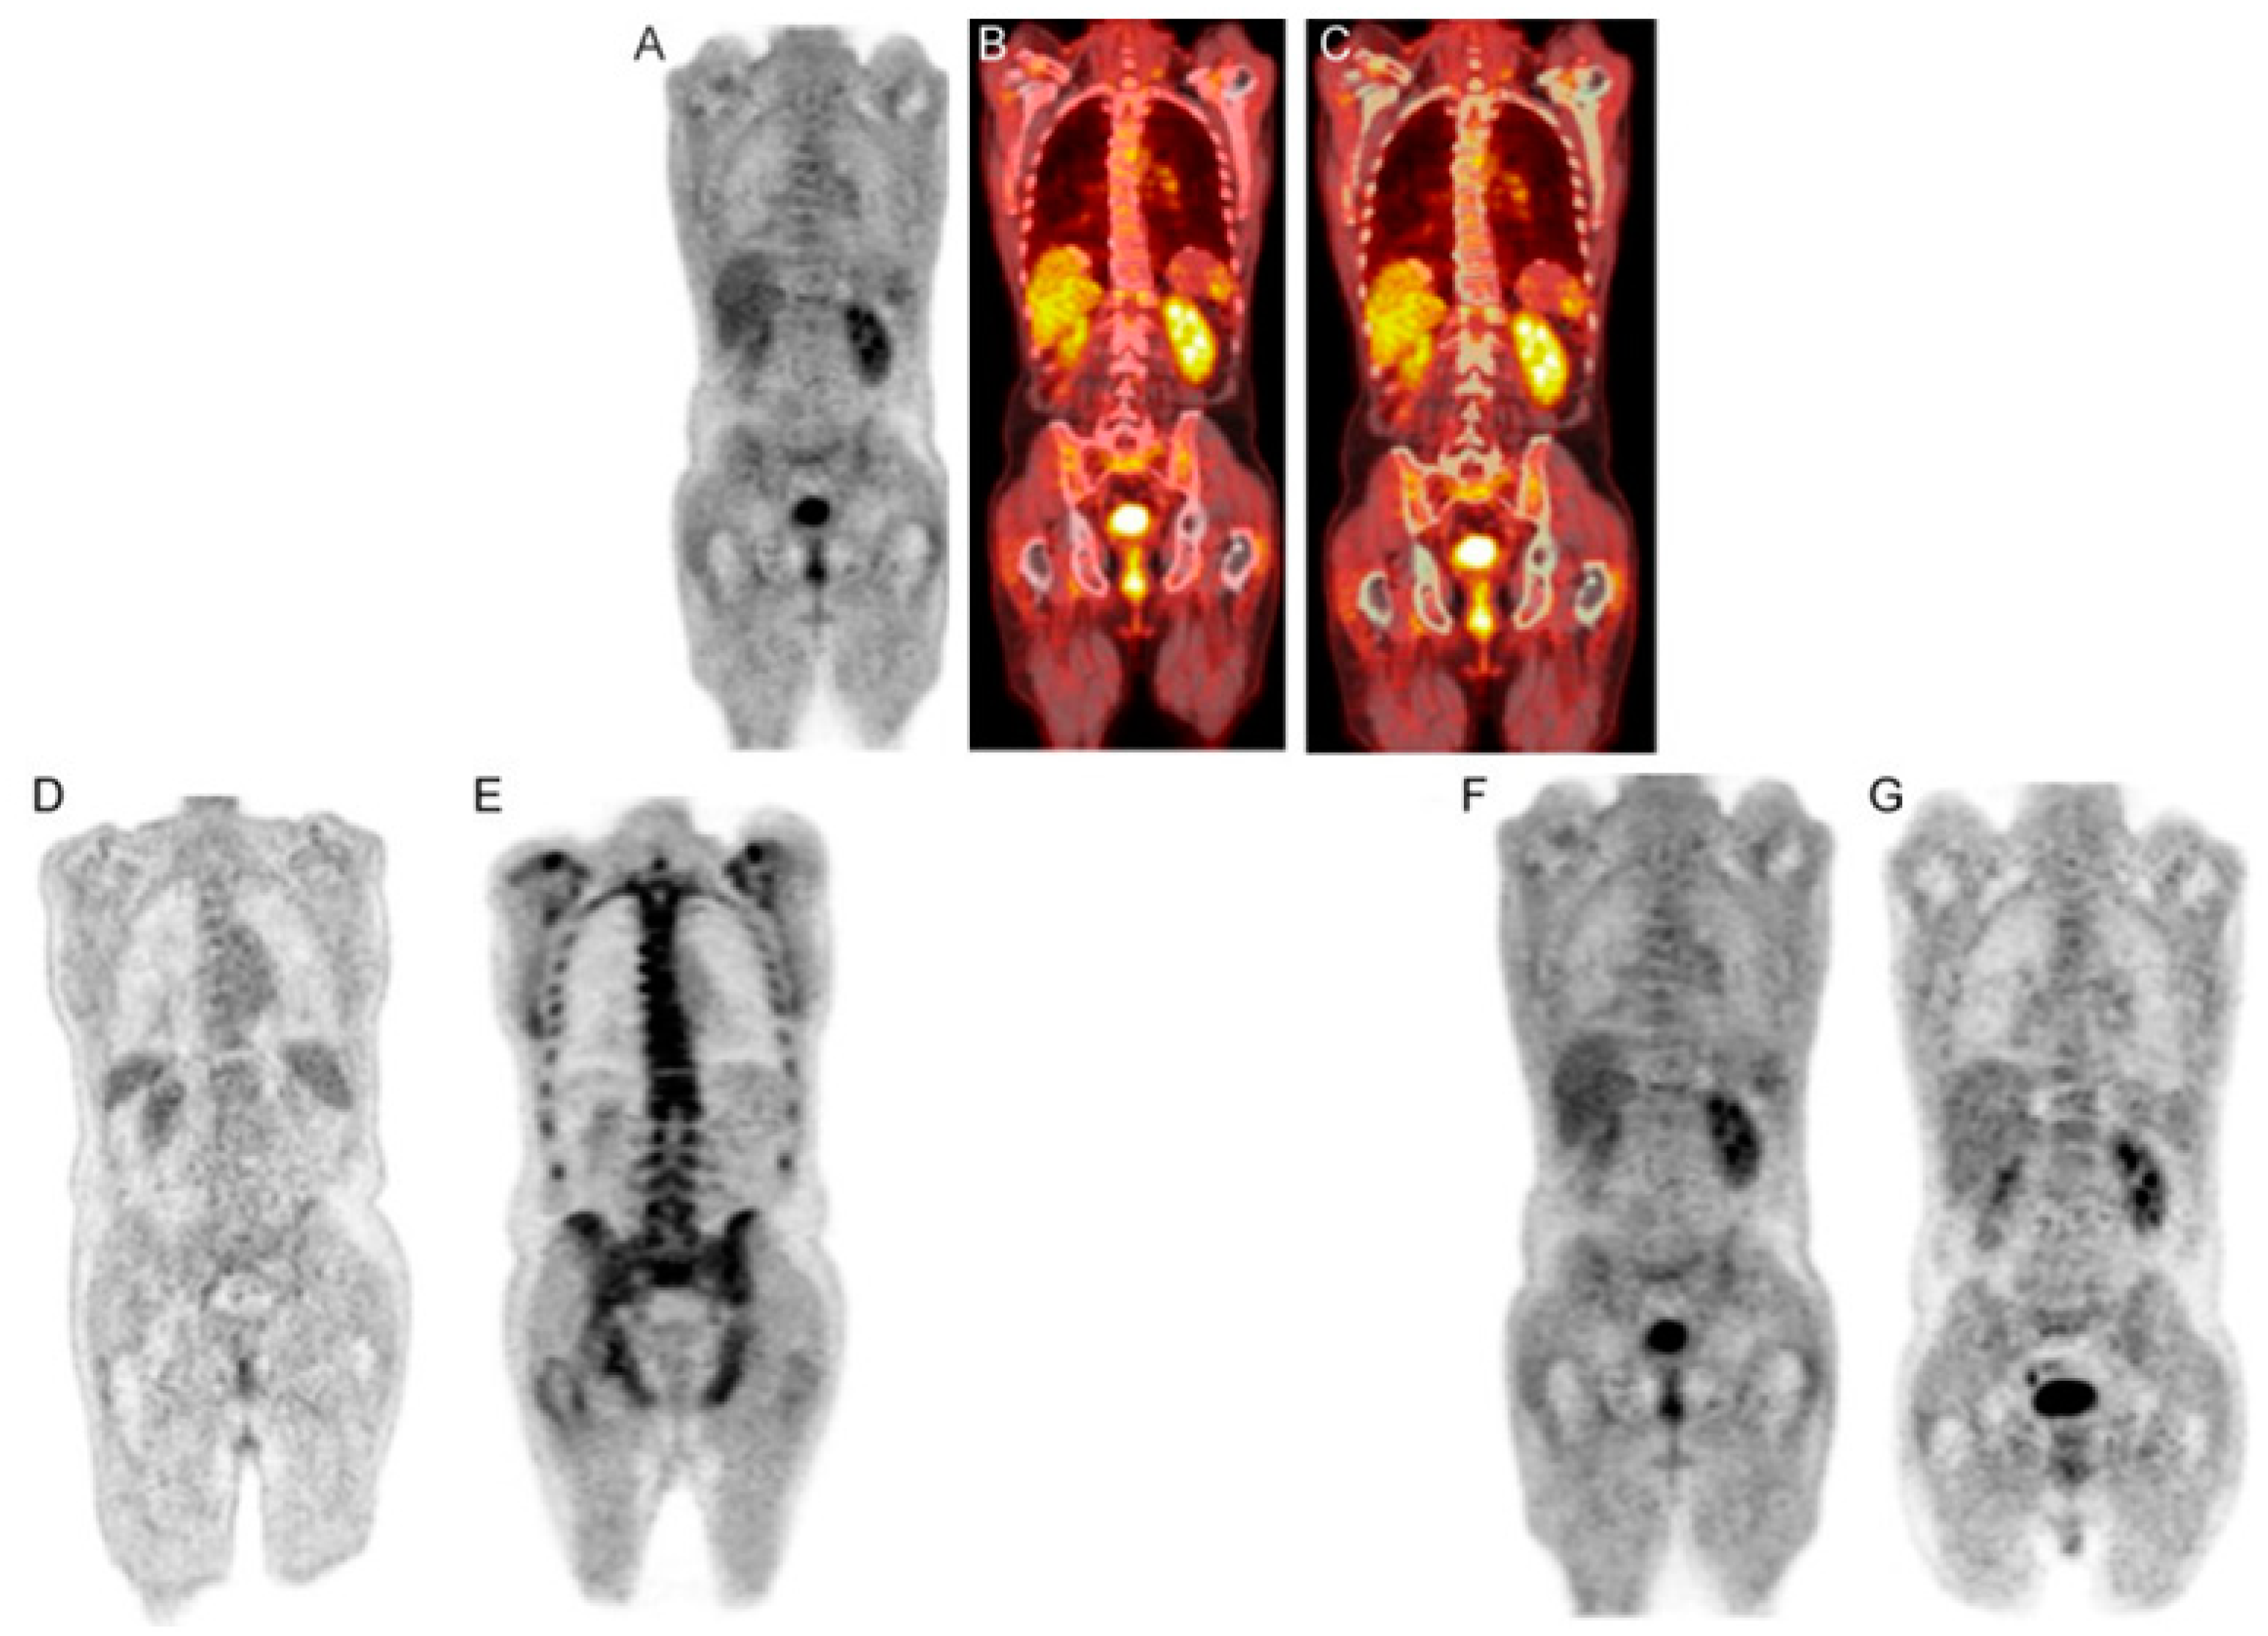
6. Dual-Time-Point Imaging (DTPI) in MM

Between the 1 h and 4 h intervals following the injection of [18F]FDG, cancerous tumors consistently exhibit heightened [18F]FDG absorption, whereas benign tumors and healthy tissues consistently display reduced uptake [35]. As a result, delayed imaging demonstrates higher sensitivity and specificity in detecting malignant lesions compared to imaging at a single time point [35]. Hence, DTPI has demonstrated promise as a method to differentiate between malignant and benign lesions [36]. Nevertheless, the literature lacks a well-established understanding of the role of DTPI in evaluating lesions associated with MM. In an initial investigation, Taghvaei and co-authors [37] conducted a study where they evaluated the [18F]FDG uptake in patients with MM at 1 and 3 h. The study indicated that partial response was linked to lesions demonstrating a significantly higher increase in [18F]FDG uptake between two PET scans, whereas situations involving complete response showed stable [18F]FDG measures [37] (Figure 6). The study came to the conclusion that DTPI may be able to predict the degree of treatment sensitivity and aggressiveness in MM patients [37].

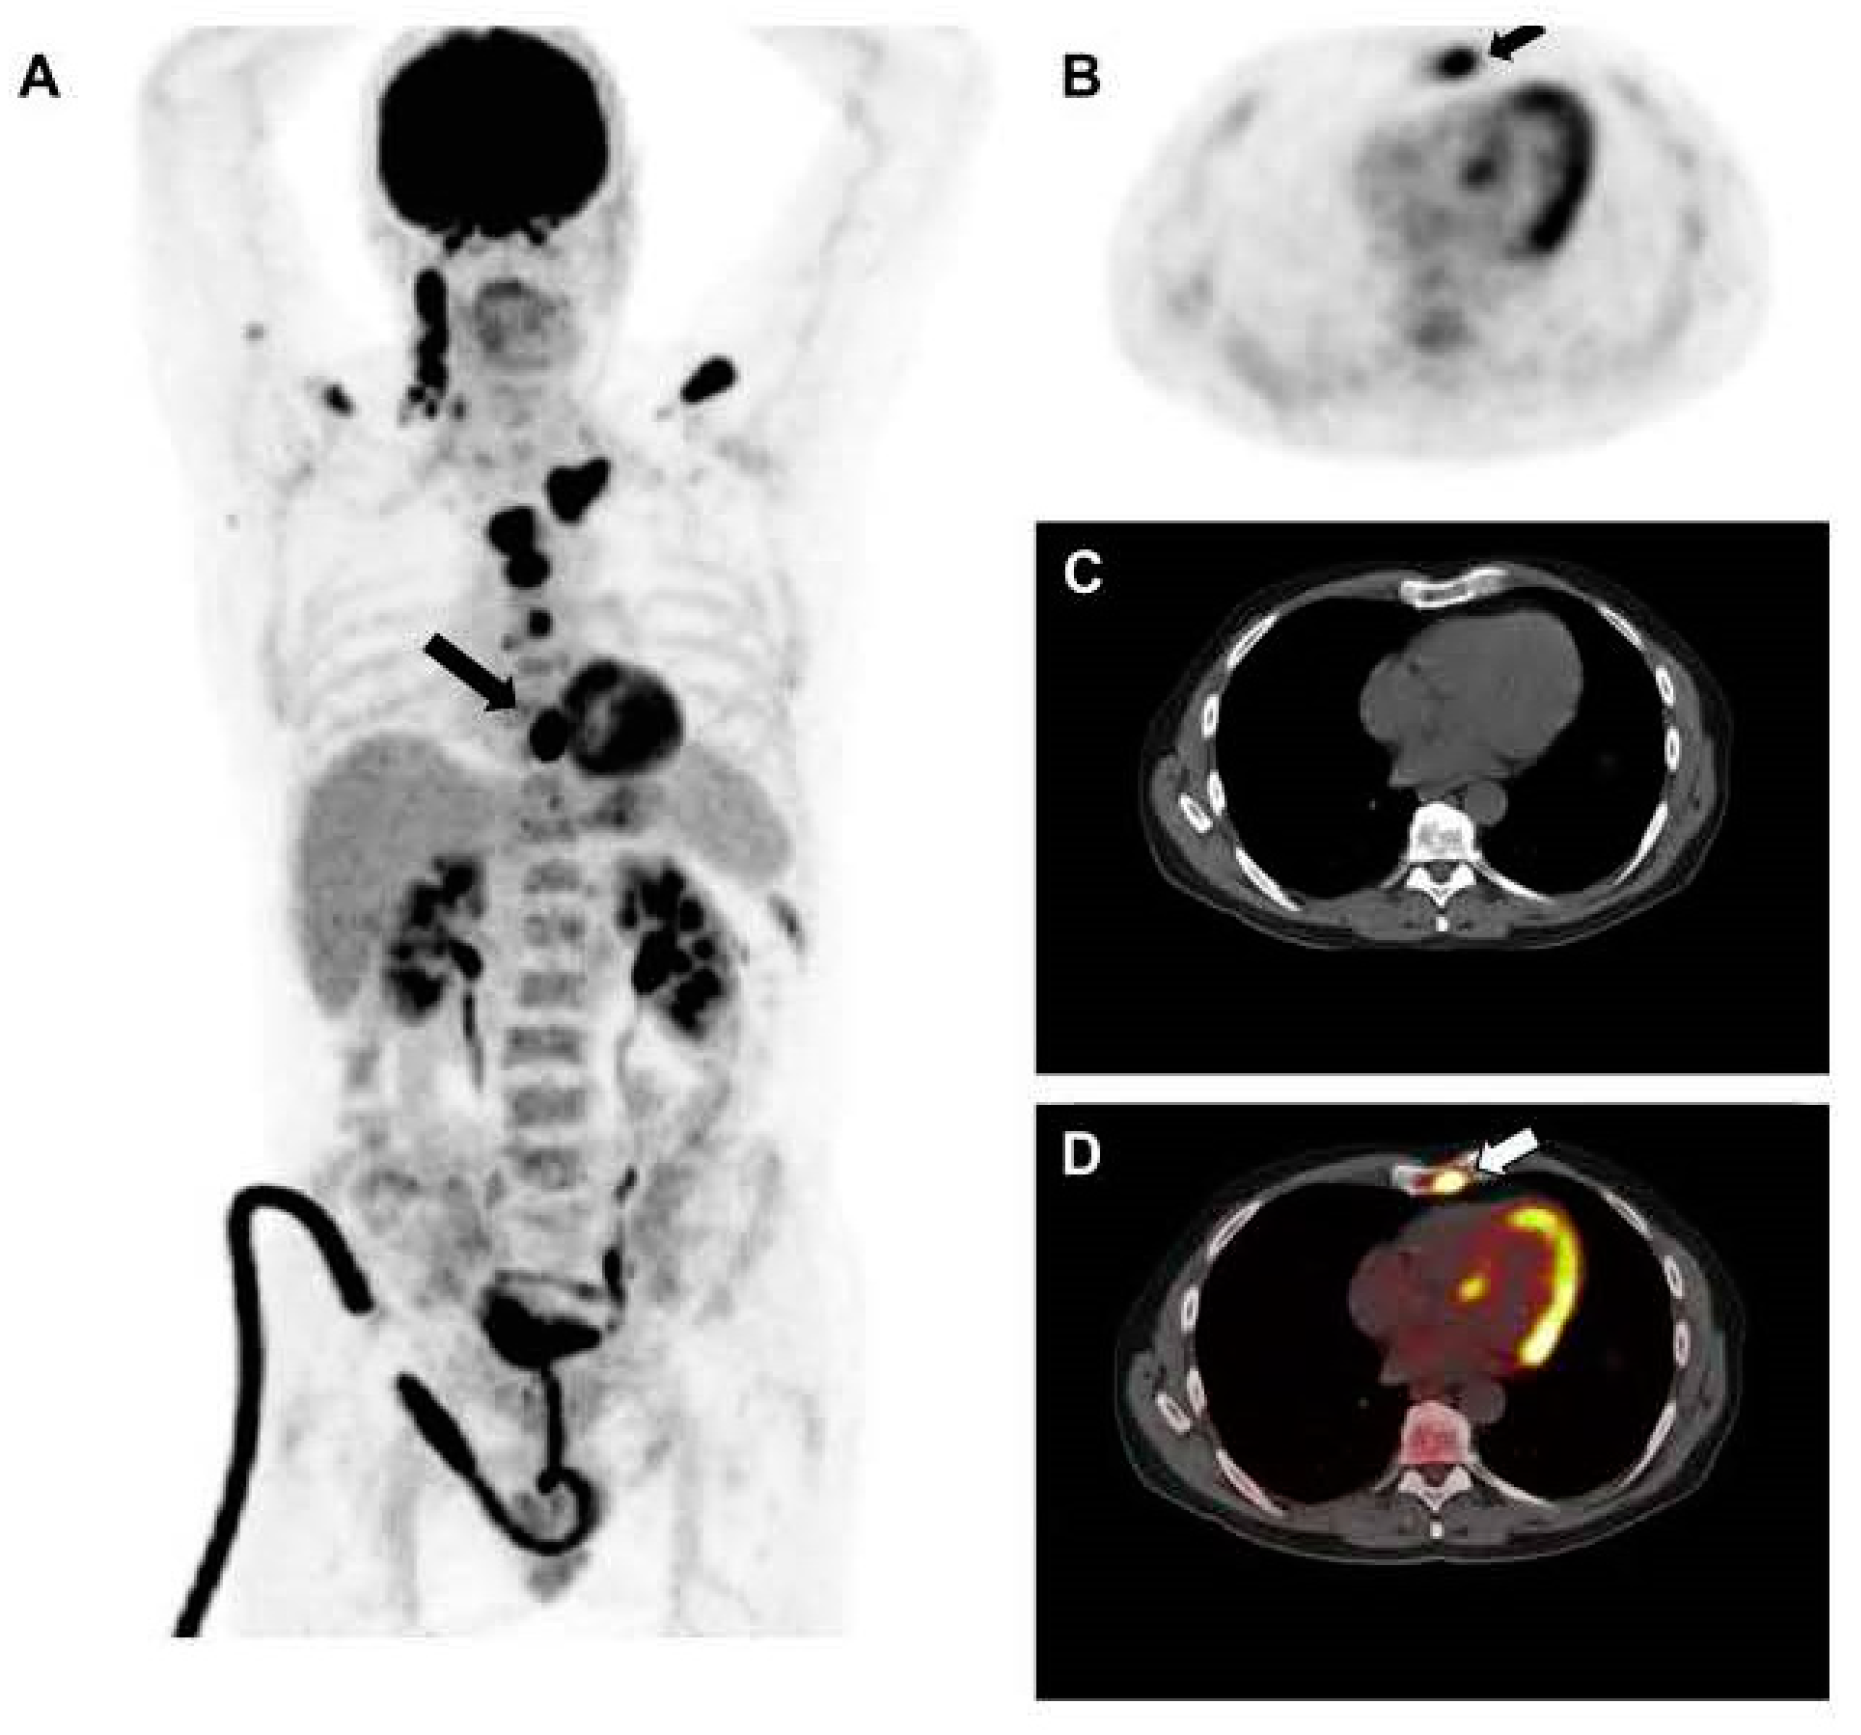
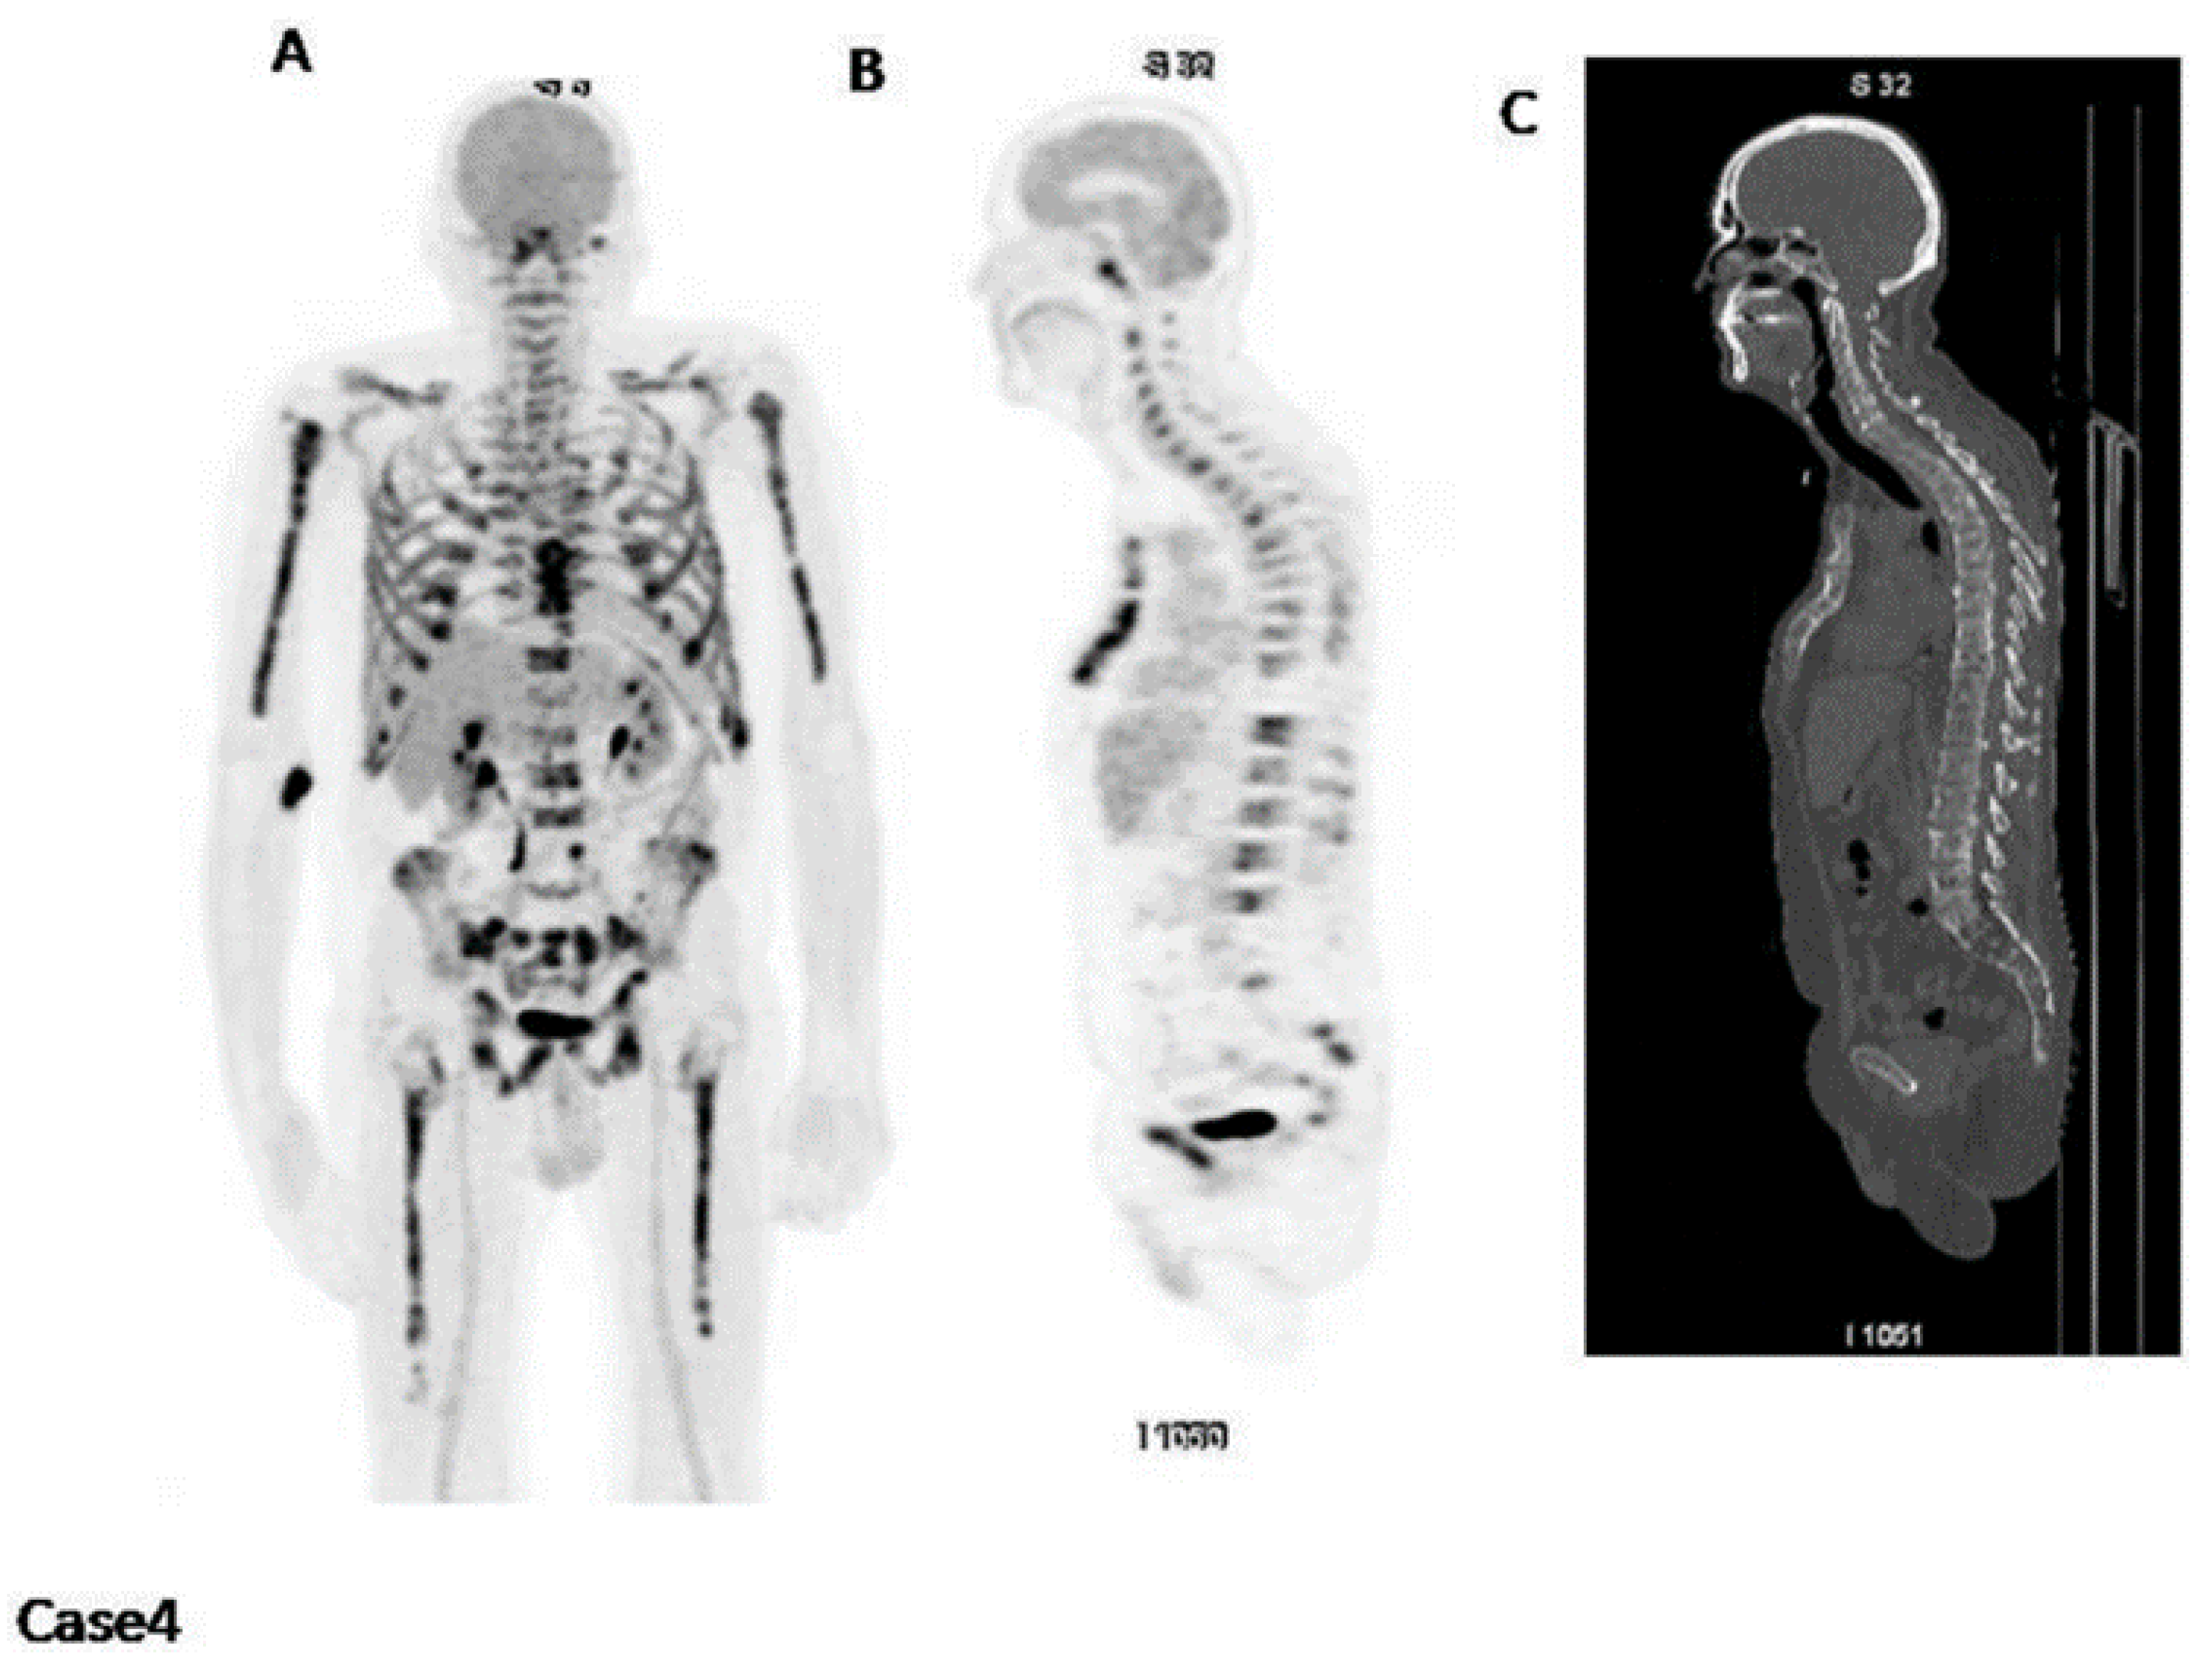
7. Assessment of Pathologic Fractures

Fractures, which impact 60–80% of myeloma patients, represent a notable adverse consequence of myeloma bone disease. While [18F]FDG can reveal fractures to a certain degree, numerous studies have demonstrated that a bone-seeking PET radiotracer, 18F-sodium fluoride (Na[18F]F), is more effective for this specific purpose [38] (Figure 7). On the other hand, most comparative studies showed that [18F]FDG is superior to Na[18F]F in identifying osteolytic lesions [38] (Figure 3). This outcome is anticipated due to the fact that Na[18F]F reflects osteoblastic activity, whereas localized myeloma lesions predominantly involve heightened osteoclast activity [38].
In a research conducted by Ak et al. [39], even though there were certain limitations to the ability of Na[18F]F PET to identify osteolytic lesions, this radiotracer managed to identify 135 bone lesions, encompassing rib fractures and other anomalies linked to degenerative alterations. Hence, the researchers concluded that Na[18F]F PET/CT might offer a complementary function in identifying fractures linked to myeloma [39]. In another study conducted by Sachpekidis et al., the Na[18F]F PET/CT scan revealed only 135 lesions indicative of MM, whereas the whole-body [18F]FDG PET/CT scan depicted a total of 343 focal lesions [40]. Nonetheless, Na[18F]F PET/CT revealed indications of degenerative processes associated with trauma [40].

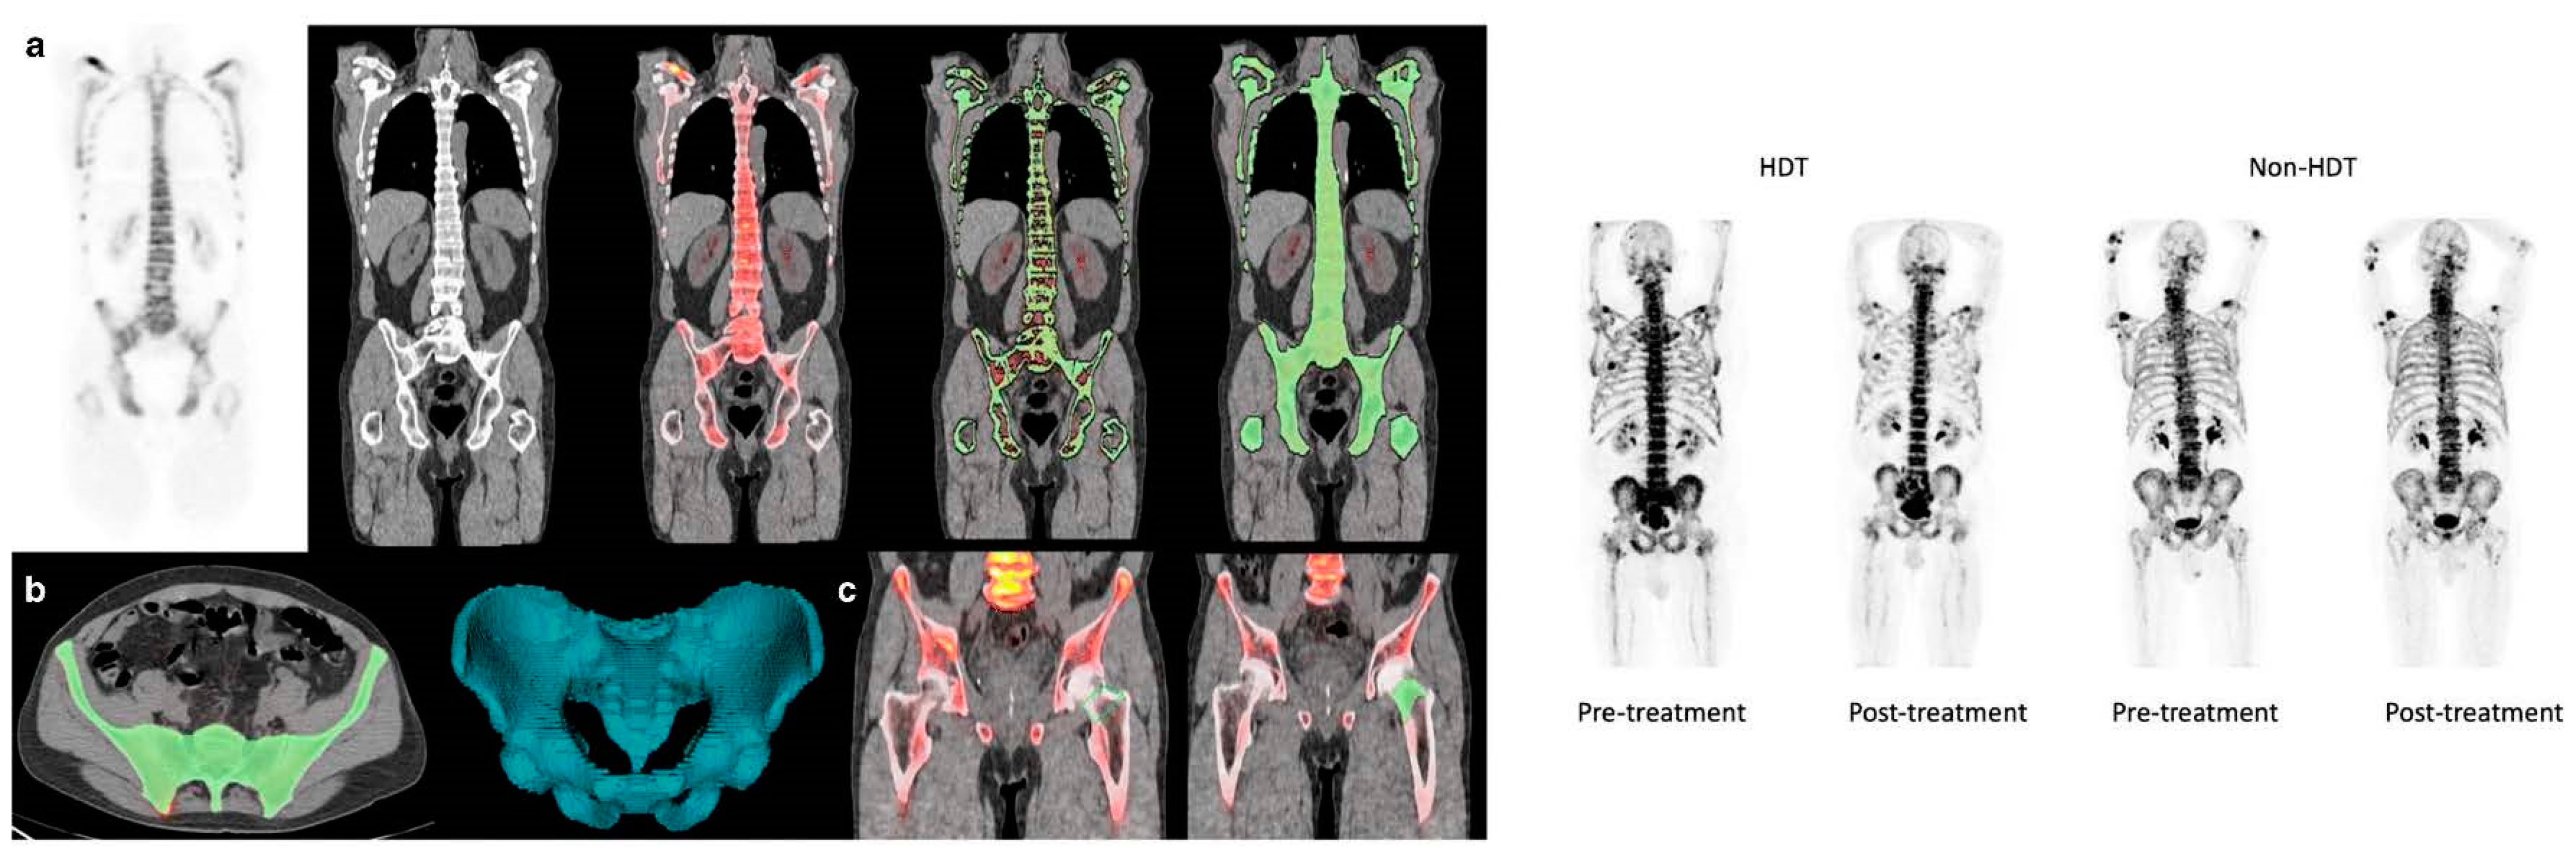
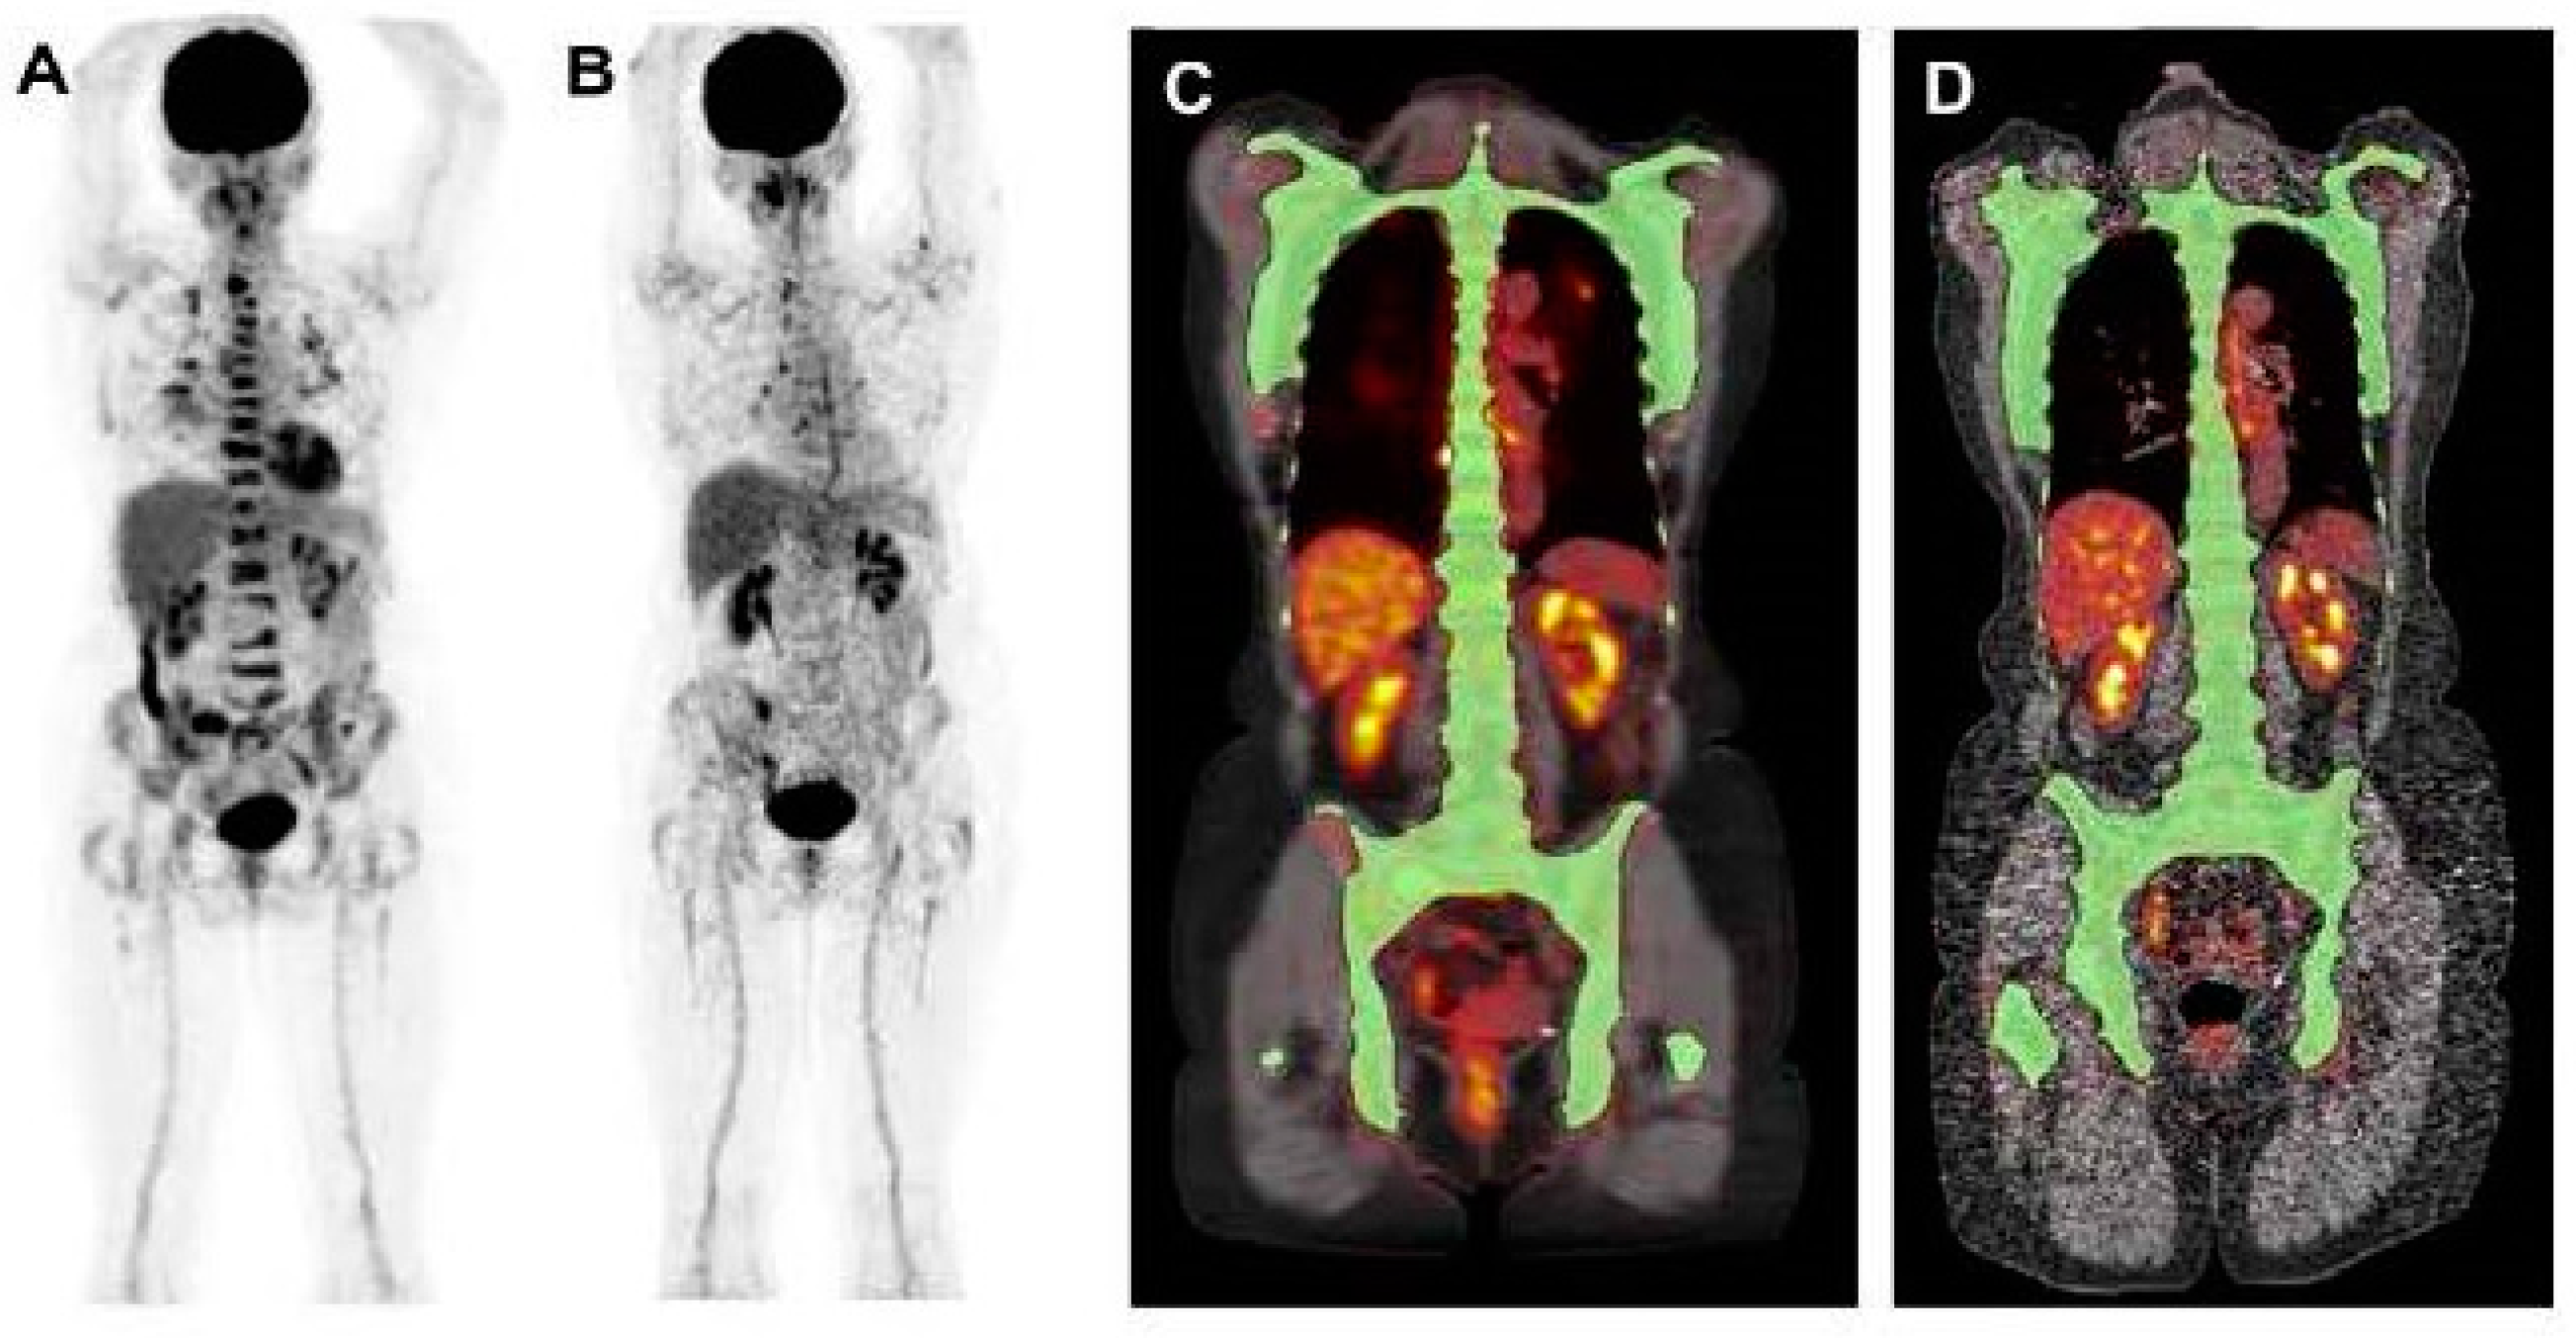
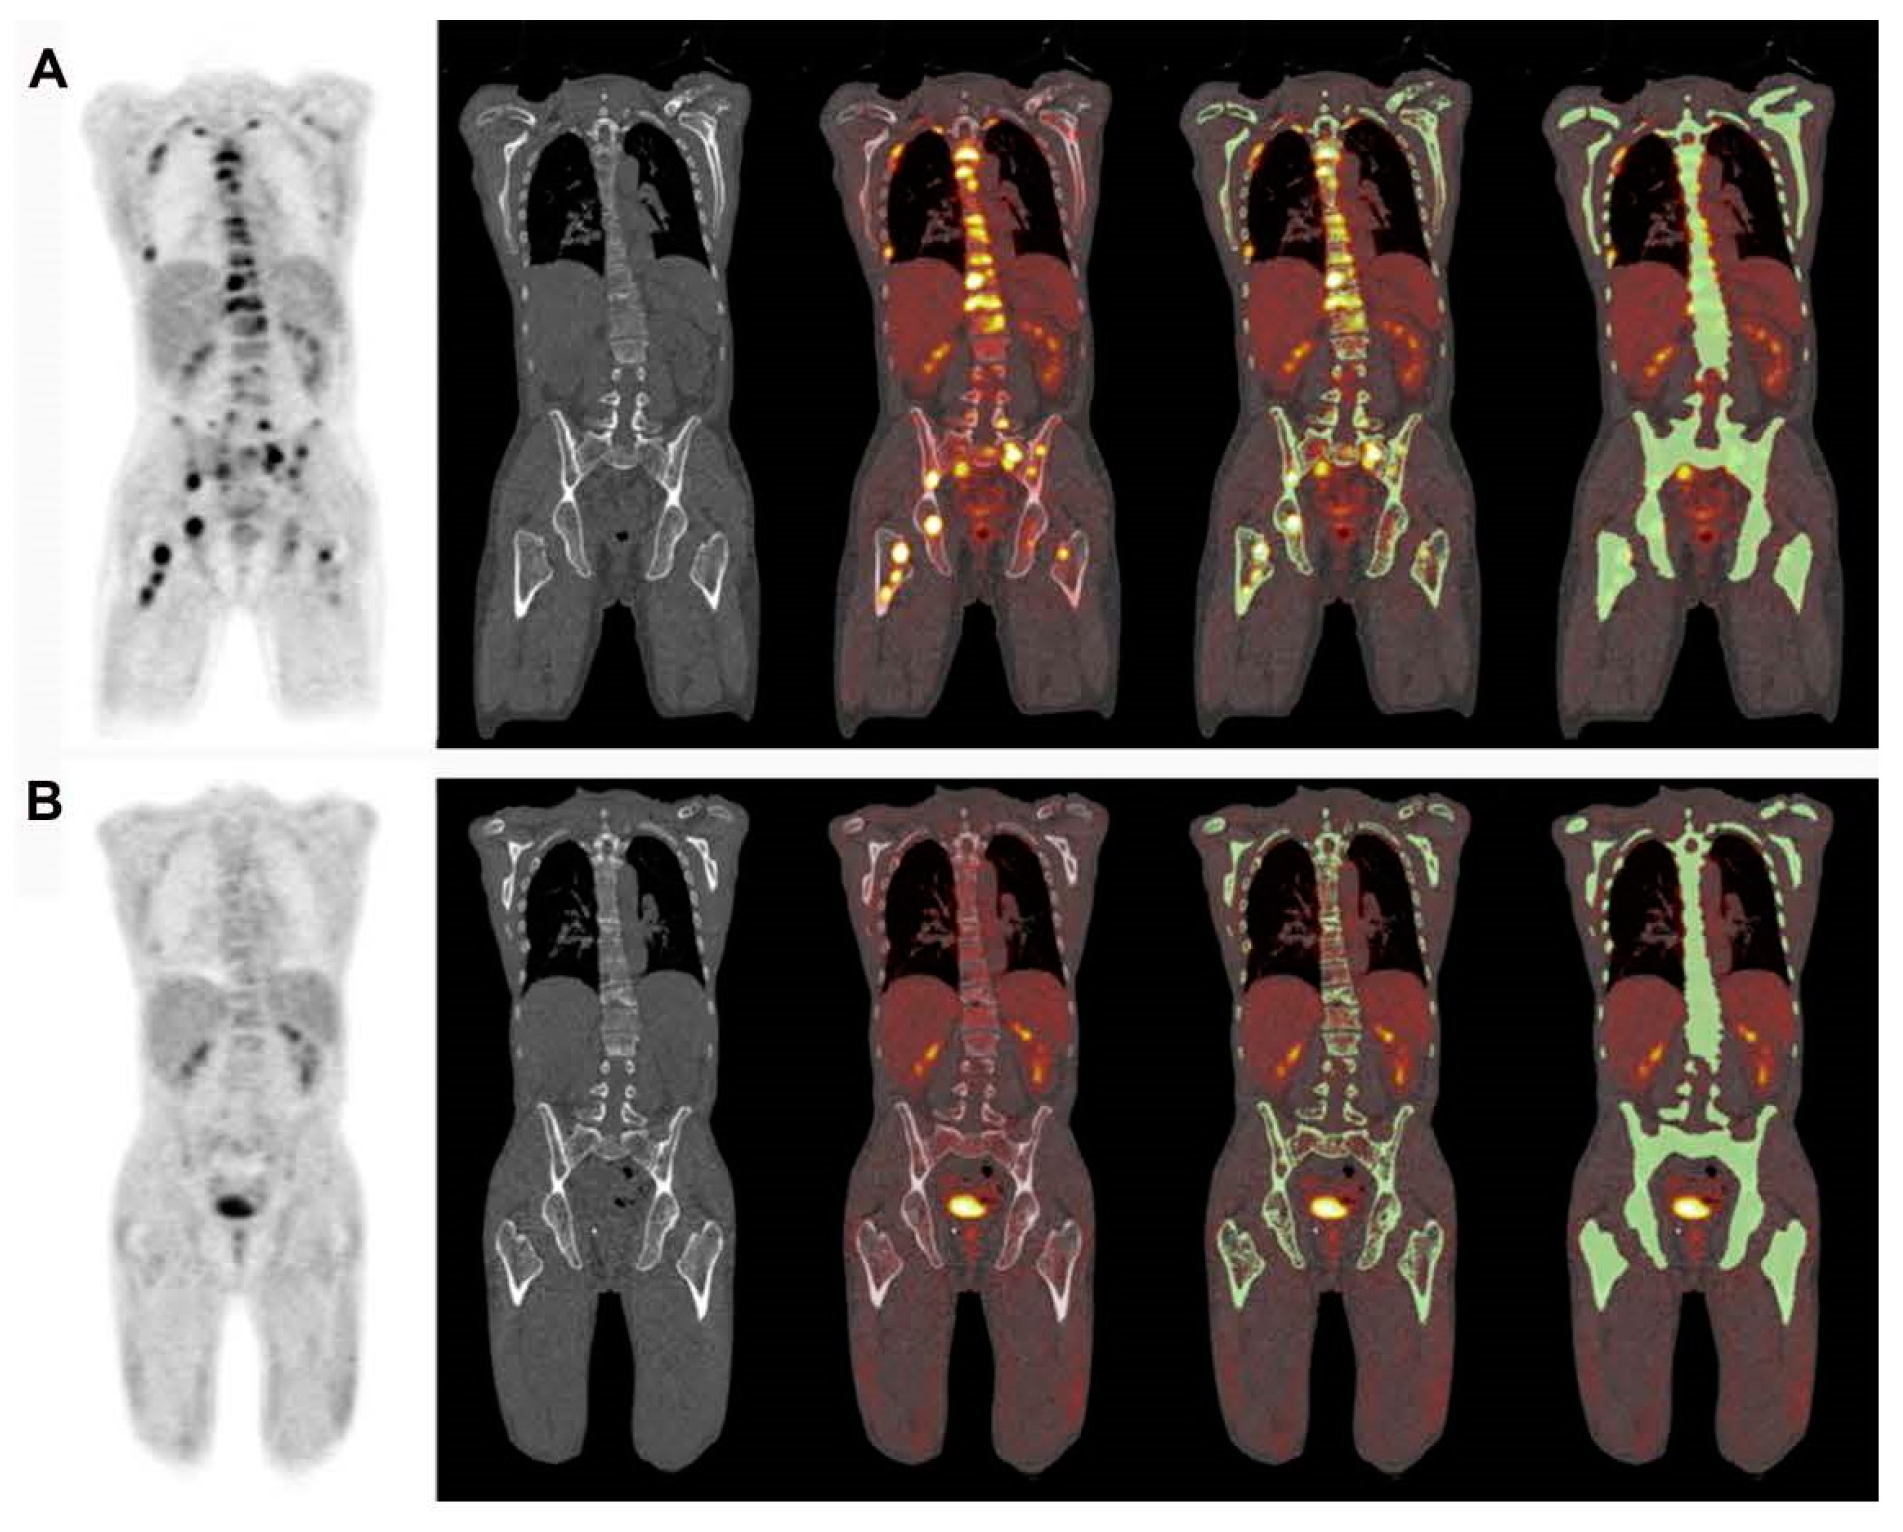
8. PET for Assessment of Bone Turnover in Myeloma Patients
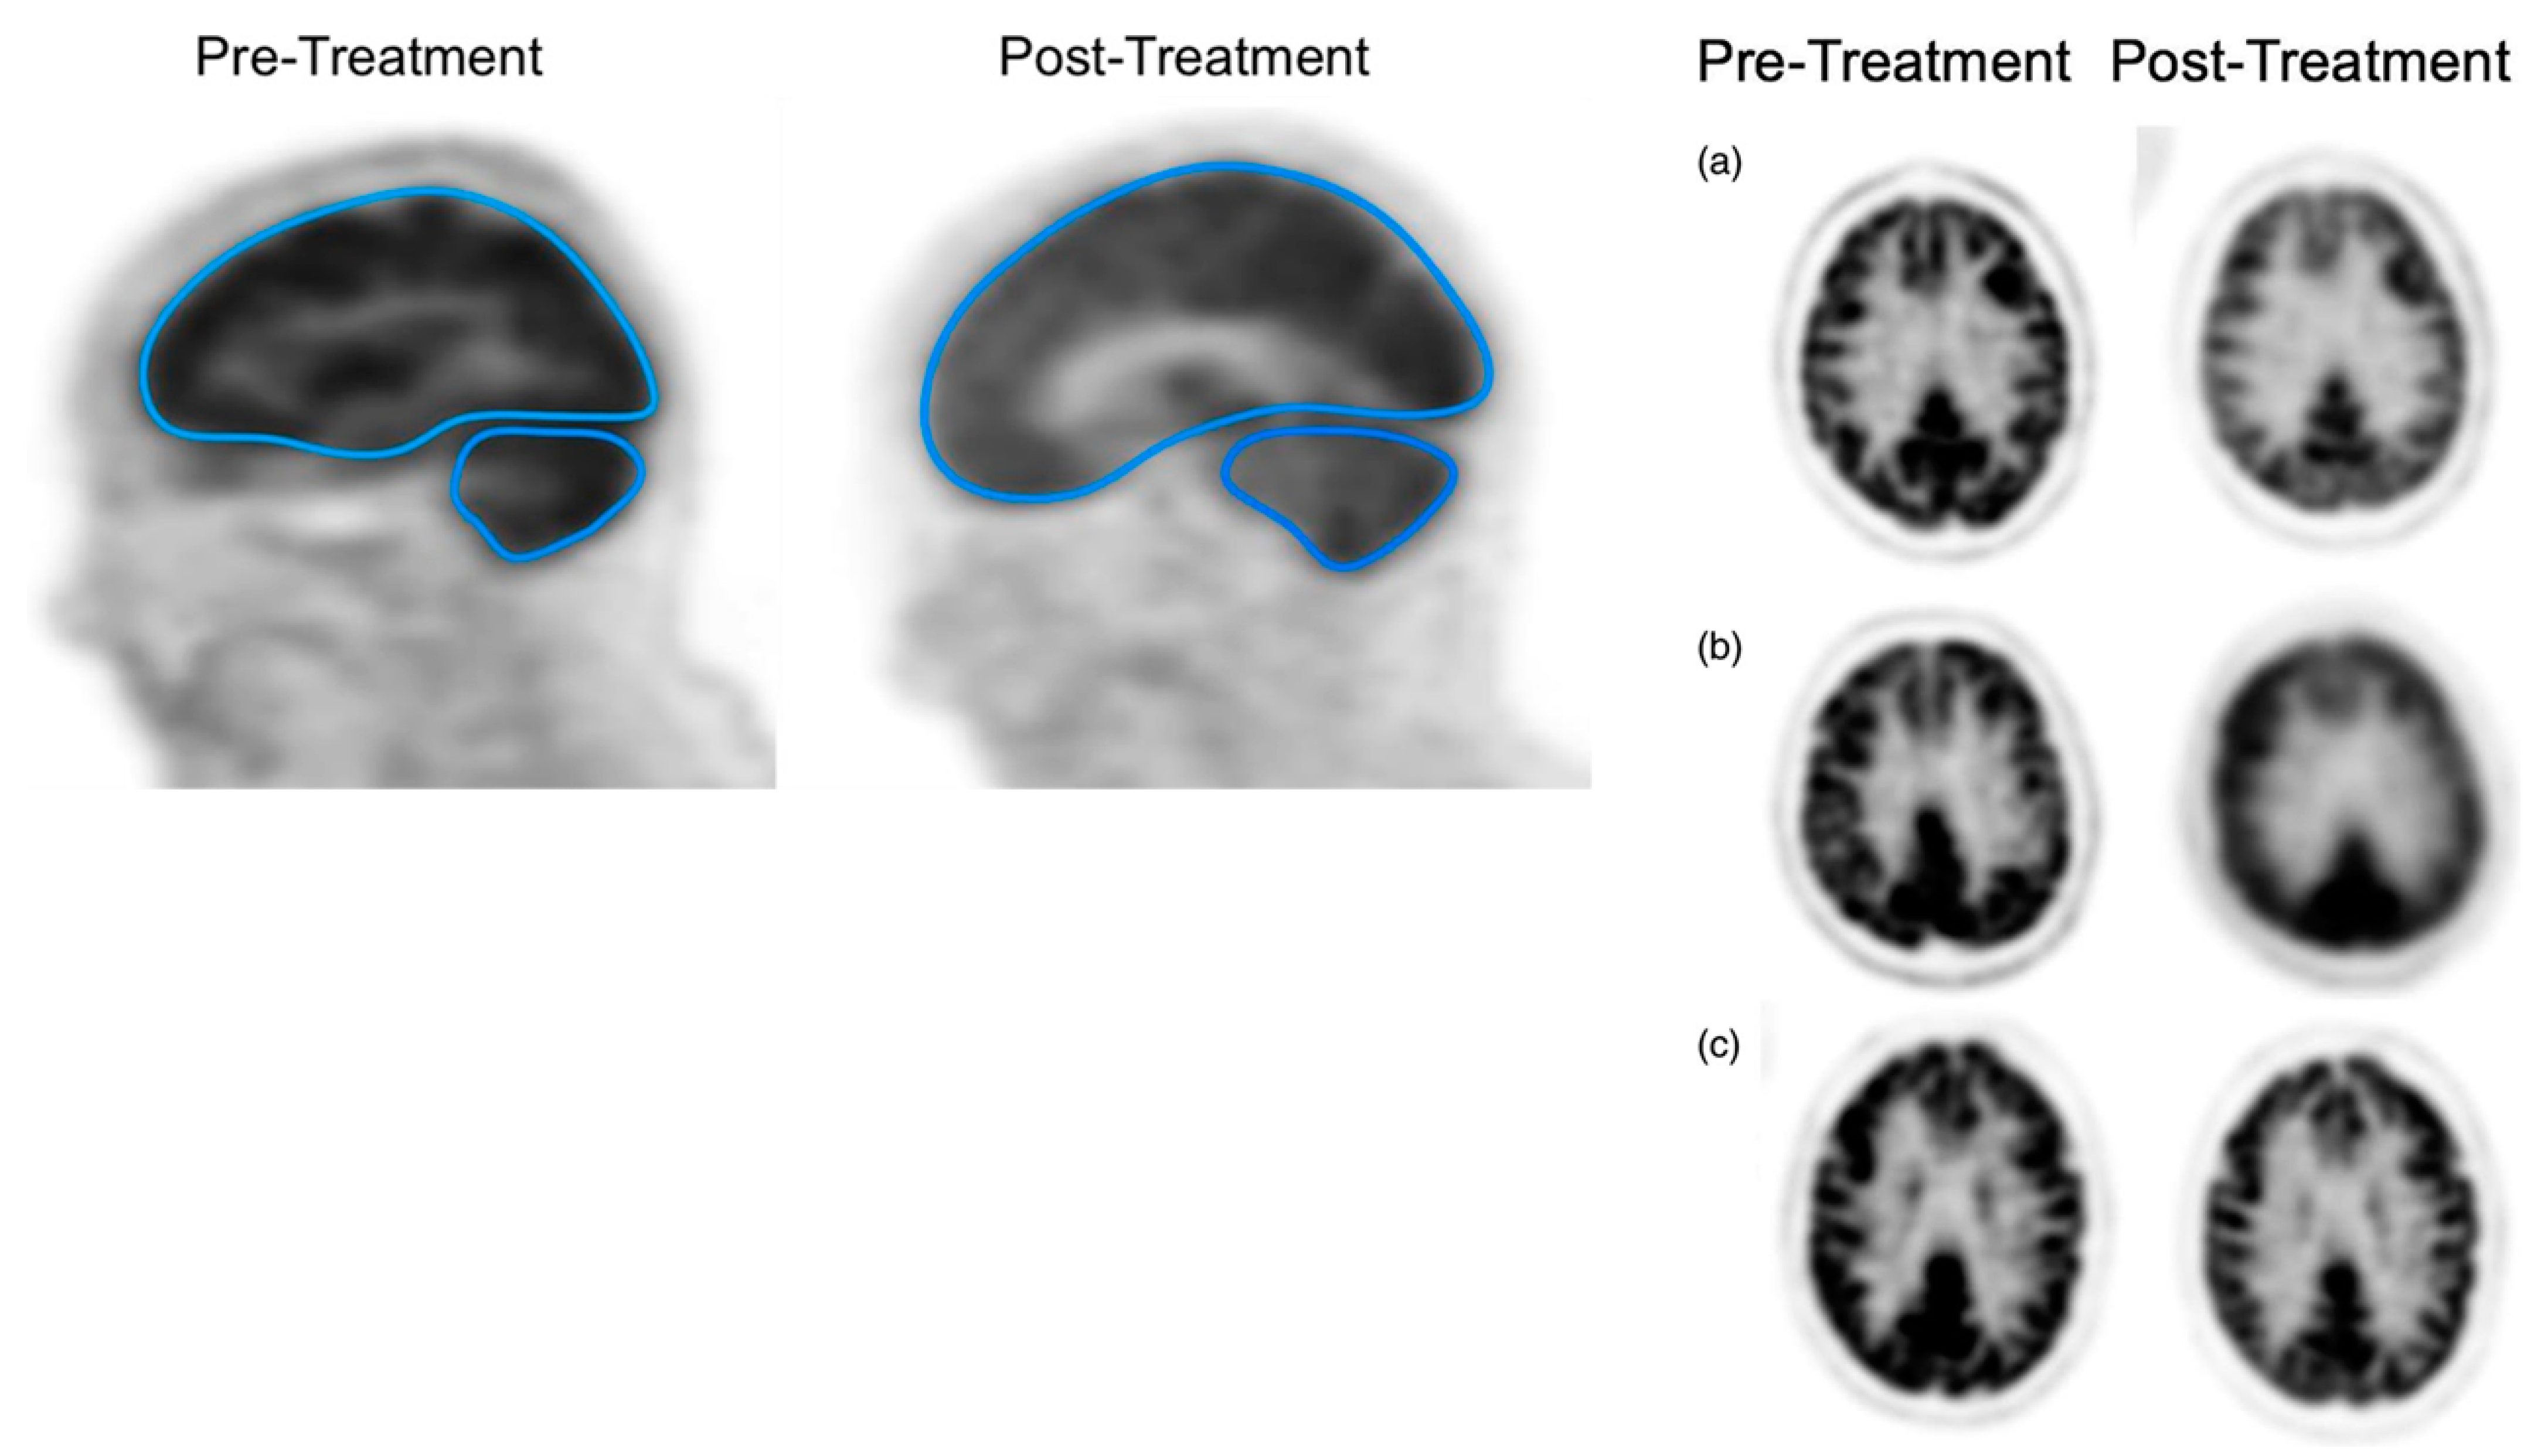
The presence of fluoride in Na[18F]F serves as a direct marker of osteoblastic activity, as it is specifically incorporated into newly formed bone mineral sites that are exposed [41]. Consequently, Na[18F]F PET can be utilized to evaluate bone turnover in different medical conditions. Zirakchian Zadeh et al. investigated the effects of high-dose therapy (HDT) and conventional-dose chemotherapy on the uptake of Na[18F]F in myeloma patients [42]. In total, 19 patients with MM who received HDT and an additional 11 MM patients who received chemotherapy at standard doses were included in the study (Figure 8) [42]. Following HDT, myeloma patients exhibited a noticeable decrease in Na[18F]F uptake in various areas, including the overall skeleton, pelvis, entire femoral neck, and lateral femoral neck. Conversely, in the non-HDT group, no significant alterations were observed (Figure 8) [42]. As a result, the authors inferred that Na[18F]F holds potential for evaluating bone loss in myeloma patients after HDT [42].

9. Chemo Brain

The existing literature indicates that a vast majority of commonly employed chemotherapeutic medications have the potential to induce adverse neurological reactions [43]. Cancer-related cognitive impairment (CRCI), encompassing problems such as cognitive decline, memory challenges, and difficulties with concentration, is a common complication observed in individuals undergoing systemic chemotherapy [44,45]. Research investigations have linked high-dose chemotherapy (HDC) to alterations in brain structure, such as decreased regional brain volume, degeneration of gray matter, and demyelination of white matter [46]. Examining CRCI, also known as chemo brain, has until recently been limited to research using clinical neuropsychological methods designed to detect localized brain lesions [46]. However, [18F]FDG is capable of detecting alterations in brain activity post-treatment, as it visualizes and quantifies changes in glucose metabolism [46].
In a recent study, the aim was to compare the effects of treatment—specifically, conventional standard-dose chemotherapy (CDC) versus HDC followed by autologous stem cell transplantation (HDC/ASCT)—on the overall brain glucose metabolism of MM patients [46]. The researchers employed a comprehensive brain [18F]FDG PET measurement approach for this purpose, providing an evaluation of changes in 18FDG metabolism throughout the whole brain (Figure 9) [46]. After treatment, a notable reduction in the GSUVmean (global standardized uptake value mean) was observed in the supratentorial brain and cerebellum of patients who underwent HDC/ASCT (p-values < 0.05) (Figure 9) [46]. Conversely, there were no statistically significant GSUVmean changes after treatment in patients who received CDC (Figure 9). The scientists concluded that a significant decrease in [18F]FDG uptake in the brain after treatment was only observed in patients who received HDC/ASCT [46]. This observation might suggest a tendency for chemo brain to be more prevalent in cases involving HDT [46].

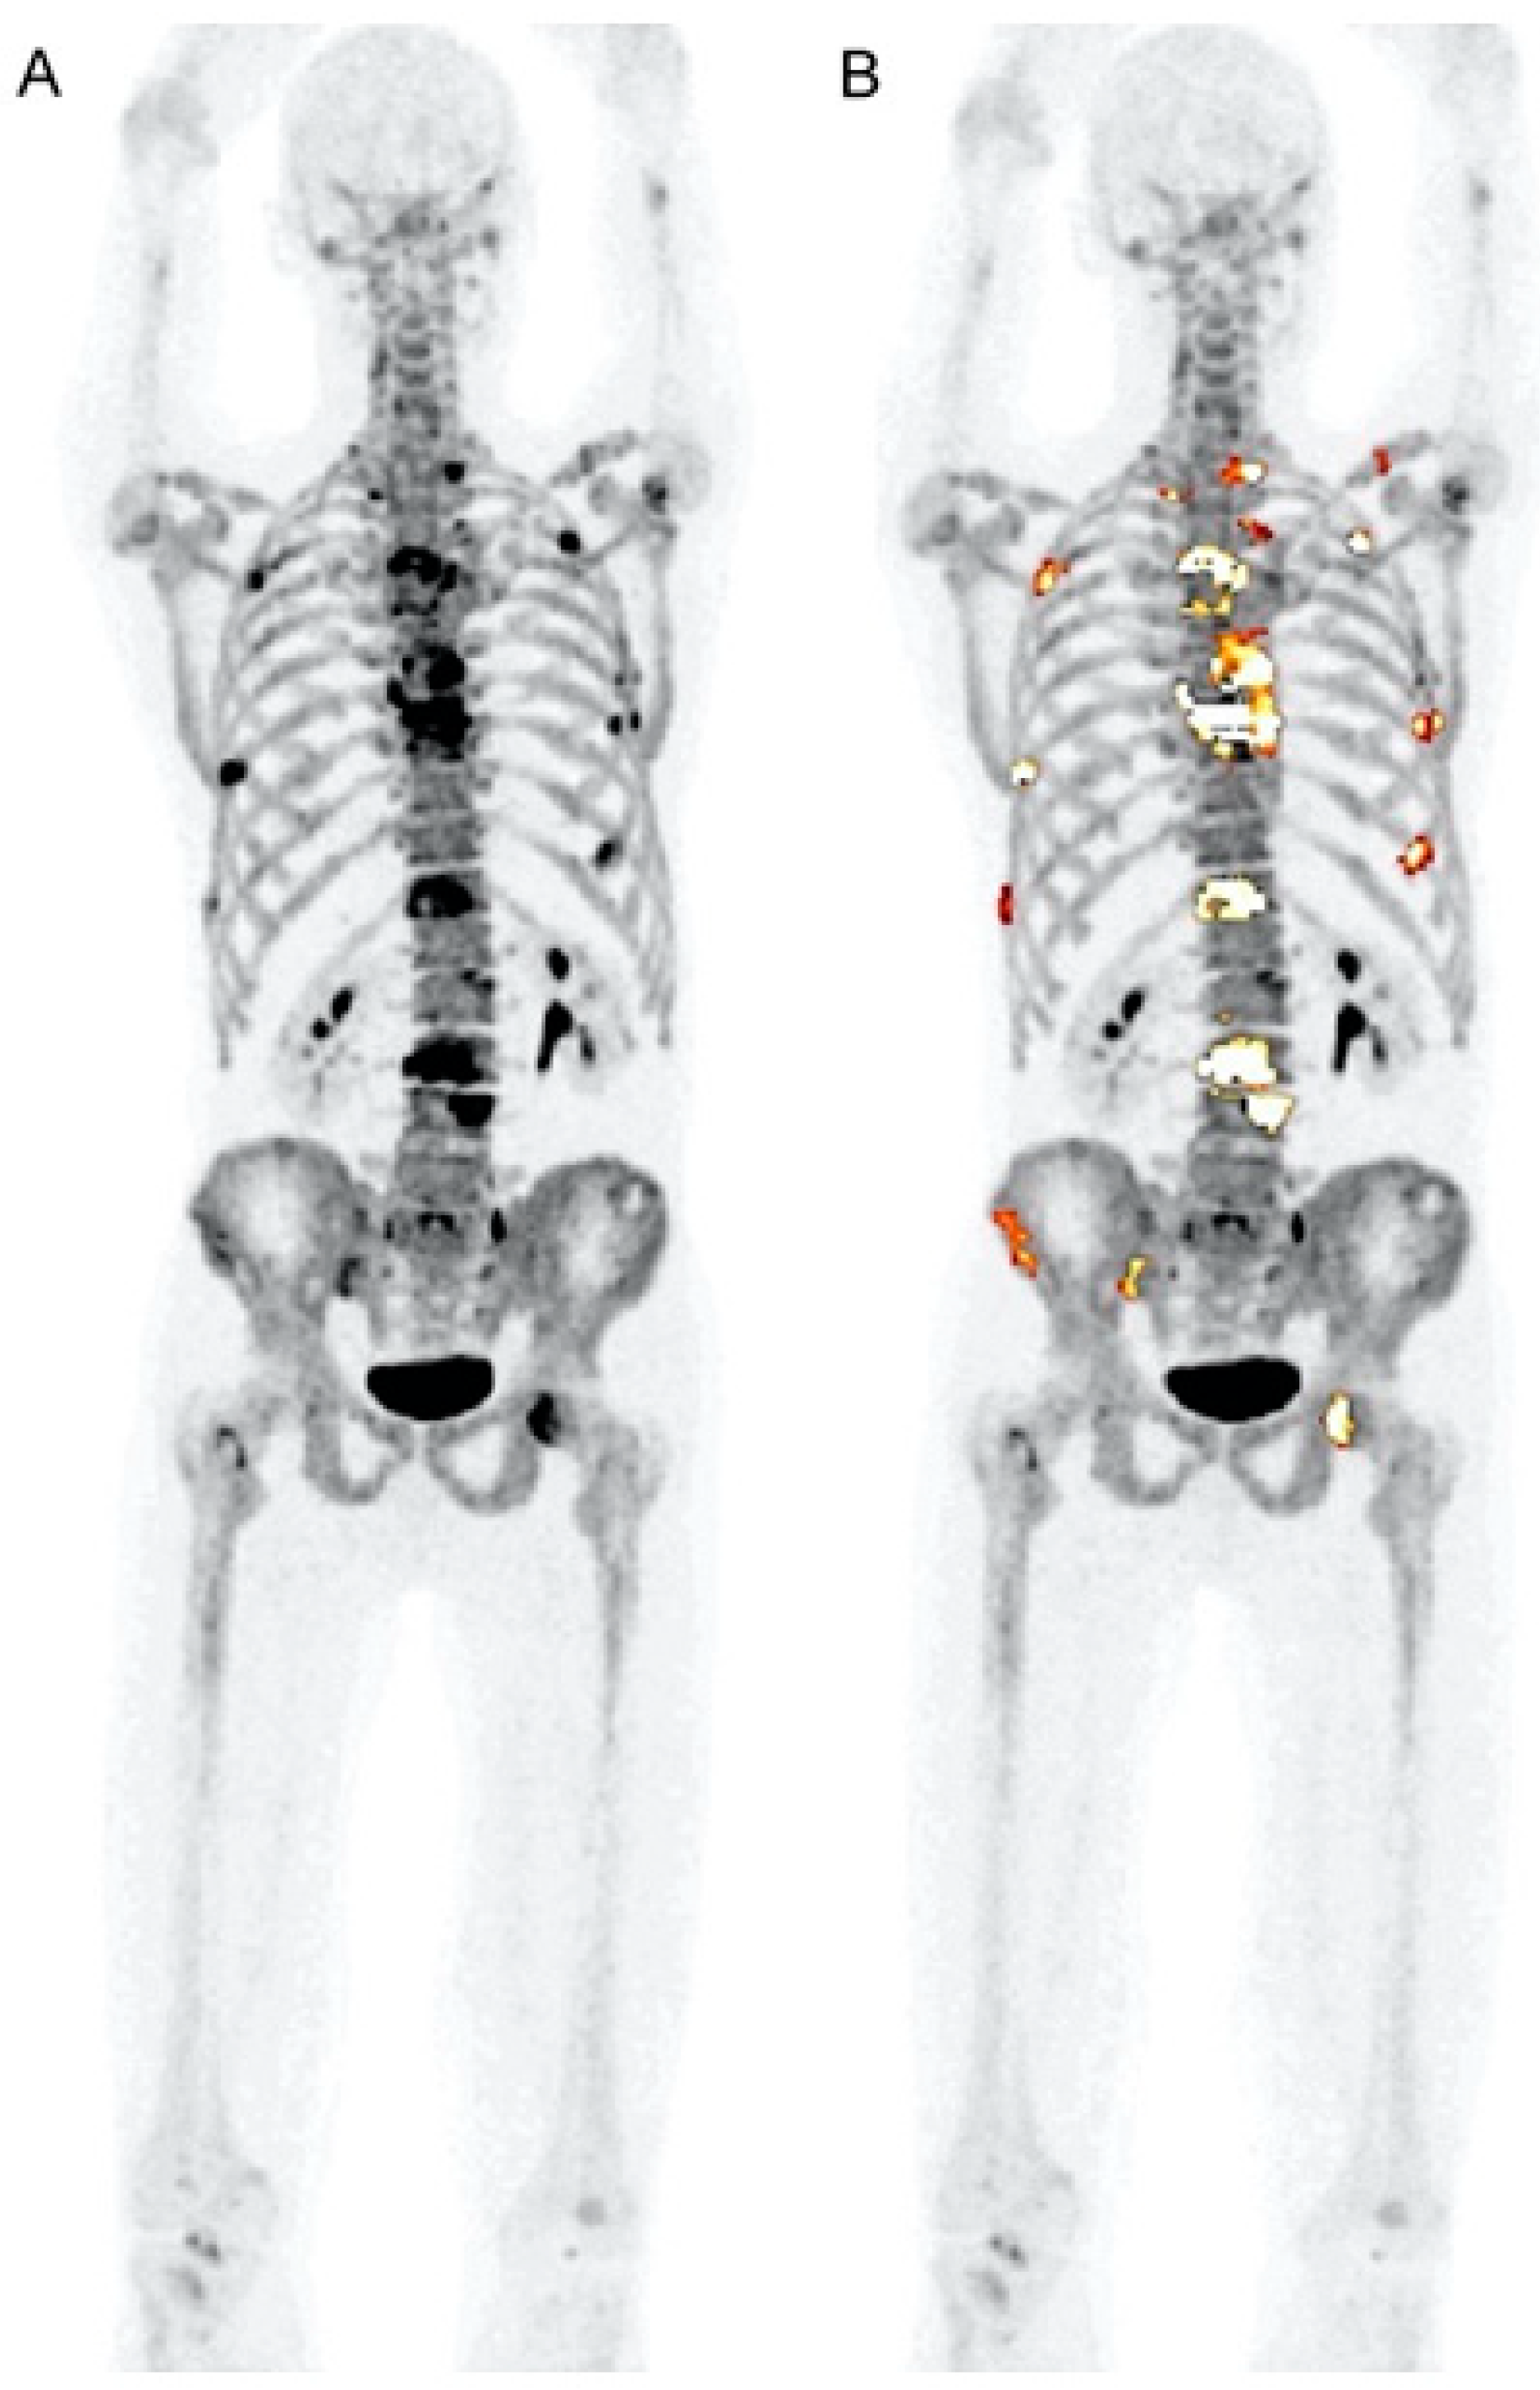
10. [18F]FDG PET Quantification

Qualitative PET image analysis requires visual detection of lesions that exhibit [18F]FDG avidity, whereas standardized uptake values (SUV) are employed in semi-quantitative analysis to measure the extent of [18F]FDG uptake [47]. Lesion-based techniques were largely used in earlier studies to assess the overall illness and therapy response in myeloma patients [23]. The maximum standardized uptake value (SUVmax), the main quantitative measure obtained from PET, has been the main metric used for this goal [8]. However, SUVmax captures uptake in a single voxel within a specific lesion, which makes it less comprehensive in representing the overall uptake [48]. Moreover, as SUVmax quantifies uptake in a confined area, it is more susceptible to alterations caused by factors like noise and motion [49]. McDonald et al. [50] introduced a model that aggregates [18F]FDG avidity from focal lesions into a unified value termed the total lesion glycolysis score. The presence of numerous osteolytic lesions can pose challenges to the utilization of the aforementioned methods in patients with myeloma [23,49]. Moreover, the individual assessment of minor osteolytic or malignant lesions is complicated due to the partial volume effect (PVE), which leads to a reduction in the estimation of focal lesion uptake and necessitates correction to obtain precise values [23,49]. Whereas imaging techniques such as CT and MRI possess spatial resolutions under one millimeter, the spatial resolution of PET is between 8 and 10 mm [49]. The restricted spatial resolution presents a significant hurdle in the interpretation and measurement of PET results [49].
Certain research teams have recently proposed using CT-based segmentation to analyze the uptake of radiotracers in the bone marrow and the overall bone structure of myeloma patients as an alternative to concentrating solely on specific osteolytic lesions [23] (Figure 10 and Figure 11). These approaches have demonstrated a high level of reproducibility [23] (Table 1). However, the clinical significance of these methods still needs to be investigated further [23]. This method has recently been used by the Penn–Odense group to assess the uptake of [18F]FDG in the context of dual-time-point imaging (Figure 12) [35]. Pre-treatment [18F]FDG PET/CT scans from 36 patients with MM were collected [35]. These scans were conducted at 1 and 3 h after the injection of the tracer. A segmentation and quantification of whole-bone marrow (WBM) [18F]FDG uptake was performed using a threshold algorithm utilizing Hounsfield units obtained from CT data [35]. The patients were split into two treatment groups: one received non-HDT, and the other received HDT with ASCT. The international response criteria were utilized to assess the treatment outcomes for each multiple myeloma patient. In the group that underwent HDT, there was a notable increase in WBM [18F]FDG uptake among patients who responded poorly to treatment (Figure 12) [35]. The median value escalated from 1.31 (with an interquartile range, IQR, of 1.13–1.64) after one hour to 1.85 (IQR: 1.45–2.10) at the three-hour mark, illustrating this increase [35]. The calculated median percentage alteration ranged from 6.10% to 50.73% (IQR: 23.47–46.4; p = 0.003). In contrast, there was no apparent change in uptake for patients exhibiting a complete response (p = 0.24) (Figure 12). A similar pattern was observed in the non-HDT group [35].

11. Italian Myeloma Criteria for Pet Use: IMPeTUs

A team of Italian researchers has proposed an extensive set of PET criteria, IMPeTUs, for evaluating myeloma (Figure 13) [51]. The ambit of the IMPeTUs approach encompasses the assessment of the intensity of osteolytic bone disease and the quantification of metabolic activity within the bone marrow, extramedullary regions, and paramedullary areas (Figure 13) [51]. Moreover, this method includes the ranking of the top three significant focal lesions in the body. IMPeTUs appears to cover essential and separate risk factors in myeloma [51]. However, the detection of these aspects visually is dependent on the observer’s proficiency and expertise [49]. The lack of substantial experience among junior radiologists and nuclear medicine physicians could potentially undermine the repeatability and consistency of this approach [49]. Despite this obstacle, the authors were able to show a positive consensus in the interpretation of results, with a minimum rate of 75% for bone marrow (BM), 76% for the focal score, 95% for extramedullary disease, 76% for the tally of focal lesions, 77% for the number of lytic lesions, and 92% for the detection of fractures [51].

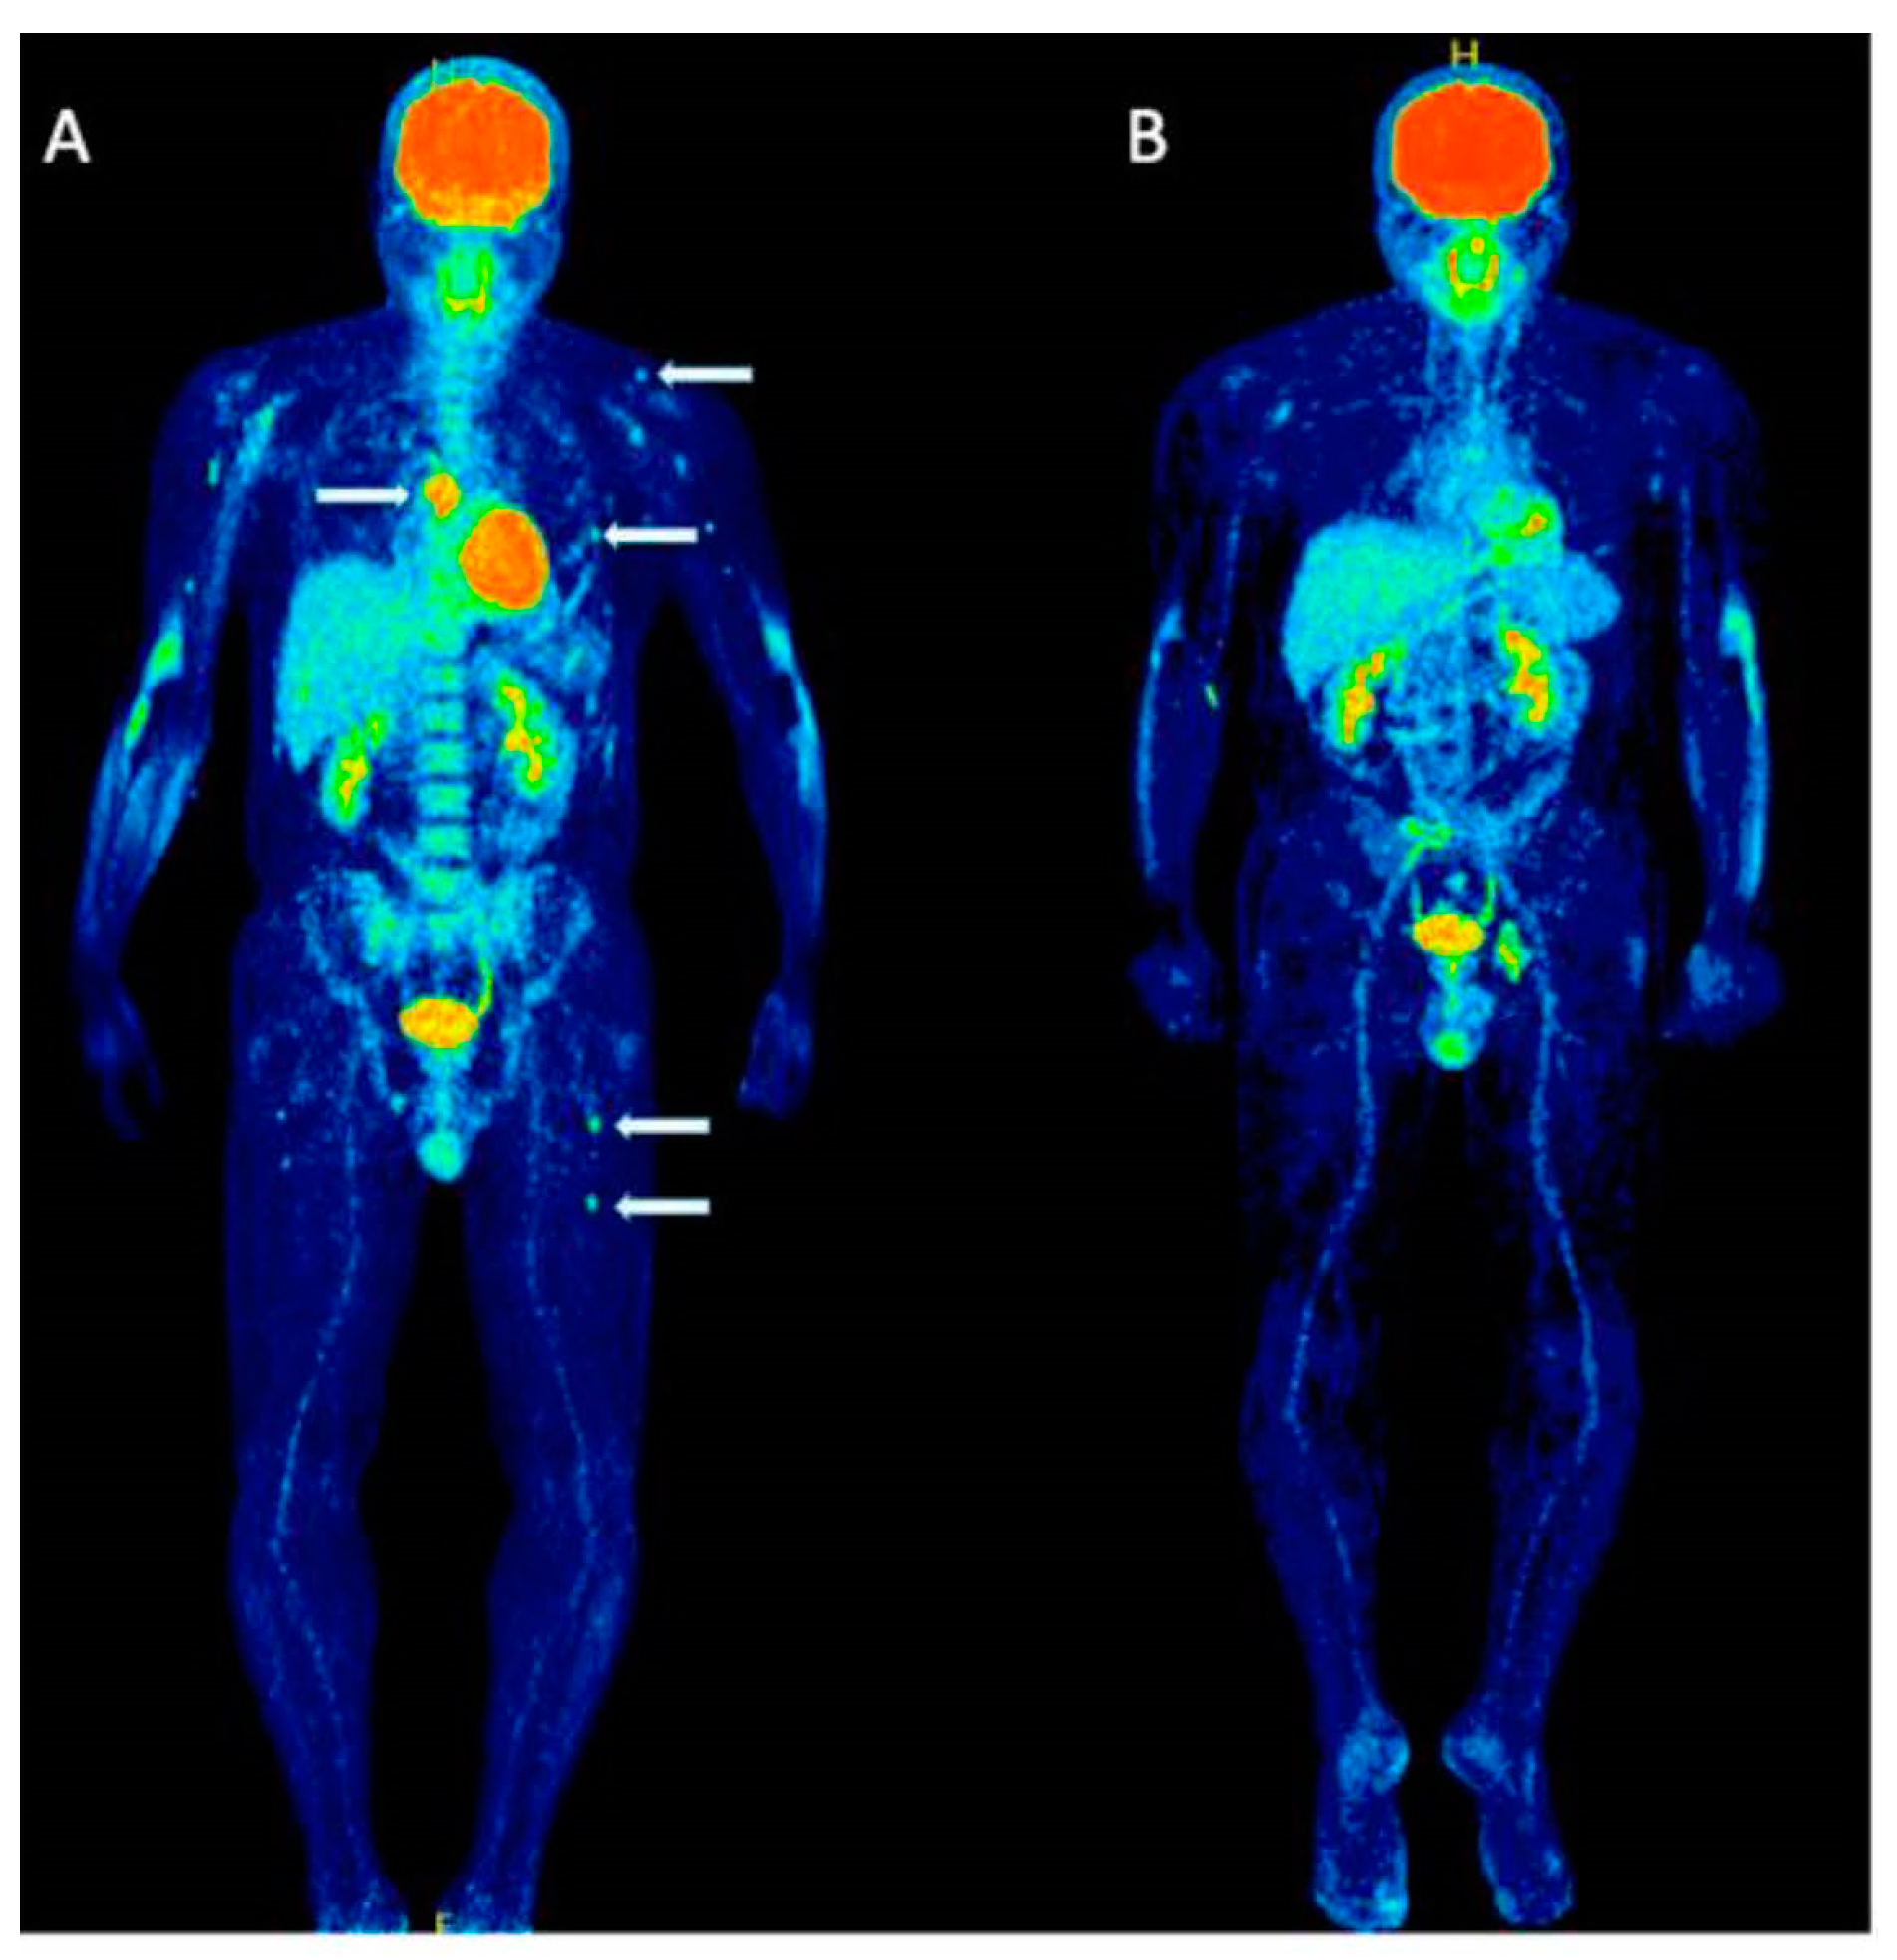
12. Novel PET Radiotracers

The studies are summarized in Table 2. Figure 14 illustrates the use of [68Ga]Pentixafor PET in the evaluation of myeloma.
Table 2. Novel PET radiotracers in assessment of multiple myeloma.
ExamplesWhy?Outcome
Amino Acid Radiotracers[11C]methionine
18F-fluoroethyl-
tyrosine ([18F]FET)
fluciclovine F18 ([18F]-FACBC)
Amino acid tracers are a promising biomarker in MM due to their likely absorption via the mechanism responsible for generating immunoglobulins in myeloma cells [53].In general, amino acid radiotracers have demonstrated equal or superior efficacy in evaluating patients with myeloma compared to [18F]FDG. However, the relative uptake of [18F]FET has been shown to be significantly lower in cell line data when compared to [11C]methionine and [18F]FDG. The latter two outperform [18F]FET by 7 to 20-fold and 3.5 to 5-fold, respectively [54].
Lipid Radiotracers[11C]choline, and [18F]fluorocholine ([18F]FCH)Choline is an essential nutrient necessary for all cells due to its role in the creation of phospholipid components that form cell membranes [55]. Several radiotracers have been synthesized for choline imaging, including [11C]choline, and [18F]fluorocholine ([18F]FCH).All of these radiotracers have been demonstrated to be superior or at least equivalent to [18F]FDG for the evaluation of MM.
CXCR4-targeting Radiotracers[68Ga]PentixaforMany oncology studies have recognized C-X-C motif chemokine receptor 4 (CXCR4) as a potential target and an integral part of cancer progression, including aspects such as angiogenesis or other involvement leading to resistance to therapy [56,57]. An important observation from ex vivo research is the broad spectrum of solid tumors and hematological malignancies that increase the expression of CXCR4 on the tumor cell surface. This makes this G-protein coupled receptor an attractive target for both imaging and therapy [57].The majority of studies to date have indicated that [68Ga]Pentixafor PET/CT is equal to or superior to [18F]FDG in detecting osteolytic lesions and managing patients with MM.
Immuno-PET Radiotracers[89Zr] DFO-daratumumab
[89Zr]DFO-YS5 (anti-CD46 PET radiopharmaceutical)
Immuno-PET could set a new treatment standard for MM patients by merging the specificity of a radiolabeled monoclonal antibody with the high sensitivity of PET [58]. The transmembrane glycoprotein CD38, which is the specific target of the immunotherapy drug daratumumab, is present in all myeloma cells [59,60].Thus far, most of the outcomes have been shown to be superior or at least equivalent to those achieved with [18F]FDG PET/CT.
Proliferative PET Radiotracer3′-Deoxy-3′-[18F]
fluorothymidine ([18F]FLT)
Researchers have been focusing on studying the uptake of nucleosides as an accurate technique to assess cell growth [61].However, researchers from a recent study disclosed that [18F]FLT alone might not be sufficient as a PET tracer for the diagnosis of MM [62].
FAPI PET: Fibroblast Activation Protein Inhibitor[68Ga]FAPI PETFAPI PET operates by specifically targeting fibroblast activation protein (FAP), a protein that is highly expressed in tumor stromal cells, also known as cancer-associated fibroblasts [63].Superior to [18F]FDG.

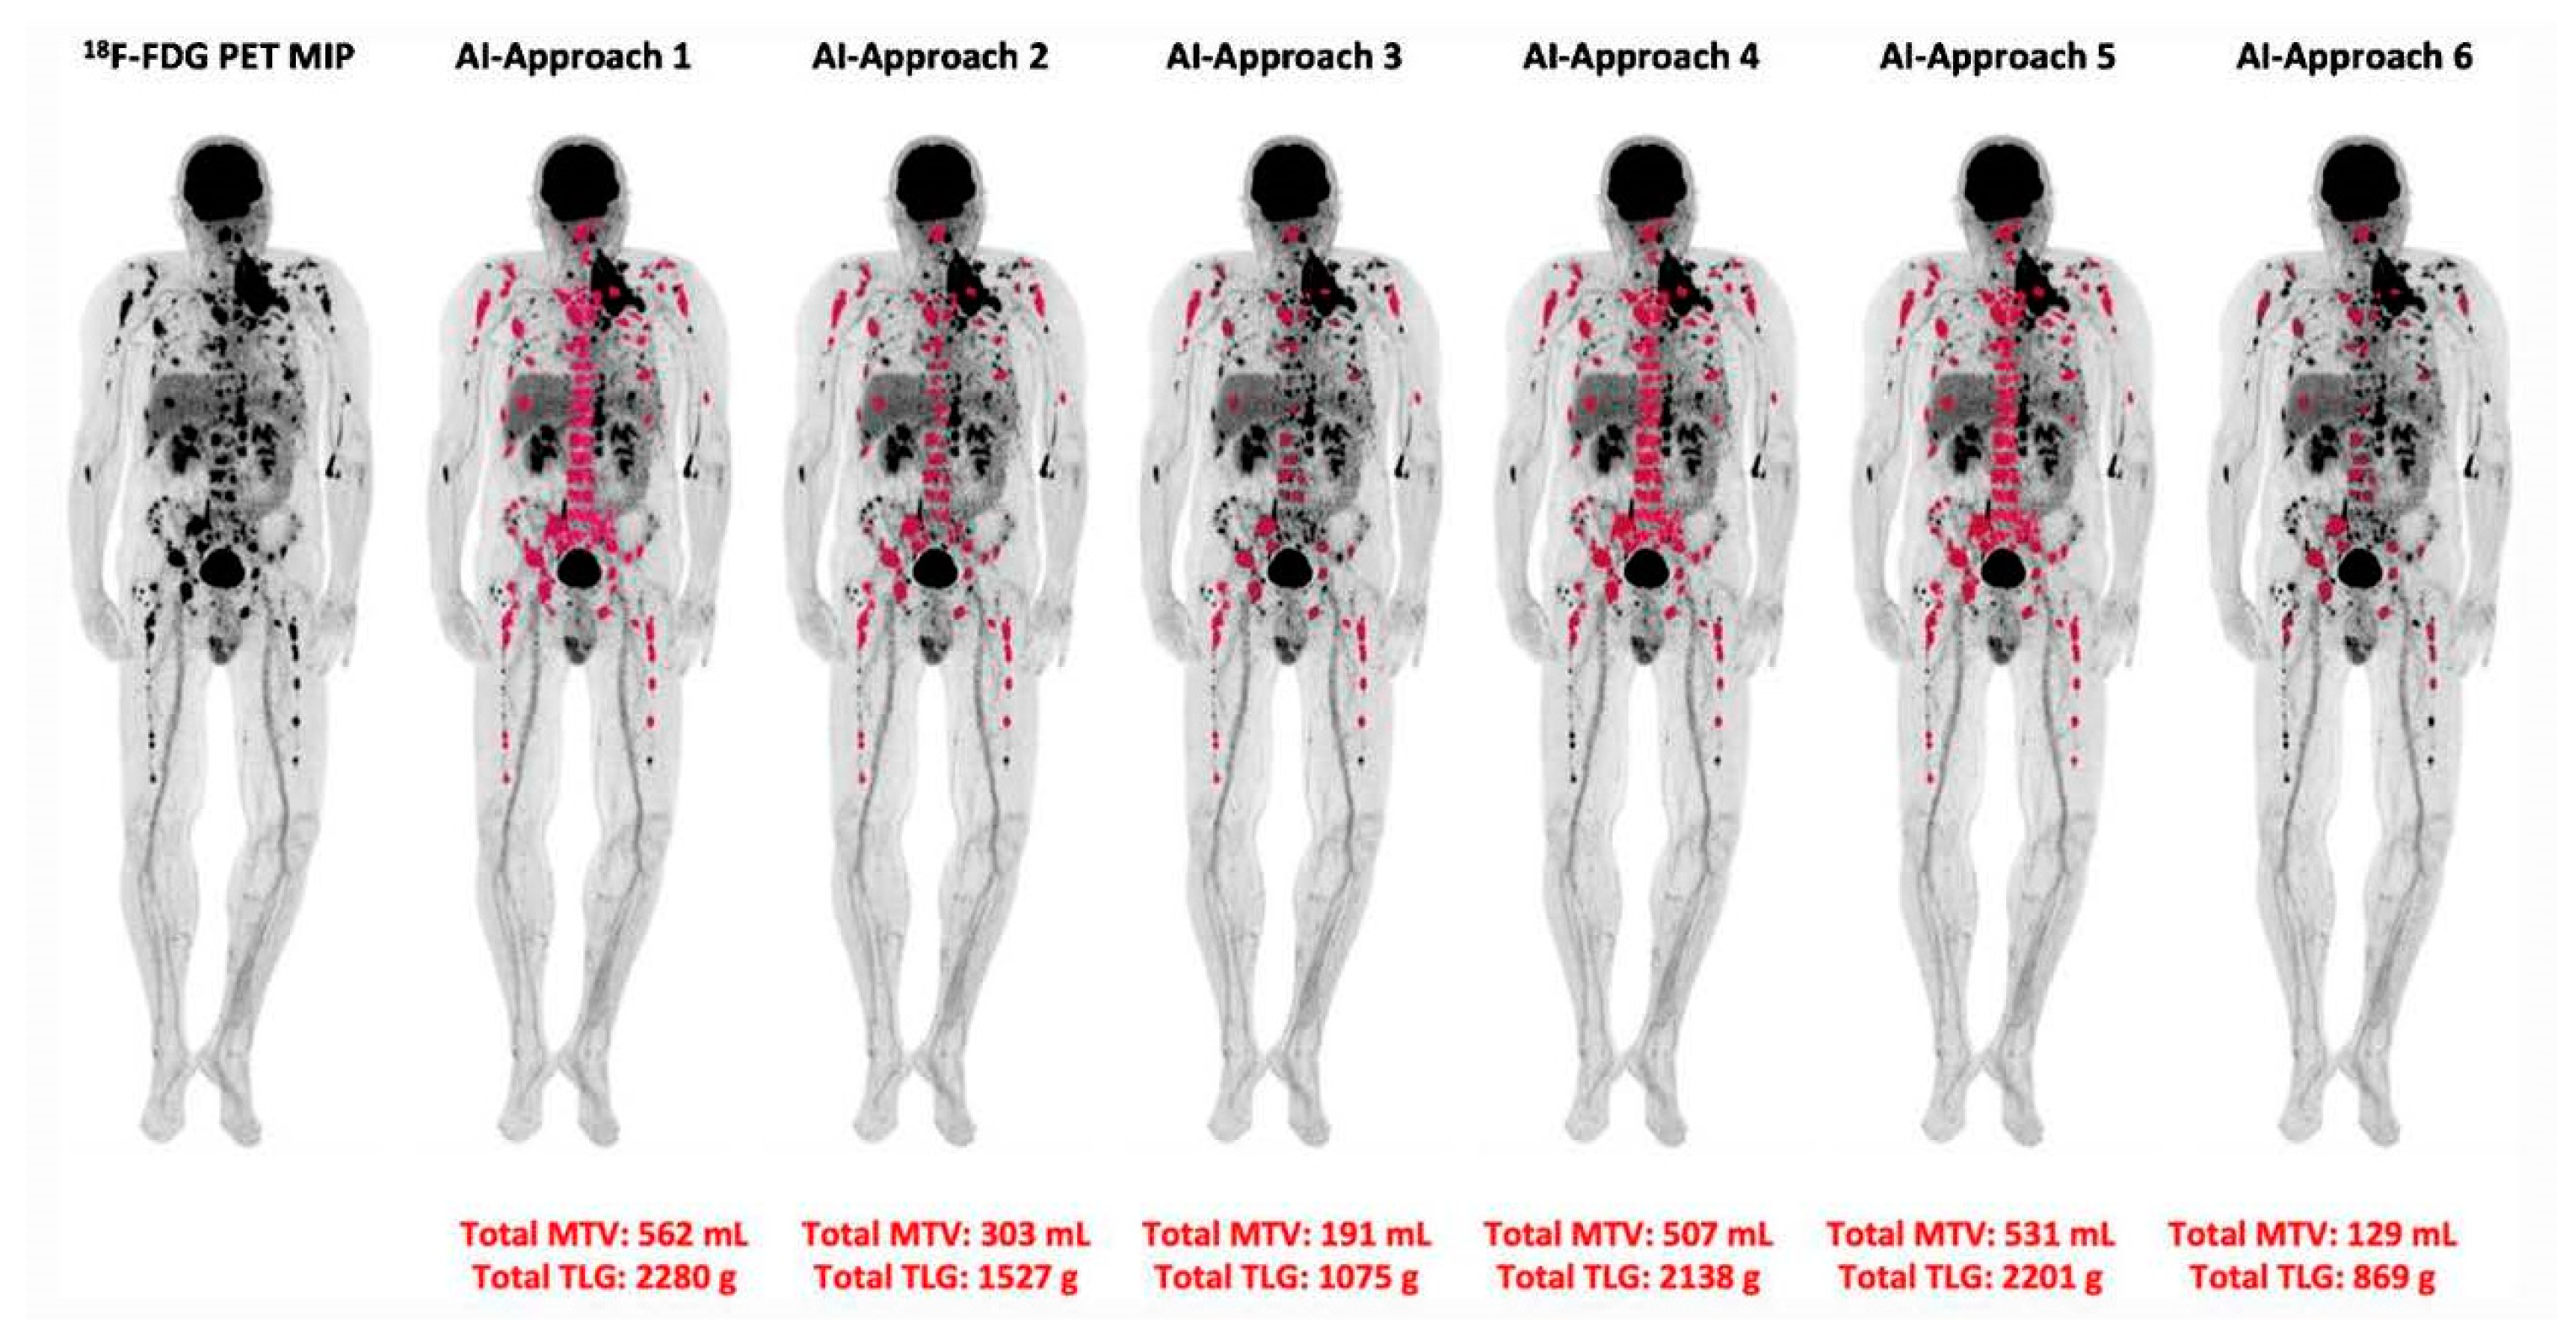
13. AI for PET Quantification

The consistency between different observers when interpreting PET/CT scans could be impacted by the diverse patterns of bone marrow infiltration typical of the disease [65]. To tackle this issue, a group of scientists aimed to validate a new three-dimensional deep learning tool [65]. The proposed automated method for evaluating bone marrow metabolism begins with the segmentation of the skeleton, which is based on CT data (Figure 15) [65]. This segmentation is then implemented on the SUV PET images, followed by the use of specific SUV thresholds [65]. The areas derived from this procedure were subsequently refined through post-processing methods. The deep learning instrument was effectively utilized in all patients for segmenting the bone marrow and computing MTV and TLG (Figure 15) [65]. Notably, there was a substantial positive association (p < 0.05) discovered between the outcomes of the visual PET/CT scan analysis across the three groups of patients and the MTV and TLG measurements secured from all six [18F]FDG uptake thresholds [65]. Additionally, the researchers were able to identify a modest positive relationship between the infiltration of plasma cells into the bone marrow and the levels of plasma β2-microglobulin, in conjunction with the automated quantitative measurements of MTV and TLG derived from the PET/CT scans [65].

14. Atherosclerosis (Limited Data Available)

Cardiovascular disease (CVD) and cancer stand as the top two contributors to global mortality [66]. They have numerous shared risk factors and seem to arise from a similar underlying cause [67,68]. In the first study exploring the role of imaging in assessing atherosclerosis in myeloma, the investigators from the University of Pennsylvania, Odense University Hospital, and Norway evaluated the uptake of Na[18F]F in the thoracic aorta (TA) and the entire heart of myeloma patients as an early marker of atherosclerosis [69]. The obtained results were compared with those of a healthy control (HC) group. Notably, there existed a substantial disparity in Na[18F]F uptake within the TA between the myeloma and HC groups (p-values < 0.001) [69]. Furthermore, there was a significant difference in whole-heart Na[18F]F uptake between the two groups (p < 0.001) [69]. As noted in the study’s limitations, the absence of specific individual cardiovascular risk factor history assessment for each patient could be considered one of the drawbacks of the study. Therefore, the authors suggested conducting further studies in the future to explore the relationship between myeloma and atherosclerosis utilizing imaging modalities.

15. [18F]FDG and PET Limitations

Due to its low spatial resolution, PET may miss smaller osteolytic lesions. One potential solution to this is to combine PET with MRI, which could be particularly useful in areas like the spine. Recent research has demonstrated that WBMRI significantly improves detection rates for focal lesions at all anatomical locations (excluding ribs, scapulae, and clavicles) and for diffuse disease across all regions [70]. Despite its potential, PET/MRI has a limited accessibility compared to other imaging modalities such as PET or PET/CT. [18F]FDG is also a non-specific radiotracer that can lead to false positive results under different circumstances for patients with MM, like cases involving fractures, inflammation, and prior surgical procedures [23]. Therefore, as underlined previously in this article, there is a definitive need for more specialized radiotracers to accurately assess patients with myeloma.

16. Summary Statements

Summary statements are summarized in Table 3.

17. Conclusions

[18F]FDG PET/CT is highly accurate in assessing myeloma osteolytic lesions, treatment response, and residual disease, and is utilized in both research and clinical settings. Pathological fractures, a notable complication of myeloma bone disease, can be better assessed using the Na[18F]F radiotracer, given its ability to detect osteoblastic activity. Likewise, Na[18F]F effectively visualizes calcification in atherosclerosis; however, further research is needed before its clinical application in the assessment of myeloma. PET is promising in evaluating bone turnover post-high-dose chemotherapy and the brain’s response to chemotherapy drugs, though these are currently research-focused areas. PET quantification, particularly SUVmax, has applications in both research and clinical domains. Recent proposals suggest using CT-threshold methodology for whole-bone marrow and bone radiotracer assessment, rather than just focusing on osteolytic lesions, especially in patients with numerous myeloma lesions. Despite the high reproducibility of CT threshold methodologies, they require further investigations. Given the non-specificity of [18F]FDG, several alternative radiotracers are being investigated for myeloma across different research phases. Additionally, AI’s application in cancer research, including myeloma, shows promising preliminary outcomes.

Funding

This research received no external funding.

Institutional Review Board Statement

Not applicable.

Informed Consent Statement

Not applicable.

Data Availability Statement

The majority of the figures in this review article were obtained from studies where the author served as the first author or was actively involved with the co-authors. Specifically, Figure 2, Figure 3, Figure 5, and Figure 6, Figure 7, Figure 8, Figure 9, Figure 10, Figure 11 and Figure 12 were derived from these studies. Figure 1 was created by the author using PowerPoint.

Conflicts of Interest

The author declares no conflicts of interest.

AI Language Statement

The author used the large language model created by ChatGPT (GPT-3.5 and GPT-4, OpenAI, San Francisco, CA, USA) solely to improve the accuracy of English in this manuscript. None of the scientific facts in this manuscript were generated using AI. The author is fully responsible for the originality, validity, and integrity of the content of this manuscript.

References

  1. Rodriguez-Otero, P.; Paiva, B.; San-Miguel, J.F. Roadmap to cure multiple myeloma. Cancer Treat. Rev. 2021, 100, 102284. [Google Scholar] [CrossRef] [PubMed]
  2. Michels, T.C.; Petersen, K.E. Multiple Myeloma: Diagnosis and Treatment. Am. Fam. Physician 2017, 95, 373–383. [Google Scholar] [PubMed]
  3. Palumbo, A.; Anderson, K. Multiple Myeloma. N. Engl. J. Med. 2011, 364, 1046–1060. [Google Scholar] [CrossRef] [PubMed]
  4. Edwards, C.M.; Zhuang, J.; Mundy, G.R. The pathogenesis of the bone disease of multiple myeloma. Bone 2008, 42, 1007–1013. [Google Scholar] [CrossRef] [PubMed]
  5. Roodman, G.D. Myeloma Bone Disease; Springer Science & Business Media: Berlin, Germany, 2010. [Google Scholar]
  6. Kyle, R.A.; Therneau, T.M.; Rajkumar, S.V.; Larson, D.R.; Plevak, M.F.; Melton, L.J., III. Incidence of multiple myeloma in Olmsted County, Minnesota: Trend over 6 decades. Cancer Interdiscip. Int. J. Am. Cancer Soc. 2004, 101, 2667–2674. [Google Scholar] [CrossRef] [PubMed]
  7. Belch, A.; Bergsagel, D.; Wilson, K.; O’Reilly, S.; Wilson, J.; Sutton, D.; Pater, J.; Johnston, D.; Zee, B. Effect of daily etidronate on the osteolysis of multiple myeloma. J. Clin. Oncol. 1991, 9, 1397–1402. [Google Scholar] [CrossRef]
  8. Zadeh, M.Z.; Raynor, W.Y.; Seraj, S.M.; Ayubcha, C.; Kothekar, E.; Werner, T.; Alavi, A. Evolving Roles of Fluorodeoxyglucose and Sodium Fluoride in Assessment of Multiple Myeloma Patients: Introducing a Novel Method of PET Quantification to Overcome Shortcomings of the Existing Approaches. PET Clin. 2019, 14, 341–352. [Google Scholar] [CrossRef]
  9. Hemrom, A.; Tupalli, A.; Alavi, A.; Kumar, R. 18F-FDG Versus Non-FDG PET Tracers in Multiple Myeloma. PET Clin. 2022, 17, 415–430. [Google Scholar] [CrossRef]
  10. Kumar, S.K.; Callander, N.S.; Adekola, K.; Anderson, L.; Baljevic, M.; Campagnaro, E.; Castillo, J.J.; Chandler, J.C.; Costello, C.; Efebera, Y. Multiple myeloma, version 3.2021, NCCN clinical practice guidelines in oncology. J. Natl. Compr. Cancer Netw. 2020, 18, 1685–1717. [Google Scholar] [CrossRef]
  11. Cavo, M.; Terpos, E.; Nanni, C.; Moreau, P.; Lentzsch, S.; Zweegman, S.; Hillengass, J.; Engelhardt, M.; Usmani, S.Z.; Vesole, D.H.; et al. Role of 18F-FDG PET/CT in the diagnosis and management of multiple myeloma and other plasma cell disorders: A consensus statement by the International Myeloma Working Group. Lancet Oncol. 2017, 18, e206–e217. [Google Scholar] [CrossRef]
  12. Zirakchian Zadeh, M. PET/CT in assessment of colorectal liver metastases: A comprehensive review with emphasis on 18F-FDG. Clin. Exp. Metastasis 2023, 40, 465–491. [Google Scholar] [CrossRef] [PubMed]
  13. Taghvaei, R.; Zadeh, M.Z.; Werner, T.J.; Alavi, A. Critical role of PET/CT-based novel quantitative techniques for assessing global disease activity in multiple myeloma and other hematological malignancies: Why it is time to abandon reliance on examining focal lesions. Eur. Radiol. 2021, 31, 149–151. [Google Scholar] [CrossRef] [PubMed]
  14. van Lammeren-Venema, D.; Regelink, J.C.; Riphagen, I.I.; Zweegman, S.; Hoekstra, O.S.; Zijlstra, J.M. 18F-fluoro-deoxyglucose positron emission tomography in assessment of myeloma-related bone disease: A systematic review. Cancer 2012, 118, 1971–1981. [Google Scholar] [CrossRef] [PubMed]
  15. Regelink, J.C.; Minnema, M.C.; Terpos, E.; Kamphuis, M.H.; Raijmakers, P.G.; Pieters-van den Bos, I.C.; Heggelman, B.G.; Nievelstein, R.J.; Otten, R.H.; van Lammeren-Venema, D.; et al. Comparison of modern and conventional imaging techniques in establishing multiple myeloma-related bone disease: A systematic review. Br. J. Haematol. 2013, 162, 50–61. [Google Scholar] [CrossRef] [PubMed]
  16. Bredella, M.A.; Steinbach, L.; Caputo, G.; Segall, G.; Hawkins, R. Value of FDG PET in the assessment of patients with multiple myeloma. AJR Am. J. Roentgenol. 2005, 184, 1199–1204. [Google Scholar] [CrossRef] [PubMed]
  17. Zamagni, E.; Nanni, C.; Patriarca, F.; Englaro, E.; Castellucci, P.; Geatti, O.; Tosi, P.; Tacchetti, P.; Cangini, D.; Perrone, G.; et al. A prospective comparison of 18F-fluorodeoxyglucose positron emission tomography-computed tomography, magnetic resonance imaging and whole-body planar radiographs in the assessment of bone disease in newly diagnosed multiple myeloma. Haematologica 2007, 92, 50–55. [Google Scholar] [CrossRef] [PubMed]
  18. Westerland, O.; Amlani, A.; Kelly-Morland, C.; Fraczek, M.; Bailey, K.; Gleeson, M.; El-Najjar, I.; Streetly, M.; Bassett, P.; Cook, G.J.R.; et al. Comparison of the diagnostic performance and impact on management of 18F-FDG PET/CT and whole-body MRI in multiple myeloma. Eur. J. Nucl. Med. Mol. Imaging 2021, 48, 2558–2565. [Google Scholar] [CrossRef]
  19. Mesguich, C.; Hulin, C.; Latrabe, V.; Lascaux, A.; Bordenave, L.; Hindié, E.; Marit, G. Prospective comparison of 18FDG PET/CT and whole-body diffusion-weighted MRI in the assessment of multiple myeloma. Ann. Hematol. 2020, 99, 2869–2880. [Google Scholar] [CrossRef]
  20. Zamagni, E.; Patriarca, F.; Nanni, C.; Zannetti, B.; Englaro, E.; Pezzi, A.; Tacchetti, P.; Buttignol, S.; Perrone, G.; Brioli, A.; et al. Prognostic relevance of 18F FDG PET/CT in newly diagnosed multiple myeloma patients treated with up-front autologous transplantation. Blood 2011, 118, 5989–5995. [Google Scholar] [CrossRef]
  21. Sachpekidis, C.; Merz, M.; Raab, M.S.; Bertsch, U.; Weru, V.; Kopp-Schneider, A.; Jauch, A.; Goldschmidt, H.; Dimitrakopoulou-Strauss, A. The prognostic significance of [(18)F]FDG PET/CT in multiple myeloma according to novel interpretation criteria (IMPeTUs). EJNMMI Res. 2021, 11, 100. [Google Scholar] [CrossRef]
  22. Ho, C.-L.; Chen, S.; Cheng, K.C.; Leung, Y.L.; Wong, K.-N.; Cheung, W.; Chim, J. Assessment of tumor burden in multiple myeloma by correlation between dual-tracer PET/CT and β2-microglobulin. J. Nucl. Med. 2013, 54 (supplement 2), 435. [Google Scholar]
  23. Zirakchian Zadeh, M. Clinical Application of 18F-FDG-PET Quantification in Hematological Malignancies: Emphasizing Multiple Myeloma, Lymphoma and Chronic Lymphocytic Leukemia. Clin. Lymphoma Myeloma Leuk. 2023, 23, 800–814. [Google Scholar] [CrossRef] [PubMed]
  24. Moreau, P.; Attal, M.; Karlin, L.; Garderet, L.; Facon, T.; Macro, M.; Benboubker, L.; Caillot, D.; Escoffre, M.; Stoppa, A.-M. Prospective evaluation of MRI and PET-CT at diagnosis and before maintenance therapy in symptomatic patients with multiple myeloma included in the IFM/DFCI 2009 trial. Blood 2015, 126, 395. [Google Scholar] [CrossRef]
  25. Bartel, T.B.; Haessler, J.; Brown, T.L.; Shaughnessy, J.D., Jr.; van Rhee, F.; Anaissie, E.; Alpe, T.; Angtuaco, E.; Walker, R.; Epstein, J. F18-fluorodeoxyglucose positron emission tomography in the context of other imaging techniques and prognostic factors in multiple myeloma. Blood J. Am. Soc. Hematol. 2009, 114, 2068–2076. [Google Scholar] [CrossRef] [PubMed]
  26. Usmani, S.Z.; Mitchell, A.; Waheed, S.; Crowley, J.; Hoering, A.; Petty, N.; Brown, T.; Bartel, T.; Anaissie, E.; van Rhee, F. Prognostic implications of serial 18-fluoro-deoxyglucose emission tomography in multiple myeloma treated with total therapy 3. Blood J. Am. Soc. Hematol. 2013, 121, 1819–1823. [Google Scholar] [CrossRef]
  27. Dimitrakopoulou-Strauss, A.; Hoffmann, M.; Bergner, R.; Uppenkamp, M.; Haberkorn, U.; Strauss, L.G. Prediction of progression-free survival in patients with multiple myeloma following anthracycline-based chemotherapy based on dynamic FDG-PET. Clin. Nucl. Med. 2009, 34, 576–584. [Google Scholar] [CrossRef]
  28. Beksac, M.; Gunduz, M.; Ozen, M.; Ozturk, S.M.B.; Kucuk, O.; Ozkan, E. Impact of PET-CT response on survival parameters following autologous stem cell transplantation among patients with multiple myeloma: Comparison of two cut-off values. Blood 2014, 124, 3983. [Google Scholar] [CrossRef]
  29. Korde, N.; Roschewski, M.; Zingone, A.; Kwok, M.; Manasanch, E.E.; Bhutani, M.; Tageja, N.; Kazandjian, D.; Mailankody, S.; Wu, P. Treatment with carfilzomib-lenalidomide-dexamethasone with lenalidomide extension in patients with smoldering or newly diagnosed multiple myeloma. JAMA Oncol. 2015, 1, 746–754. [Google Scholar] [CrossRef]
  30. Cascini, G.L.; Falcone, C.; Console, D.; Restuccia, A.; Rossi, M.; Parlati, A.; Tamburrini, O. Whole-body MRI and PET/CT in multiple myeloma patients during staging and after treatment: Personal experience in a longitudinal study. La Radiol. Medica 2013, 118, 930–948. [Google Scholar] [CrossRef]
  31. Nanni, C.; Zamagni, E.; Celli, M.; Caroli, P.; Ambrosini, V.; Tacchetti, P.; Brioli, A.; Zannetti, B.; Pezzi, A.; Pantani, L. The value of 18F-FDG PET/CT after autologous stem cell transplantation (ASCT) in patients affected by multiple myeloma (MM): Experience with 77 patients. Clin. Nucl. Med. 2013, 38, e74–e79. [Google Scholar] [CrossRef]
  32. Spinnato, P.; Bazzocchi, A.; Brioli, A.; Nanni, C.; Zamagni, E.; Albisinni, U.; Cavo, M.; Fanti, S.; Battista, G.; Salizzoni, E. Contrast enhanced MRI and 18F-FDG PET-CT in the assessment of multiple myeloma: A comparison of results in different phases of the disease. Eur. J. Radiol. 2012, 81, 4013–4018. [Google Scholar] [CrossRef] [PubMed]
  33. Kumar, S.; Paiva, B.; Anderson, K.C.; Durie, B.; Landgren, O.; Moreau, P.; Munshi, N.; Lonial, S.; Bladé, J.; Mateos, M.-V. International Myeloma Working Group consensus criteria for response and minimal residual disease assessment in multiple myeloma. Lancet Oncol. 2016, 17, e328–e346. [Google Scholar] [CrossRef] [PubMed]
  34. Zamagni, E.; Nanni, C.; Mancuso, K.; Tacchetti, P.; Pezzi, A.; Pantani, L.; Zannetti, B.; Rambaldi, I.; Brioli, A.; Rocchi, S. PET/CT improves the definition of complete response and allows to detect otherwise unidentifiable skeletal progression in multiple myeloma. Clin. Cancer Res. 2015, 21, 4384–4390. [Google Scholar] [CrossRef]
  35. Zirakchian Zadeh, M.; Raynor, W.Y.; Østergaard, B.; Hess, S.; Yellanki, D.P.; Ayubcha, C.; Mehdizadeh Seraj, S.; Acosta-Montenegro, O.; Borja, A.J.; Gerke, O.; et al. Correlation of whole-bone marrow dual-time-point 18F-FDG, as measured by a CT-based method of PET/CT quantification, with response to treatment in newly diagnosed multiple myeloma patients. Am. J. Nucl. Med. Mol. Imaging 2020, 10, 257–264. [Google Scholar] [PubMed]
  36. Zhuang, H.; Pourdehnad, M.; Lambright, E.S.; Yamamoto, A.J.; Lanuti, M.; Li, P.; Mozley, P.D.; Rossman, M.D.; Albelda, S.M.; Alavi, A. Dual time point 18F-FDG PET imaging for differentiating malignant from inflammatory processes. J. Nucl. Med. 2001, 42, 1412–1417. [Google Scholar] [PubMed]
  37. Taghvaei, R.; Oestergaard, B.; Zadeh, M.Z.; Raynor, W.; Paydary, K.; Acosta-Montenegro, O.; Nielsen, A.; Werner, T.; Abildgaard, N.; Hoilund-Carlsen, P.F.; et al. Correlation of Dual Time Point FDG-PET with Response to Chemotherapy in Multiple Myeloma. J. Nucl. Med. 2017, 58 (Suppl. 1), 188. [Google Scholar]
  38. Zadeh, M.Z.; Seraj, S.M.; Østergaard, B.; Mimms, S.; Raynor, W.Y.; Aly, M.; Borja, A.J.; Arani, L.S.; Gerke, O.; Werner, T.J.; et al. Prognostic significance of 18F-sodium fluoride in newly diagnosed multiple myeloma patients. Am. J. Nucl. Med. Mol. Imaging 2020, 10, 151–160. [Google Scholar]
  39. Ak, İ.; Onner, H.; Akay, O.M. Is there any complimentary role of F-18 NaF PET/CT in detecting of osseous involvement of multiple myeloma? A comparative study for F-18 FDG PET/CT and F-18 FDG NaF PET/CT. Ann. Hematol. 2015, 94, 1567–1575. [Google Scholar] [CrossRef]
  40. Sachpekidis, C.; Goldschmidt, H.; Hose, D.; Pan, L.; Cheng, C.; Kopka, K.; Haberkorn, U.; Dimitrakopoulou-Strauss, A. PET/CT studies of multiple myeloma using 18F-FDG and 18F-NaF: Comparison of distribution patterns and tracers’ pharmacokinetics. Eur. J. Nucl. Med. Mol. Imaging 2014, 41, 1343–1353. [Google Scholar] [CrossRef]
  41. Raynor, W.; Houshmand, S.; Gholami, S.; Emamzadehfard, S.; Rajapakse, C.S.; Blomberg, B.A.; Werner, T.J.; Høilund-Carlsen, P.F.; Baker, J.F.; Alavi, A. Evolving role of molecular imaging with 18F-sodium fluoride PET as a biomarker for calcium metabolism. Curr. Osteoporos. Rep. 2016, 14, 115–125. [Google Scholar] [CrossRef]
  42. Zirakchian Zadeh, M.; Østergaard, B.; Raynor, W.Y.; Revheim, M.E.; Seraj, S.M.; Acosta-Montenegro, O.; Ayubcha, C.; Yellanki, D.P.; Al-Zaghal, A.; Nielsen, A.L.; et al. Comparison of 18F-sodium fluoride uptake in the whole bone, pelvis, and femoral neck of multiple myeloma patients before and after high-dose therapy and conventional-dose chemotherapy. Eur. J. Nucl. Med. Mol. Imaging 2020, 47, 2846–2855. [Google Scholar] [CrossRef] [PubMed]
  43. Ahles, T.A.; Saykin, A.J. Candidate mechanisms for chemotherapy-induced cognitive changes. Nat. Rev. Cancer 2007, 7, 192–201. [Google Scholar] [CrossRef] [PubMed]
  44. Wefel, J.S.; Lenzi, R.; Theriault, R.L.; Davis, R.N.; Meyers, C.A. The cognitive sequelae of standard-dose adjuvant chemotherapy in women with breast carcinoma: Results of a prospective, randomized, longitudinal trial. Cancer 2004, 100, 2292–2299. [Google Scholar] [CrossRef] [PubMed]
  45. Loh, K.P.; Janelsins, M.C.; Mohile, S.G.; Holmes, H.M.; Hsu, T.; Inouye, S.K.; Karuturi, M.S.; Kimmick, G.G.; Lichtman, S.M.; Magnuson, A.; et al. Chemotherapy-related cognitive impairment in older patients with cancer. J. Geriatr. Oncol. 2016, 7, 270–280. [Google Scholar] [CrossRef] [PubMed]
  46. Pourhassan Shamchi, S.; Zirakchian Zadeh, M.; Østergaard, B.; Kim, J.; Raynor, W.Y.; Khosravi, M.; Taghvaei, R.; Nielsen, A.L.; Gerke, O.; Werner, T.J.; et al. Brain glucose metabolism in patients with newly diagnosed multiple myeloma significantly decreases after high-dose chemotherapy followed by autologous stem cell transplantation. Nucl. Med. Commun. 2020, 41, 288–293. [Google Scholar] [CrossRef] [PubMed]
  47. Ziai, P.; Hayeri, M.R.; Salei, A.; Salavati, A.; Houshmand, S.; Alavi, A.; Teytelboym, O.M. Role of optimal quantification of FDG PET imaging in the clinical practice of radiology. Radiographics 2016, 36, 481–496. [Google Scholar] [CrossRef]
  48. Kwee, T.C.; Cheng, G.; Lam, M.G.E.H.; Basu, S.; Alavi, A. SUVmax of 2.5 should not be embraced as a magic threshold for separating benign from malignant lesions. Eur. J. Nucl. Med. Mol. Imaging 2013, 40, 1475–1477. [Google Scholar] [CrossRef] [PubMed]
  49. Zirakchian Zadeh, M.; Ayubcha, C.; Raynor, W.Y.; Werner, T.J.; Alavi, A. A review of different methods used for quantification and assessment of FDG-PET/CT in multiple myeloma. Nucl. Med. Commun. 2022, 43, 378–391. [Google Scholar] [CrossRef]
  50. McDonald, J.E.; Kessler, M.M.; Gardner, M.W.; Buros, A.F.; Ntambi, J.A.; Waheed, S.; van Rhee, F.; Zangari, M.; Heuck, C.J.; Petty, N.; et al. Assessment of Total Lesion Glycolysis by (18)F FDG PET/CT Significantly Improves Prognostic Value of GEP and ISS in Myeloma. Clin. Cancer Res. 2017, 23, 1981–1987. [Google Scholar] [CrossRef]
  51. Nanni, C.; Versari, A.; Chauvie, S.; Bertone, E.; Bianchi, A.; Rensi, M.; Bellò, M.; Gallamini, A.; Patriarca, F.; Gay, F.; et al. Interpretation criteria for FDG PET/CT in multiple myeloma (IMPeTUs): Final results. IMPeTUs (Italian myeloma criteria for PET USe). Eur. J. Nucl. Med. Mol. Imaging 2018, 45, 712–719. [Google Scholar] [CrossRef]
  52. Nanni, C. PET-FDG: Impetus. Cancers 2020, 12, 1030. [Google Scholar] [CrossRef] [PubMed]
  53. Minamimoto, R. Amino Acid and Proliferation PET/CT for the Diagnosis of Multiple Myeloma. Front. Nucl. Med. 2022, 1, 796357. [Google Scholar] [CrossRef]
  54. Lückerath, K.; Lapa, C.; Spahmann, A.; Jörg, G.; Samnick, S.; Rosenwald, A.; Einsele, H.; Knop, S.; Buck, A.K. Targeting paraprotein biosynthesis for non-invasive characterization of myeloma biology. PLoS ONE 2013, 8, e84840. [Google Scholar] [CrossRef] [PubMed]
  55. Michel, V.; Yuan, Z.; Ramsubir, S.; Bakovic, M. Choline transport for phospholipid synthesis. Exp. Biol. Med. 2006, 231, 490–504. [Google Scholar] [CrossRef] [PubMed]
  56. Chatterjee, S.; Behnam Azad, B.; Nimmagadda, S. The intricate role of CXCR4 in cancer. Adv. Cancer Res. 2014, 124, 31–82. [Google Scholar] [CrossRef] [PubMed]
  57. Buck, A.K.; Serfling, S.E.; Lindner, T.; Hänscheid, H.; Schirbel, A.; Hahner, S.; Fassnacht, M.; Einsele, H.; Werner, R.A. CXCR4-targeted theranostics in oncology. Eur. J. Nucl. Med. Mol. Imaging 2022, 49, 4133–4144. [Google Scholar] [CrossRef] [PubMed]
  58. Bailly, C.; Chalopin, B.; Gouard, S.; Carlier, T.; Saëc, P.R.; Marionneau-Lambot, S.; Moreau, P.; Touzeau, C.; Kraeber-Bodere, F.; Bodet-Milin, C.; et al. ImmunoPET in Multiple Myeloma-What? So What? Now What? Cancers 2020, 12, 1467. [Google Scholar] [CrossRef]
  59. Pandit-Taskar, N. Functional Imaging Methods for Assessment of Minimal Residual Disease in Multiple Myeloma: Current Status and Novel ImmunoPET Based Methods. Semin. Hematol. 2018, 55, 22–32. [Google Scholar] [CrossRef]
  60. Caserta, E.; Chea, J.; Minnix, M.; Poku, E.K.; Viola, D.; Vonderfecht, S.; Yazaki, P.; Crow, D.; Khalife, J.; Sanchez, J.F.; et al. Copper 64-labeled daratumumab as a PET/CT imaging tracer for multiple myeloma. Blood 2018, 131, 741–745. [Google Scholar] [CrossRef]
  61. Peck, M.; Pollack, H.A.; Friesen, A.; Muzi, M.; Shoner, S.C.; Shankland, E.G.; Fink, J.R.; Armstrong, J.O.; Link, J.M.; Krohn, K.A. Applications of PET imaging with the proliferation marker [18F]-FLT. Q. J. Nucl. Med. Mol. Imaging 2015, 59, 95–104. [Google Scholar]
  62. Sachpekidis, C.; Goldschmidt, H.; Kopka, K.; Kopp-Schneider, A.; Dimitrakopoulou-Strauss, A. Assessment of glucose metabolism and cellular proliferation in multiple myeloma: A first report on combined 18F-FDG and 18F-FLT PET/CT imaging. EJNMMI Res. 2018, 8, 28. [Google Scholar] [CrossRef] [PubMed]
  63. Mori, Y.; Dendl, K.; Cardinale, J.; Kratochwil, C.; Giesel, F.L.; Haberkorn, U. FAPI PET: Fibroblast Activation Protein Inhibitor Use in Oncologic and Nononcologic Disease. Radiology 2023, 306, e220749. [Google Scholar] [CrossRef] [PubMed]
  64. Lapa, C.; Schreder, M.; Schirbel, A.; Samnick, S.; Kortüm, K.M.; Herrmann, K.; Kropf, S.; Einsele, H.; Buck, A.K.; Wester, H.-J.; et al. [68Ga]Pentixafor-PET/CT for imaging of chemokine receptor CXCR4 expression in multiple myeloma - Comparison to [18F]FDG and laboratory values. Theranostics 2017, 7, 205–212. [Google Scholar] [CrossRef]
  65. Sachpekidis, C.; Enqvist, O.; Ulén, J.; Kopp-Schneider, A.; Pan, L.; Jauch, A.; Hajiyianni, M.; John, L.; Weinhold, N.; Sauer, S.; et al. Application of an artificial intelligence-based tool in [18F]FDG PET/CT for the assessment of bone marrow involvement in multiple myeloma. Eur. J. Nucl. Med. Mol. Imaging 2023, 50, 3697–3708. [Google Scholar] [CrossRef] [PubMed]
  66. Koene, R.J.; Prizment, A.E.; Blaes, A.; Konety, S.H. Shared risk factors in cardiovascular disease and cancer. Circulation 2016, 133, 1104–1114. [Google Scholar] [CrossRef] [PubMed]
  67. Rosa, G.M.; Bauckneht, M.; Masoero, G.; Mach, F.; Quercioli, A.; Seitun, S.; Balbi, M.; Brunelli, C.; Parodi, A.; Nencioni, A.; et al. The vulnerable coronary plaque: Update on imaging technologies. Thromb. Haemost. 2013, 110, 706–722. [Google Scholar] [CrossRef] [PubMed]
  68. Giannopoulos, A.A.; Benz, D.C.; Gräni, C.; Buechel, R.R. Imaging the event-prone coronary artery plaque. J. Nucl. Cardiol. 2019, 26, 141–153. [Google Scholar] [CrossRef] [PubMed]
  69. Arani, L.S.; Zirakchian Zadeh, M.; Saboury, B.; Revheim, M.-E.; Øestergaard, B.; Borja, A.J.; Samadi Samarin, D.; Mehdizadeh Seraj, S.; Kalbush, E.; Ayubcha, C.; et al. Assessment of atherosclerosis in multiple myeloma and smoldering myeloma patients using 18F- sodium fluoride PET/CT. J. Nucl. Cardiol. 2021, 28, 3044–3054. [Google Scholar] [CrossRef]
  70. Messiou, C.; Porta, N.; Sharma, B.; Levine, D.; Koh, D.-M.; Boyd, K.; Pawlyn, C.; Riddell, A.; Downey, K.; Croft, J.; et al. Prospective Evaluation of Whole-Body MRI versus FDG PET/CT for Lesion Detection in Participants with Myeloma. Radiol. Imaging Cancer 2021, 3, e210048. [Google Scholar] [CrossRef]
  71. Nanni, C.; Kobe, C.; Baeßler, B.; Baues, C.; Boellaard, R.; Borchmann, P.; Buck, A.; Buvat, I.; Chapuy, B.; Cheson, B.D.; et al. European Association of Nuclear Medicine (EANM) Focus 4 consensus recommendations: Molecular imaging and therapy in haematological tumours. Lancet Haematol. 2023, 10, e367–e381. [Google Scholar] [CrossRef]
Figure 1. Conventional and novel roles of PET/CT in myeloma disease assessment.
Onco 04 00002 g001
Figure 2. This figure illustrates the crucial role of [18F]FDG PET in evaluating skeletal disease in MM. The case is of a 60-year-old man newly diagnosed with MM. [18F]FDG PET revealed cervical lymphadenopathies and multiple active lesions with varying degrees of [18F]FDG uptake in the skeleton (A). An active lesion in the sternum (indicated by arrows) was detected on PET and PET/CT (A,B,D), but was not clearly visible on CT alone (C). The image was sourced from PMID: 31084774 (Figure 1), and permission was granted for its use.
Onco 04 00002 g002
Figure 3. This figure demonstrates the high sensitivity of [18F]FDG in detecting active MM lesions. The images present [18F]FDG PET (left) and Na[18F]F scan (right) of a 60-year-old man diagnosed with MM. The whole-body [18F]FDG PET scan reveals numerous active lesions in the skeleton and extramedullary sites (A). The whole-body Na[18F]F PET scan did not identify most of the lesions detected by [18F]FDG PET (B). The image was sourced from PMID: 31084774 (Figure 2), and permission was granted for its use.
Onco 04 00002 g003
Figure 4. This figure presents the case of a 39-year-old patient with symptomatic multiple myeloma (MM) who was being prepared for high-dose therapy (HDT) and autologous stem cell transplantation (ASCT). This patient underwent an [18F]FDG PET/CT scan both before and after treatment. The maximum intensity projection (MIP) of the [18F]FDG PET/CT scan before treatment (A) revealed a combination of intense, widespread uptake in the axial skeleton and multiple focal bone marrow lesions in locations such as the sternum, ribs, humerus, scapula, and femur (indicated by arrows). The follow-up [18F]FDG PET/CT MIP after HDT and ASCT (B) demonstrated a complete remission of both the diffuse bone marrow uptake and the focal MM lesions. Figure 2, PMID: 31905752, PMCID: PMC6982887, OPEN ACCESS.
Onco 04 00002 g004
Figure 5. This figure is displaying the baseline (A,B) and follow-up (C,D) [18F]FDG PET images of a patient with MM before high-dose chemotherapy and 2 months post-treatment. The [18F]FDG uptake by the lesions was quantified using an adaptive thresholding algorithm. The image was sourced from PMID: 31084773 (Figure 3), and permission was granted for its use.
Onco 04 00002 g005
Figure 6. This figure showcases [18F]FDG PET/CT scans from a 60-year-old man recently diagnosed with multiple myeloma. (A) Illustrates the [18F]FDG PET scan taken 1 h post-administration of the [18F]FDG tracer. (B) Depicts the [18F]FDG PET scan taken 3 h post-administration of the [18F]FDG tracer. The table exhibits the percentage of change in the SUVmean and pvcSUVmean for the lesions showing complete response (CR) and partial response (PR) in the patient from the 1 h scan to the 3 h scan. The terms CR, PR, pvc, and SUVmean stand for complete response, partial response, partial volume correction, and mean standardized uptake value, respectively. The image was sourced from PMID: 30420215 (Figure 5), and permission was granted for its use.
Onco 04 00002 g006
Figure 7. (A) This image displays the whole-body Na[18F]F PET scan without the application of regions of interest (ROIs). (B) Active lesions including fractures throughout the whole-body Na[18F]F PET/CT scans were identified and segmented; PMID: 32929393, Figure 1, open access.
Onco 04 00002 g007
Figure 8. The images on the left depict a semi-automated CT-based segmentation used to assess bone turnover in the entire bone and pelvis of multiple myeloma patients before and after treatment (a,b). Regions of interest were also delineated to evaluate changes in Na[18F]F uptake in the femoral neck of these patients (c). Images obtained from comparison of Na[18F]F uptake in the whole bone, pelvis, and femoral neck of multiple myeloma patients before and after high-dose therapy and conventional-dose chemotherapy, Zirakchian Zadeh et al., EJNMMI, Figures 2 and 5, obtained with permission; reference [42] in this review article.
Onco 04 00002 g008
Figure 9. The left figures depict the use of designated regions of interest (ROIs) for the supratentorial and cerebellum areas within the brain of a multiple myeloma patient. The separation of the supratentorial region from the cerebellum was achieved using the tentorium cerebelli as a reference point. Patients (a,b) received high-dose therapy, whereas patient (c) received conventional chemotherapy, resulting in fewer changes in brain [18F]FDG uptake compared to patients (a,b).
Onco 04 00002 g009
Figure 10. This figure demonstrates the potential role of global disease assessment by PET in MM. It shows changes in [18F]FDG uptake in MM lesions before (A) and after treatment (B). High diffuse [18F]FDG uptake is visible across the entire spine before treatment (A), whereas a substantial reduction in [18F]FDG uptake can be visually observed after treatment (B). Segmentation of the entire skeleton followed by a closing algorithm allows for a global disease assessment (C,D). The pre-treatment global average SUVmean (C) was 3.1 and decreased to 1.8 after the completion of the treatment (D). The image was sourced from PMID: 31084774 (Figure 4), and permission was granted for its use.
Onco 04 00002 g010
Figure 11. This presents the whole-body [18F]FDG PET and combined [18F]FDG PET-CT images of a 60-year-old man diagnosed with multiple myeloma. The entire skeleton was segmented by employing an iterative threshold algorithm based on Hounsfield units, followed by a smoothing and closing procedure. This method yields the global SUVmean (GSUVmean), which represents the total bone marrow involvement in patients with multiple myeloma. (A) Prior to treatment commencement, the GSUVmean was 2.02. However, (B) upon completing the treatment, the GSUVmean significantly decreased to 1.10. The image was sourced from PMID: 30420215 (Figure 6), and permission was granted for its use.
Onco 04 00002 g011
Figure 12. The upper row of images includes a PET scan (A), a merged PET/CT scan (B), and a combined PET/CT scan with a region of interest (ROI) applied before the use of the morphological closing algorithm (C) in a patient with multiple myeloma (MM). In the bottom row, the left-hand side images display PET scans of an MM patient classified in the poor response to treatment group, captured at 1 h (D) and 3 h (E). In this patient, the overall bone marrow [18F]FDG uptake escalated from 0.89 (D) to 2.31 (E), reflecting a percentage change of 158.15%. On the right-hand side of the bottom row, the images present PET scans of an MM patient from the complete response group, taken at 1 h (F) and 3 h (G). In this patient, there was a slight reduction in the overall bone marrow [18F]FDG uptake, dropping from 0.83 (F) to 0.82 (G), with a percentage change of −0.79%. Note that the second decimal number is rounded up. PMID: 33224622, PMCID: PMC7675111, Free Access.
Onco 04 00002 g012
Figure 13. IMPeTUs. (A) Maximum intensity projection (MIP); (B) sagittal cut of the PET scan; (C) sagittal cut of the CT scan. This shows a widespread and intense bone marrow uptake in the limbs, pelvis, and spine. This patient exhibits diffused enhanced bone marrow uptake, which also involves the limbs, with a fracture in T10 (the tenth thoracic vertebra). In this case, the Identified Myeloma PET Uptake Score (IMPeTUs) is BM4 A (indicating increased bone marrow uptake extending into the limbs) and Fr (one fracture identified on CT scan), Cancers 2020, 12(4), 1030; https://doi.org/10.3390/cancers12041030, OPEN ACCESS [52].
Onco 04 00002 g013
Figure 14. This figure illustrates a patient diagnosed with multiple myeloma (MM) of the Ig A λ type, and with increasing free serum light chains. The [68Ga]Pentixafor PET scan displays intense tracer uptake in various locations, including multiple intramedullary lesions (indicated by stars) and extramedullary lesions (indicated by arrows). Copyright © Ivyspring International Publisher. Reproduction is permitted for personal, non-commercial use, provided that the article is in whole, unmodified, and properly cited. PMCID: PMC5196897, PMID: 28042328 [64].
Onco 04 00002 g014
Figure 15. This example showcases an automated measurement method employing six distinct standardized uptake value (SUV) thresholds to identify abnormal tracer absorption in the skeletal system. It employs an AI-driven, automated process to calculate the metabolic tumor volume (MTV) and total lesion glycolysis (TLG) values in a patient diagnosed with multiple myeloma (MM), featuring numerous focal [18F]FDG-avid lesions. PMID: 37493665, Figure 3, open access.
Onco 04 00002 g015
Table 1. Intra-class correlation (ICC) analysis for inter-observer reliability for CT-based segmentation in myeloma disease. Obtained from PMID: 32246208, with permission.
ParameterICC95% CI
Whole bone (pre-treatment)0.9830.965–0.992
Whole bone (post-treatment)0.9890.978–0.995
Whole pelvis (pre-treatment)0.9980.996–0.999
Whole pelvis (post-treatment)0.9960.991–0.998
Table 3. Summary Statement.
Assessment of Bone Disease in Multiple MyelomaClinical and Research *[18F]FDG PET/CT demonstrates high sensitivity in detecting osteolytic lesions. The sensitivity of PET can be enhanced with delayed imaging. However, the waiting time interval between the two scans (early and delayed) presents a significant challenge.
Prediction of PrognosisMostly Research[18F]FDG PET stands out as one of the top imaging modalities for forecasting outcomes in various cancers because it delivers quantitative parameters.
Effectiveness of Therapy and Assessment of Residual DiseaseClinical and ResearchIn comparison to anatomical imaging methods such as CT and MRI, [18F]FDG PET stands out for these purposes because it offers molecular insights detectable prior to visible structural alterations. As a result, many guidelines recommend PET as the preferred imaging method for these specific areas.
Assessment of Pathologic FracturesResearchAn Na[18F]F radiotracer, indicative of osteoblastic activity, is the appropriate choice for this task, not [18F]FDG.
PET for Assessment of Bone Turnover in Myeloma PatientsResearchIn a recent study by Zirakchian Zadeh and colleagues, Na[18F]F PET was demonstrated to effectively evaluate bone activity in myeloma patients post-treatment.
Chemo BrainResearch[18F]FDG PET is capable of measuring alterations in brain glucose metabolism using quantitative analysis. Thus, it is suitable for examining the effects of “chemo brain.”
FDG PET QuantificationMostly ResearchQuantification using [18F]FDG PET in MM is generally challenging. While SUVmax has proven to be more effective than other PET metrics for this application, it only reflects metabolic activity in a limited region. Although MTV and TLG are employed as volumetric PET metrics, their effectiveness can be reduced due to the presence of numerous lesions in some cases. Some institutions are now leaning toward CT-based segmentations; these techniques are consistently reproducible, yet their clinical patient assessment merits further study. The IMPetus approach offers another perspective, primarily visual-based. While this method is thorough, its effectiveness can be influenced by the expertise of the individual interpreting the results.
Novel PET RadiotracersMostly Research[18F]FDG, being a non-specific radiotracer, is susceptible to both false positive and negative outcomes. This underscores the need to research more targeted radiotracers for evaluating myeloma disease. Many of these newer PET radiotracers have demonstrated results that are either on par with or superior to [18F]FDG PET in identifying osteolytic lesions.
AI for PET QuantificationResearchThe AI approach to evaluate PET results in myeloma using this new concept has shown encouraging outcomes thus far. The investigators argue that this method can address the challenges associated with inconsistent evaluations of PET results in patients with myeloma.
AtherosclerosisResearch (limited data available)Typically, Na[18F]F, rather than [18F]FDG, is suggested for examining atherosclerosis. Recent research indicates that Na[18F]F PET might be an effective imaging technique for evaluating atherosclerosis in individuals with myeloma. Further studies are recommended by the authors to assess the correlation between myeloma and atherosclerosis.
PET LimitationN/AThe lower spatial resolution of PET compared to anatomical imaging might impede the evaluation of tiny lesions. Additional challenges include patient preparation and radiation exposure.
* The second column indicates whether this role of PET pertains to clinical, research, or both aspects in myeloma assessment. For further details, please refer to the reference [71].
Disclaimer/Publisher’s Note: The statements, opinions and data contained in all publications are solely those of the individual author(s) and contributor(s) and not of MDPI and/or the editor(s). MDPI and/or the editor(s) disclaim responsibility for any injury to people or property resulting from any ideas, methods, instructions or products referred to in the content.

