Article

Optimizing the Pharmacological and Optical Dosimetry for Photodynamic Therapy with Methylene Blue and Nanoliposomal Benzoporphyrin on Pancreatic Cancer Spheroids

by
Tristan Le Clainche
,
Nazareth Milagros Carigga Gutierrez
,
Núria Pujol-Solé
,
Jean-Luc Coll
and
Mans Broekgaarden
*
Institute for Advanced Biosciences, Grenoble-Alpes University, INSERM U1209, CNRS UMR 5309, 38700 Grenoble, France
*
Author to whom correspondence should be addressed.
Onco 2022, 2(1), 19-33; https://doi.org/10.3390/onco2010002
Submission received: 15 December 2021 / Revised: 31 December 2021 / Accepted: 2 January 2022 / Published: 7 January 2022
(This article belongs to the Special Issue Feature Papers in Onco)

Abstract

:

Simple Summary

Photodynamic therapy is a promising cancer treatment, which relies on a multitude of pharmacological and optical parameters. In this study, we investigated the PDT efficacy of methylene blue and nanoliposomal benzoporphyrin on PANC-1 and MIA PaCa-2 spheroids and the impact of the photosensitizer dose, the light dose, and the fluence rate. We demonstrate that maximizing the PDT effects requires the optimization of both the pharmacological and optical dosimetry in a photosensitizer and cancer model-dependent manner.

Abstract

Photodynamic therapy (PDT) is a cancer treatment that relies on the remote-controlled activation of photocatalytic dyes (photosensitizers) in cancer tissues. To effectively treat cancer, a variety of pharmacological and optical parameters require optimization, which are dependent on the photosensitizer type. As most photosensitizers are hydrophobic molecules, nanoliposomes are frequently used to increase the biocompatibility of these therapeutics. However, as nanoliposomes can influence the therapeutic performance of photosensitizers, the most suitable treatment parameters need to be elucidated. Here, we evaluate the efficacy of PDT on spheroid cultures of PANC-1 and MIA PaCa-2 pancreatic cancer cells. Two strategies to photosensitize the pancreatic microtumors were selected, based on either nanoliposomal benzoporphyrin derivative (BPD), or non-liposomal methylene blue (MB). Using a comprehensive image-based assay, our findings show that the PDT efficacy manifests in distinct manners for each photosensitizer. Moreover, the efficacy of each photosensitizer is differentially influenced by the photosensitizer dose, the light dose (radiant exposure or fluence in J/cm2), and the dose rate (fluence rate in mW/cm2). Taken together, our findings illustrate that the most suitable light dosimetry for PDT strongly depends on the selected photosensitization strategy. The PDT dose parameters should therefore always be carefully optimized for different models of cancer.

1. Introduction

In recent years, research on photodynamic therapy (PDT) has validated its utility in oncology, as it has been demonstrated to be not only important in the treatment of non-melanoma skin cancer [1] but also as a treatment option for head-and-neck cancer [2,3], lung cancer [4,5] and prostate cancer [6,7]. In addition, it has shown clinical potential for application in gastrointestinal cancer [8,9], pancreatic cancer [10,11,12] and breast cancer [13]. As a cancer treatment modality, PDT involves the administration of small molecules called photosensitizers, which usually are pharmaceuticals that absorb visible or near-infrared light. These photosensitizers induce cytotoxicity within the tumor tissue through photochemical production of cytotoxic reactive oxygen species (ROS) [11,14,15,16].
Compared to radiotherapy and chemotherapy, PDT is rather complex, and requires the optimization of various parameters. Among the parameters that influence PDT outcomes we can list: (1) the type of photosensitizer, (2) the photosensitizer concentration, (3) the light energy delivered to the target tissue or light dose (given here as radiant exposure in J/cm2), (4) the fluence rate at which the light is delivered (given in mW/cm2), and (5) the sensitivity of tissue to PDT [17,18,19,20,21,22]. Over the years, the influence of these parameters on PDT outcomes has been investigated in various contexts. For example, for the pre-photosensitizer 5-aminolevulinic acid, it was shown that PDT with a radiant exposure of 100 J/cm2 given at either a low or high light dose rate of 100 mW/cm2 or 25 mW/cm2 to melanoma cells implanted in the dorsal skin of hamsters caused a complete remission of tumors only when exposed to PDT at 100 mW/cm2 [23]. In a study where TB4C spheroids were subjected to 5-aminolevolunic acid-PDT demonstrated that fluence rates below 25 mW/cm2 were shown to be more effective, compared to PDT with higher fluence rates. An exposure of 50 J/cm2 reduced spheroid survival to 66% when using 25 mW/cm2 as fluence rate, while fluence rates of 0.8 and 5 mW/m2 reduced spheroid survival to 40%. Moreover, when TB4C intracranial glioma tumors in rats were subjected to PDT with low fluence rates, the treatment did not repress tumor growth but demonstrated that O2 supply was enough to yield necrosis in the tumor core [24].
The most suitable PDT parameters for a given model are thus highly dependent on the type of photosensitizer. As many photosensitizers are highly hydrophobic porphyrins or phthalocyanines, nanoliposomes are frequently used as nanocarriers to render such photosensitizers more biocompatible [25,26,27]. As nanoparticular encapsulation alters key pharmaceutical parameters such as uptake kinetics, intracellular, and intratumor localization, it may complicate the refinement of the PDT dosimetry. For example, whether the PDT dose parameters optimized for free BPD [28] are similar to liposomal BPD (e.g., Visudyne) remains unclear. Moreover, many photosensitizers, including BPD, have multiple absorption peaks at which they can be excited, and the excitation source may also impact the PDT efficacy. For other common photosensitizers, the most suitable PDT dose parameters remain still largely uninvestigated. For example, methylene blue (MB) is a non-porphyrin photosensitizer widely used for anti-microbial PDT in dental clinical applications [29,30,31]. However, recent studies have leveraged its ROS production capacity and its experimental potential in some cancers such as breast cancer [32,33] and colorectal cancer [34], yet how the efficacy is influenced by specific cancer models, MB dose, and optical dosimetry remains sparsely investigated.
In the present study, we evaluate the PDT efficacy of liposomal BPD (L-BPD) and MB using state-of-the-art 96-well LED arrays, with the aim to find the optimal PDT dose parameters and establish the appropriate manner to determine the treatment outcomes. This is studied using spheroid models of pancreatic cancer, the third leading cause of cancer deaths in the U.S. and the fourth most common cause in the EU and the UK [35]. We demonstrate that modulating total radiant exposure and fluence rate strongly impact the PDT outcomes in a photosensitizer-dependent manner. Moreover, the treatment outcomes manifest in distinct manners, depending on the cellular origin of the spheroids and the photosensitizer type. Thus, the rational design of PDT strategies is of highly importance to obtain the most optimal treatment outcomes.

2. Materials and Methods

2.1. Chemicals and Reagents

Methylene blue (MB, 97% purity), benzoporphyrin derivative (BPD, 94% purity), aminophenyl fluorescein (APF), and cholesterol were obtained from Sigma-Aldrich (Sigma Aldrich Chimie, Saint-Quentin-Fallavier, France). The lipids 1,2-distearoyl-sn-glycero-3-phosphocholine (DSPC), 1,2-dioleoyl-sn-glycero-3- phosphoethanolamine (DOPE), 1,2-distearoyl-sn-glycero-3-phosphoethanolamine-N-[methoxy(polyethylene glycol)-2000] (DSPE-PEG) were obtained from Avanti Polar Lipids (Sigma Aldrich). The ROS sensor singlet oxygen sensor green (SOSG) was obtained from Thermo Fisher (Waltham, MA, USA).

2.2. Liposome Preparation and Characterization

The lipids DOPE, DSPC, DSPE-PEG and Cholesterol (5:41:4:50 molar ratio in CHCl3) were mixed and BPD was added to the mixture at a BPD:lipid molar ratio of 0.008. CHCl3 was evaporated and the lipid cake was hydrated in phosphate-buffered saline (PBS, Gibco) to reach a 5 mM final lipid concentration). Liposomes were formed by sonication during 20 min using the EpiShear cooled sonication platform (Active Motif, Carlsbad, CA, USA) and extruded at 0.2 µm using Whatman Anotop membrane filters (GE Healthcare, Chicago, IL, USA). For a better preservation, liposomes were purged with N2 gas (Messer CANgas, Sigma-Aldrich) and stored at 4 °C.
The zeta potential, size and polydispersity index of the L-BPD were determined by electrophoretic light scattering spectroscopy and dynamic light scattering using the ZetaSizer (Malvern Panalytical, Malvern, WS, USA). The L-BPD size and zeta potential were 96.8 ± 2.05 nm and 2.6 ± 0.2 mV respectively. Polydispersity index was 0.130 ± 0.02, proving the size homogeneity of liposomes population following extrusion.

2.3. Detection of HO• and 1O2 Generation

Reaction mixtures of 10 µM photosensitizer (L-BPD or MB) in PBS were prepared in clear-bottom 96-wells plates (Corning, Boulogne-Billancourt, France). The reaction mixtures contained either 10µM APF or SOSG for the detection of OH and 1O2, respectively. The final volume in the wells was 100 µL. The reaction mixtures were irradiated using Lumidox Gen II, 96-well LED-arrays (Analytical Sales and Services, Flanders, NJ, USA), emitting at either 420 nm (78.13 mW/cm2) or 660 nm (93.75 mW/cm2). Fractional illumination was performed, during which the fluorescence emission of APF and SOSG was determined at intermediate radiant exposures until a total dose of 37.5 J/cm2 (420 nm) or 45 J/cm2 (660 nm) was reached. APF and SOSG fluorescence emission was detected at λex = 485 nm and λem = 520 nm (FluoStar Omega plate reader, BMG Labtech, Champigny-sur-Marne, France).

2.4. Cell and Spheroid Culture

PANC-1 and MIAPaCa-2 pancreatic cancer cell lines were purchased from ATCC and maintained in DMEM culture medium (Sigma-Aldrich) supplemented with 10% Fetal Bovine Serum (ThermoFisher, Waltham, MA, USA) and a mix of Penicillin and Streptomycin at 100 units/mL and 100 µg/mL final concentration. Harvesting was performed using 0.05% Trypsin-EDTA mix in Phosphate Buffer Saline (ThermoFisher). Both cell lines were characterized mycoplasma-free using Mycoalert detection kit (Lonza, Bâle, Switzerland). Spheroids cultures were performed using black 96-wells Corning Spheroid Microplates (Corning, NY, USA). Five thousand cells per well were seeded in 100 µL DMEM medium final volume and culture for 72 h at 37 °C and 5% CO2 before treatment.

2.5. Determination of Photosensitizer Uptake and Dark Toxicity

For uptake experiments, BPD containing liposomes were diluted to reach a final concentration of 500 µM in fully supplemented culture medium. As BPD was included in a BPD:lipid ratio of 0.008, the final BDP concentration contained in the liposomes was 4 μM. MB was prepared at a final concentration of 100 µM in fully supplemented culture medium. L-BPD and MB were incubated with 3 days-old PANC-1 and MIAPaCa-2 spheroid cultures during 2, 4 and 24 h. Then, the liposome uptake was assessed through the quantification of MB and BPD emission.
The uptake was quantified by confocal fluorescence microscopy (Zeiss Axio Observer Z1) equipped with a 5× objective. BPD emission was detected using λex = 405 nm, λem = 600–740 nm. MB emission was detected using λex = 633 nm, λem = 670–750 nm. For the photosensitizers uptake, the acquisition parameters were set by maximizing the detector gain on the spheroids that were treated for 24 h. Finally, image analysis and quantification of BPD uptake was performed using a custom-designed MATLAB code previously described by Bulin et al. [36].

2.6. Determination of PDT Efficacy

3-days old PANC-1 and MIAPaCa-2 spheroids were subjected to the following treatments: (1) A no treatment control group exposed to blue light (420 nm), (2) PDT with L-BPD in a concentration range of 0.2–20 µM and at a blue light irradiance range of 5–50 J/cm2 (3) A no treatment control group exposed to red light (660 nm), (4) PDT with MB in a concentration range of 0.2–20 µM and at a red light irradiance range of 5–50 J/cm2, and (5) a total killing control.
To evaluate the effect of fluence rate, 3-days old PANC-1 and MIAPaCa-2 spheroids were subjected to the following treatments: (1) A no treatment control group exposed to blue light (420 nm), (2) PDT with 0.2 µM L-BPD at an irradiance of 50 J/cm2 and at energies of 78, 170 or 235 mW/cm2, (3) A no treatment control group exposed to red light (660 nm), (4) PDT with 20 µM MB at a red light irradiance of 50 J/cm2 and at energies of 95, 190 or 280 mW/cm2, and (5) a total killing control.
Liposome toxicity and the effects of PDT were assessed using in situ live/dead staining with 2 µM Calcein AM (ThermoFisher), and 3 µM propidium iodide (PI, Sigma Aldrich) prepared in complete medium. Spheroid culture medium was removed before adding 100 µL of staining solution to each well. Then, plates were incubated for 60 min at culture conditions, and subsequent confocal laser scanning fluorescence intensities were detected at ʎex = 488 nm/ʎem = 520 nm and ʎex = 520 nm/ʎem = 559 nm respectively. No treatment and total killing controls were used to set the acquisition parameters by maximizing the detector gain of 488 nm and 520 nm lasers respectively. Subsequent image acquisition and image analysis was performed using MATLAB the CALYPSO image analysis code Necrosis was determined by calculating the percentage of the mean propidium iodide emission intensity in each treatment condition in comparison to th the total killing control (set at 100%).

2.7. Statistical Analysis

All data was statistically analyzed in Graphpad Prism 7 (San Diego, CA, USA). Data sets were tested for Gaussian distributions using D’Agostino and Pearson omnibus normality tests. Normally distributed data sets were analyzed using a one-way ANOVA and Bonferroni post hoc test for multiple comparisons, whereas non-Gaussian data sets were analyzed using a Kruskal–Wallis and Dunn’s post-hoc test for multiple comparison. Statistical significance is indicated with single asterisks (p ≤ 0.05), double asterisks (p ≤ 0.01) or triple asterisks (p ≤ 0.005). All data represents the mean ± SD. Outlier removal (ROUT method, Q = 10%) was performed for all the treatments. Dose responses curves were fitted using non-linear regression (Inhibitor versus normalized response and antagonist versus normalized response). Uptake analyses were performed using one-phase association fits.

3. Results

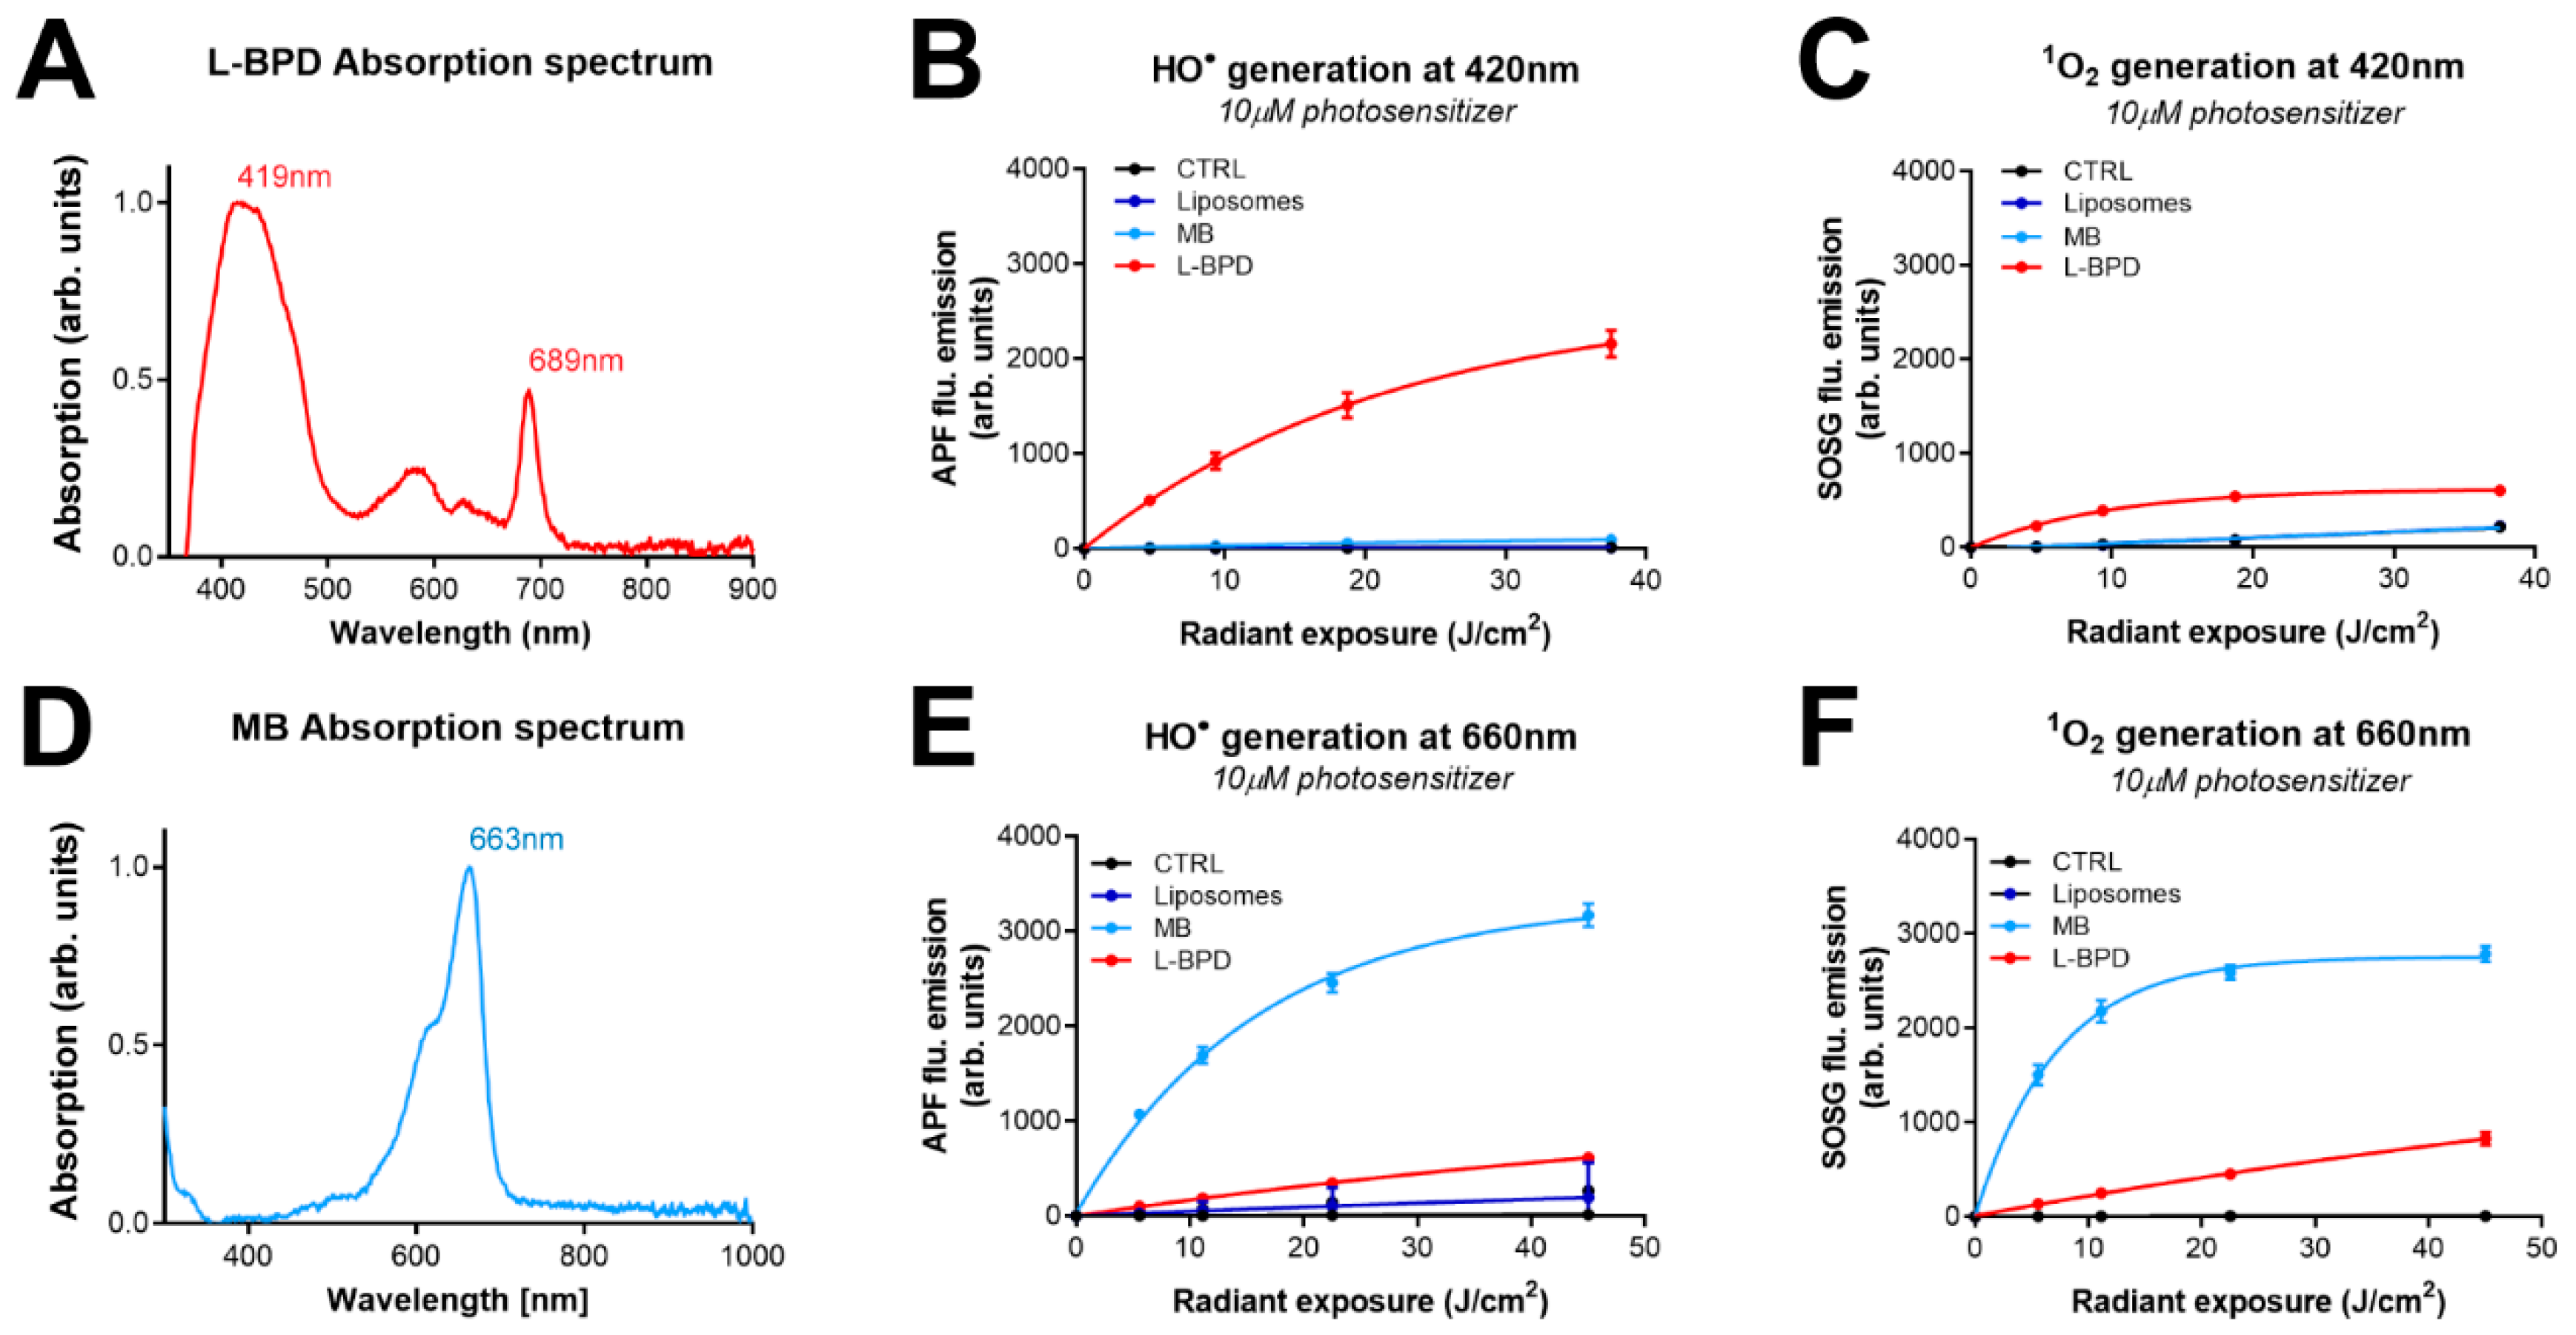
3.1. The Photodynamic Activity of L-BPD and MB

Prior to the in vitro studies, we first set out to evaluate the photodynamic activity of L-BPD and MB, of which the absorption spectra are given in Figure 1A,D). Upon excitation with 420 nm, minor oxidation of APF and SOSG can be observed in the control and liposome-only conditions (Figure 1B,C). Increased SOSG fluorescence emission is likely the result of 1O2 production by blue light. This may similarly have caused increased APF fluorescence emission; although APF is primarily a sensor for OH, it is known to have minor reactivity to 1O2 as well [37]. MB demonstrated no photodynamic activity upon excitation with 420 nm light, which is in line with the absence of absorption at this wavelength. In contrast, L-BPD induced significant APF oxidation, indicating substantial production of OH. A significant increase in SOSG oxidation was also detected, albeit to a lesser extent. Upon 660 nm irradiation, no APF or SOSG fluorescence emission was detected in solutions containing PBS or liposomes only (Figure 1E,F). MB showed a clear, light dose-dependent increase in APF and SOSG fluorescence emission, indicating that in PBS, MB generates both OH and 1O2. Taken together, the results clearly demonstrate that both L-BPD and MB are potent photosensitizers when excited with the appropriate wavelength of light.

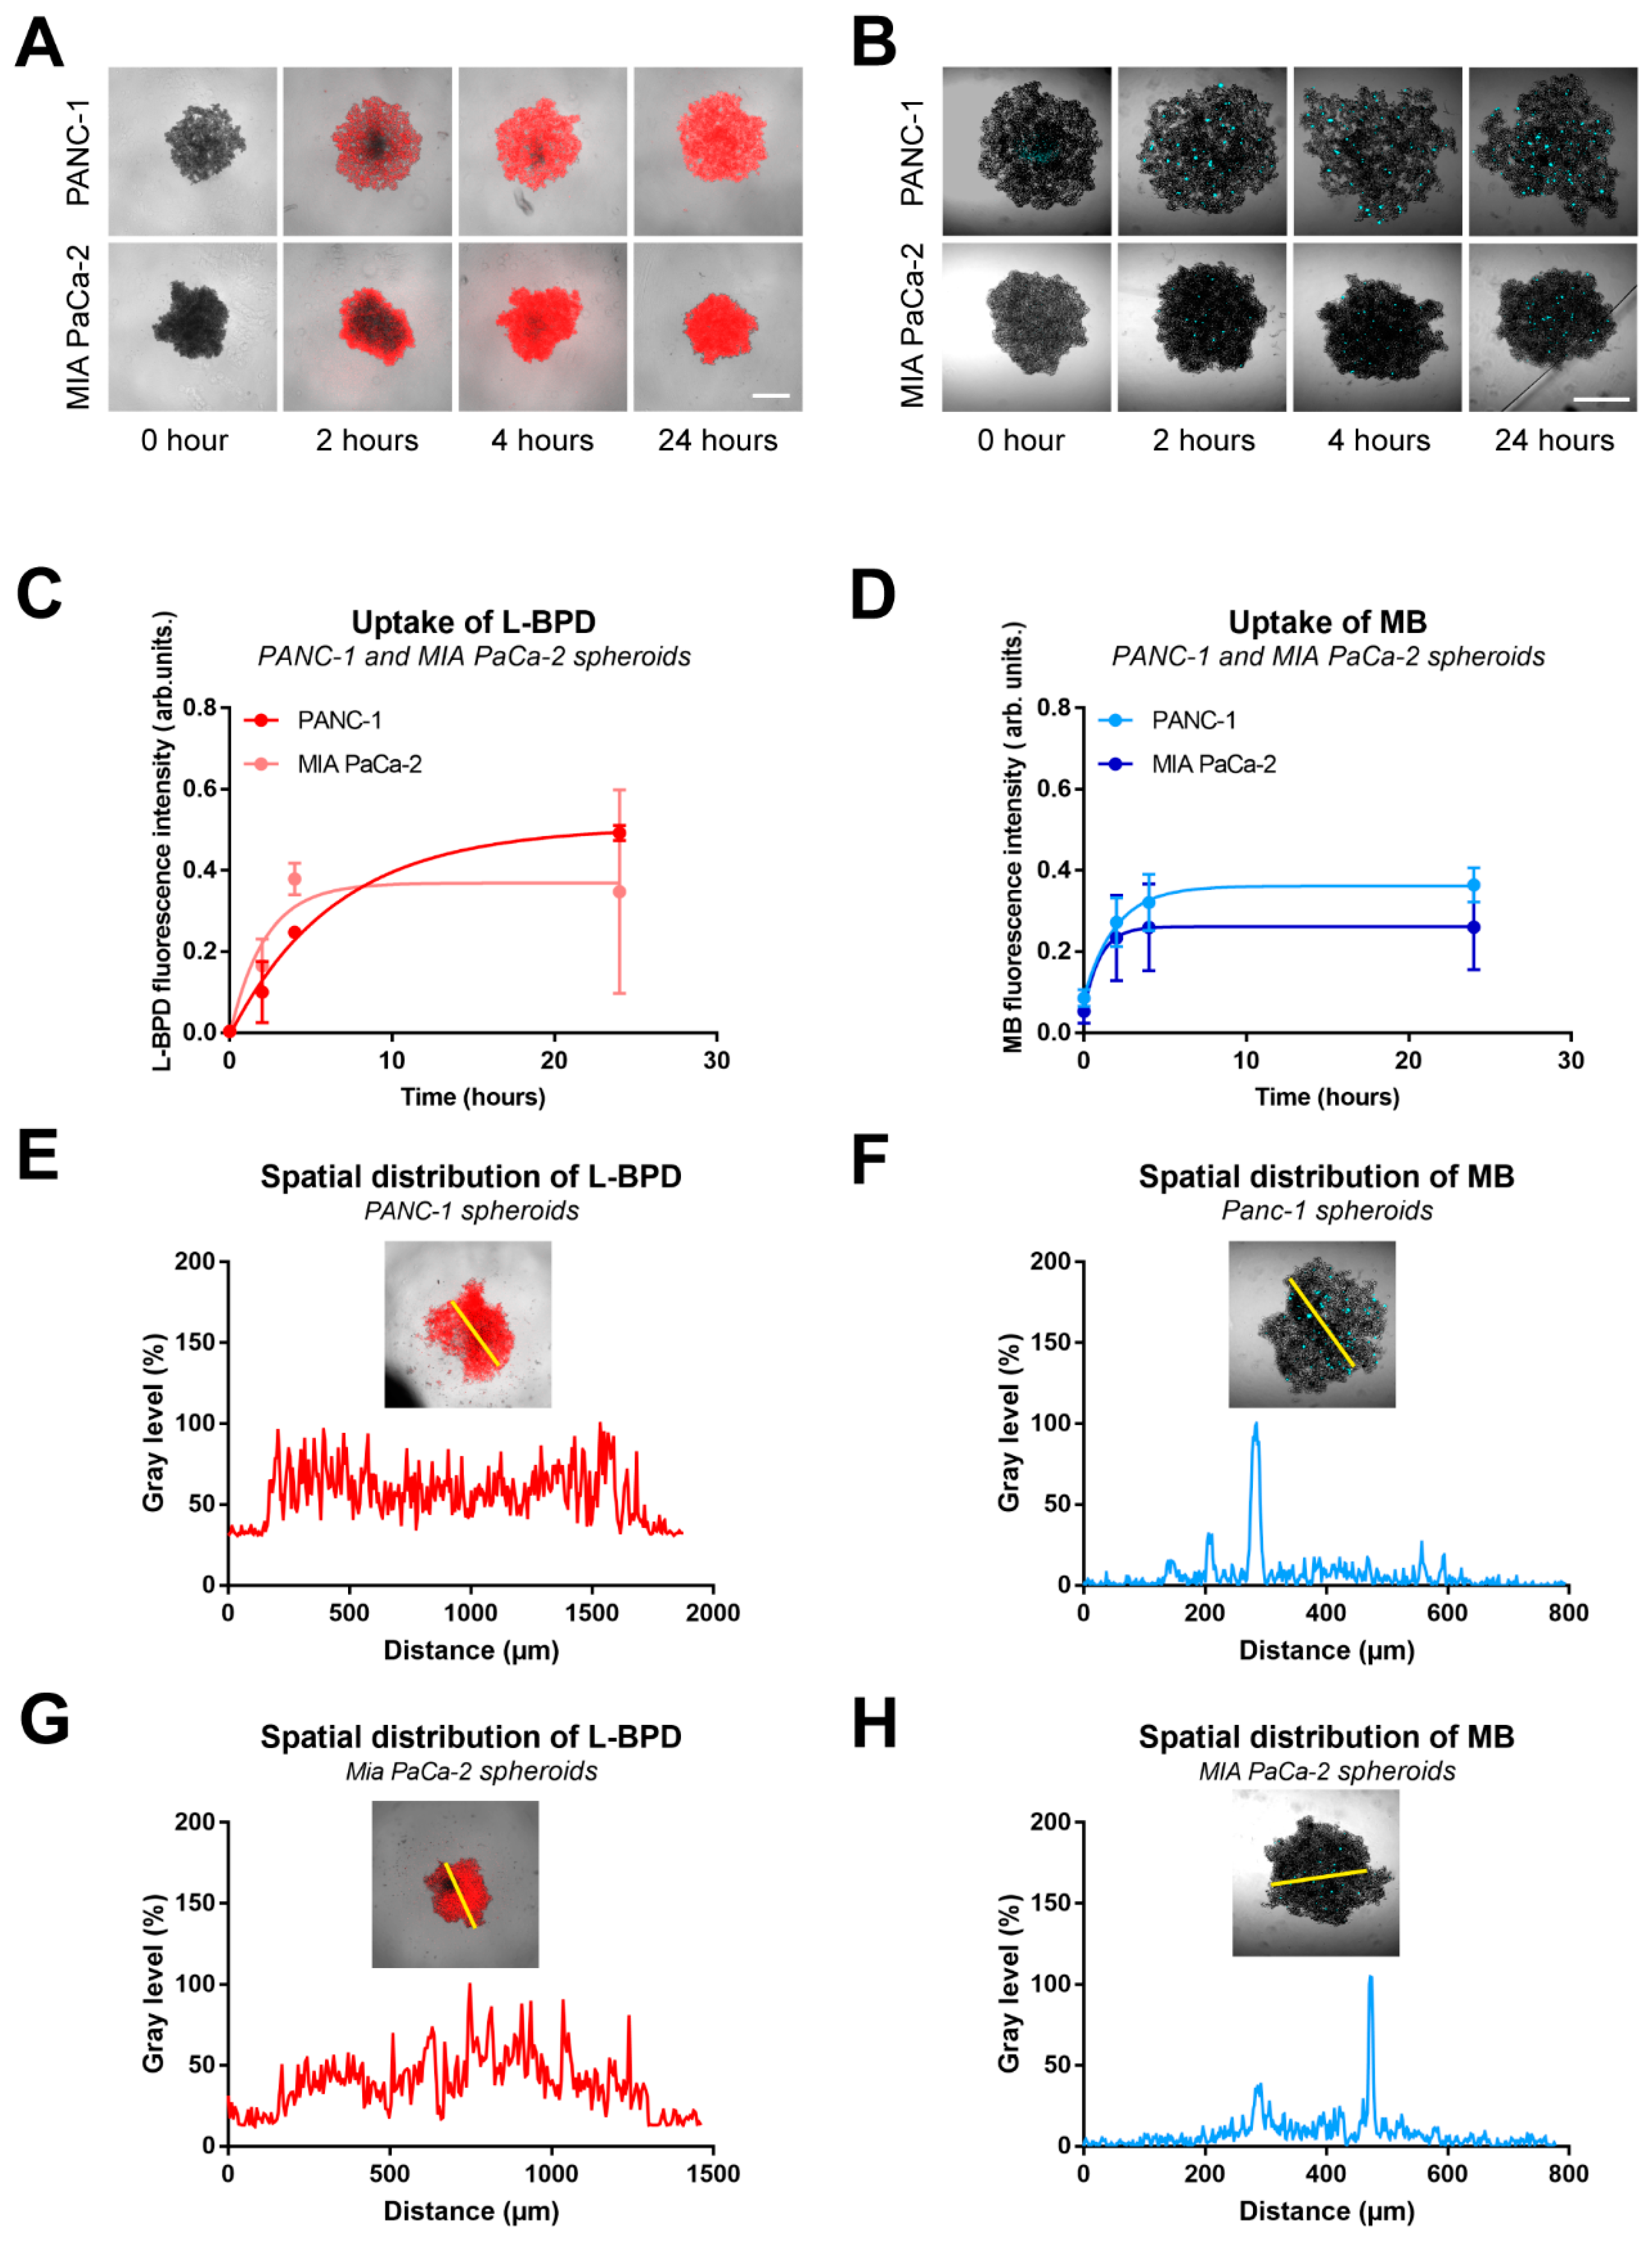
3.2. The Dark Toxicity and Uptake of L-BPD and MB in Pancreatic Cancer Spheroids

To define a suitable photosensitizer dose and incubation time before illumination, the dark toxicity and uptake of both photosensitizers were investigated. Since our different treatments may disintegrate the spheroid integrity, the detached cells could occupy a larger area, which is what is analyzed by our CALYPSO quantitative analysis. This is why it is very important not only to quantify the size/area of a spheroid, but also its viability and the extent of necrosis. In the dark, after 72 h of incubation and up to a photosensitizer concentration of 10 µM, neither the viability, spheroid size, nor the extent of necrosis was influenced in the PDAC spheroids (Figure 2). At 20 µM, a minor trend towards a lower spheroid size (MB, PANC-1 (Figure 2B)) and a lower viability (MB & L-BPD, MIA PaCa-2 (Figure 2D,F)) was observed. Albeit minimal, findings suggest that both photosensitizers have negligible dark toxicity, and are well tolerated up to concentrations of 20 µM.
Interestingly, the photosensitizer uptake in spheroids was dependent on both photosensitizer type and cell line (Figure 3). Using one phase association curve fit, we determined that the uptake half-time of L-BPD was 4.5 and 1.5 h for PANC-1 and MIA PaCa-2, respectively (Figure 3C). For MB, uptake half-time was 1.35 and 0.68 h for PANC-1 and MIA PaCa-2 spheroids (Figure 3D). Furthermore, by assessing the photosensitizer spatial distribution at a focal plane of 40 µm, we observed that L-BPD was homogeneously distributed within both PANC-1 and MIA PaCa-2 spheroids (Figure 3E,G). In contrast, the distribution of MB was highly heterogeneous, and localized in distinct foci within the spheroids (Figure 3F,H). The difference in uptake kinetics between PANC-1 and MIA PaCa-2 are likely explained by the different spheroid morphologies: rapid penetration occurs in the rather loose aggregates of MIA PaCa-2 cells, whereas the photosensitizers require more time to penetrate fully into the denser PANC-1 spheroids. In addition, the intrinsic properties of the different photosensitizer formulation may also play a role [26,38]. Based on the results, an incubation time of 4 h was selected for all further experiments.

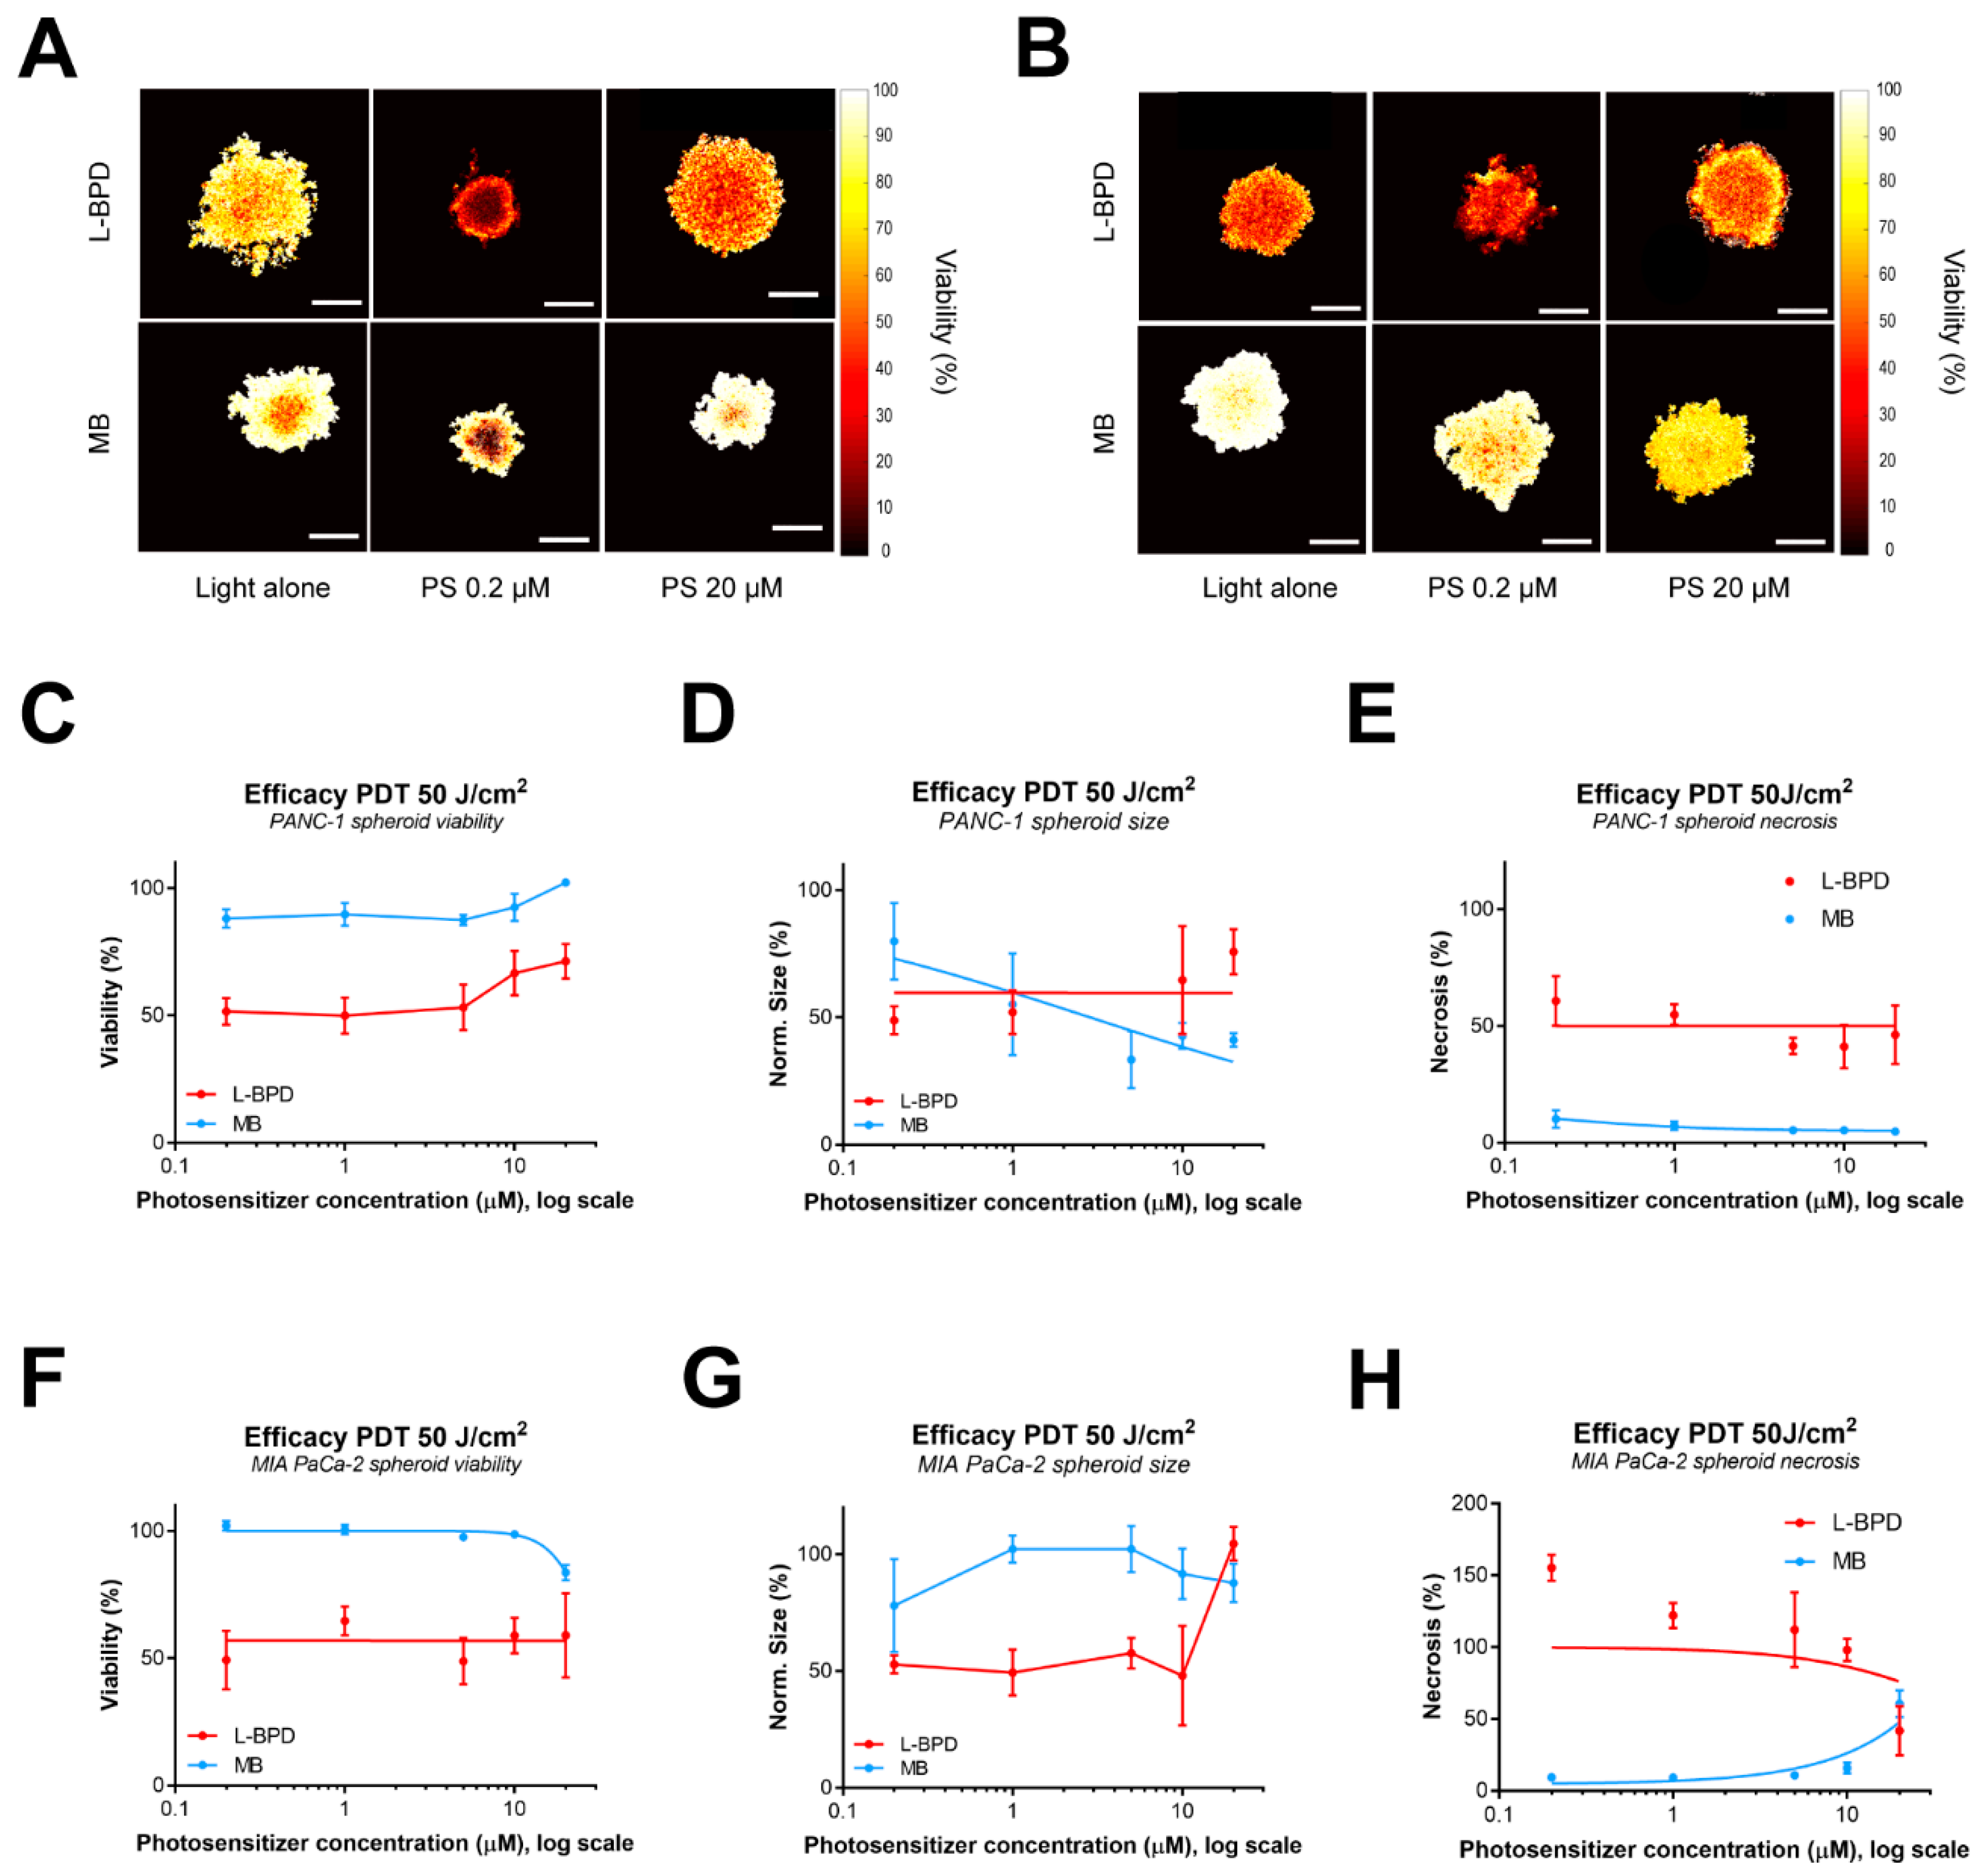
3.3. The Effect of Photosensitzer Dose on PDT Efficacy of L-BPD and MB in Pancreatic Cancer Spheroids

Following the PDT settings described in Figure S1, we next evaluated the PDT efficacy of both photosensitizers. First, the PDT efficacy was investigated at 50 J/cm2 with varying photosensitizer concentrations ranging from 0.2–20 µM (Figure 4). For any photosensitizer concentration, L-BPD was shown to be more efficient than MB. Inspection of the PANC-1 spheroid viability (Figure 4C) shows that both photosensitizers follow the same constant trend with a slight viability increase at high concentrations. Upon analysis of the necrosis data, no influence on necrosis was detected when changing the photosensitizer concentration (Figure 4E). Regarding the size of PANC-1 spheroids after PDT, no variation was observed with L-BPD. In contrast, a noticeable dose-response decrease was observed with MB (Figure 4D). Concerning MIA PaCa-2 spheroids, L-BPD did not exhibit photosensitizer dose-responses in terms of viability and necrosis, with the exception of the highest tested dose (Figure 4F,H). Finally, no dose-response could be determined regarding the size in both L-BPD and MB treated spheroids (Figure 4G). As a whole, the efficiency of L-BPD is higher at low concentrations, whereas MB efficiency increases at high concentrations. The data suggests that L-BPD treatment relies on necrosis for both PDAC spheroid models, whereas MB increases MIA PaCa-2 necrosis extent while its effect potentially relies on apoptosis and growth inhibition in PANC-1 spheroids.
We next evaluated the PDT-efficacy of L-BPD and MB at different radiant exposures. PDAC spheroids were incubated with either 0.2 µM L-BPD or 20 µM MB, exposed to radiant exposures in the range of 5–50 J/cm2, after which the treatment efficacy was determined 72 h post-PDT (Figure 5). The photosensitizer concentrations were chosen based on the findings in Figure 4, which correlate well with the doses of previous studies [27,29]. PDT treatment has a similar impact with L-BPD in both cell lines, inducing significant reductions in spheroid viability at a dose of 50 J/cm2 (Figure 5A,D). In contrast, the impact of MB-PDT on spheroid viability is minimal; only a minor reduction is observed in MIA PaCa-2 spheroids (Figure 5D). Upon analyzing the spheroid size after PDT, the data suggests a comparable dose-dependent decrease in PANC-1 spheroids treated with L-BPD and MB (Figure 5B). In contrast, whereas the spheroid size also decreases in a light dose-dependent manner for L-BPD-PDT in MIA PaCa-2 spheroids, no influence on spheroid size was detected for MB-PDT (Figure 5E). Analysis of the extent of necrosis revealed a similar dose-response curve in PANC-1 spheroids as for the viability (Figure 5C). In MIA PaCa-2 spheroids, the necrosis revealed a substantially stronger light dose response compared to the viability and size analysis (Figure 5F). Taken together, these findings demonstrate that the efficacy of PDT is not only dependent on the light dose (radiant exposure), but also on the photosensitizer. Moreover, the PDT efficacy manifests in different ways in distinct spheroids. For the PANC-1 spheroids, PDT with L-BPD reduces both cell viability and spheroid size, whereas the treatment MB-PDT reduces spheroid size but neither reduces viability nor increases necrosis. This difference between the effects of L-BPD and MB regarding size and viability may relate to different photosensitizer localization; extracellular L-BPD or intracellular localization to lysosomes and plasma membranes [27] may primarily induce necrosis in PANC-1 spheroids, whereas intracellular MB may be more efficient at inducing apoptosis or inhibiting spheroid growth. This is consistent with previous observations, demonstrating the nuclear localization of MB in cancer cell lines [39]. In MIA PaCa-2 spheroids, the organoid viability and normalized spheroid size demonstrated a similar dose-response correlation for L-BPD-PDT compared to PANC-1 spheroids. In contrast, the effects of MB were most clearly observed upon analysis of spheroid necrosis. A difference in sensitivity to nuclear oxidative damage between PANC-1 and MIA PaCa-2 cells may explain this discrepancy. Nonetheless, with both photosensitizers, a substantial treatment effect was observed at high total radiant exposures of 50 J/cm2, which we thus selected as the optimal parameter in subsequent experiments.

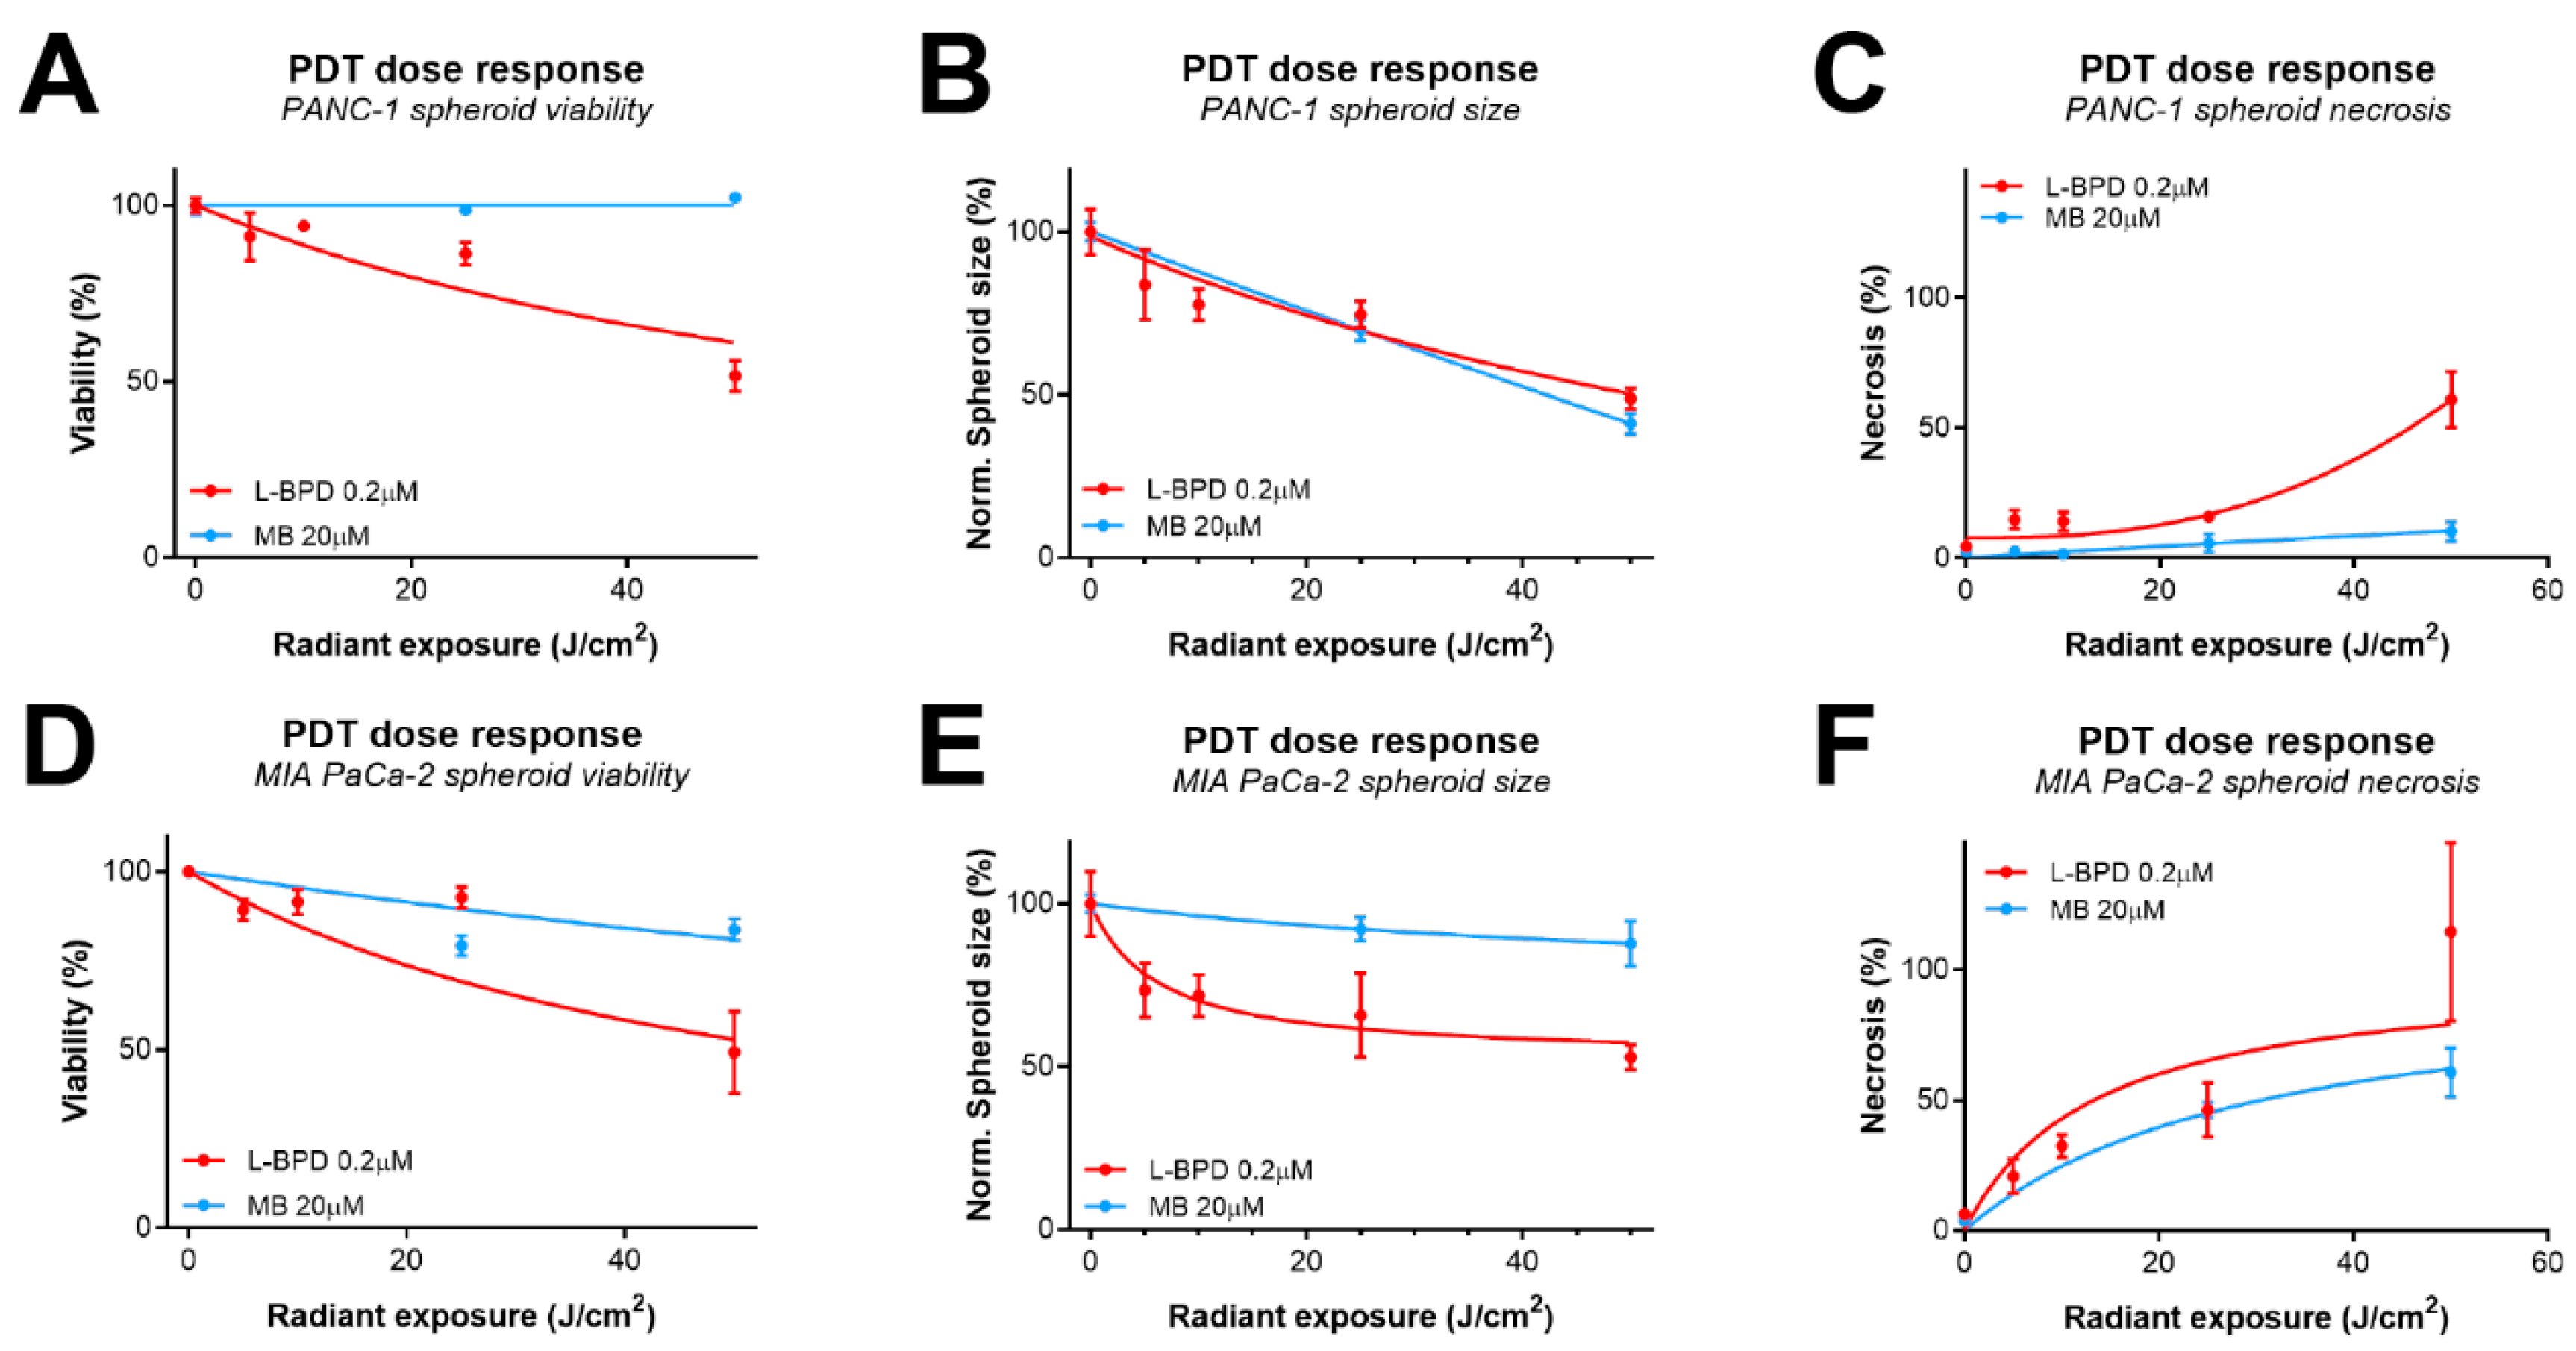
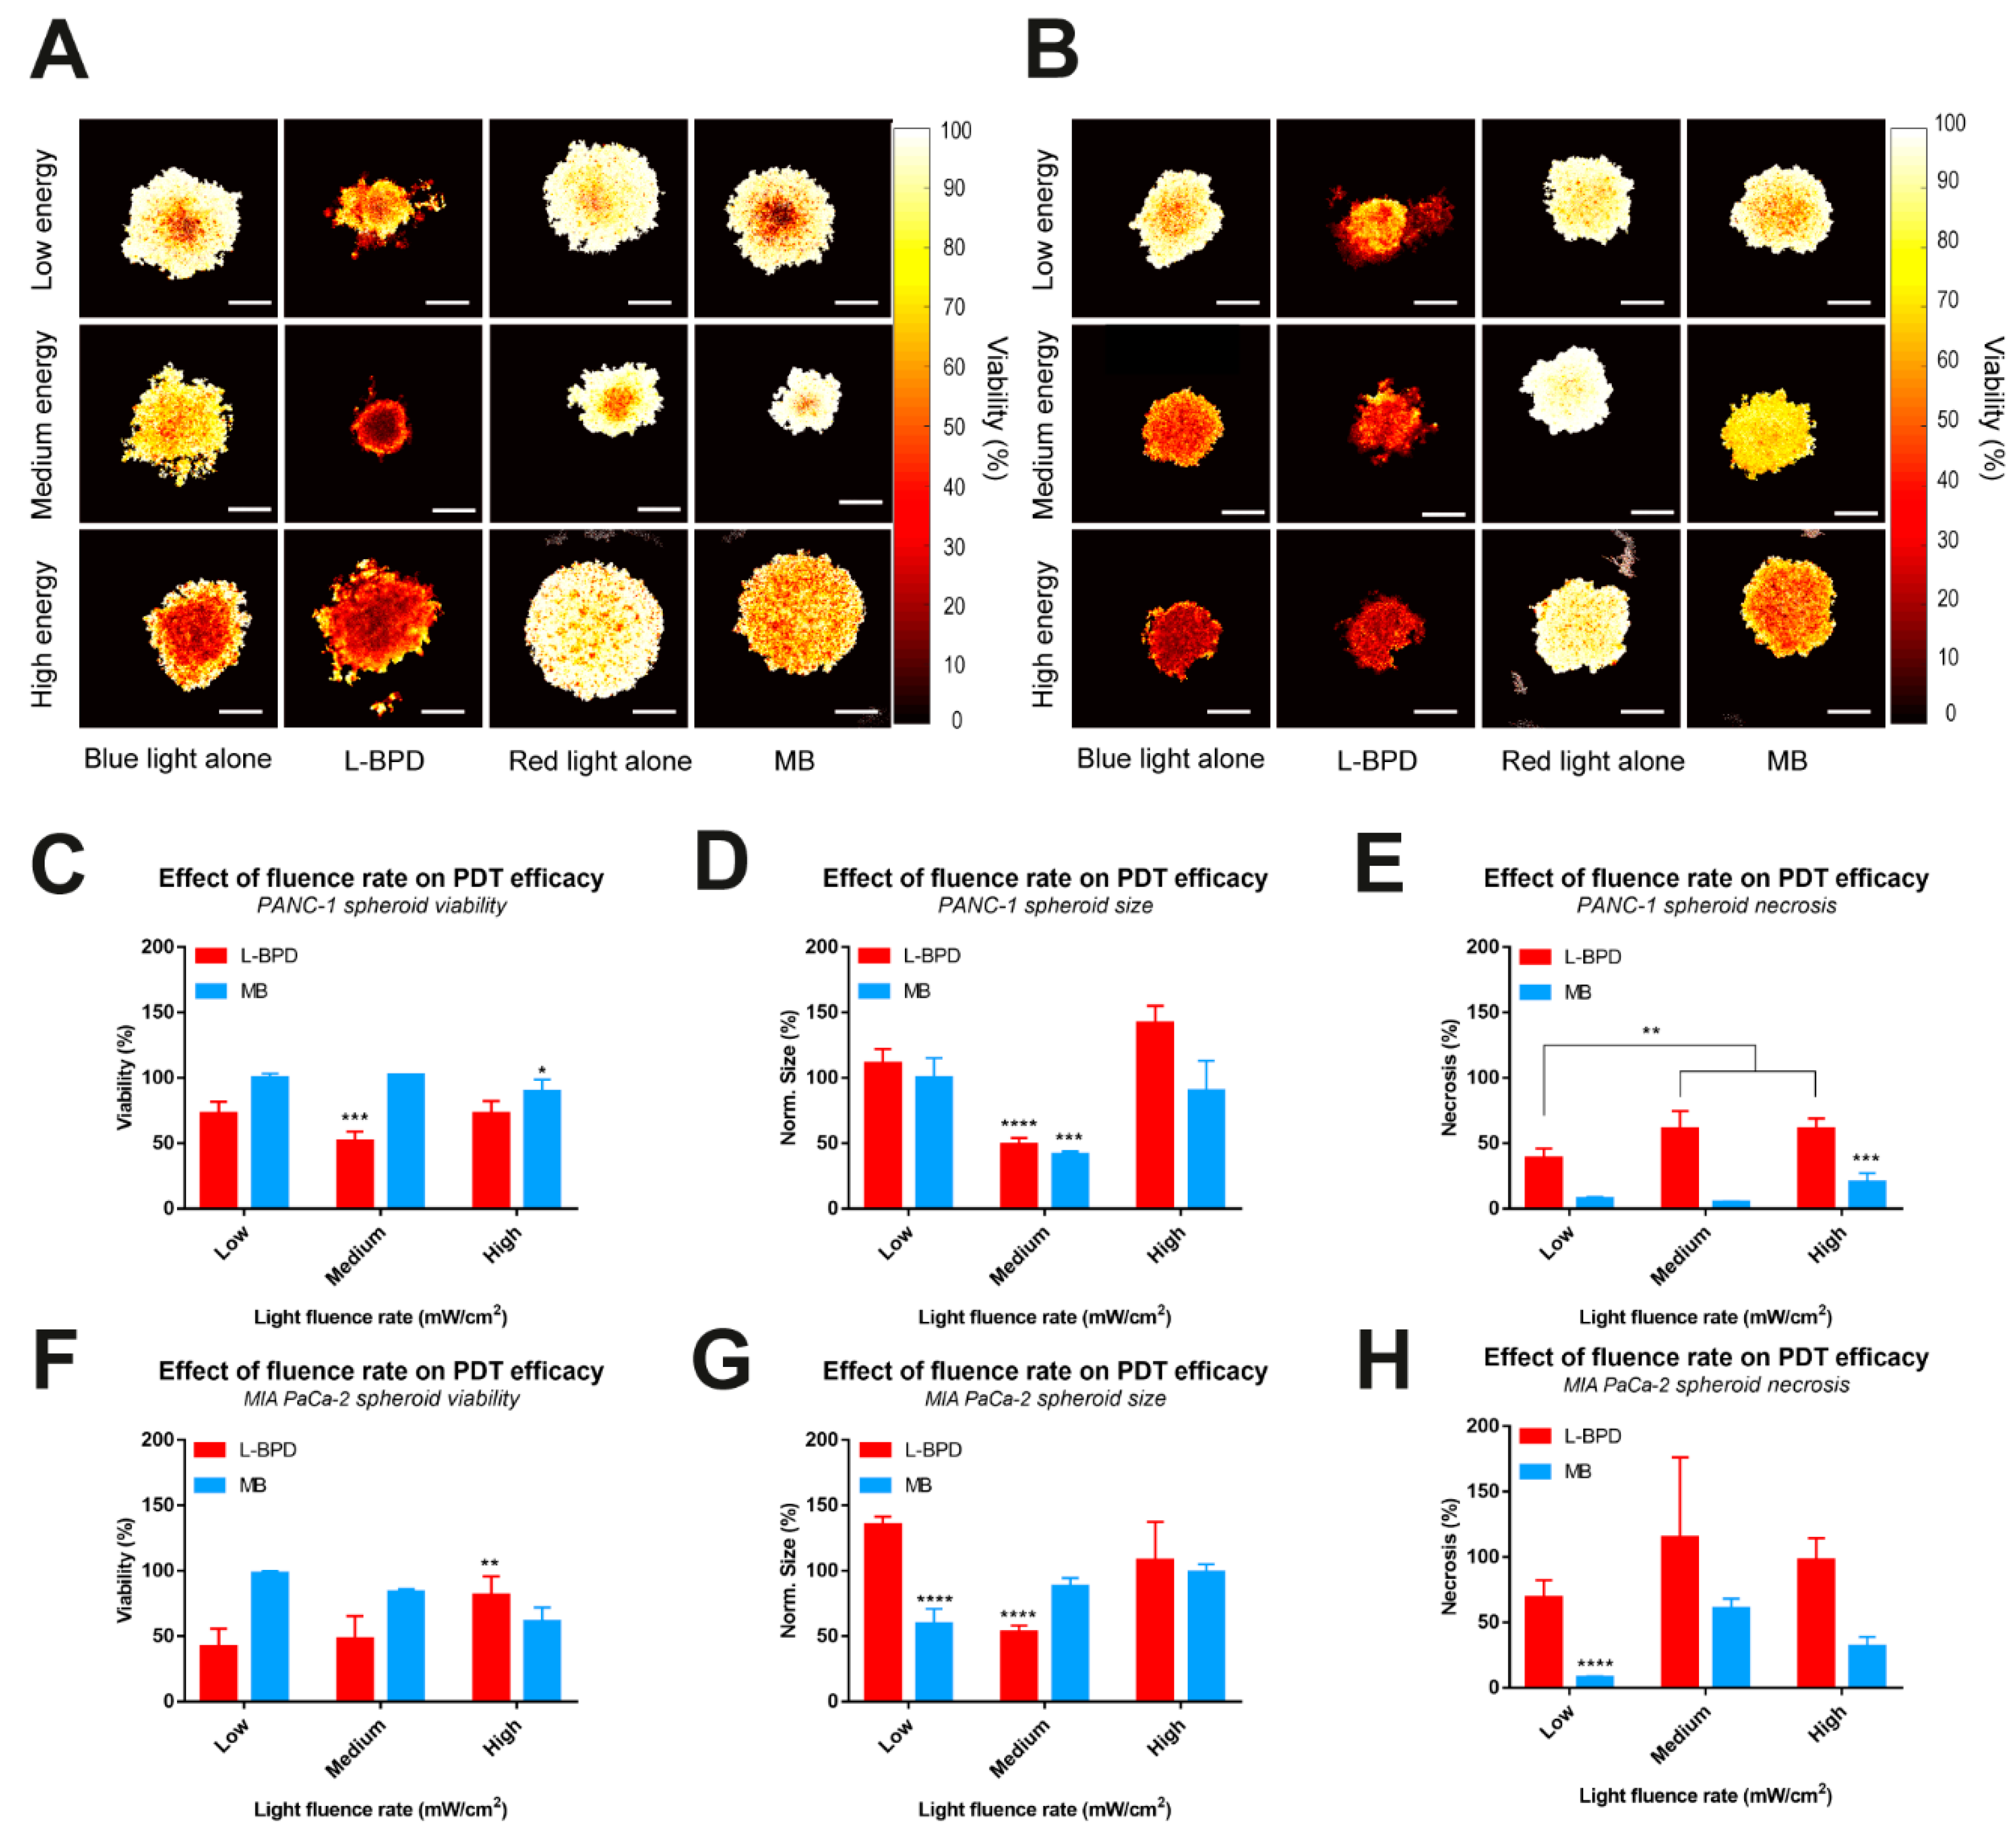
3.4. The Effect of Fluence Rate on the PDT Efficacy of L-BPD and MB

In the previous experiments, we observed a light dose-dependent PDT effect of L-BPD and MB on both PDAC spheroid models (Figure 5). Therefore, we next evaluated the efficacy of PDT with a total radiant exposure of 50 J/cm2, given at different fluence rates: either low (78 mW/cm2 for 420 nm, 93 mW/cm2 for 660 nm), medium (171 mW/cm2 for 420 nm, 187 mW/cm2 for 660 nm), and high (235 mW/cm2 for 420 nm, 280 mW/cm2 for 660 nm).
First of all, heatmaps clearly indicate a toxicity of blue light (420 nm) when medium and high fluence rates are used, on both PANC-1 and MIA PaCa-2 spheroids (Figure 6A,B). However, no toxicity is observed for blue light at the low fluence rate, as well as for red light (660 nm) at low, medium, and high fluence rates.
In PANC-1 spheroids, a viability of 51.6 ± 7.3% was observed using L-BPD irradiated at a fluence rate of 170 mW/cm2, which is significantly lower than spheroids treated at low (78 mW/cm2) and high (235 mW/cm2) fluence rates (viabilities of 72.3 ± 9.4% and 72.6 ± 9.7%) respectively. In MB-treated spheroids, we observed a significantly lower viability (89.5 ± 9.3%) when irradiation was performed at the highest fluence rate, in comparison to the low (99.7 ± 3.6%) and medium (120.2 ± 0.5%) fluence rates (Figure 6C). These results are confirmed by quantifying the extent of necrosis, which was significantly higher when PANC-1 spheroids were treated with medium and high fluence rates for both photosensitizers (Figure 6E). In both L-BPD and MB treated PANC-1 spheroids, a statistically significant size reduction was observed following the irradiation at the intermediate fluence rate compared to low and high fluence rates (Figure 6D).
In MIA PaCa-2 spheroids, the viability following MB-PDT is significantly decreasing in a fluence rate-dependent manner, whereas conversely, viabilities of 41.8 ± 13.9, 47.9 ± 17.6, and 81.3 ± 14.5% were observed with L-BPD-treated MIA PaCa-2 spheroids at low, medium, and high fluence rates respectively (Figure 6F). In terms of necrosis, for L-BPD-treated MIA PaCa-2 spheroids, no statistical differences were observed between the different fluence rates (Figure 6H). However, significantly higher necrosis was observed in MB-treated MIA PaCa2- spheroids illuminated at medium (60.6 ± 7.5%) and high (31.4 ± 7.5%) fluence rates, in comparison with spheroids treated at a low (7.8 ± 1.0%) fluence rate (Figure 6H) confirming the results obtained in terms of viability. In L-BPD treated MIA PaCa-2 spheroids, a significant size reduction is observed when a medium energy is applied, in comparison to spheroids treated with low and high fluence rates (Figure 6G). Finally, a significant reduction of MB-treated MIA PaCa-2 spheroid size was observed when the lower fluence rate was applied (Figure 6G).
Altogether, the results suggest that, in the case of L-BPD, the fluence rate is of minor impact in comparison to the total radiant exposure delivered to the photosensitizer. Indeed, whereas light dose-dependent PDT effects could be observed in terms of spheroid viability, size, and necrosis (Figure 4), no clear trends could be observed herein even if a mild fluence rate-dependent effect in terms of necrosis could be observed on PANC-1 spheroids (Figure 6E). However, 420 nm blue light, required for L-BPD excitation, clearly becomes cytotoxic at fluence rates ≥170 mW/cm2 (Figure 6A,B), which is likely a photothermal effect. This effect complicates a clear assessment of the L-BPD PDT efficacy alone.
Concerning MB treatment, interesting fluence rate-dependent effects could be observed on PANC-1 spheroids in terms of viability, and on MIA PaCa-2 spheroids for both viability and extent of necrosis. Those results show that high photosensitizer concentrations, associated with high radiant exposures as well as high fluence rates, could be interesting for MB-PDT of spheroids. Nonetheless, L-BPD is generally more efficient than MB, even at doses that are 100 times lower (Figure 6), which confirms the results observed in the previous experiments.

4. Discussion

Although PDT is well-established as a potent cancer therapy, it remains a treatment with a large number of variables, ranging from pharmacological, physical, and biological parameters. The pharmacological parameters include the photosensitizer type, concentration, and uptake efficiency. As mentioned, nanoparticular formulations are increasingly used for improving the biocompatibility and cancer specificity of photosensitizers, and these may influence the pharmacological behavior of the included photosensitizers, including uptake efficiency and intratumor- and intracellular localization. Inspired by previous works in which various PDT dose parameters were systematically optimized for specific photosensitizers [18,19,20,23,24,28], we set out to determine the effects of the photophysical parameters of light fluence (radiant exposure) and fluence rate of L-BPD and MB, which represent two widely used photosensitizers. We evaluated the application of two state-of-the-art 96-well LED arrays for the treatment of cancer spheroids with PDT. A 420 nm violet light array was selected as it overlaps with the Soret band of a plethora of porphyrins, and may thus be useful as a versatile excitation source for this class of photosensitizers. A second array of 660 nm was selected as it overlaps with the absorption peak of various photosensitizers, such as phthalocyanines, chlorins, and MB.
Regarding the efficacy of L-BPD, we demonstrate that L-BPD is a potent photosensitizer upon 420 nm excitation, with limited dark toxicity and good spheroid penetration. In further studies on L-BPD, our findings suggest using a drug-light interval of at least 4 h, and BPD concentrations in the range of 0.1–1 µM. The PDT efficacy is then best investigated as a function of total radiant exposure. Nonetheless, great care must be taken to avoid any phototoxic effects of the 420 nm excitation light alone by not exceeding fluence rates of 73 mW/cm2. These results correlate well to previous findings. A study by Rizvi et al. demonstrated that PDT with a dose of 0.25 µM was more effective than 1 and 10 µM in 3D culture models of ovarian cancer. It was also shown that at a dose of 10 µM, the fluence rate was inversely related to treatment efficacy. Moreover, when trying to produce the same cytotoxic response using 10 µM of BPD, a reduction in fluence rate from 150 to 0.5 mW/cm2 was necessary [28].
Regarding MB, our findings show that MB is a rather poor photosensitizer for PDT of cancer spheroids, despite showing excellent PDT efficacy in cell-free assays. This is likely a result of poor spheroid uptake and aggregation. Treatment with doses exceeding 20 µM is possible due to the low dark toxicity of MB, yet it is not clear if this will lead to a better uptake and more homogeneous intratumor distribution. Our findings correlate relatively well to various previous studies. The efficacy of MB has previously been evaluated in lung cancer cell lines, in which a MB dose of 160 µM, and a radiant exposure of 95 J/cm2 (660 nm) was applied. Although light alone was non-toxic, MB alone had significant dark toxicity, inducing >50% cell death. The combination, i.e., MB-PDT, was effective with a 95% reduction in viability. It should be mentioned that the fluence rate could not be retrieved. Despite poor in vitro findings, in vivo findings have demonstrated that MB holds potential for PDT of solid cancers. In a subcutaneous mouse xenograft model of colorectal cancer, MB was shown effective at a dose of 100 J/cm2 (660 nm). Decreasing the fluence rate from 100 to 50 mW/cm2 resulted in a significantly increased PDT efficacy [34]. However, it is worth noting that those results were obtained upon intratumor injection, which remove the issues linked to the uptake of MB. Similar results were obtained in subcutaneous lung carcinoma xenografts in mice and in a hamster model of oral cancer [33]. PDT was shown effective at a radiant exposure of 200 J/cm2. In both cases, 50–150 µL of a 1% w/v (31.3 mM) solution of MB was injected, confirming the need for high MB doses for effective PDT. The poor performance of MB may suggest that nanoparticular encapsulation may be explored to improve its uptake and efficacy for the treatment of cancer [32].
Aspects that were not investigated for L-BPD and MB in this study include the drug-light interval and continuous versus fractionated PDT regiments. We selected the drug-light interval based on the uptake assays described in Figure 3, demonstrating near-maximal photosensitizer accumulation after 4 h of incubation. For subsequent experiments, we assumed that the higher the tumor accumulation of the photosensitizer, the higher the PDT efficacy. However, it has been shown that the intracellular localization of photosensitizers changes over time, and this may affect the PDT efficacy [26]. Moreover, we and others [28] have shown that higher photosensitizer doses, especially for (L-)BPD, do not necessarily improve treatment outcomes. At high concentrations, BPD may be quenched and exhibit lower PDT efficacy, which may explain the lack of a clear photosensitizer-dose response in Figure 4. Regarding continuous versus fractionated PDT regimens, a multitude of comparisons are possible, which is why such parameters were not included in this study. Benefits of a fractionated regime (e.g., twice 25 J/cm2) versus a continuous irradiation (once 50 J/cm2) includes the re-oxygenation of the cancer tissues during the fractionated regime [19,23]. Another benefit may be the reduction of photothermal effects during prolonged irradiation, which may be especially relevant for irradiation with blue light. The phototoxic effects of blue light in absence of PDT are an additional and strong rationale for using 690 nm light for the excitation of (L-)BPD. Ongoing studies will compare the impact of these factors (drug-light interval, fractionation, blue versus red light) on the PDT efficacy.
Although three dimensional culture models are promising models that bridge the gap between in vitro and in vivo experimentation in translational oncology [40]; our study utilizes spheroids as a rather simple 3D culture model. The effects of the cancer stroma, which are especially important for pancreatic cancer, are not taken into account. Previous studies have shown that addition of fibroblasts to PDAC spheroids induces spheroid compression and may greatly limit the diffusion of therapeutics into the spheroid masses [21,41,42,43]. Similar observations have been made on heterotypic microtumors in which cancer cells were co-cultured with cancer-associated fibroblasts. Thus, although the effects of the photophysical parameters defined in this study may be universally applied to spheroid and organoid models, the pharmacological variables (photosensitizer dose and drug-light interval) likely require optimization in a model-dependent manner. Finally, it is worth noting that within 3D culture models there is substantial heterogeneity between cells in terms of drug exposure, as well as nutrient and oxygen gradients that can influence treatment susceptibility [40,44,45,46,47]. In this study, we have assessed the effects of PDT on a more macroscopic level using in situ staining and low-magnification microscopy, which does not take into account any effects on the individual cell level. Whereas the dissociation of spheroids and organoids to detect modes of cell death by flow cytometry is technically feasible, the procedure itself it can lead to substantial amounts of cell death [41], which challenges the accuracy of single cell analyses such as flow cytometry. Flow cytometry is thus best used for 2D cell cultures, where obtaining single-cell suspensions is less problematic. Nonetheless, annexin V and propidium iodide staining in situ may be feasible, as was recently shown by Karimnia et al. [48]. High resolution confocal microscopy, combined with optical clearing, may be a more promising method to study treatment effects on the individual cell levels within 3D cancer models [49].

5. Conclusions

The efficacy of photosensitizers for the treatment of cancer with PDT requires a careful optimization of the PDT dose parameters. This study clearly demonstrates that variations in the photosensitizer type, photosensitizer dose, light dose, and the light dose-rate have a strong impact on the overall PDT efficacy in 3D culture models of pancreatic cancer. The optimization of these parameters for fundamental and translational studies should be carefully performed, and the publication of such findings should be encouraged to expedite research and development towards new light sources, photosensitizers, and nanoformulations of photosensitizers for PDT.

Supplementary Materials

The following supporting information can be downloaded at: https://www.mdpi.com/article/10.3390/onco2010002/s1, Figure S1: Photodynamic therapy settings for the treatment of pancreatic cancer spheroids by either MB or L-BPD.

Author Contributions

Conceptualization, T.L.C. and M.B.; Data Curation, N.M.C.G., N.P.-S. and M.B.; Formal Analysis, T.L.C., N.M.C.G. and M.B.; Funding Acquisition, M.B.; Investigation, T.L.C., N.M.C.G., N.P.-S., J.-L.C. and M.B.; Methodology, T.L.C., N.M.C.G., N.P.-S. and M.B.; Project Administration, M.B.; Resources, J.-L.C. and M.B.; Supervision, T.L.C., J.-L.C. and M.B.; Validation, T.L.C. and M.B.; Visualization, T.L.C., N.M.C.G. and M.B.; Writing—Original Draft, T.L.C., N.M.C.G., N.P.-S., J.-L.C. and M.B.; Writing—Review and Editing, T.L.C., N.M.C.G., N.P.-S., J.-L.C. and M.B. All authors have read and agreed to the published version of the manuscript.

Funding

This research was funded by the Phospholipid Research Center, Heidelberg, Germany, grant number MAB-2020-080/1-1 and the Institut National de la Santé et de la Recherche Medicale (INSERM, Paris France).

Institutional Review Board Statement

Not applicable.

Informed Consent Statement

Not applicable.

Data Availability Statement

All data is available upon request.

Acknowledgments

The authors are grateful to Anne-Laure Bulin (Synchrotron Radiation for Biomedicine, INSERM, Grenoble-Alpes University, Grenoble, France) for her help with the quantitative image analysis.

Conflicts of Interest

The authors declare no conflict of interest.

References

  1. Christensen, E.; Warloe, T.; Kroon, S.; Funk, J.; Helsing, P.; Soler, A.M.; Stang, H.J.; Vatne, O.; Mørk, C. Norwegian Photodynamic Therapy (PDT) Group Guidelines for Practical Use of MAL-PDT in Non-Melanoma Skin Cancer. J. Eur. Acad. Dermatol. Venereol. 2010, 24, 505–512. [Google Scholar] [CrossRef]
  2. Hopper, C.; Niziol, C.; Sidhu, M. The Cost-Effectiveness of Foscan Mediated Photodynamic Therapy (Foscan-PDT) Compared with Extensive Palliative Surgery and Palliative Chemotherapy for Patients with Advanced Head and Neck Cancer in the UK. Oral Oncol. 2004, 40, 372–382. [Google Scholar] [CrossRef]
  3. Meulemans, J.; Delaere, P.; Vander Poorten, V. Photodynamic Therapy in Head and Neck Cancer: Indications, Outcomes, and Future Prospects. Curr. Opin. Otolaryngol. Head Neck Surg. 2019, 27, 136–141. [Google Scholar] [CrossRef]
  4. Ohtani, K.; Ikeda, N. Photodynamic Therapy for Lung Cancer. Kyobu Geka 2016, 69, 694–699. [Google Scholar]
  5. Usuda, J.; Kato, H.; Okunaka, T.; Furukawa, K.; Tsutsui, H.; Yamada, K.; Suga, Y.; Honda, H.; Nagatsuka, Y.; Ohira, T.; et al. Photodynamic Therapy (PDT) for Lung Cancers. J. Thorac. Oncol. 2006, 1, 489–493. [Google Scholar] [CrossRef] [Green Version]
  6. Gheewala, T.; Skwor, T.; Munirathinam, G. Photosensitizers in Prostate Cancer Therapy. Oncotarget 2017, 8, 30524–30538. [Google Scholar] [CrossRef] [PubMed] [Green Version]
  7. Windahl, T.; Andersson, S.O.; Lofgren, L. Photodynamic Therapy of Localised Prostatic Cancer. Lancet 1990, 336, 1139. [Google Scholar] [CrossRef]
  8. Yano, T.; Wang, K.K. Photodynamic Therapy for Gastrointestinal Cancer. Photochem. Photobiol. 2020, 96, 517–523. [Google Scholar] [CrossRef] [PubMed]
  9. Pereira, S. Photodynamic Therapy for Pancreatic and Biliary Tract Cancer: The United Kingdom Experience. J. Natl. Compr. Canc. Netw. 2012, 10 (Suppl. 2), S48–S51. [Google Scholar] [CrossRef] [Green Version]
  10. Huggett, M.T.; Jermyn, M.; Gillams, A.; Illing, R.; Mosse, S.; Novelli, M.; Kent, E.; Bown, S.G.; Hasan, T.; Pogue, B.W.; et al. Phase I/II Study of Verteporfin Photodynamic Therapy in Locally Advanced Pancreatic Cancer. Br. J. Cancer 2014, 110, 1698–1704. [Google Scholar] [CrossRef] [Green Version]
  11. Celli, J.P.; Solban, N.; Liang, A.; Pereira, S.P.; Hasan, T. Verteporfin-Based Photodynamic Therapy Overcomes Gemcitabine Insensitivity in a Panel of Pancreatic Cancer Cell Lines. Lasers Surg. Med. 2011, 43, 565–574. [Google Scholar] [CrossRef] [PubMed] [Green Version]
  12. Fan, B.-G.; Andrén-Sandberg, A. Photodynamic Therapy for Pancreatic Cancer. Pancreas 2007, 34, 385–389. [Google Scholar] [CrossRef]
  13. Banerjee, S.M.; El-Sheikh, S.; Malhotra, A.; Mosse, C.A.; Parker, S.; Williams, N.R.; MacRobert, A.J.; Hamoudi, R.; Bown, S.G.; Keshtgar, M.R. Photodynamic Therapy in Primary Breast Cancer. J. Clin. Med. 2020, 9, 483. [Google Scholar] [CrossRef] [Green Version]
  14. Castano, A.P.; Demidova, T.N.; Hamblin, M.R. Mechanisms in Photodynamic Therapy: Part One-Photosensitizers, Photochemistry and Cellular Localization. Photodiagnosis Photodyn. Ther. 2004, 1, 279–293. [Google Scholar] [CrossRef] [Green Version]
  15. Xu, S.; Bulin, A.-L.; Hurbin, A.; Elleaume, H.; Coll, J.-L.; Broekgaarden, M. Photodynamic Diagnosis and Therapy for Peritoneal Carcinomatosis: Emerging Perspectives. Cancers 2020, 12, 2491. [Google Scholar] [CrossRef]
  16. Dolmans, D.E.J.G.J.; Fukumura, D.; Jain, R.K. Photodynamic Therapy for Cancer. Nat. Rev. Cancer 2003, 3, 380–387. [Google Scholar] [CrossRef]
  17. Chen, Q.; Chopp, M.; Dereski, M.O.; Wilson, B.C.; Patterson, M.S.; Schreiber, A.; Hetzel, F.W. The Effect of Light Fluence Rate in Photodynamic Therapy of Normal Rat Brain. Radiat. Res. 1992, 132, 120–123. [Google Scholar] [CrossRef] [PubMed]
  18. Henderson, B.W.; Busch, T.M.; Snyder, J.W. Fluence Rate as a Modulator of PDT Mechanisms. Lasers Surg. Med. 2006, 38, 489–493. [Google Scholar] [CrossRef]
  19. Iinuma, S.; Schomacker, K.T.; Wagnieres, G.; Rajadhyaksha, M.; Bamberg, M.; Momma, T.; Hasan, T. In Vivo Fluence Rate and Fractionation Effects on Tumor Response and Photobleaching: Photodynamic Therapy with Two Photosensitizers in an Orthotopic Rat Tumor Model. Cancer Res. 1999, 59, 6164–6170. [Google Scholar]
  20. Foster, T.H.; Hartley, D.F.; Nichols, M.G.; Hilf, R. Fluence Rate Effects in Photodynamic Therapy of Multicell Tumor Spheroids. Cancer Res. 1993, 53, 1249–1254. [Google Scholar]
  21. Broekgaarden, M.; Anbil, S.; Bulin, A.-L.; Obaid, G.; Mai, Z.; Baglo, Y.; Rizvi, I.; Hasan, T. Modulation of Redox Metabolism Negates Cancer-Associated Fibroblasts-Induced Treatment Resistance in a Heterotypic 3D Culture Platform of Pancreatic Cancer. Biomaterials 2019, 222, 119421. [Google Scholar] [CrossRef]
  22. Broekgaarden, M.; Weijer, R.; van Gulik, T.M.; Hamblin, M.R.; Heger, M. Tumor Cell Survival Pathways Activated by Photodynamic Therapy: A Molecular Basis for Pharmacological Inhibition Strategies. Cancer Metastasis Rev. 2015, 34, 643–690. [Google Scholar] [CrossRef] [Green Version]
  23. Babilas, P.; Schacht, V.; Liebsch, G.; Wolfbeis, O.S.; Landthaler, M.; Szeimies, R.-M.; Abels, C. Effects of Light Fractionation and Different Fluence Rates on Photodynamic Therapy with 5-Aminolaevulinic Acid in Vivo. Br. J. Cancer 2003, 88, 1462–1469. [Google Scholar] [CrossRef] [Green Version]
  24. Angell-Petersen, E.; Spetalen, S.; Madsen, S.J.; Sun, C.-H.; Peng, Q.; Carper, S.W.; Sioud, M.; Hirschberg, H. Influence of Light Fluence Rate on the Effects of Photodynamic Therapy in an Orthotopic Rat Glioma Model. J. Neurosurg. 2006, 104, 109–117. [Google Scholar] [CrossRef]
  25. Weijer, R.; Broekgaarden, M.; Kos, M.; van Vught, R.; Rauws, E.A.J.; Breukink, E.; van Gulik, T.M.; Storm, G.; Heger, M. Enhancing Photodynamic Therapy of Refractory Solid Cancers: Combining Second-Generation Photosensitizers with Multi-Targeted Liposomal Delivery. J. Photochem. Photobiol. C Photochem. Rev. 2015, 23, 103–131. [Google Scholar] [CrossRef]
  26. Broekgaarden, M.; de Kroon, A.I.P.M.; Gulik, T.M.; van Heger, M. Development and in Vitro Proof-of-Concept of Interstitially Targeted Zinc- Phthalocyanine Liposomes for Photodynamic Therapy. Curr. Med. Chem. 2014, 21, 377–391. [Google Scholar] [CrossRef] [PubMed] [Green Version]
  27. Obaid, G.; Broekgaarden, M.; Bulin, A.-L.; Huang, H.-C.; Kuriakose, J.; Liu, J.; Hasan, T. Photonanomedicine: A Convergence of Photodynamic Therapy and Nanotechnology. Nanoscale 2016, 8, 12471–12503. [Google Scholar] [CrossRef] [PubMed]
  28. Rizvi, I.; Anbil, S.; Alagic, N.; Celli, J.; Celli, J.P.; Zheng, L.Z.; Palanisami, A.; Glidden, M.D.; Pogue, B.W.; Hasan, T. PDT Dose Parameters Impact Tumoricidal Durability and Cell Death Pathways in a 3D Ovarian Cancer Model. Photochem. Photobiol. 2013, 89, 942–952. [Google Scholar] [CrossRef]
  29. Jiang, C.; Yang, W.; Wang, C.; Qin, W.; Ming, J.; Zhang, M.; Qian, H.; Jiao, T. Methylene Blue-Mediated Photodynamic Therapy Induces Macrophage Apoptosis via ROS and Reduces Bone Resorption in Periodontitis. Oxid. Med. Cell. Longev. 2019, 2019, 1529520. [Google Scholar] [CrossRef] [Green Version]
  30. Späth, A.; Leibl, C.; Cieplik, F.; Lehner, K.; Regensburger, J.; Hiller, K.-A.; Bäumler, W.; Schmalz, G.; Maisch, T. Improving Photodynamic Inactivation of Bacteria in Dentistry: Highly Effective and Fast Killing of Oral Key Pathogens with Novel Tooth-Colored Type-II Photosensitizers. J. Med. Chem. 2014, 57, 5157–5168. [Google Scholar] [CrossRef]
  31. Shen, J.J.; Jemec, G.B.E.; Arendrup, M.C.; Saunte, D.M.L. Photodynamic Therapy Treatment of Superficial Fungal Infections: A Systematic Review. Photodiagnosis Photodyn. Ther. 2020, 31, 101774. [Google Scholar] [CrossRef]
  32. Jesus, V.P.S.; Raniero, L.; Lemes, G.M.; Bhattacharjee, T.T.; Caetano Júnior, P.C.; Castilho, M.L. Nanoparticles of Methylene Blue Enhance Photodynamic Therapy. Photodiagnosis Photodyn. Ther. 2018, 23, 212–217. [Google Scholar] [CrossRef]
  33. Dos Santos, A.F.; Terra, L.F.; Wailemann, R.A.M.; Oliveira, T.C.; Vinícius de Morais, G.; Mineiro, M.F.; Meotti, F.C.; Bruni-Cardoso, A.; Baptista, M.S.; Labriola, L. Methylene Blue Photodynamic Therapy Induces Selective and Massive Cell Death in Human Breast Cancer Cells. BMC Cancer 2017, 17, 194. [Google Scholar] [CrossRef] [Green Version]
  34. Methylene Blue Mediated Photodynamic Therapy in Experimental Colorectal Tumors in Mice—PubMed. Available online: https://pubmed.ncbi.nlm.nih.gov/11154085/ (accessed on 29 November 2021).
  35. Carioli, G.; Malvezzi, M.; Bertuccio, P.; Boffetta, P.; Levi, F.; La Vecchia, C.; Negri, E. European Cancer Mortality Predictions for the Year 2021 with Focus on Pancreatic and Female Lung Cancer. Ann. Oncol. 2021, 32, 478–487. [Google Scholar] [CrossRef]
  36. Bulin, A.-L.; Broekgaarden, M.; Hasan, T. Comprehensive High-Throughput Image Analysis for Therapeutic Efficacy of Architecturally Complex Heterotypic Organoids. Sci. Rep. 2017, 7, 16645. [Google Scholar] [CrossRef] [Green Version]
  37. Price, M.; Reiners, J.J.; Santiago, A.M.; Kessel, D. Monitoring Singlet Oxygen and Hydroxyl Radical Formation with Fluorescent Probes during Photodynamic Therapy. Photochem. Photobiol. 2009, 85, 1177–1181. [Google Scholar] [CrossRef] [Green Version]
  38. Bacellar, I.O.L.; Tsubone, T.M.; Pavani, C.; Baptista, M.S. Photodynamic Efficiency: From Molecular Photochemistry to Cell Death. Int. J. Mol. Sci. 2015, 16, 20523–20559. [Google Scholar] [CrossRef] [PubMed] [Green Version]
  39. Feng, X.; Jermain, P.; Muzikansky, A.; Ross, A.; Hamblin, M.; Yaroslavsky, A.N.; Yaroslavsky, A.N. Quantifying Subcellular Localization of Methylene Blue in Cultured Brain Cells. In Proceedings of the Frontiers in Optics + Laser Science APS/DLS (2019), Washington, DC, USA, 15–19 September 2019; Optical Society of America: Washington, DC, USA, 2019; p. JTu3A.97. [Google Scholar]
  40. Pampaloni, F.; Reynaud, E.G.; Stelzer, E.H.K. The Third Dimension Bridges the Gap between Cell Culture and Live Tissue. Nat. Rev. Mol. Cell. Biol. 2007, 8, 839–845. [Google Scholar] [CrossRef] [PubMed]
  41. Bulin, A.-L.; Broekgaarden, M.; Simeone, D.; Hasan, T. Low Dose Photodynamic Therapy Harmonizes with Radiation Therapy to Induce Beneficial Effects on Pancreatic Heterocellular Spheroids. Oncotarget 2019, 10, 2625–2643. [Google Scholar] [CrossRef] [Green Version]
  42. Broekgaarden, M.; Alkhateeb, A.; Bano, S.; Bulin, A.-L.; Obaid, G.; Rizvi, I.; Hasan, T. Cabozantinib Inhibits Photodynamic Therapy-Induced Auto- and Paracrine MET Signaling in Heterotypic Pancreatic Microtumors. Cancers 2020, 12, 1401. [Google Scholar] [CrossRef] [PubMed]
  43. Priwitaningrum, D.L.; Blondé, J.-B.G.; Sridhar, A.; van Baarlen, J.; Hennink, W.E.; Storm, G.; Le Gac, S.; Prakash, J. Tumor Stroma-Containing 3D Spheroid Arrays: A Tool to Study Nanoparticle Penetration. J. Control. Release 2016, 244, 257–268. [Google Scholar] [CrossRef] [PubMed]
  44. Glidden, M.D.; Celli, J.P.; Massodi, I.; Rizvi, I.; Pogue, B.W.; Hasan, T. Image-Based Quantification of Benzoporphyrin Derivative Uptake, Localization, and Photobleaching in 3D Tumor Models, for Optimization of PDT Parameters. Theranostics 2012, 2, 827–839. [Google Scholar] [CrossRef] [Green Version]
  45. Broekgaarden, M.; Bulin, A.-L.; Porret, E.; Musnier, B.; Chovelon, B.; Ravelet, C.; Sancey, L.; Elleaume, H.; Hainaut, P.; Coll, J.-L.; et al. Surface functionalization of gold nanoclusters with arginine: A trade-off between microtumor uptake and radiotherapy enhancement. Nanoscale 2020, 12, 6959–6963. [Google Scholar] [CrossRef] [PubMed]
  46. Etcheverry, M.E.; Pasquale, M.A.; Bergna, C.; Ponzinibbio, C.; Garavaglia, M. Photodynamic therapy in 2D and 3D human cervical carcinoma cell cultures employing LED light sources emitting at different wavelengths. Phys. Med. Biol. 2020, 65, 015017. [Google Scholar] [CrossRef] [PubMed]
  47. Alderden, R.A.; Mellor, H.R.; Modok, S.; Hall, M.D.; Sutton, S.R.; Newville, M.G.; Callaghan, R.; Hambley, T.W. Elemental tomography of cancer-cell spheroids reveals incomplete uptake of both platinum(II) and platinum(IV) complexes. J. Am. Chem. Soc. 2007, 129, 13400–13401. [Google Scholar] [CrossRef]
  48. Karimnia, V.; Rizvi, I.; Slack, F.J.; Celli, J.P. Photodestruction of Stromal Fibroblasts Enhances Tumor Response to PDT in 3D Pancreatic Cancer Coculture Models. Photochem. Photobiol. 2021, 97, 416–426. [Google Scholar] [CrossRef] [PubMed]
  49. Dekkers, J.F.; Alieva, M.; Wellens, L.M.; Ariese, H.C.R.; Jamieson, P.R.; Vonk, A.M.; Amatngalim, G.D.; Hu, H.; Oost, K.C.; Snippert, H.J.G.; et al. High-resolution 3D imaging of fixed and cleared organoids. Nat. Protoc. 2019, 14, 1756–1771. [Google Scholar] [CrossRef] [PubMed]
Figure 1. A characterization of the optical properties and photochemical activity of L-BPD and MB. (A) The absorption spectrum of L-BPD (40 µM photosensitizer concentration in PBS), corrected for the absorption of empty liposomes at equimolar lipid concentrations. (B) Generation of OH and (C) 1O2 as upon exposure to 420 nm light, as measured by APF and SOSG fluorescence emission, respectively. Data represents the mean ± SD of N = 4. (D) The absorption spectrum of MB (40 µM photosensitizer concentration in PBS), corrected for the absorption of empty liposomes at equimolar lipid concentrations. (E) Generation of OH and (F) 1O2 as upon exposure to 660 nm light, as measured by APF and SOSG fluorescence emission, respectively. Data represents the mean ± SD of N = 4. In all panels, black lines indicate control conditions (PBS), dark blue lines indicate empty liposomes (1.25 mM lipid), light blue lines indicate MB (10 µM in PBS), and red lines indicate L-BPD (10 µM BPD/1.25 mM lipid).
Onco 02 00002 g001
Figure 2. The dose-dependent dark toxicity of L-BPD and MB in PANC-1 (AC) and MIA PaCa-2 spheroids (DF). Toxicity was investigated based on the spheroid viability (A,D), spheroid size (B,E), and the extent of spheroid necrosis (C,F). The data depicts the mean ± SD of the integrated data from four technical repeats (N = 4–12).
Onco 02 00002 g002
Figure 3. The time-dependent uptake of L-BPD (A,CE,G) and MB (B,DF,H) in PANC-1 and MIA PaCa-2 spheroids. The fluorescence intensity of BPD ((A), red) and MB ((B), cyan) after 0, 2, 4 and 24 h of incubation was analyzed by quantitative microscopy (G,H). Data represents the mean ± SD of N = 6 obtained from two technical repeats. To evaluate the spatial distribution of photosensitizer in the spheroids, L-BPD (CG) and MB (DH) fluorescence was quantified through longitudinal cross sections (yellow lines) of PANC-1 and MIA PaCa-2 spheroids. Scale bar = 500 µm.
Onco 02 00002 g003
Figure 4. The effect of photosensitizer doses on the PDT efficacy (50 J/cm2) of L-BPD and MB on PDAC spheroids. (A,B) Heatmaps of PANC-1 (A) and MIA PaCa-2 spheroids (B) following PDT with either L-BPD or MB at different photosensitizer doses. Scale bar = 500 µm. (CH) The PDT efficacy was determined based on the spheroid viability (C,F), spheroid size (D,G), and the extent of spheroid necrosis (E,H), in relation to the photosensitizer dose. Data were depicted at the mean ± SD of N = 12 obtained from three technical repeats. Dose responses curves were fitted using non-linear regression (inhibitor versus normalized response and antagonist versus normalized response).
Onco 02 00002 g004
Figure 5. The effect of total radiant exposure (light fluence) on the PDT efficacy on PDAC spheroids. The PDT efficacy of L-BPD (0.2 µM) and MB (20 µM) was determined at different radiant exposures, and plotted based on the spheroid viability (A,D), spheroid size (B,E), and the extent of spheroid necrosis (C,F) in relation to the total radiant exposure. Data were depicted at the mean ± SD of N = 9, obtained from three technical repeats. Dose responses curves were fitted using non-linear regression (Inhibitor versus normalized response for viability and size data, and antagonist versus normalized response for necrosis data).
Onco 02 00002 g005
Figure 6. The effect of light energy on the PDT efficacy, given a total radiant exposure of 50J/cm2, on PDAC spheroids. (A,B) Heatmaps of PANC-1 (A) and MIA PaCa-2 spheroids (B) following PDT with either L-BPD or MB at different light energies. Scale bar = 500 µm. PDT effect using low (78 mW/cm2 for L-BPD and 95 mW/cm2 for MB), medium (170 mW/cm2 for L-BPD and 190 mW/cm2 for MB) or high (235 mW/cm2 for L-BPD and 280 mW/cm2 for MB) energies was investigated based on the spheroid viability (C,F), spheroid size (D,G), and the extent of spheroid necrosis (E,H). Data were depicted at the mean ± SD of N = 6, obtained from two technical repeats. For each photosensitizer, results obtained with low, medium, and high energies were compared statistically by a Tukey’s post hoc multiple comparisons test (*: p ≤ 0.05; **: p ≤ 0.01; ***: p ≤ 0.0005; ****: p ≤ 0.0001). Unless otherwise indicated, statistical differences with the other groups for each photosensitizer are indicated in the graphs.
Onco 02 00002 g006
Publisher’s Note: MDPI stays neutral with regard to jurisdictional claims in published maps and institutional affiliations.

