Article

Hearables: In-Ear Multimodal Data Fusion for Robust Heart Rate Estimation

1
Department of Electrical and Electronic Engineering, Imperial College London, London SW7 2AZ, UK
2
UKRI Centre for Doctoral Training in AI for Healthcare, Imperial College London, London SW7 2AZ, UK
*
Authors to whom correspondence should be addressed.
BioMedInformatics 2024, 4(2), 911-920; https://doi.org/10.3390/biomedinformatics4020051
Submission received: 21 February 2024 / Revised: 11 March 2024 / Accepted: 19 March 2024 / Published: 1 April 2024

Abstract

:
Background: Ambulatory heart rate (HR) monitors that acquire electrocardiogram (ECG) or/and photoplethysmographm (PPG) signals from the torso, wrists, or ears are notably less accurate in tasks associated with high levels of movement compared to clinical measurements. However, a reliable estimation of HR can be obtained through data fusion from different sensors. These methods are especially suitable for multimodal hearable devices, where heart rate can be tracked from different modalities, including electrical ECG, optical PPG, and sounds (heart tones). Combined information from different modalities can compensate for single source limitations. Methods: In this paper, we evaluate the possible application of data fusion methods in hearables. We assess data fusion for heart rate estimation from simultaneous in-ear ECG and in-ear PPG, recorded on ten subjects while performing 5-min sitting and walking tasks. Results: Our findings show that data fusion methods provide a similar level of mean absolute error as the best single-source heart rate estimation but with much lower intra-subject variability, especially during walking activities. Conclusion: We conclude that data fusion methods provide more robust HR estimation than a single cardiovascular signal. These methods can enhance the performance of wearable devices, especially multimodal hearables, in heart rate tracking during physical activity.

1. Introduction

Ambulatory wearable heart rate trackers provide physiological measurements during dynamic everyday real-world activities. However, they have been characterized as being less accurate in tasks associated with high levels of movement compared to data acquired in clinic. The accuracy of wearable devices is related to their placement; for example, a device on the wrist is more likely to catch movement artefacts than one on the chest [1]. Nonetheless, even when placed on the chest, the relative error of a heart rate monitor increases with the level of exercise intensity [2].
In addition, the performance of automatic heartbeat detection algorithms depends on signal-to-noise ratio [3]; for example, for signal-to-noise ratios below 5 dB, the R peak detection in electrocardiogram (ECG) is considered unreliable [4]. Generally, a detector sensitivity and positive predictive value decrease for ambulatory data compared to the standard system in a clinic [5]. Even when poor-quality data or data corrupted by motion artefacts are excluded from analysis, the accuracy of detectors applied to ambulatory data is typically worse than that for data acquired in clinics [6]. Georgiou et al. [7] pointed out that so far, wearable devices can only be used as a surrogate for heart rate variability at resting or mild exercise conditions, as their accuracy fades out with increasing exercise load.
Hearables are a very convenient wearables modality, owning the privileged position of the head and ear canal on the human body and the fixed distance to vital organs. However, the in-ear ECG [8] signal, measured between electrodes placed inside the ear canal, has a smaller amplitude that standard ECG acquired from torso and a lower signal-to-noise ratio, making it difficult to automatically detect R peaks with standard algorithms [9]. On the other hand, earpieces provide a good fit and benefit from collocated position of multiple sensors (electrodes, accelerometer, microphone, and photoplethysmography (PPG) sensor) on an earplug [10].
The multimodalities of hearables has already been employed in mental stress detection [11], showing that classification performance can be improved by utilizing heart rate variability features extracted from ear-ECG, with breathing and oxygen saturation features extracted from ear-PPG signals. Multimodality also has a crucial role in artefacts removal [12], where signals from microphones and accelerometer were used to model artefacts and remove them from ear-EEG recordings. Regarding the estimation of heart rate, it can be monitored using various in-ear signal modalities [13]:
  • Electrical (ECG) [11];
  • Optical (PPG) [14,15];
  • Sounds (heart tones) [16].
The multimodality of hearables provides an opportunity for more robust HR estimation by combining heart rate data from various sources using data fusion methods.
Data fusion techniques have the potential to improve estimation accuracy by sensor redundancy (e.g., multiple PPG signals), or by estimating HR from different sensor modalities (PPG and ECG). For example, data fusion can be achieved with weighted average, where weights are automatically adjusted based on signal quality indexes (SQIs). This approach ensures that data from high SQI signals, i.e., likely to be more accurate, are used for HR estimation.
In this paper, we evaluate two methods of data fusion: the method described by Li et al. [17] and the method proposed by Rankawat and Dubey [18] for heart rate estimation from simultaneous in-ear ECG and in-ear PPG, recorded on eight subjects while performing 5-minute sitting and walking tasks.

2. Method

2.1. Data Fusion Methods

2.1.1. Rankawat and Dubey’s [18] Method

Rankawat and Dubey [18] proposed a data fusion method whereby HR is estimated from n different sources and fused as a weighted average
H R = 1 i = 1 n w i i = 1 n w i H R i
The weight w i for the i-th source is estimated based on the signal quality index (SQI) and the source type. Rankawat and Dubey [18] identified two categories of signals: cardiovascular, directly related to heart activity, such as ECG, PPG, and arterial blood pressure (ABP); and non-cardiovascular signals where the heart related component is an artefact, such as electroencephalogram, electrooculogram and electromyogram. For the latter, the Teager–Kaiser energy operator [19] was used to perform beat detection.
The weights for signals were taken according to Table 1.
Rankawat and Dubey [18] assessed SQI as a product of a “beat rhythm factor” and a “beat deviation factor”, calculated using eight previous beats. The beat rhythm factor ( C i ) was calculated as 1 minus the ratio of standard deviation ( σ i ) and the median of RR intervals ( μ i ) as
C i = 1 σ i μ i
The beat deviation factor ( D i ) was assessed based on the deviation of the current RR interval ( x i ) from a mean value ( μ i ) as
D i = x i μ i

2.1.2. Li et al. [17] Method

Li et al.’s [17] data fusion method is performed in two steps: (1) HR estimation from each source is filtered using a Kalman filter; (2) and HR fusion estimation is calculated for n signals as
H R = i = 1 n ( i = 1 , k i n σ i 2 i = 1 n ( j = 1 , j i n σ j 2 ) H R k ) k = 1 , 2 , . . . , n
where σ indicates the weight associated with each signal, and is calculated as
σ k = H R k X k S Q I k
where H R k is heart rate, X k is Kalman filter state prediction, and S Q I k is the signal quality index for the current beat.
The goal of the Kalman filter is to produce evolving optimal estimates of a modelled process from noisy measurements of the process. The Kalman filter is a set of mathematical equations that provide a computationally efficient way (recursive) to estimate the state of a process, by minimizing the mean squared error of estimations [20].
In the context of HR tracking, the state process of the filter can be modelled as a random walk, where a single state value (HR) in each step changes to a random value. Then, the previous HR value can be used to estimate HR at the next step. Therefore, in the initial step of the recursive filtering algorithm, the next state value ( X k + 1 ) is predicted as
X k + 1 = X k
Then, the system state error covariance of the next step ( P k + 1 ) is calculated as
P k + 1 = P k + + Q
where Q is process covariance, which is set during filter design. Li et al. [17] empirically found Q = 0.1 as the optimal value. For higher Q, the filter starts to follow the HR observation too closely, while for lower values, the filter firmly trusts its own estimation and does not adapt to observations. The initial P 0 + is defined during the design of the filter.
Next, the Kalman gain ( K k ) is calculated as
K k = P k ( P k + R k )
where R k is the measurement covariance. Li et al. [17] adjusted R k based on the S Q I as
R k = R * e ( 1 S Q I k 2 1 )
with R as the base covariance value set during filter design, and R k and Q indicate filter behaviour. As mentioned before, higher Q values result in the filter strongly following its own model prediction. Similarly, a higher R k causes the filter to follow measured values. An adjustable R k ensures that the filter will firmly follow its own prediction for low SQI, while it will prefer HR estimation for higher SQI. The last step of the Kalman filter algorithm is the correction of process state estimation and filter covariance:
X k + = X k + K k ( Z k X k )
P k + = ( 1 K k ) P k
where Z k is the measured HR estimated from the signal. The corrected estimations X k + are the filter output used for data fusion.
As an SQI, Li et al. [17] used values combined from four different SQI estimation: (1) based on the comparison of different QRS detectors on a single lead ECG; (2) based on the comparison of QRS detection using different leads; (3) based on signal kurtosis, similarity to Gaussian distribution; and (4) based on spectral distribution of ECG, the ratio of power spectral density of QRS complex (range from 5 to 14Hz) and power spectral density between 5 and 50 Hz.

2.2. Validation of Methods on In-Ear Measurements
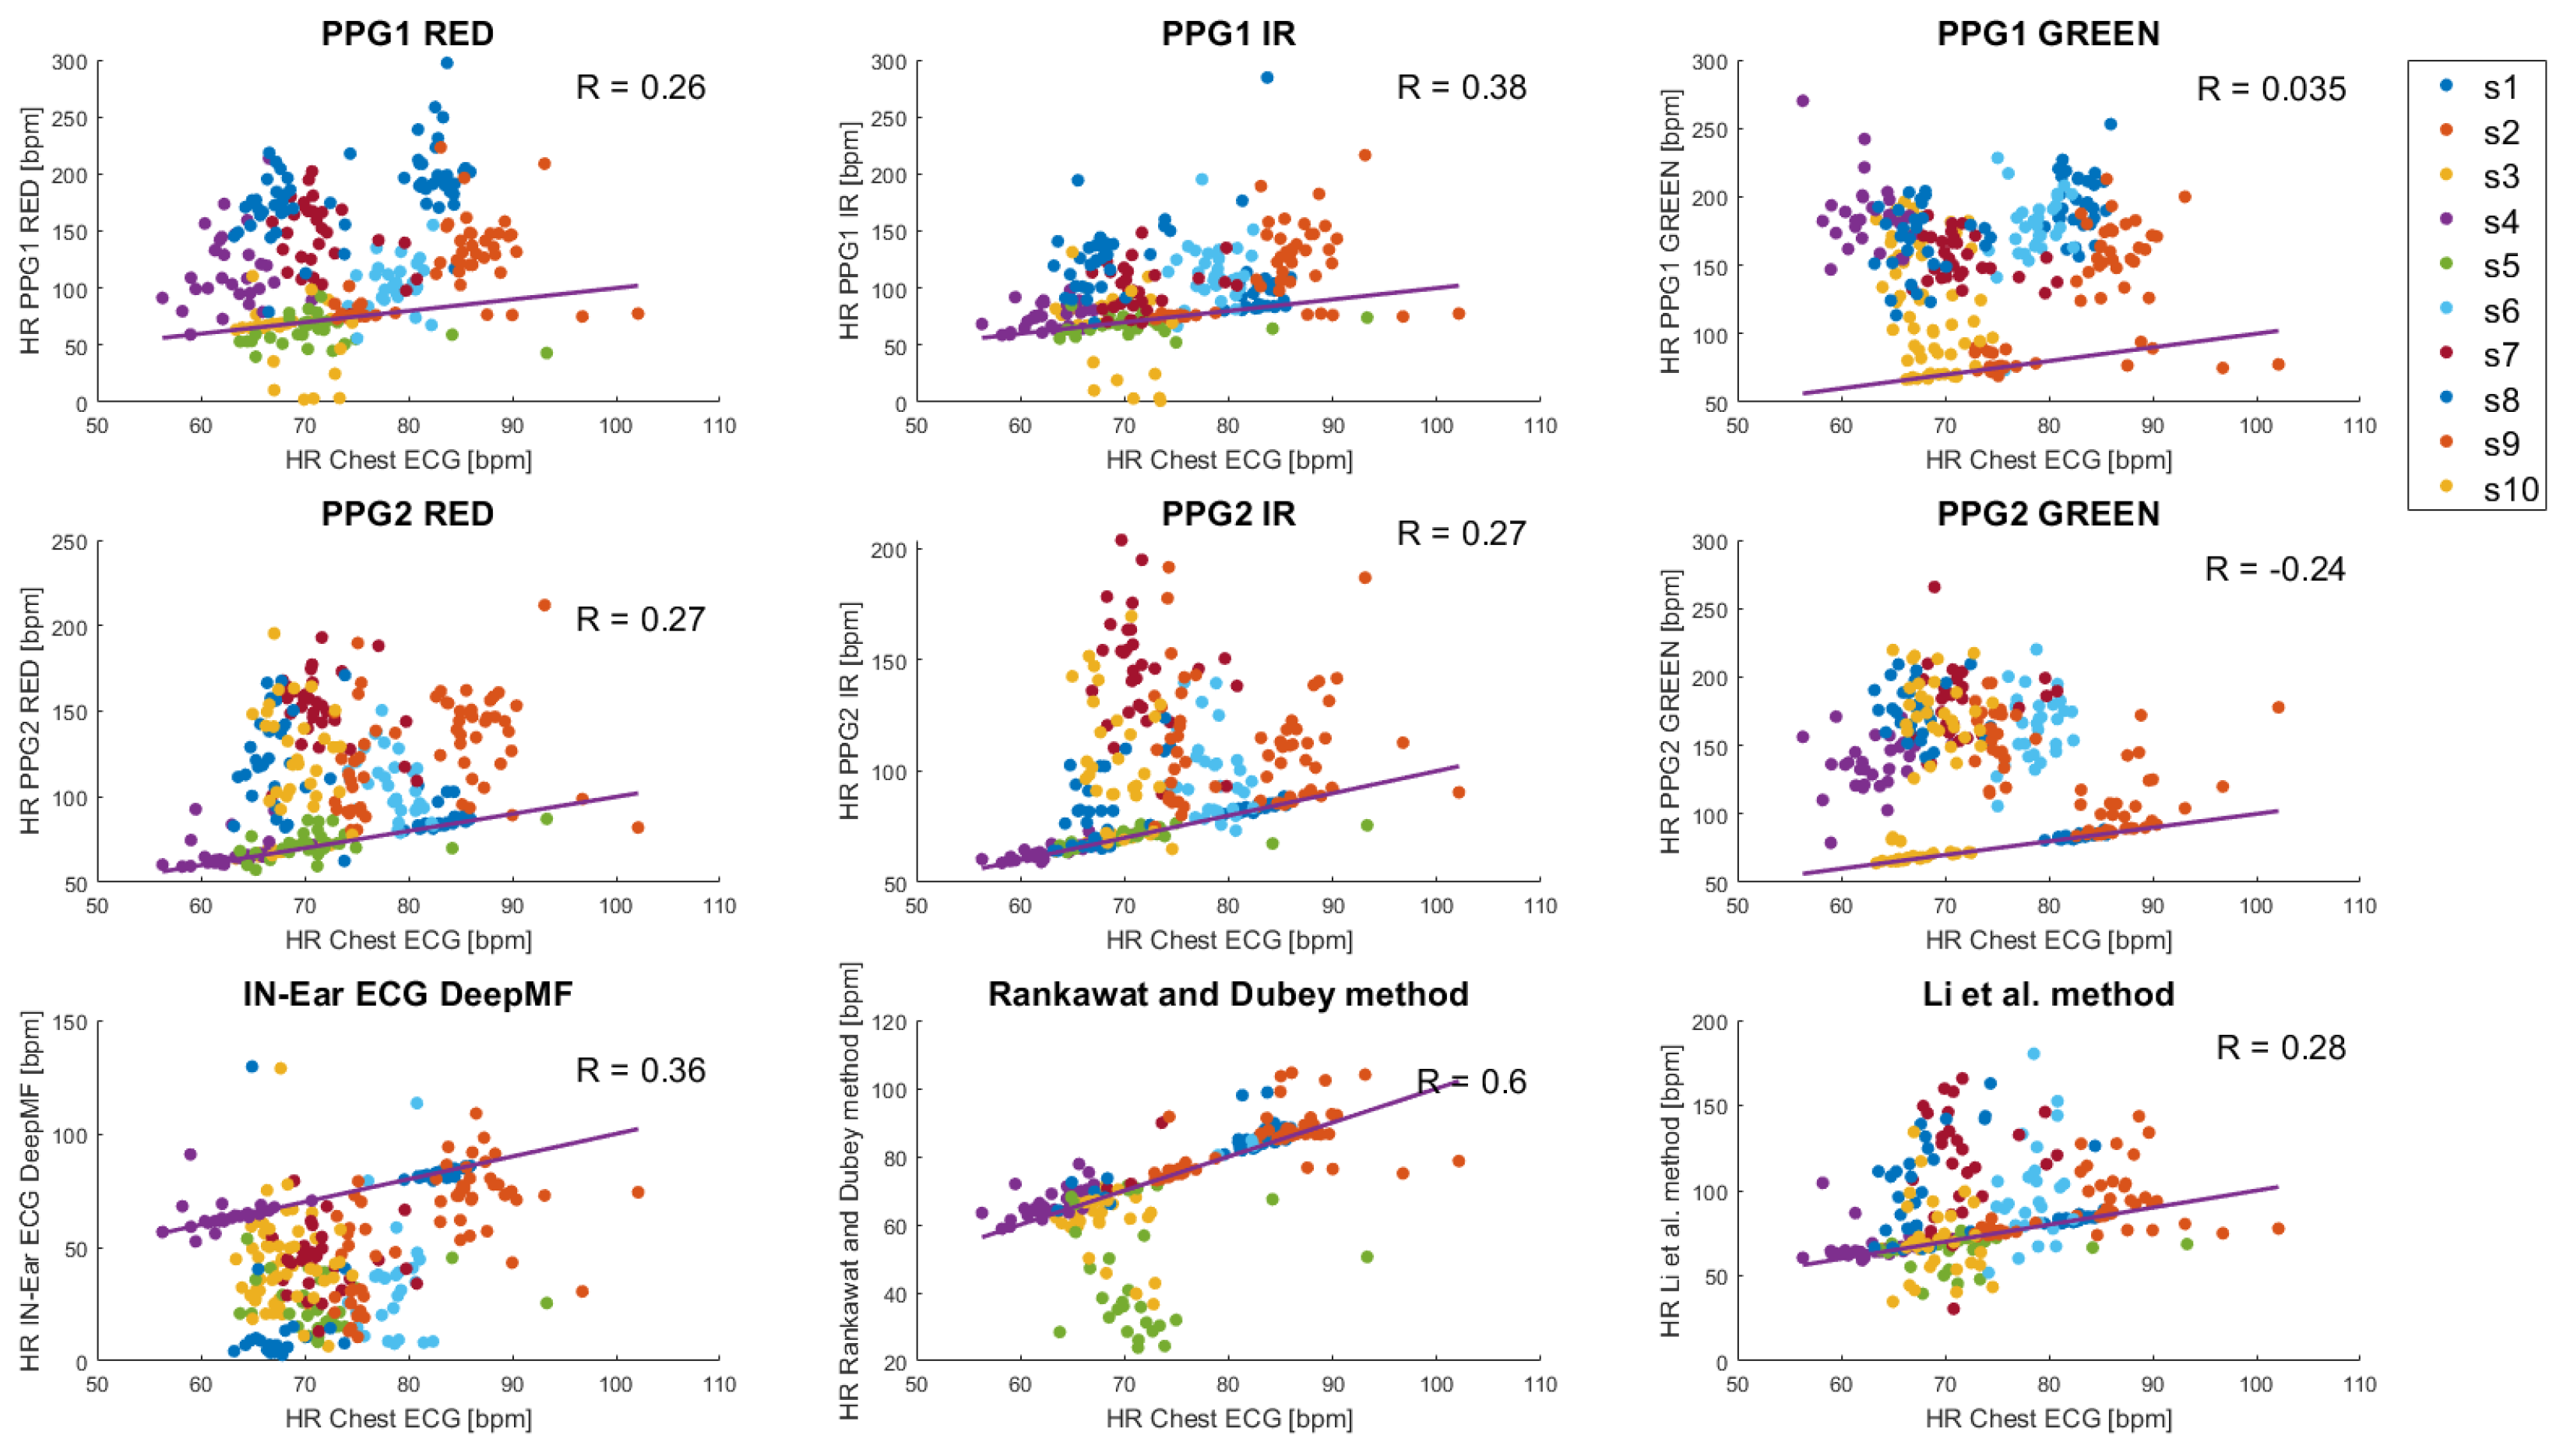
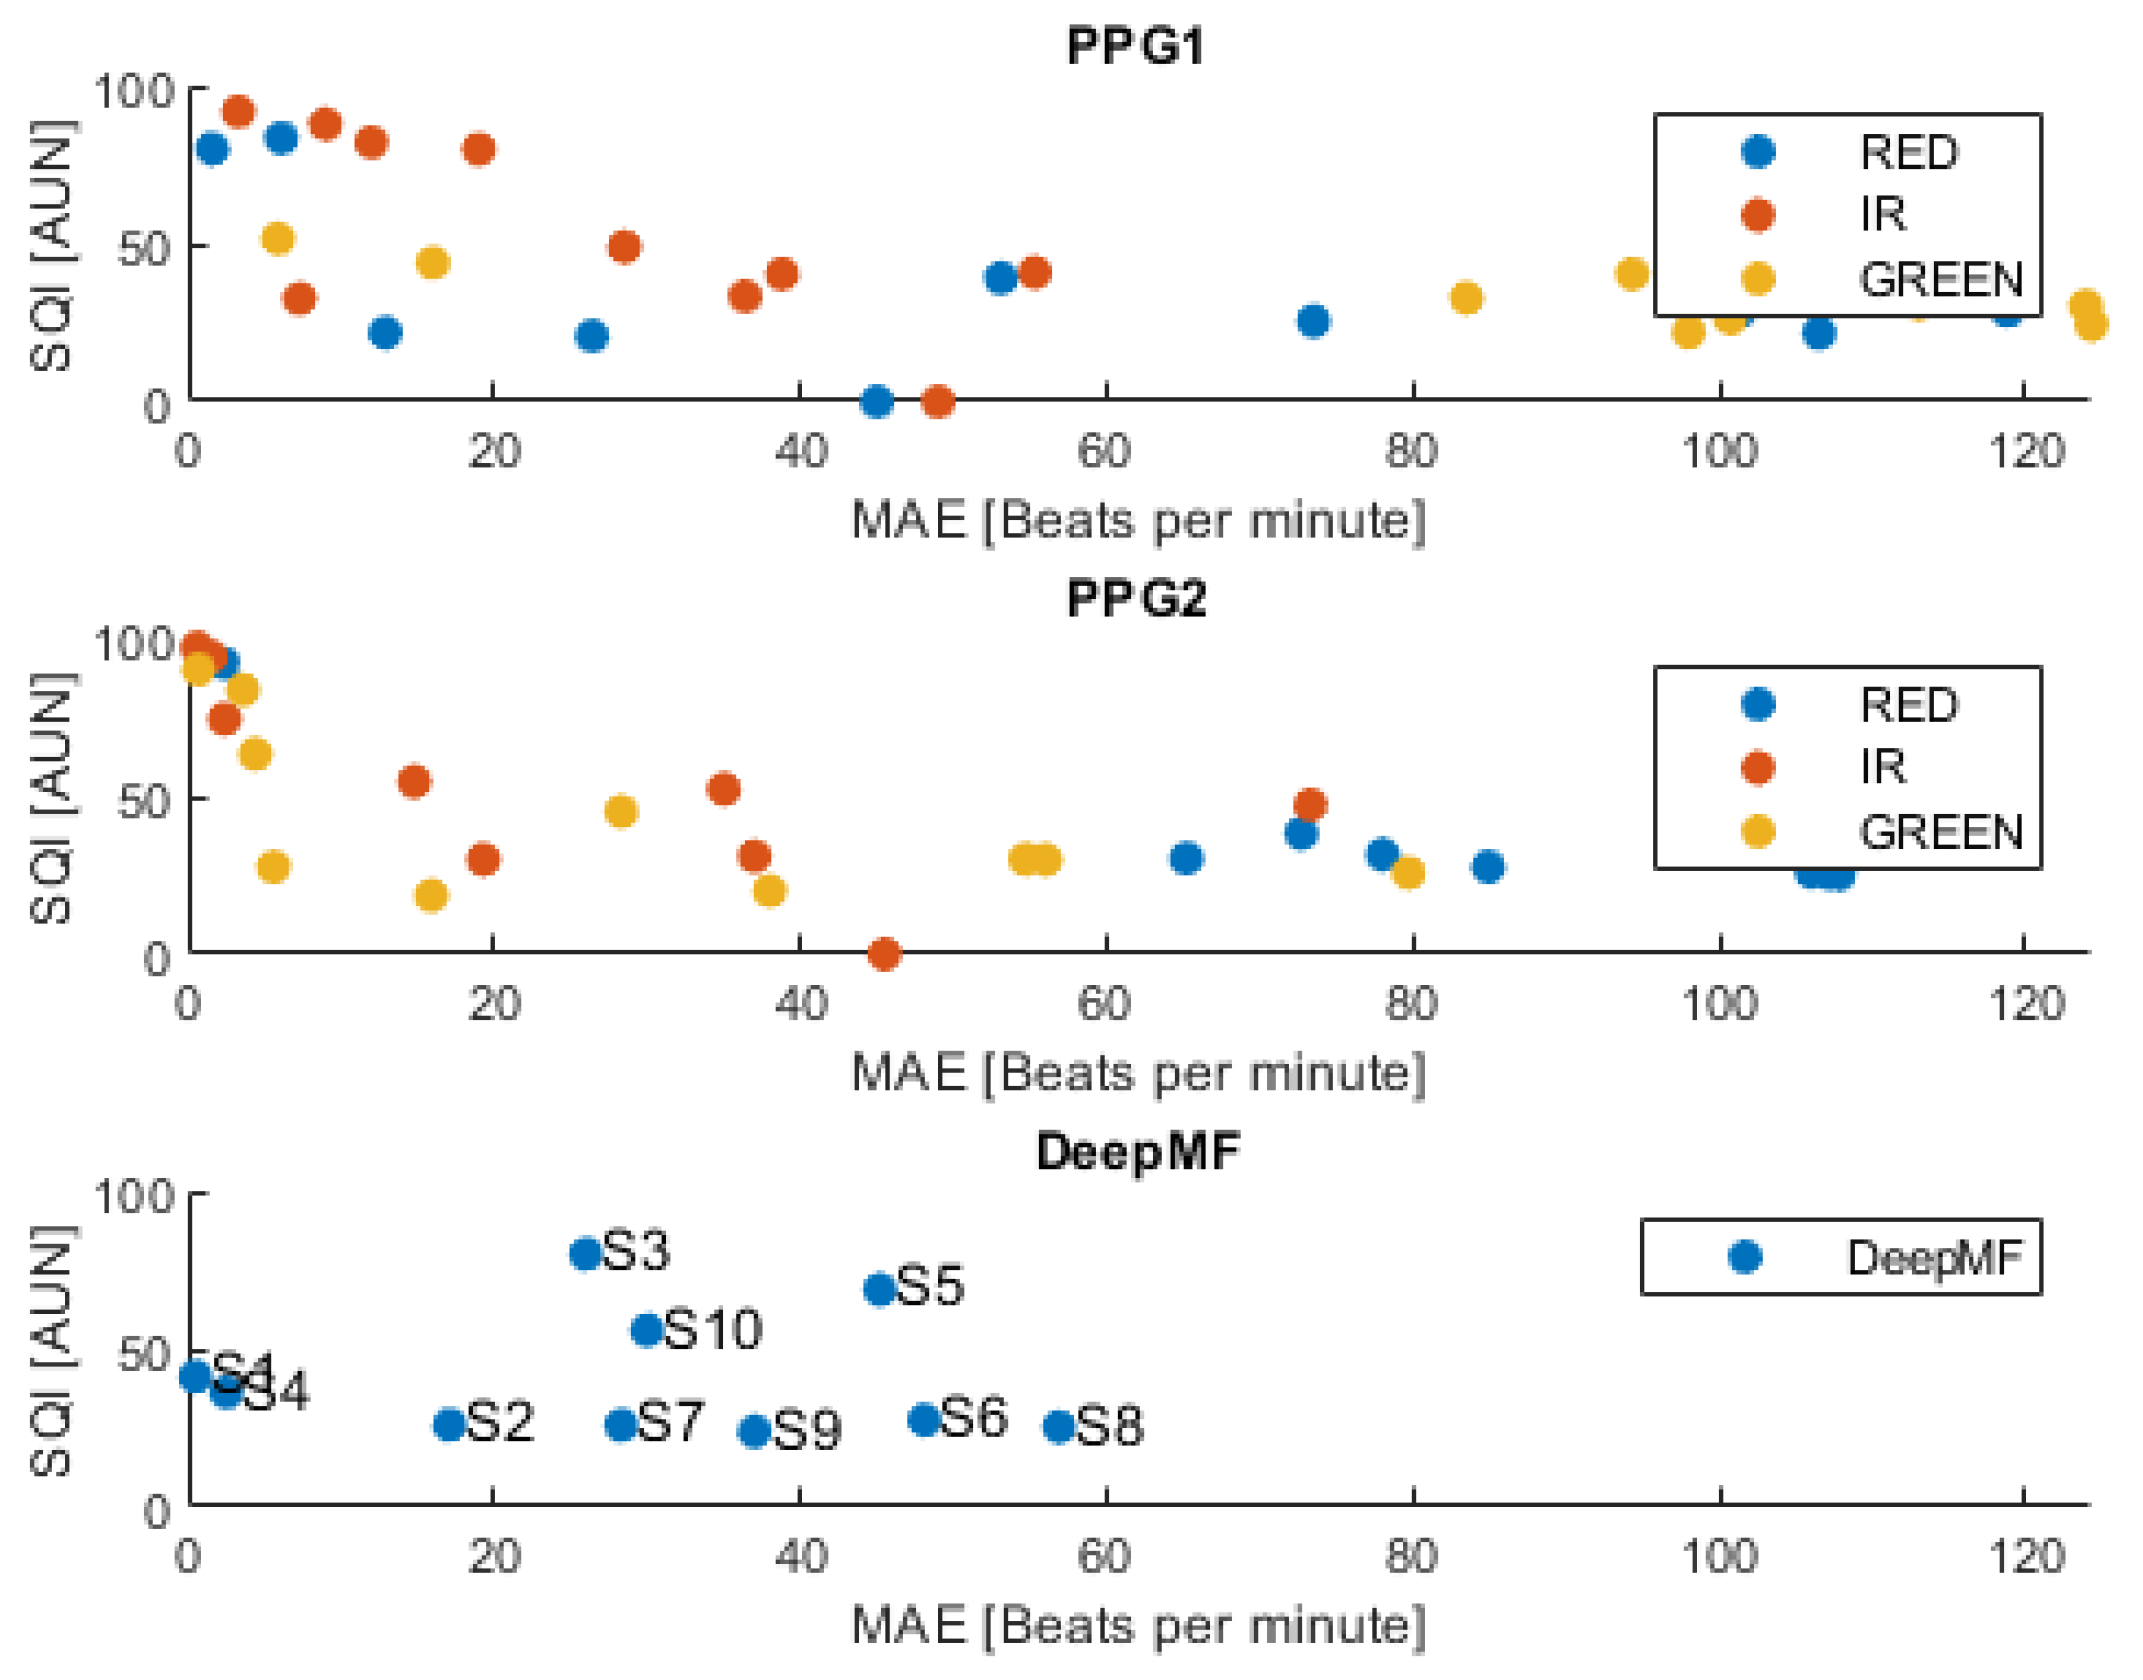
We recorded 10 healthy subjects (4 females and 6 males, aged 24–34) during 5 min of resting sitting and 5 min of walking on a treadmill at a speed of 4 km/h. We acquired a one-channel cross-head ECG by positioning one viscoelastic foam sensor [10] in each ear, where the biopotential was measured between electrodes placed in both ears and one standard torso ECG (modified Lead I configuration). Simultaneously, we measured signals from two PPG sensors MAX30101 (Maxim Integrated) , placed in both ears’ conchae mounted on a flexible shell developed in our lab. PPG signals for green, red, and infrared light were recorded.
The study was conducted under the approval of the Imperial College ethics committee (JRCO 20IC6414), and all subjects provided full informed consent.
To detect onsets in PPG signals, we first performed inversion of acquired signal polarization and lowpass filtration (cut-off frequency = 12 Hz). Next, to detect the onsets of the PPG signals, we used the qppg function from the PhysioNet Cardiovascular Signal Toolbox [21]. Detections were performed for all six PPG signals (Red, Infrared, and Green wavelengths for each of the two sensors) independently.
To detect R-peaks in Ear-ECG, we used a deep matched filter detector introduced by Davies et al. [22]. The detector consists of an encoder stage (trained as part of an encoder-decoder module to reproduce ground truth ECG), which operates as a Matched Filter. The encoder section searches for matches with an ECG template pattern in the input signal, prior to refining and filtering the matches with the subsequent convolutional layers and an R-peak classifier stage. This classifier consists of a single-layer 1D convolution, followed by a Sigmoid activation function, flattening, and a linear output layer. The proposed method has been shown to provide higher median R-peak recall and precision than standard matched filters [22]. The detector was previously trained using a separate dataset; we did not modify model weights for this study.
For the estimation of SQI in heart signals, the calculate_ppgsqi function from PhysioNet Cardiovascular Signal Toolbox was used. This function employs multiple-template matching stages, and was described by Li et al. [23]. Firstly, a signal beat dynamic template was built by averaging beats in a 30 s signal window. Then fiducial points were chosen as the detected onsets and the R peaks for the PPG and ECG signals, respectively. Each beat starts from the fiducial point and ends at the fiducial point of the next beat. The mean SQI was obtained from four SQIs estimation methods. Three SQIs were based on the correlation of the template with: a beat, a linear interpolation of the beat, and the beat after dynamic time warping to match the template. The fourth SQI was the percentage of samples that were saturated (to the maximum or minimum values). We applied this method to all acquired signals: in-ear PPGs and in-ear ECG.
To detect the R peaks in torso ECG, we used the Two Moving Average detector [24], implemented from https://github.com/berndporr/py-ecg-detectors.git (accessed on 20 February 2024).
We averaged the estimated HR and SQI values from each of the 7 sources and data fusion methods over 10 s windows without overlapping. We calculate the mean absolute errors (MAEs) for each HR estimation method with respect to the HR values obtained from the torso ECG, used as a ground truth.

3. Results

Figure 1 shows scatter plots illustrating the relationship between the heart rate (HR) estimates obtained from in-ear signals and the HR values derived from data fusion methods, in comparison to the ground truth HR estimation from torso ECG. The highest correlation to the reference for a single source was R = 0.38 for PPG1 IR signal, while the highest correlation R = 0.60 was obtained when using Rankawat and Dubey’s method [18].
Notably, the HR estimates derived from PPG signals tend to be overestimated (frequently above the perfect correlation y = x orange line). On the other hand, HR estimates obtained from in-ear signals using the DeepMF method are more likely to underestimate the true HR values.
It is important to note that the Rankawat and Dubey’s method has the capability to reject outliers and may not provide results in cases where the signal does not have an adequate SQI value. For example, in subject 7 the method gave results only in two segments from thirty.
Table 2 summarizes MAEs obtained during sitting from in-ear source signals and data fusion methods. The corresponding MAEs values during the walking activity are summarized in Table 3.
Rankawat and Dubey’s method consistently demonstrated the lowest mean MAEs across subjects for both activities, with values of 8.0 bpm during sitting and 15 bpm during walking. Notably, Li et al.’s method outperformed the best single-source HR estimation method, specifically during sitting based on the PPG2 IR signal (17 bpm compared to 23 bpm) and during walking (18 bpm compared to 23 bpm for Green PPG2).
Rankawat and Dubey’s method had high MAE values in subjects 2, 5, and 10 (Table 2). However in subjects 2 and 10 the method had the lowest MAE value among all. In subject 5, the method followed too closely the results obtained from the DeepMF, while better outcomes were observed when using the Red and IR PPG signals. (Figure 1).
During walking, Rankawat and Dubey’s method maintained an acceptable MAE (below 5 bpm) in three subjects (1, 4 and 8). Otherwise, low acceptable MAE values were only obtained in subject 1 when using PPG2 IR and Green signals.
Figure 2 shows the relationship between the MAEs of HR estimation and mean SQI values, with each data point representing values for different subjects. For PPG signals, when the SQI values were high, the MAE was consistently below 20 bpm. With SQI values below 50, the MAE tended to rise. In contrast, for in-ear ECG signals, the relationship between MAE and SQI was not as clear. The MAE was low for subjects 1 and 4, even though their SQI was below 50, and those with a higher SQI like subjects 3 and 5 had larger MAEs.

4. Discussion

We have shown that data fusion methods have lower MAEs than single-source HR estimations (Table 2). Furthermore, data fusion methods reduced the variation of MAEs and provided more robust HR estimation, especially during the walking activity (Table 3) when signals are affected by motion artefacts.
The major concept of data fusion methods is to select the best available sources for HR estimation. The main advantage of Rankawat and Dubey’s method is its ability to reject measurements when there is no valid source (every signal has an SQI lower than 0.7). In this case, the method does not provide HR estimation. On the other hand, the Li et al. [17] weighting algorithm uses information from all sources, even from low quality ones. When all of them are poor and have a very low SQI, the resulting HR estimation will include information from all of them and provide an unreasonable estimation.
In this study, for in-ear recordings during sitting, the HR estimated from five subjects (subjects: 2, 6, 7, 8 and 10), based on individual signals, had MAEs greater than 5 bpm. In these situations, Rankawat and Dubey’s method [25] correctly rejected invalid measurements and kept MAE values at a reasonable level, lower than single-source estimation. On the other hand, Li et al.’s [17] algorithm resulted in an MAE slightly higher than the best single-source method.
For correct data fusion, it is critical to correctly estimate SQIs and to prevent the usage of invalid data when estimating HR. Rahman et al. [25] evaluated the performance of different SQIs on synthetic data (ECG recordings with artificially added noises). They found that the performance of SQI considerably fluctuated against varying datasets and concluded that fixed threshold-based SQIs cannot be used as a robust noise detection system. They suggested using adaptive thresholds and machine learning mechanisms to improve signal quality assessment.
In our study, quality SQI estimation was especially challenging in subject 5 (Figure 1), where SQIs for in-ear ECG were overestimated and led to incorrect estimations of HR provided by Rankawat and Dubey’s method.
This was also observed for SQI estimation in an in-ear ECG recording (Figure 2). SQIs did not seem to be related to MAE, while in a standard scenario, a higher SQI should lead to a lower MAE, as in the case of PPG signals. The method used in this study for estimating SQI is based on the correlation of an individual beat with a template built on the average of 30 previous beats. This method seems reasonable for PPG signals where repeatable pulsation has a much larger amplitude than noise. However, it does not seem to be working properly in the case of in-ear ECG signals where the signal-to-noise ratio is likely to be lower (noise level is similar to ECG amplitude).
The in-ear ECG signal requires a more dedicated method for SQI estimation. Improvements in signal quality assessment, for example with deep neural networks [26] or cascade of classifiers [27], may further improve the performance of data fusion methods.
Notably, the HR estimates derived from PPG and ECG show opposite trends. When employing the DeepMF method, ECG signals tend to underestimate HR (i.e., miss a few peaks), while PPG signals tend to overestimate it (i.e., identify more peaks than the real ones), as depicted in Figure 1. This contrasting behaviour makes this problem well-suited for data fusion methods, where the combination of different estimates compensates for distinct and opposite biases, resulting in a more reliable estimation.
Beat detectors for PPG performed well on high-quality PPG signals, but their performance decreases for noisy or low-amplitude signals such as those from in-ears. The reliability of PPG towards HR estimation has been questioned recently. Weiler et al. [28] compared averaged HR readings from PPG and ECG signals, and they did not find a statistically significant difference, but when the HR reached a value around 155–160 bpm, a difference of ±5 bpm was observed. Charlton et al. [29] evaluated eight different beat detectors for PPG and found that detectors performed well on hospital data and at rest, but performed worse during movement, stress, atrial fibrillation, and in neonates. In the study, detectors denoted MSPTD [30] and qppg [21] (used in this study) performed best, with complementary performance characteristics. MSPTD looks for peaks in PPG signals without using a priori knowledge of the characteristics of the signal, while qppg searches for systolic up-slopes based on their expected characteristics.
The performance of detectors may be improved; for example, Galli et al. [31] proposed an algorithm that combines three sequential signal processing stages of signal denoising by joint principal component analysis of PPG and accelerometer signals, Fourier-based heart rate measurement, and smoothing HR estimation via Kalman filtering. Galli et al. [31] showed that the average deviation from reference values was 1.66 bpm during running and 2.92 bpm during boxing activity. The development of a dedicated onset detector for in-ear PPG signals, such as DeepMF for in-ear ECG, is an interesting route for further study.
Moreover, PPG quality is affected by different skin colours, interfering reflection of light used for measurement, and disturbing optical measurements. Racial bias for blood oxygen saturation measurement using PPG were observed [32]. Different measurement sites can have a thinner epidermis compared with the finger and lower exposure to sunlight and may be less prone to the influence of melanin and pigmentation [33]. Hartman et al. [34] discussed that PPG acquired from different locations vary in amplitude and shape, and in some cases may be unsuitable for analysis. In Hartman et al.’s [34] study, 95% of recordings from the finger were suitable for analysis, followed by 86% of recordings on the wrist, and 81% on the earlobe.
Data fusion methods seem to be a necessity for PPG in the earlobe location, where the signal amplitudes are smaller and likely to be corrupted by motion artefacts. Data fusion methods and Kalman filter used by Li et al. [17] provide ways to reject outlier results. Further improvement of data fusion can be made by modifying the weighting equation. Our observations suggest that better results should come from the fusion operation in a winner-take-all fashion. We hypothesize that data fusion should mostly use the best available signal, and weights should be associated with the best signal and drop rapidly with a relative drop in SQI.
Data fusion methods provide more robust HR estimation than a single cardiovascular signal. In particular, data fusion methods are useful for data recorded during movement, where signals may be affected by motion artefacts. Data fusion methods through integration of multimodal signals available from in-ear location, can enhance the performance of a wearable device in HR tracking.
Future work will include the following:
  • The enhancement of data fusion methods by refining the assessment of weights.
  • The development of a PPG beat detector optimized for low-amplitude in-ear PPG signals.
  • The improvement of SQI estimation methods towards more reliable HR estimation.

Author Contributions

Conceptualization, M.Ż. and E.O.; methodology, M.Ż. and E.O.; software, M.Ż.; validation, E.O. and M.Ż.; formal analysis, M.Ż. and E.O.; investigation, M.Ż.; resources, M.B., A.N., A.M. and H.J.D.; data curation, M.Ż.; writing—original draft preparation, M.Ż.; writing—review and editing, E.O. and A.N.; visualization, M.Ż. and E.O.; supervision, D.P.M.; project administration, D.P.M.; funding acquisition, D.P.M. All authors have read and agreed to the published version of the manuscript.

Funding

This work was supported in part by USSOCOM MARVELS grant EESB P85655. Edoardo Occhipinti was supported by UK Research and Innovation (UKRI Centre for Doctoral Training in AI for Healthcare Grant no. EP/S023283/1).

Institutional Review Board Statement

The study was conducted under the approval of the Imperial College ethics committee (JRCO 20IC6414, date of approval 5 July 2021).

Informed Consent Statement

Informed consent was obtained from all subjects involved in the study.

Data Availability Statement

Dataset available on request from the authors.

Conflicts of Interest

The authors declare no conflicts of interest. The funders had no role in the design of the study; in the collection, analyses, or interpretation of data; in the writing of the manuscript; or in the decision to publish the results.

Abbreviations

The following abbreviations are used in this manuscript:
HRheart rate
ECGelectrocardiogram
PPGphotoplethysmographm
SQIsignal quality index

References

  1. Ruiz-Alias, S.A.; García-Pinillos, F.; Soto-Hermoso, V.M.; Ruiz-Malagón, E.J. Heart rate monitoring of the endurance runner during high intensity interval training: Influence of device used on training functions. Proc. Inst. Mech. Eng. Part J. Sport. Eng. Technol. 2021, 237, 166–172. [Google Scholar] [CrossRef]
  2. Hernando, D.; Garatachea, N.; Almeida, R.; Casajus, J.A.; Bailón, R. Validation of heart rate monitor Polar RS800 for heart rate variability analysis during exercise. J. Strength Cond. Res. 2018, 32, 716–725. [Google Scholar] [CrossRef] [PubMed]
  3. Fariha, M.; Ikeura, R.; Hayakawa, S.; Tsutsumi, S. Analysis of Pan-Tompkins algorithm performance with noisy ECG signals. In Journal of Physics: Conference Series; IOP Publishing: Bristol, UK, 2020; Volume 1532, p. 012022. [Google Scholar]
  4. Smital, L.; Haider, C.R.; Vitek, M.; Leinveber, P.; Jurak, P.; Nemcova, A.; Smisek, R.; Marsanova, L.; Provaznik, I.; Felton, C.L.; et al. Real-time quality assessment of long-term ECG signals recorded by wearables in free-living conditions. IEEE Trans. Biomed. Eng. 2020, 67, 2721–2734. [Google Scholar] [CrossRef] [PubMed]
  5. Khamis, H.; Weiss, R.; Xie, Y.; Chang, C.W.; Lovell, N.H.; Redmond, S.J. QRS detection algorithm for telehealth electrocardiogram recordings. IEEE Trans. Biomed. Eng. 2016, 63, 1377–1388. [Google Scholar] [CrossRef] [PubMed]
  6. Liu, F.; Liu, C.; Jiang, X.; Zhang, Z.; Zhang, Y.; Li, J.; Wei, S. Performance analysis of ten common QRS detectors on different ECG application cases. J. Healthc. Eng. 2018, 2018, 9050812. [Google Scholar] [CrossRef]
  7. Georgiou, K.; Larentzakis, A.V.; Khamis, N.N.; Alsuhaibani, G.I.; Alaska, Y.A.; Giallafos, E.J. Can wearable devices accurately measure heart rate variability? A systematic review. Folia Medica 2018, 60, 7–20. [Google Scholar] [CrossRef]
  8. von Rosenberg, W.; Chanwimalueang, T.; Goverdovsky, V.; Peters, N.S.; Papavassiliou, C.; Mandic, D.P. Hearables: Feasibility of recording cardiac rhythms from head and in-ear locations. R. Soc. Open Sci. 2017, 4, 171214. [Google Scholar] [CrossRef] [PubMed]
  9. Yarici, M.; Von Rosenberg, W.; Hammour, G.; Davies, H.; Amadori, P.; Ling, N.; Demiris, Y.; Mandic, D.P. Hearables: Feasibility of recording cardiac rhythms from single in-ear locations. R. Soc. Open Sci. 2024, 11, 221620. [Google Scholar] [CrossRef] [PubMed]
  10. Goverdovsky, V.; Von Rosenberg, W.; Nakamura, T.; Looney, D.; Sharp, D.J.; Papavassiliou, C.; Morrell, M.J.; Mandic, D.P. Hearables: Multimodal physiological in-ear sensing. Sci. Rep. 2017, 7, 6948. [Google Scholar] [CrossRef] [PubMed]
  11. Tian, H.; Occhipinti, E.; Nassibi, A.; Mandic, D.P. Hearables: Heart Rate Variability from Ear Electrocardiogram and Ear Photoplethysmogram (Ear-ECG and Ear-PPG). In Proceedings of the 45th Annual International Conference of the IEEE Engineering in Medicine and Biology Society (EMBC), Sydney, Australia, 24–27 July 2023. [Google Scholar]
  12. Occhipinti, E.; Davies, H.J.; Hammour, G.; Mandic, D.P. Hearables: Artefact removal in Ear-EEG for continuous 24/7 monitoring. In Proceedings of the IEEE International Joint Conference on Neural Networks (IJCNN), Padua, Italy, 18–23 July 2022; pp. 1–6. [Google Scholar]
  13. Hammour, G.; Yarici, M.; von Rosenberg, W.; Mandic, D.P. Hearables: Feasibility and validation of in-ear electrocardiogram. In Proceedings of the 41st Annual International Conference of the IEEE Engineering in Medicine and Biology Society (EMBC), Berlin, Germany, 23–27 July 2019; IEEE: Piscataway, NJ, USA, 2019; pp. 5777–5780. [Google Scholar]
  14. Passler, S.; Müller, N.; Senner, V. In-ear pulse rate measurement: A valid alternative to heart rate derived from electrocardiography? Sensors 2019, 19, 3641. [Google Scholar] [CrossRef]
  15. Ferlini, A.; Montanari, A.; Min, C.; Li, H.; Sassi, U.; Kawsar, F. In-ear PPG for vital signs. IEEE Pervasive Comput. 2021, 21, 65–74. [Google Scholar] [CrossRef]
  16. Butkow, K.J.; Dang, T.; Ferlini, A.; Ma, D.; Mascolo, C. hEARt: Motion-resilient Heart Rate Monitoring with In-ear Microphones. In Proceedings of the the 2023 IEEE International Conference on Pervasive Computing and Communications (PerCom), Atlanta, GA, USA, 13–17 March 2023; IEEE: Piscataway, NJ, USA, 2023; pp. 200–209. [Google Scholar]
  17. Li, Q.; Mark, R.G.; Clifford, G.D. Robust heart rate estimation from multiple asynchronous noisy sources using signal quality indices and a Kalman filter. Physiol. Meas. 2007, 29, 15. [Google Scholar] [CrossRef] [PubMed]
  18. Rankawat, S.A.; Dubey, R. Robust heart rate estimation from multimodal physiological signals using beat signal quality index based majority voting fusion method. Biomed. Signal Process. Control 2017, 33, 201–212. [Google Scholar] [CrossRef]
  19. Rankawat, S.A.; Rankawat, M.; Dubey, R. ECG artifacts detection in noncardiovascular signals using Slope Sum Function and Teager Kaiser Energy. In Proceedings of the 2015 International Conference on BioSignal Analysis, Processing and Systems (ICBAPS), Kuala Lumpur, Malaysia, 26–28 May 2015; IEEE: Piscataway, NJ, USA, 2015; pp. 6–10. [Google Scholar]
  20. Welch, G.F. Kalman filter. In Computer Vision: A Reference Guide; Springer: Cham, Switzerland, 2020; pp. 1–3. [Google Scholar]
  21. Vest, A.N.; Da Poian, G.; Li, Q.; Liu, C.; Nemati, S.; Shah, A.J.; Clifford, G.D. An open source benchmarked toolbox for cardiovascular waveform and interval analysis. Physiol. Meas. 2018, 39, 105004. [Google Scholar] [CrossRef] [PubMed]
  22. Davies, H.J.; Hammour, G.; Zylinski, M.; Nassibi, A.; Stanković, L.; Mandic, D.P. The Deep-Match Framework: R-Peak Detection in Ear-ECG. IEEE Trans. Biomed. Eng. 2024; early access. [Google Scholar] [CrossRef]
  23. Li, Q.; Clifford, G.D. Signal quality and data fusion for false alarm reduction in the intensive care unit. J. Electrocardiol. 2012, 45, 596–603. [Google Scholar] [CrossRef] [PubMed]
  24. Elgendi, M.; Jonkman, M.; De Boer, F. Frequency Bands Effects on QRS Detection. Biosignals 2010, 2003, 2002. [Google Scholar]
  25. Rahman, S.; Karmakar, C.; Natgunanathan, I.; Yearwood, J.; Palaniswami, M. Robustness of electrocardiogram signal quality indices. J. R. Soc. Interface 2022, 19, 20220012. [Google Scholar] [CrossRef] [PubMed]
  26. Jin, Y.; Li, Z.; Qin, C.; Liu, J.; Liu, Y.; Zhao, L.; Liu, C. A novel attentional deep neural network-based assessment method for ECG quality. Biomed. Signal Process. Control 2023, 79, 104064. [Google Scholar] [CrossRef]
  27. Liu, S.; Zhong, G.; He, J.; Yang, C. Multi-task cascaded assessment of signal quality for long-term single-lead ECG monitoring. Biomed. Signal Process. Control 2023, 83, 104674. [Google Scholar] [CrossRef]
  28. Weiler, D.T.; Villajuan, S.O.; Edkins, L.; Cleary, S.; Saleem, J.J. Wearable heart rate monitor technology accuracy in research: A comparative study between PPG and ECG technology. In Proceedings of the Human Factors and Ergonomics Society Annual Meeting, Atlanta, GA, USA, 10–14 October 2022; SAGE Publications Sage CA: Los Angeles, CA, USA, 2017; Volume 61, pp. 1292–1296. [Google Scholar]
  29. Charlton, P.H.; Kotzen, K.; Mejía-Mejía, E.; Aston, P.J.; Budidha, K.; Mant, J.; Pettit, C.; Behar, J.A.; Kyriacou, P.A. Detecting beats in the photoplethysmogram: Benchmarking open-source algorithms. Physiol. Meas. 2022, 43, 085007. [Google Scholar] [CrossRef]
  30. Bishop, S.M.; Ercole, A. Multi-scale peak and trough detection optimised for periodic and quasi-periodic neuroscience data. In Intracranial Pressure & Neuromonitoring XVI; Springer: Berlin/Heidelberg, Germany, 2018; pp. 189–195. [Google Scholar]
  31. Galli, A.; Frigo, G.; Narduzzi, C.; Giorgi, G. Robust estimation and tracking of heart rate by PPG signal analysis. In Proceedings of the IEEE International Instrumentation and Measurement Technology Conference (I2MTC), Turin, Italy, 22–25 May 2017; IEEE: Piscataway, NJ, USA, 2017; pp. 1–6. [Google Scholar]
  32. Sjoding, M.W.; Dickson, R.P.; Iwashyna, T.J.; Gay, S.E.; Valley, T.S. Racial bias in pulse oximetry measurement. N. Engl. J. Med. 2020, 383, 2477–2478. [Google Scholar] [CrossRef] [PubMed]
  33. Bermond, M.; Davies, H.J.; Occhipinti, E.; Nassibi, A.; Mandic, D.P. Reducing racial bias in SpO2 estimation: The effects of skin pigmentation. In Proceedings of the 45th Annual International Conference of the IEEE Engineering in Medicine and Biology Society (EMBC), Sydney, Australia, 24–27 July 2023. [Google Scholar]
  34. Hartmann, V.; Liu, H.; Chen, F.; Qiu, Q.; Hughes, S.; Zheng, D. Quantitative comparison of photoplethysmographic waveform characteristics: Effect of measurement site. Front. Physiol. 2019, 10, 198. [Google Scholar] [CrossRef] [PubMed]
Figure 1. Scatter plots of HR estimated during sitting, from in-ear source signals and with data fusion methods, relative to the ground truth HR estimated from torso ECG. Different colors are associated with different subjects.
Biomedinformatics 04 00051 g001
Figure 2. Relationship between the MAE value and SQI for different sources.
Biomedinformatics 04 00051 g002
Table 1. Values of weights associated by Rankawat and Dubey [18] based on SQI and source type.
Source TypeSQI ≥ 0.90.9 > SQI ≥ 0.80.8 > SQI ≥ 0.7
Cardiovascular signals531
Non-cardiovascular signals320
Table 2. MAE values for single-source HR estimation and data fusion methods during the sitting activity. The smallest value in each row is designated in bold.
PPG1PPG2In-Ear ECGData Fusion
SubjectREDIRGREENREDIRGREENDeepMFRankawat and Dubey [18]Li et al. [17]
1119.819.0113.03.60.90.90.53.02.2
2106.538.8124.315.945.565.217.113.635
31.69.094.30.70.62.326.03.51.3
453.112.0123.94.41.572.72.53.74.4
512.97.3-5.62.4-45.226.77.6
626.436.498.028.319.384.948.11.625.3
773.528.583.579.773.3107.828.36.643.8
8101.355.3100.754.714.8107.256.92.731.6
96.13.35.937.635.278.337.03.63.6
1044.649.516.156.036.5106.329.815.517.3
Mean54.525.984.428.623.069.529.18.017.2
std39.619.550.327.624.541.716.78.415.7
Table 3. MAE values for single-source HR estimation and data fusion methods during the walking activity. The smallest value in each row is designated in bold.
PPG1PPG2In-Ear ECGData Fusion
SubjectREDIRGREENREDIRGREENDeepMFRankawat and Dubey [18]Li et al. [17]
149.750.873.430.34.62.831.92.25.8
271.263.381.670.671.08.830.614.212.1
318.027.7101.464.828.711.958.431.114.7
456.450.776.155.621.99.512.74.114.3
542.536.0-27.823.5-77.015.834.1
633.633.044.550.852.844.570.728.123.0
720.418.031.415.012.925.071.623.618.2
820.222.540.955.460.350.778.63.633.8
921.816.520.618.522.435.362.511.213.7
1019.715.712.712.431.815.225.615.413.6
Mean35.433.453.640.132.922.652.014.918.3
std18.816.633.421.721.517.724.310.29.3
Disclaimer/Publisher’s Note: The statements, opinions and data contained in all publications are solely those of the individual author(s) and contributor(s) and not of MDPI and/or the editor(s). MDPI and/or the editor(s) disclaim responsibility for any injury to people or property resulting from any ideas, methods, instructions or products referred to in the content.

