Article

Overall Survival Time Estimation for Epithelioid Peritoneal Mesothelioma Patients from Whole-Slide Images

by
Kleanthis Marios Papadopoulos
1,*,
Panagiotis Barmpoutis
1,
Tania Stathaki
1,*,
Vahan Kepenekian
2,3,
Peggy Dartigues
4,
Séverine Valmary-Degano
5,6,
Claire Illac-Vauquelin
7,
Gerlinde Avérous
8,
Anne Chevallier
9,
Marie-Hélène Laverriere
5,
Laurent Villeneuve
10,
Olivier Glehen
2,3,
Sylvie Isaac
11,
Juliette Hommell-Fontaine
11,
Francois Ng Kee Kwong
12 and
Nazim Benzerdjeb
3,11
1
Department of Electrical & Electronic Engineering, Faculty of Engineering, Imperial College London, London SW7 2AZ, UK
2
Department of Digestive Surgery, Lyon University Hospital, F-69000 Lyon, France
3
Center for Innovation in Cancerology of Lyon (CICLY) EA 3738, Faculty of Medicine and Maieutic Lyon Sud, Claude Bernard University Lyon I, F-69921 Oullins, France
4
Department of Pathology, Gustave Roussy Institute, F-94805 Villejuif, France
5
Department of Pathology, Grenoble University Hospital, F-38700 Grenoble, France
6
Institute for Advanced Biosciences, French National Institute of Health and Medical Research, Grenoble-Alpes University, F-38000 Grenoble, France
7
Department of Pathology, Claudius Regaud Institute, Institut Universitaire du Cancer de Toulouse Oncopole, F-31100 Toulouse, France
8
Department of Pathology, Strasburg University Hospital, F-67000 Strasburg, France
9
Department of Pathology, Nice University Hospital, F-06000 Nice, France
10
Department of Epidemiology and Clinical Research, Public Health Division, Lyon University Hospital, F-69002 Lyon, France
11
Department of Pathology, Institut de Pathologie Multisite, Groupement Hospitalier Sud, Hospices Civils de Lyon, F-69002 Lyon, France
12
Department of Histopathology, Norfolk and Norwich University Hospital, Norwich NR4 7UY, UK
*
Authors to whom correspondence should be addressed.
BioMedInformatics 2024, 4(1), 823-836; https://doi.org/10.3390/biomedinformatics4010046
Submission received: 24 January 2024 / Revised: 28 February 2024 / Accepted: 6 March 2024 / Published: 13 March 2024

Abstract

:
Background: The advent of Deep Learning initiated a new era in which neural networks relying solely on Whole-Slide Images can estimate the survival time of cancer patients. Remarkably, despite deep learning’s potential in this domain, no prior research has been conducted on image-based survival analysis specifically for peritoneal mesothelioma. Prior studies performed statistical analysis to identify disease factors impacting patients’ survival time. Methods: Therefore, we introduce MPeMSupervisedSurv, a Convolutional Neural Network designed to predict the survival time of patients diagnosed with this disease. We subsequently perform patient stratification based on factors such as their Peritoneal Cancer Index and on whether patients received chemotherapy treatment. Results: MPeMSupervisedSurv demonstrates improvements over comparable methods. Using our proposed model, we performed patient stratification to assess the impact of clinical variables on survival time. Notably, the inclusion of information regarding adjuvant chemotherapy significantly enhances the model’s predictive prowess. Conversely, repeating the process for other factors did not yield significant performance improvements. Conclusions: Overall, MPeMSupervisedSurv is an effective neural network which can predict the survival time of peritoneal mesothelioma patients. Our findings also indicate that treatment by adjuvant chemotherapy could be a factor affecting survival time.

Graphical Abstract

1. Introduction

Epithelioid Malignant Peritoneal Mesothelioma (EMPeM) is a rare type of cancer, with reported cases in industrialized countries ranging between 0.5 and 3 per one million for male patients and 0.2–2 per one million for female patients over a five-year period [1]. The main treatment option typically involves Cytoreductive Surgery (CRS) followed by Hyperthermic Intraperitoneal Chemotherapy (HIPEC) [2]. However, many EMPeM patients are not eligible for CRS [2]. Hence, physicians must consider alternative treatment options, such as chemotherapy and immunotherapy [2]. Physicians cannot confidently predict which patients will respond well to these treatments [2]. The disease is diagnosed using biopsies [
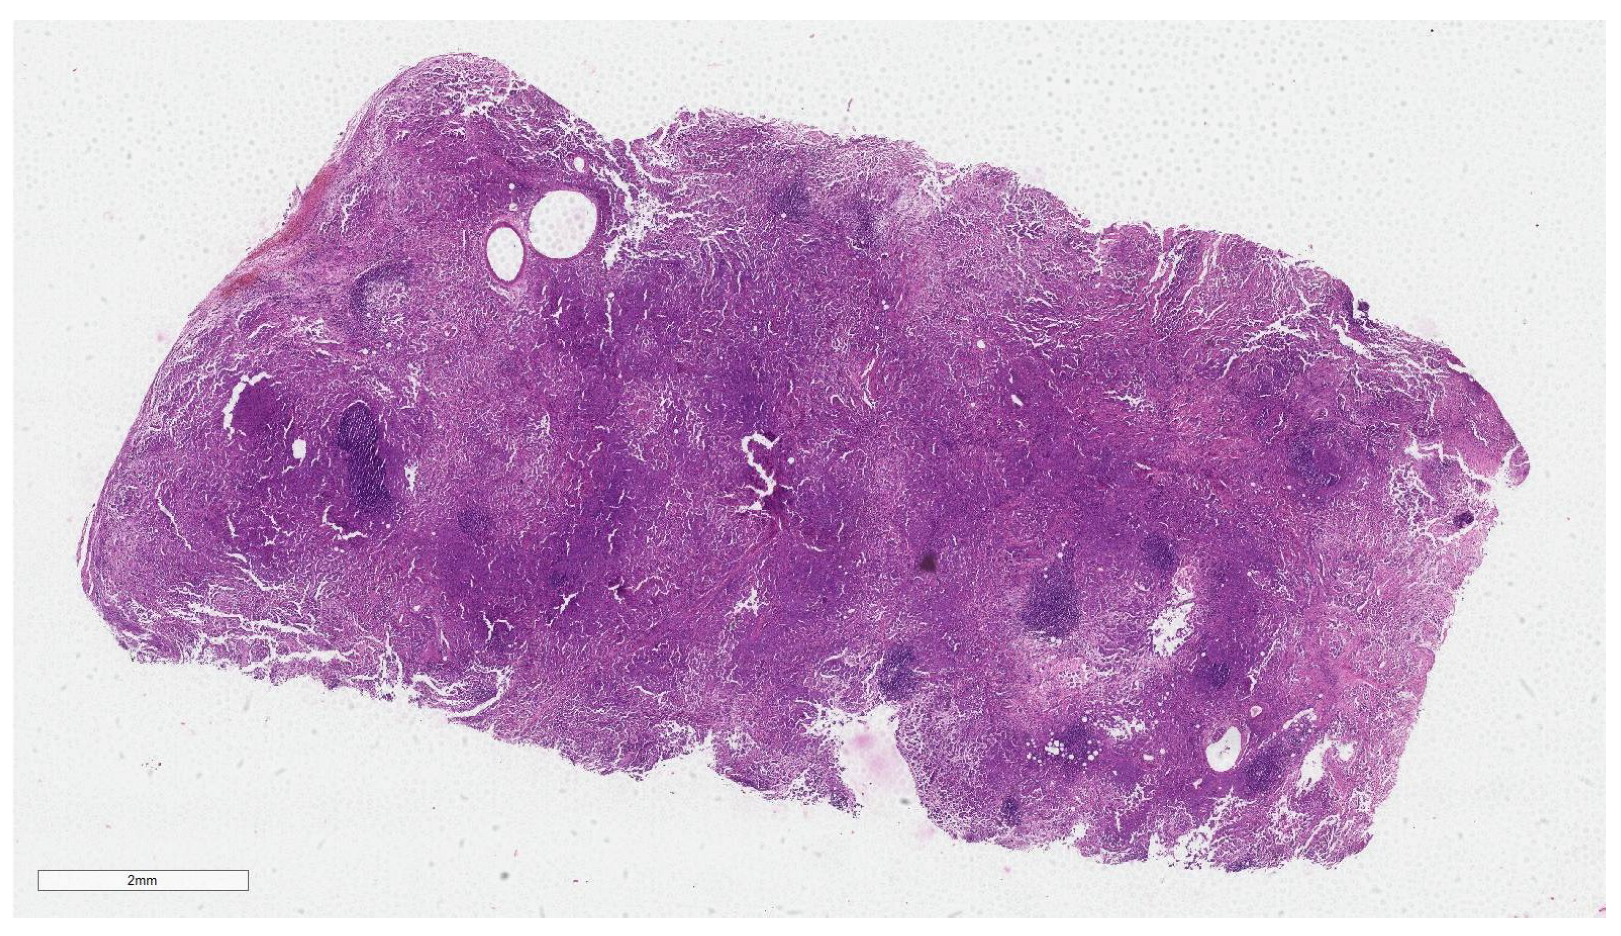
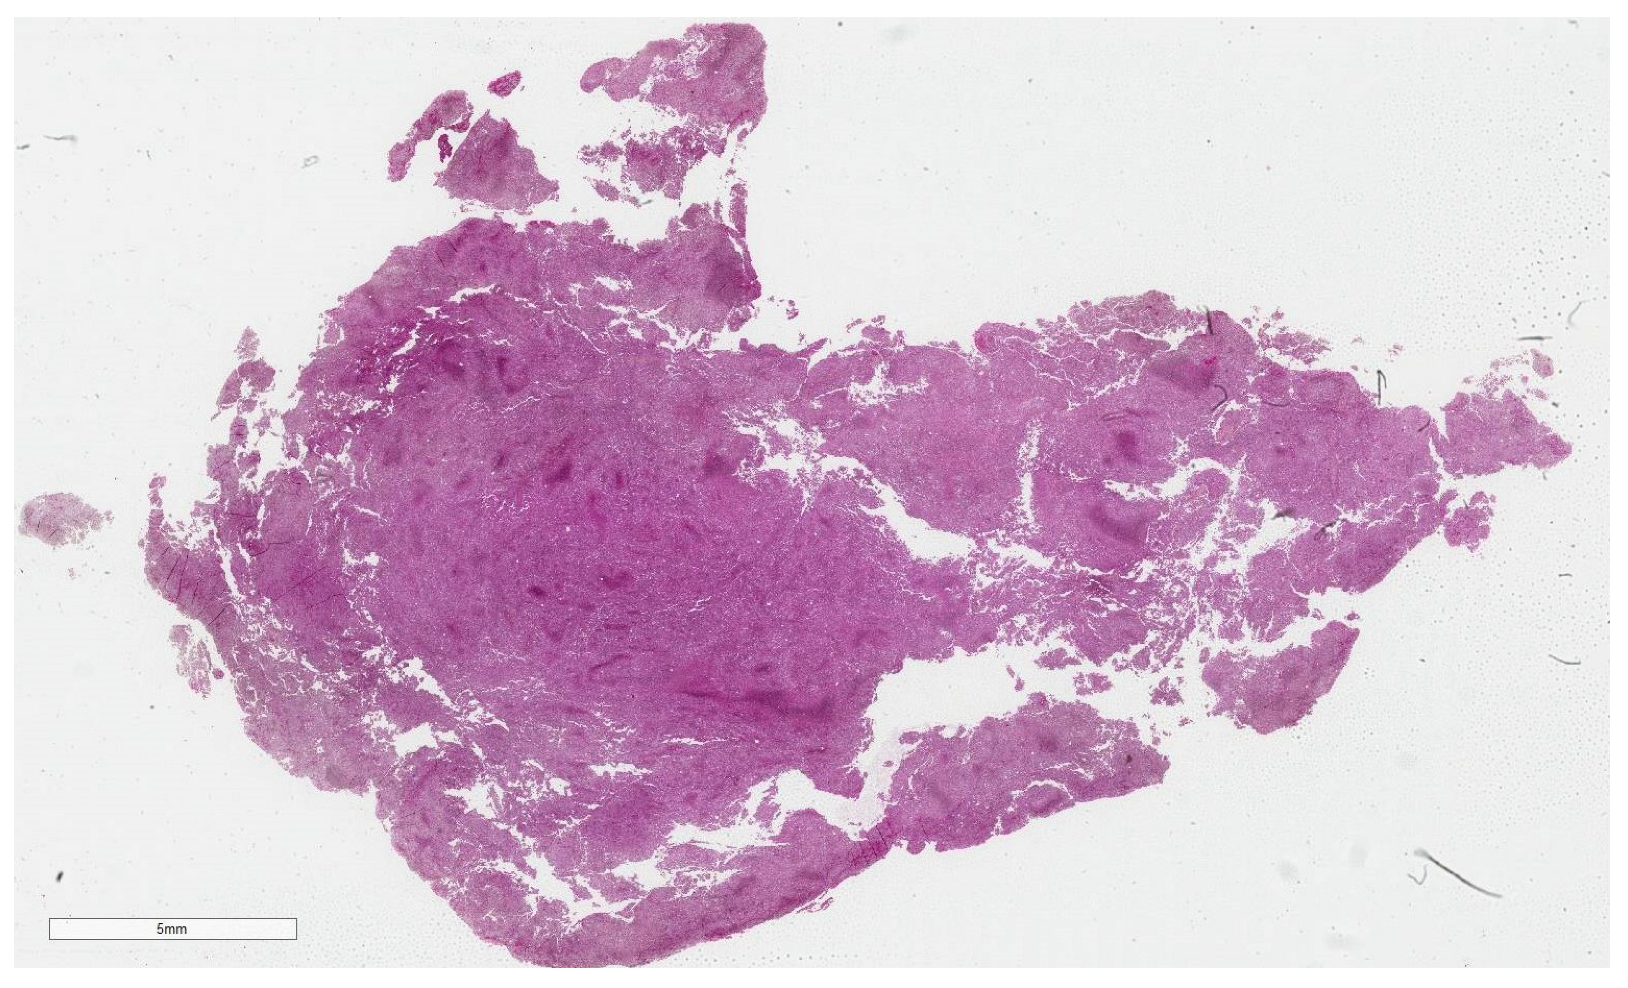
2] and the digitization of these biopsy samples leads to the creation of Whole-Slide Images (WSIs). WSIs are gigapixel-sized images of histopathological tissue [3].
Survival analysis is a broad field which traditionally relied on the Kaplan–Meier and the Cox proportional-hazards models to estimate patients’ expected lifespan [4]. In particular, these statistical models sought to obtain an estimate of patients’ Overall Survival (OS). OS is formally defined as the amount of time from the initiation of treatment until death or the last follow-up for individuals that survive the disease [5]. Machine Learning (ML) approaches, including Random Survival Forests (RSFs) [6] and Survival Support Vector Machines (SVMs) [7] were later presented.
However, the emergence of Deep Learning (DL) and specifically Convolutional Neural Networks (CNNs) enabled the development of architectures that can exploit WSI features to perform this task. A foundational model named DeepConvSurv is presented by Zhu et al. [8]. It is a fully supervised approach and has the limitation of relying on patches extracted from manually annotated Regions of Interest. Authors in [9] propose an improved method, where patches are sampled randomly and subsequently grouped into clusters. DeepConvSurv is then trained using each cluster as input to obtain a survival prediction [9]. Authors in [10] present a fully-supervised network utilizing a ResNet50 network as a feature extractor, followed by a series of fully connected layers.
Later works prioritized Weak Supervision as a more scalable solution, particularly when dealing with large datasets that would otherwise require extensive manual annotation. The majority of approaches use Multiple Instance Learning (MIL). A key reference in this direction is [11], in which the authors present MesoNet, which was developed from WSIs of pleural mesothelioma patients.
Newer contributions to the field deploy attention mechanisms and transformer-based architectures. For instance, WSS-CNN is an architecture presented in [4], which consists of a weakly supervised CNN with a visual attention mechanism, which includes a spatial and a channel module. Authors in [12] combined CNNs and Transformers to develop a network capable of learning both local and global features for survival prediction.
All of the above-mentioned frameworks tackle survival estimation as a ranked regression problem as they essentially seek to place patients from the test set in the correct order. Their main goal is to achieve the highest possible concordance index [13], which is the most widely used metric for this task.
Instead of ranking survival times, Wulczyn et al. in [14] formulated the task as a classification problem. Survival times are assigned into discrete intervals, thus creating discrete classification bins [14]. The model’s objective is thus to allocate each WSI to the correct bin. MIL is also used in this case as an average pooling layer aggregate feature from multiple patches belonging to a specific patient [14]. Furthermore, the recently published Surformer network obtains both global and local WSI features and deploys self and cross-attention mechanisms along with a custom loss function to achieve a higher concordance index compared to other methods [15].
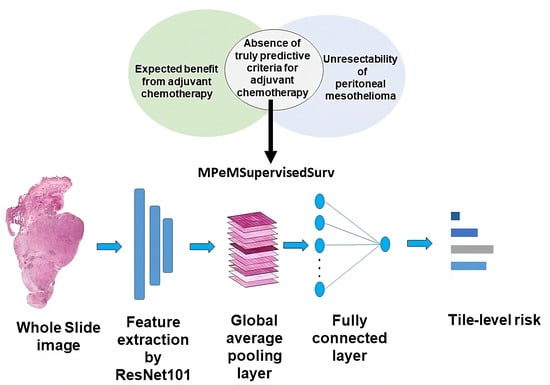
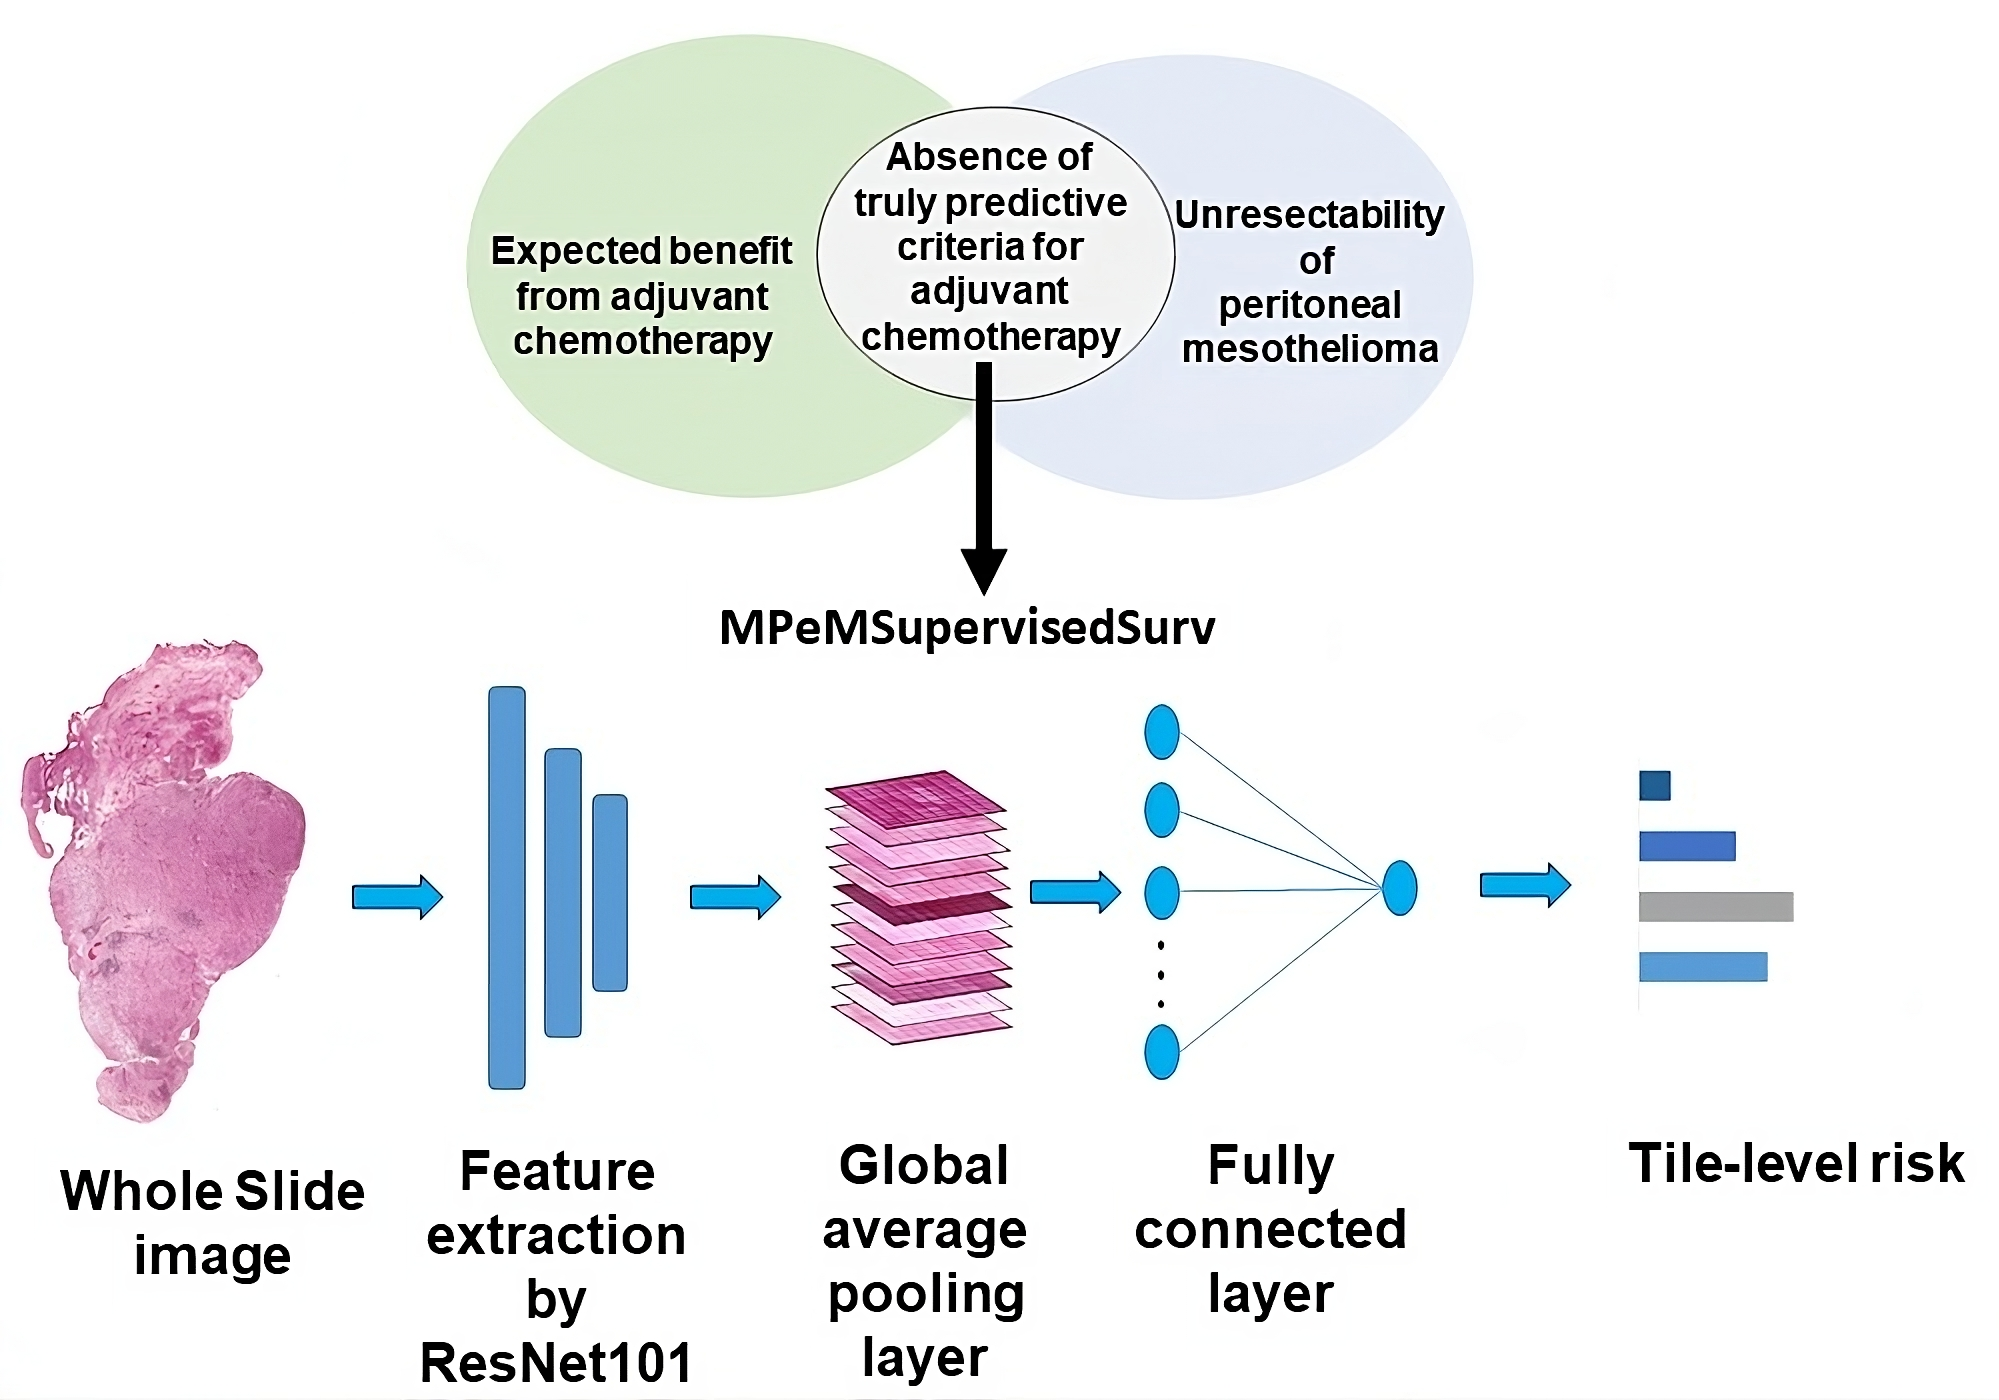
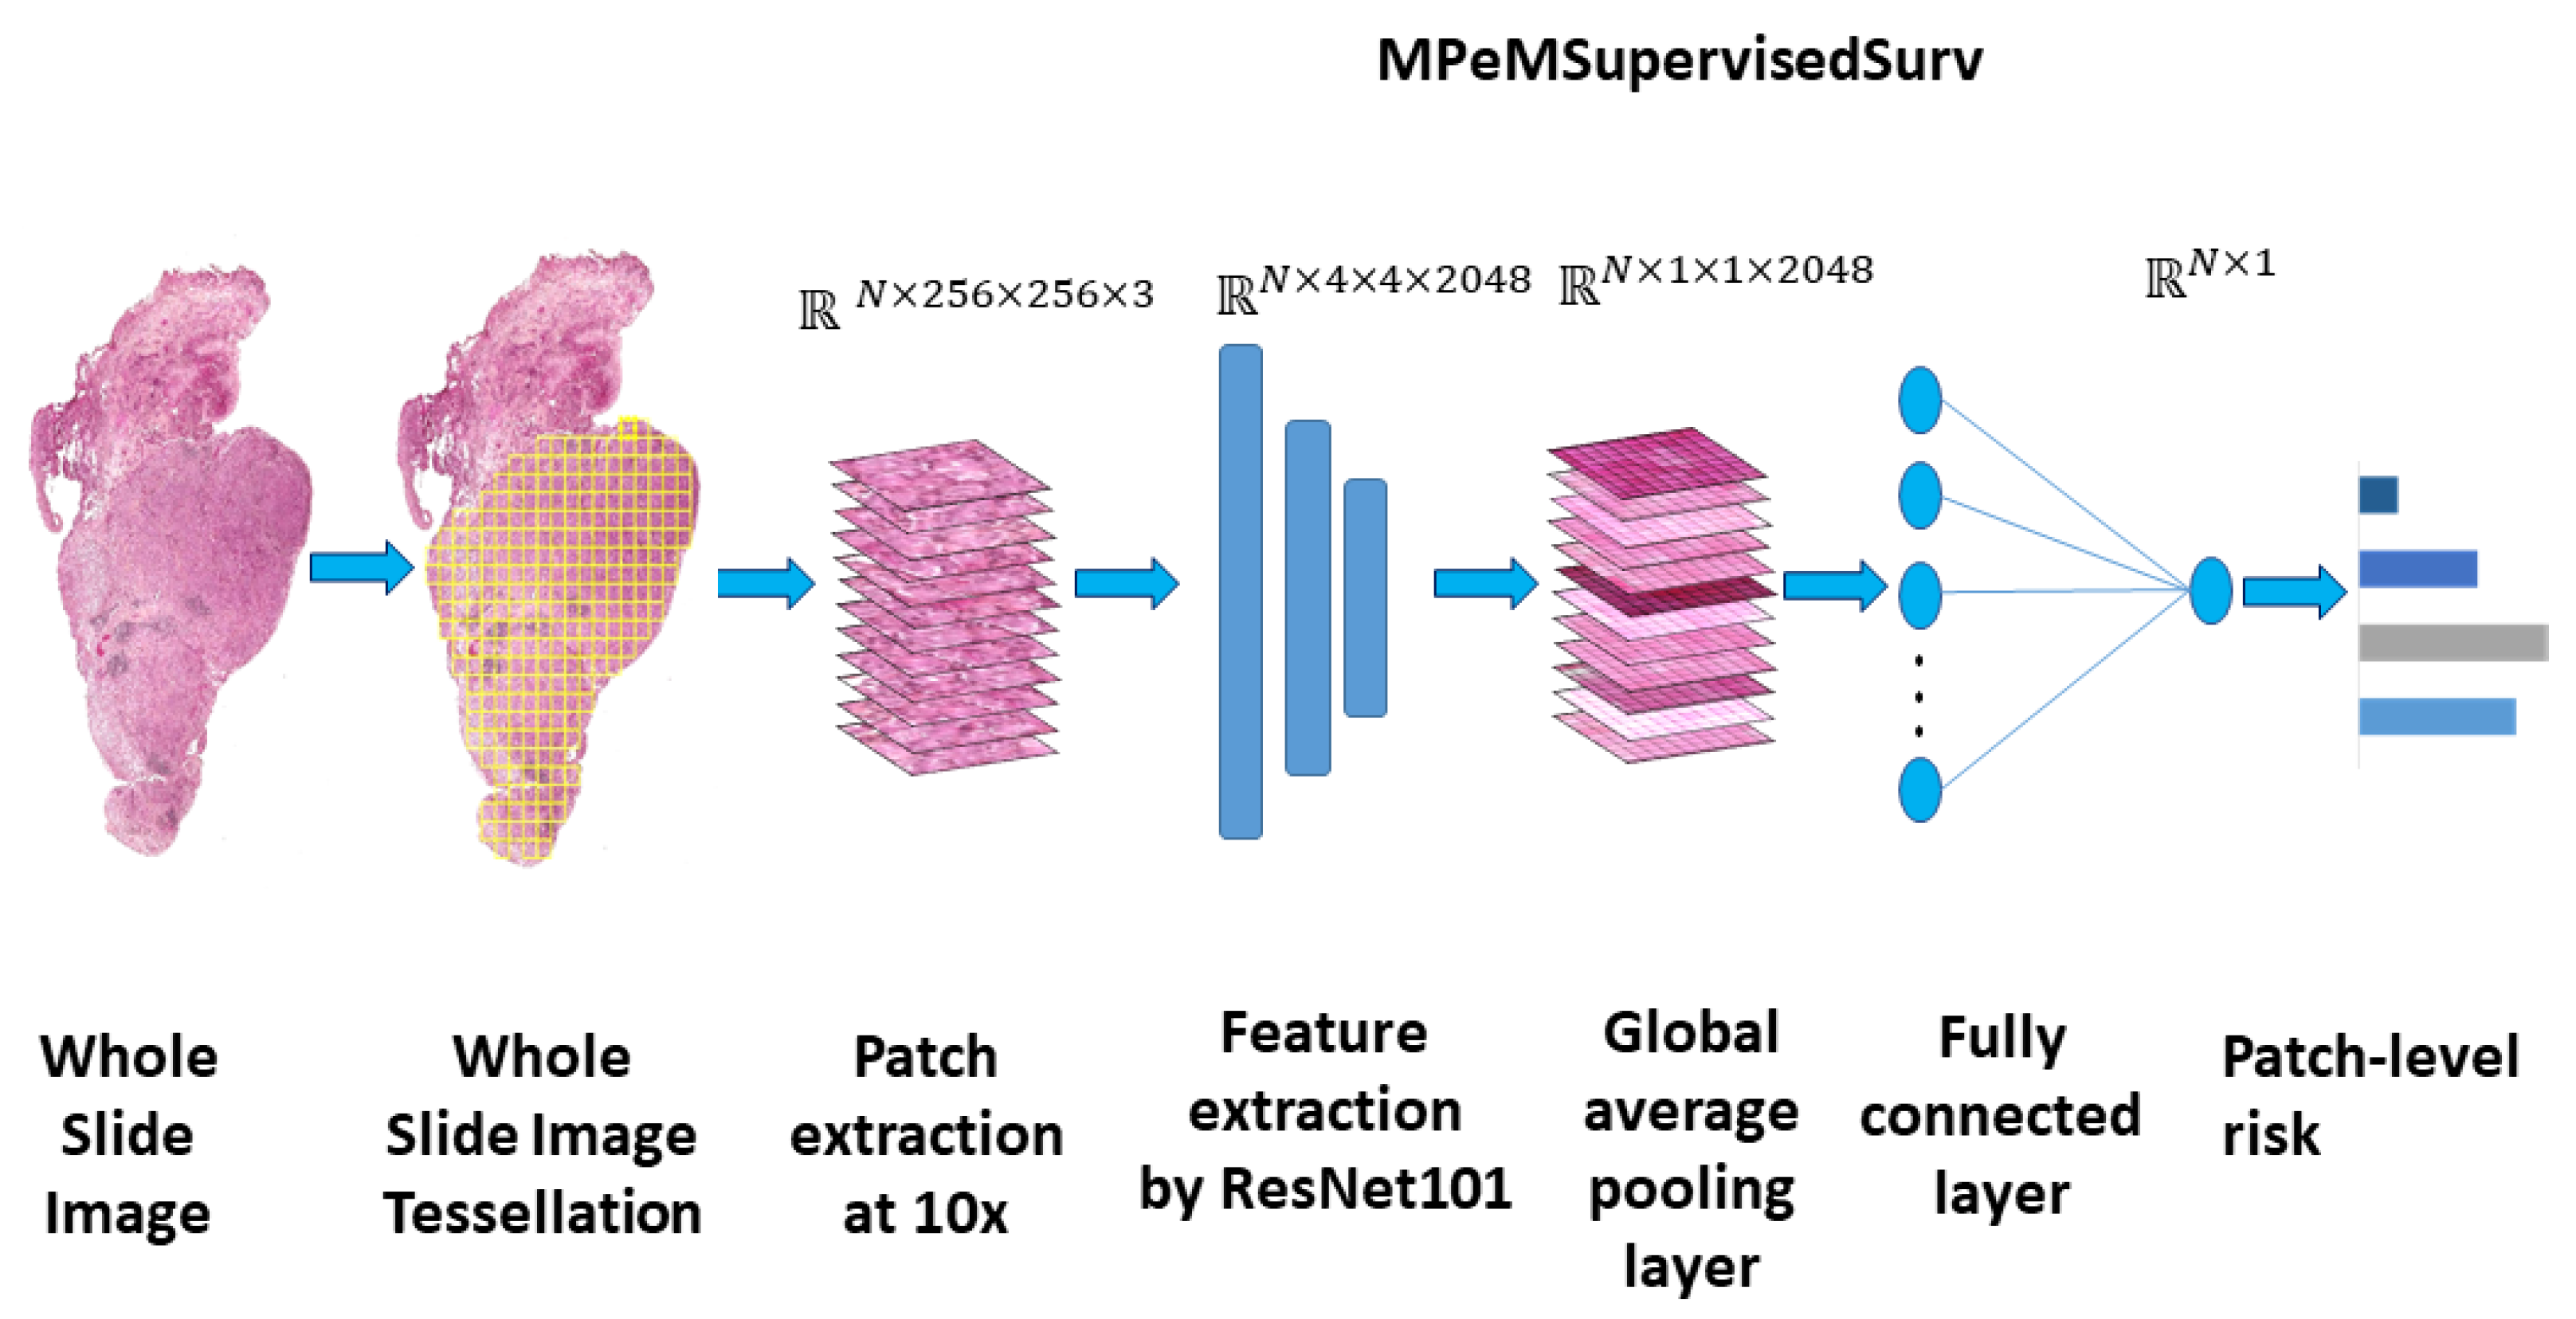
Our proposed network, MPeMSupervisedSurv, is a robust fully supervised network designed specifically to address the challenge of WSI-based survival estimation for EMPeM patients. Our approach is end-to-end and utilizes a neural network with a minimal number of layers, while avoiding the need for any manual annotations. Our contribution also includes a comprehensive analysis of the factors affecting the Overall Survival time of EMPeM patients. Our study is notable because it uniquely integrates clinical features with unstructured features extracted from Whole Slide Images (WSIs), providing clinicians with novel insights regarding this disease.
This paper is organised as follows: Section 2 describes the WSI EMPeM dataset used in our study and our proposed neural network architecture. The model’s achieved accuracy compared to similar methods is presented in Section 3 along with its performance in specific patient stratification scenarios. Section 4 discusses the results of our research and mentions limitations along with directions of future research. A summary of the findings and conclusions of our analysis is presented in Section 5.

2. Dataset and Methods

2.1. Ethical Considerations

The RENAPE (French Network For Rare Peritoneal Tumors) observational registry adheres to the regulations and ethical principles outlined in the 2013 Declaration of Helsinki. Patients gave informed consent prior to the storage of Formalin-Fixed Paraffin-Embedded (FFPE) tumor samples. In addition, the RENAPE database has obtained approval from the Comité Consultatif sur le Traitement de l’Information en matière de Recherche dans le domaine de la Santé (CCTIRS en_10.257). It has also been registered with the Commission Nationale de l’Informatique et des Libertés (CNIL e no. DR-2010-297). The registration was conducted in line with the provisions contained in Law no. 78-17 of the French Republic regarding information processing, files, and individuals’ right to privacy (ClinicalTrials.gov Identifier: NCT02834169 [16]).

2.2. Population Characteristics

Clinical and pathological data pertaining to epithelioid peritoneal mesothelioma patients between 1995 and 2018 were gathered from 7 health institutions located in France. The data were sourced from the RENAPE observational registry. Each patient’s histological and immunohistochemical profile was used to formulate the diagnosis for the disease. Demographic features, including age and gender, along with details of surgical procedures, and chemotherapy treatments, were compiled. Furthermore, critical information, including date of death and of recurrence, or last follow-up was recorded for every patient. The Peritoneal Cancer Index (PCI) is the metric that was used to evaluate the severity of peritoneal metastasis and adopts values ranging from 0 to 39. Clinical, radiological, and histological findings were used to assess tumor progression.

2.3. Dataset

WSIs are pyramidal images obtained from the digitization of conventional histopathological glass slides [3]. Regarding our particular dataset, WSIs were obtained at 40× magnification, providing the capability to be examined at magnifications of 40×, 20×, 10×, and 5×. They were digitally stored as .svs files.
Our patient cohort consists of 138 peritoneal mesothelioma WSIs. In addition to the image files, tabular data in the form of an Excel file was provided, which included demographic and clinical information, as well as OS time. Among these 138 patients, OS information was not available for 7 patients, which resulted in a slightly smaller training set of 131 patients. It is worth noting that datasets of this type typically contain both censored and uncensored observations [11]. The term “censored observations” refers to patients who were alive at the end of the clinical study [11]. Regarding this specific dataset, 79 patients are considered censored, and 55 are considered uncensored. Figure 1 and Figure 2 depict WSIs from two different patients of this cohort.
The Kaplan–Meier survival curves for the population and for cohorts obtained from patient stratification based on sex, age, and nuclear grade are shown in Figure A1, Figure A2, Figure A3 and Figure A4, respectively, which can be found in Appendix A.

2.4. Methods

2.4.1. WSI Preprocessing

Due to the information-dense nature of WSIs, their size often exceeds the capacity of computer memory when processed at full resolution [3]. They also contain a significant amount of non-tumor tissue [17], which is irrelevant to the DL algorithm’s objectives. Therefore, a series of preprocessing steps are required. We used WSIs of 10× (1 micron per pixel) magnification. Firstly, we divided each WSI non-overlapping tiles measuring 256 × 256 pixels. Afterwards, we applied intensity thresholding to separate patches containing relevant tissue matter from those that consisted primarily of background elements. A small number of tiles contained pen marks or were overly noisy. They were detected and removed using the ‘wsi-tile-cleanup’ library, available at [18]. Through this procedure, we obtained a usable set of tissue patches, which is expected to contain a number of features that can be exploited by a deep learning model. The process is visually summarized in Figure 3.

2.4.2. Model Architecture

CNNs are employed in a variety of fields, including medical imaging, where they excel in extracting meaningful features from images to perform various computer vision tasks, such as classification, detection, and segmentation, among others [19]. They employ the convolution operation to identify local patterns from input images [19]. The use of multiple convolutional layers allows this type of artificial neural network to learn hierarchical data representations [19]. Initial CNN layers capture simpler patterns, such as edges and textures [19]. Later layers encode high-level features, such as complex shapes, and utilize the patterns previously learned to obtain a more elaborate representation of the input dataset [19]. Convolutional layers allow for parameter sharing, which ensures that the network can detect a feature that is present in multiple parts of the image without having to learn new weights [19]. Therefore, the number of parameters which need to be learned are reduced and the computational burden is eased.
Capturing increasingly sophisticated features often leads to an increase in neural network depth. However, this can present challenges during the training process, potentially leading to a drop in accuracy [20]. Authors in [20] present the ResNet (Residual Network) architecture as a solution to address this issue. The results reported in [20] regarding accuracy on the ImageNet and CIFAR-10 datasets indicate that ResNet models are adept at feature extraction. Empirical confirmation of the architecture’s efficacy is evident by its widespread adoption in various works, where CNN-based architectures incorporate ResNet models for enhanced feature extraction, such as in [21]. ResNet-based feature extractors, initially pre-trained on the ImageNet dataset, are thus widely used in digital pathology and are considered effective despite the expected domain shift [22].
MPeMSupervisedSurv is inspired from the EE-Surv architecture presented in [10]. EE-Surv uses a ResNet50 network for feature extraction and subsequently a global average poling layer along with five fully connected layers to flatten the feature map and obtain a risk score for WSI patches [10]. In contrast, MPeMSupervisedSurv performs feature extraction with a ResNet101 backbone. A global average pooling layer followed by a single fully connected layer are subsequently used to obtain a scalar prediction score for each tile. The global average pooling layer reduced the dimensionality of the feature map from 4 × 4 resolution with 2048 channels to 1 × 1 resolution with the same number of channels. The fully connected layer is equipped with a single output neuron and a linear activation function. Considering that we formulated this problem as a regression task, the output layer should use either a Linear or a Rectified Linear Unit activation function. These two activation functions are mathematically defined, respectively, as follows in Equations (1) and (2):
Linear ( x ) = x , x R
ReLU ( x ) = x , x > 0 0 , x 0
We selected the linear activation function as the Cox loss function contains a softmax term, as indicated in Equation (5). Experimentally, we found that the network achieved lower concordance index values when using the ReLU activation function, which reaffirms our choice of the linear activation function.
Our proposed architecture can learn intricate patterns present in the EMPeM dataset due to the larger depth of the ResNet101 backbone. Employing a deeper feature extractor is expected to increase the risk of overfitting. We initially used 5 fully connected layers after applying global average pooling. We subsequently discovered that removing the inner fully connected layers helped us better manage this risk. Considering that our network is based on a dataset comprising at least 100 fewer patients than other survival analysis works, we found that it is important to eliminate redundant layers, so that the number of trainable network parameters is not overly high. A diagram of our architecture is provided in Figure 4.

2.4.3. Training Procedure

Due to the varying size of WSIs, we followed the approach of sampling the same number of patches from each WSI. After experimenting with patch quantities ranging from 100 to 400, we determined that 250 was a choice that balances the need to sample a sufficient number of patches with avoiding overfitting. Patches were loaded as individual images and the OS time and event indicator labels were replicated such that patient-level supervision becomes patch-level supervision. Affine transformations, including horizontal and vertical flipping as well as random rotation, were used for data augmentation because approximately 20% of patients had fewer than 250 tissue patches at 10× magnification.
Our dataset consisted of patches with a resolution of 256 × 256 pixels. We randomly divided the dataset into training and test sets using an 80–20 20 split for both censored and uncensored observations. Specifically, we ensured that 80% of uncensored observations were assigned to the training set and the remaining 20% to the test set. We then repeated this for censored observations. We followed this approach to ensure that our training and test sets were as balanced as possible, given that censored observations directly affect the model’s loss function. Afterwards, we resized our training and test sets to a 128 × 128 pixel resolution because pre-trained ResNet models require input images of size 224 × 224 or less, which are also divisible by 16. The color intensities in each patch were then standardized to facilitate model training.
We initially used Stochastic Gradient Descent with momentum as the optimizer. We then found Adam to be a better choice as it yielded significantly higher accuracy. Our choices for number of epochs, batch size, learning rate, and weight decay factor are listed in Table 1. We found that a batch size of at least 64 was needed for the training loss to monotonically decrease. As a larger batch size can lead to a more accurate approximation of the loss function, we experimented with larger batch sizes. We selected the value of 128 as it balances having a larger batch size with fitting a sufficient number of images in the Graphics Processing Unit (GPU) for efficient training. Training beyond 25 epochs was not required as the model already achieved the highest possible accuracy. Stable training could be achieved with a learning rate smaller than 10 3 . We set the learning rate to 10 4 as it achieved the necessary balance between stability and quick convergence.
Our implementation is based on version 2.10 of the Tensorflow framework. The model layers are created using the Keras Application Programming Interface (API). The computation of the concordance index which accounts for censored observations is performed using the scikit-survival module [23].

2.4.4. Loss Function and Model Evaluation

The neural network was trained utilizing the Cox loss function, which is inspired by the Cox proportional hazards model [4]. The latter incorporates multiple covariates, including demographic and clinical variables, and attempts to illustrate how each variable, either by itself or in conjunction with others, affects the estimated survival time [4]. According to [4], the instantaneous risk h of a patient’s death at time t given a fixed vector of analysis variables x ̲ is defined as
h ( t | x ) = h 0 ( t ) · exp ( ( β ̲ ) T x ̲ )
where h 0 ( t ) denotes the baseline hazard, and β ̲ is the vector of regression parameters.
For a patient i, we denote by ( t i , δ i ) the associated OS time and indicator variable. Based on [12,15], the convention for δ i is :
δ i = 1 , patient has experienced death event at end of study 0 , patient has not experienced death event at end of study
We denote by R ( t i ) the risk set of the i t h patient, which consists of all patients whose survival time is greater than or equal to that of the ith patient [12]. The Cox partial likelihood is hence given by
L = i exp [ g ( x i ) ] j R ( t i ) exp [ g ( x j ) ] ,
where g ( x i ) denotes the Cox model output of the ith patient [12]. In order to obtain a loss function, we minimize the negative log partial likelihood [12] of Eqaution (5):
L o s s = 1 N i δ i exp [ g ( x i ) ] log j R ( t i ) exp [ g ( x j ) ]
In this case, g ( x i ) denotes the neural network output of the ith patient, g ( x j ) is the neural network output of all patients j i , and N is the total number of patient WSIs [12].
As some patient data are censored, and the survival data distribution is imbalanced, survival analysis models use the concordance index as an accuracy metric. Mathematically, the concordance index is defined as [13]
c index = 1 n i 1 N δ i = 1 t j > t i I f i > f j ,
where n denotes the total number of observations, and I is known as the indicator function, which is defined as
I ( X ) = 1 , condition X is true 0 , condition X is false
A pair of patients ( i , j ) is concordant if the estimated risk f i of the ith patient is larger than the risk of the jth patient, who has lived for a longer time, as expressed by the condition t j t i . The inner summation is performed over the set of every jth patient, for which the condition t j t i holds. It is assumed that the death event has occurred for patient i. This assumption is expressed by the condition δ i = 1 . The c-index can thus be re-written as
c index = total number of concordant pairs total number of evaluated pairs

3. Results

3.1. Model Accuracy Results

Traditional survival analysis methods include Random Survival Forests (RSFs) [6] and Survival Support Vector Machines (SVMs) [7]. Given that these methods were not originally designed to handle images, feature extraction was first performed to convert WSI patches into feature vectors.
Two CNN-based methods with full-patch supervision were then compared with the proposed network. The training and testing sets were the same across all methods and no patient stratification was performed. Each model’s accuracy based on the concordance index is shown in Table 2.

3.2. Overall Survival Factor Analysis Results

Effectively managing EMPeM remains an open question because of this disease’s low incidence rate [1]. This has motivated clinical studies that perform statistical analysis to identify factors which are associated with patient outcomes.
We first divided the cohort into male and female patients and report the results in Table 3. Both subcohorts consisted of 65 patients. As the median age of the patient cohort is 60, patient stratification can be performed based on age. The population is approximately equally distributed between the two subsets, considering that 67 patients have an age greater than or equal to the median, and the remaining 63 are assigned to the younger subcohort. The obtained concordance index values are provided in Table 4.
Among the 130 patients included in the study whose OS is known, distinct chemotherapy regimens were administered to different population subsets: neoadjuvant chemotherapy, adjuvant chemotherapy, and Hyperthermic Intraperitoneal Chemotherapy (HIPEC). In order to investigate if neoadjuvant chemotherapy could enhance the accuracy of our DL model, we performed patient stratification based on this criterion. Specifically, 74 patients from the cohort received chemotherapy prior to surgery, and 55 patients did not. The results are summarized in Table 5. Furthermore, we assessed the model’s efficacy for patients that received chemotherapy after treatment. In this case, 29 patients from the cohort received adjuvant chemotherapy, and 89 patients did not. The results are displayed in Table 6. We completed our chemotherapy factor analysis by stratifying patients based on whether they underwent HIPEC, and the results are shown in Table 7. In this scenario, 97 patients received HIPEC, and 26 did not.
We concluded our experimentation by performing patient stratification based on the PCI. It was available for 99 patients in total, and the median value was 21.5 . The concordance index values achieved by MPeMSupervisedSurv for patients with a low and high PCI score in comparison to the calculated median are presented in Table 8.

4. Discussion

In general, the concordance index typically falls within the range of [ 0 , 1 ] [13]. A c-index of 0.5 is equivalent to a random guess [13], while a value equal to 1 signifies total accuracy [13]. Hence, any proposed model must demonstrate accuracy exceeding 0.5 and be as close to 1 as possible.
The results in Table 2 demonstrate the significant performance improvement of deep learning over machine learning methods. SurvivalSVM and Random Survival Forests achieve a concordance index approximately equal to 0.5 . In contrast, Deep Learning approaches designed to handle images demonstrate more robust performance as they achieve a concordance index of at least 0.6 . The performance difference between DeepConvSurv and the other methods listed in Table 2 is notable. It is attributed to the fact that DeepConvSurv does not utilize transfer learning, while EE-Surv and MPeMSupervisedSurv both use pre-trained ResNet networks for feature extraction. Transfer learning leverages knowledge gained from a source task so that higher accuracy can be achieved on the task of interest [24]. Its efficacy is well documented in various fields, such as medicine and bioinformatics, among others [24]. Subsequently, training the model with a deeper feature extractor and a single fully connected layer resulted in a slightly higher c-index value for this dataset, compared to what could be achieved with the EE-Surv architecture.
Our findings regarding the factors affecting OS appear to agree with those of prior studies, whilst also providing novel insights on variables previously unexplored. The results in Table 3 and 
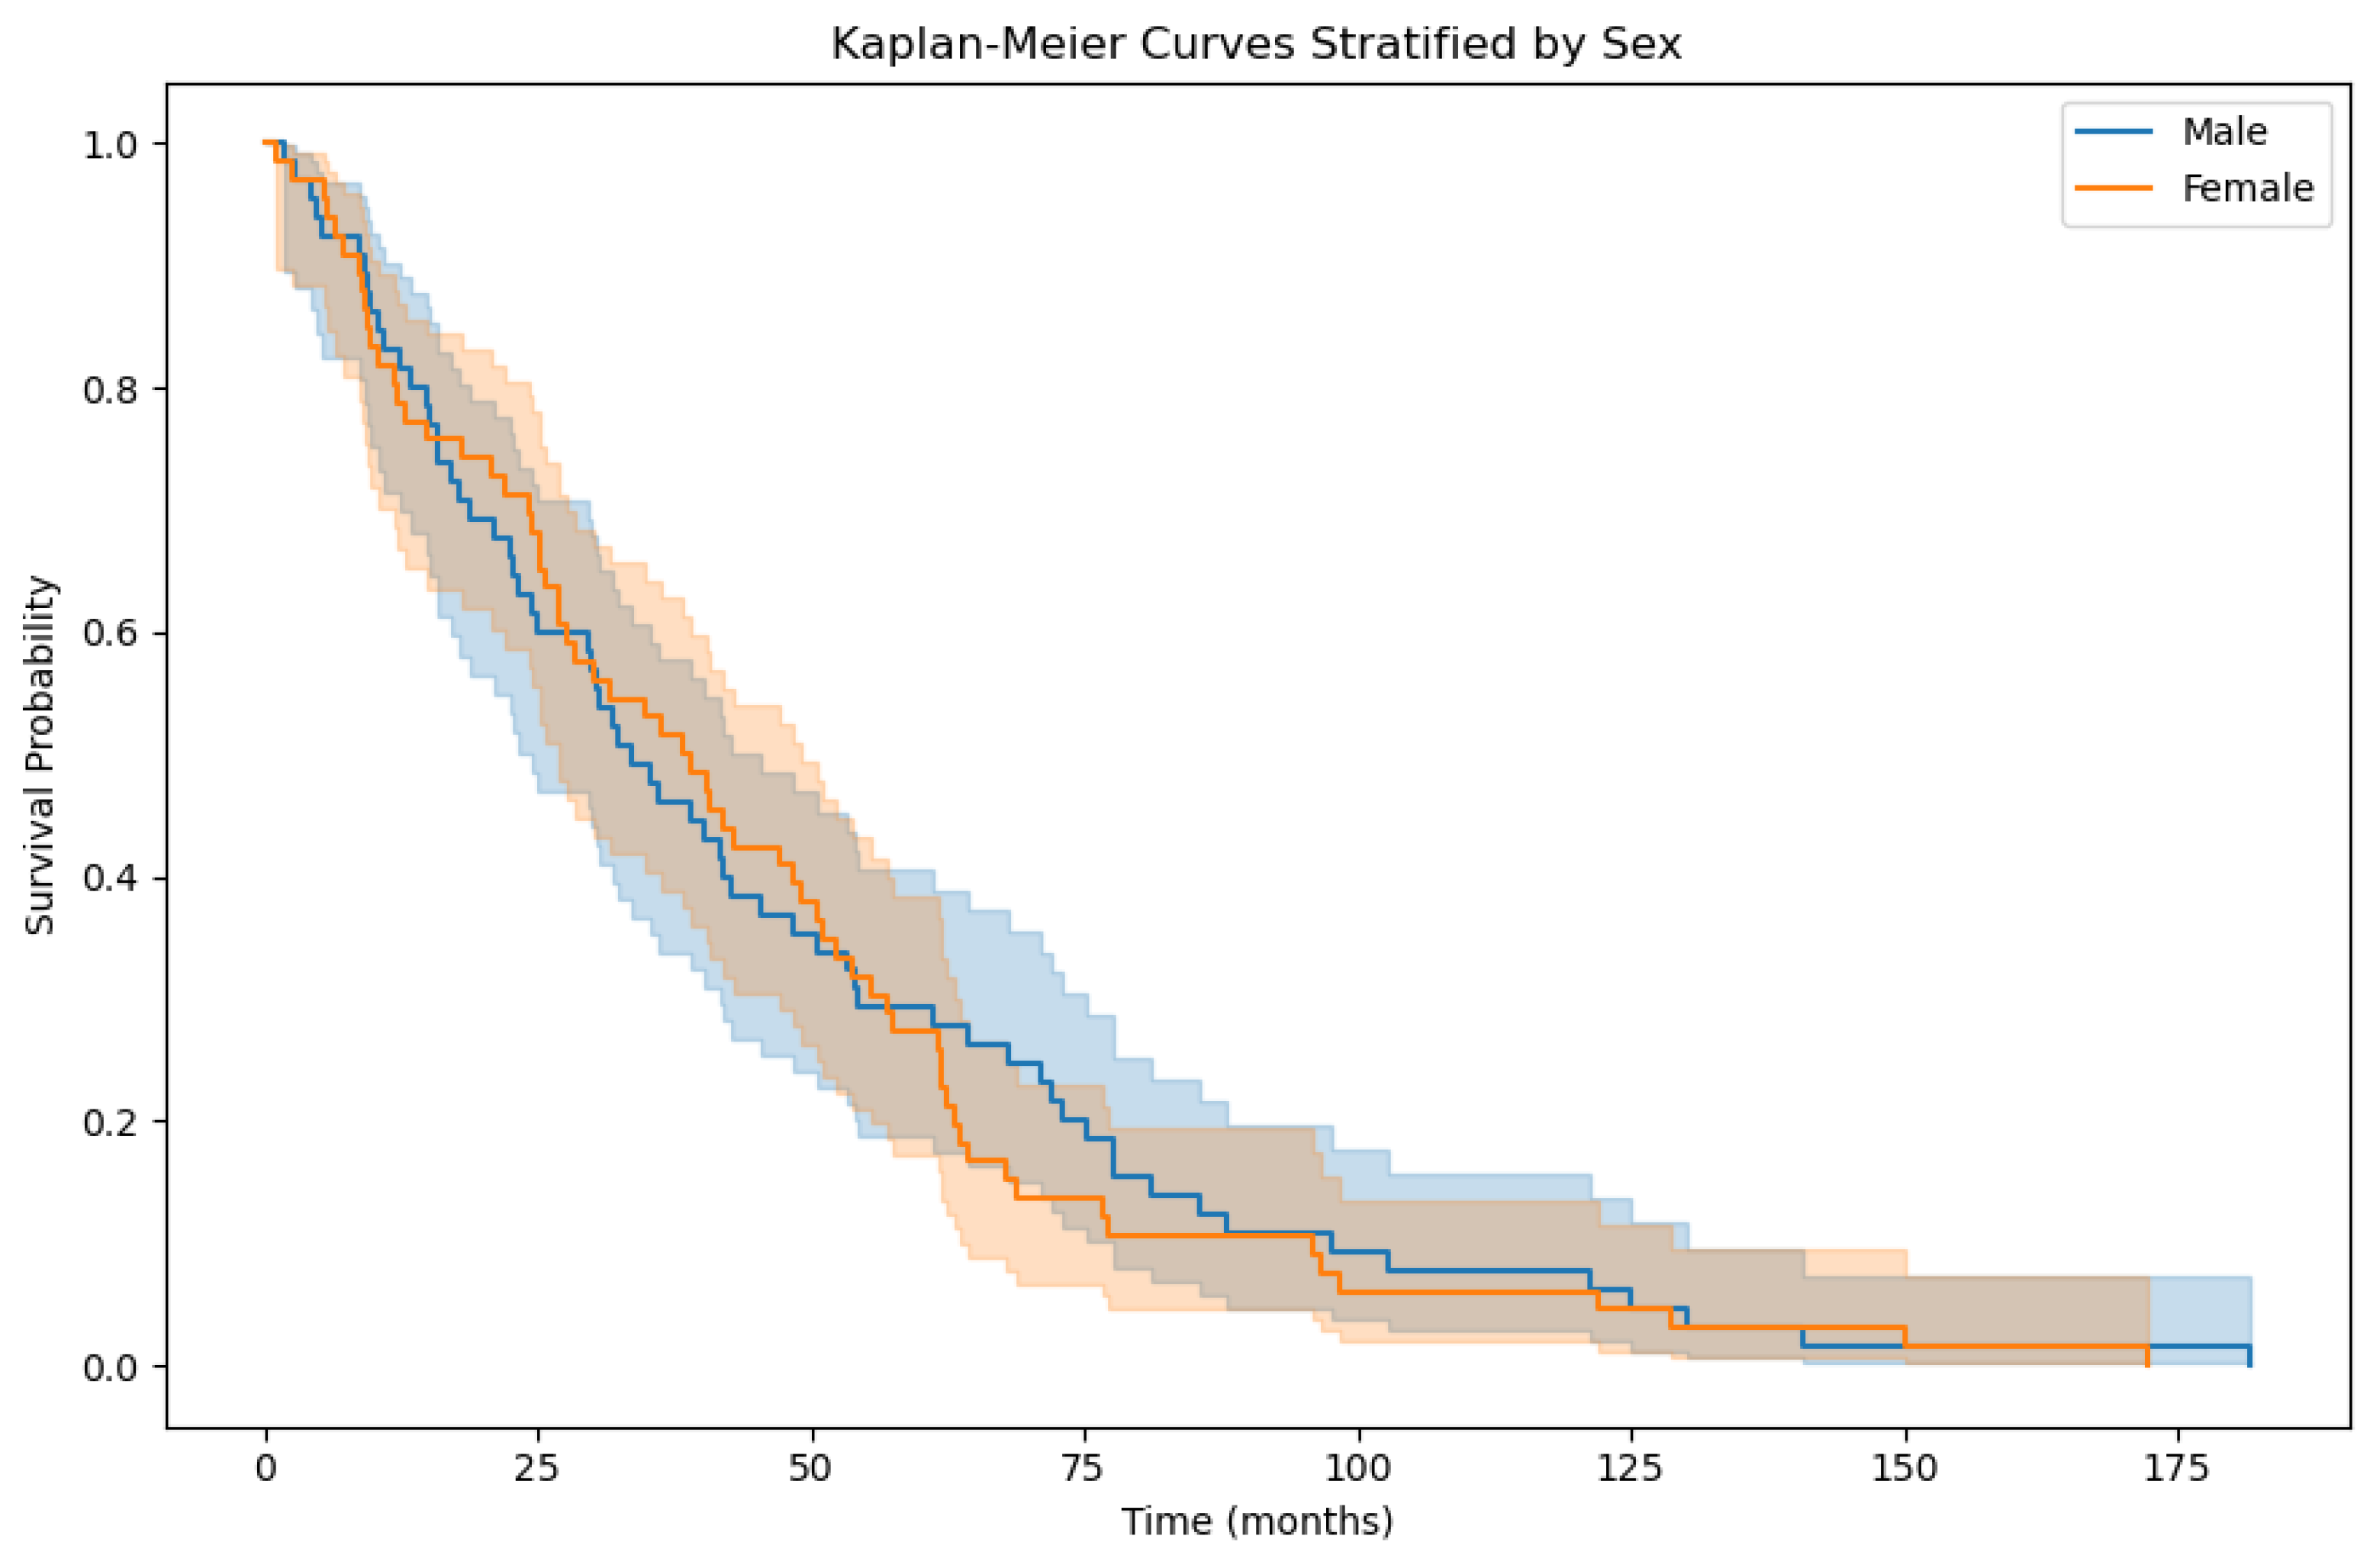
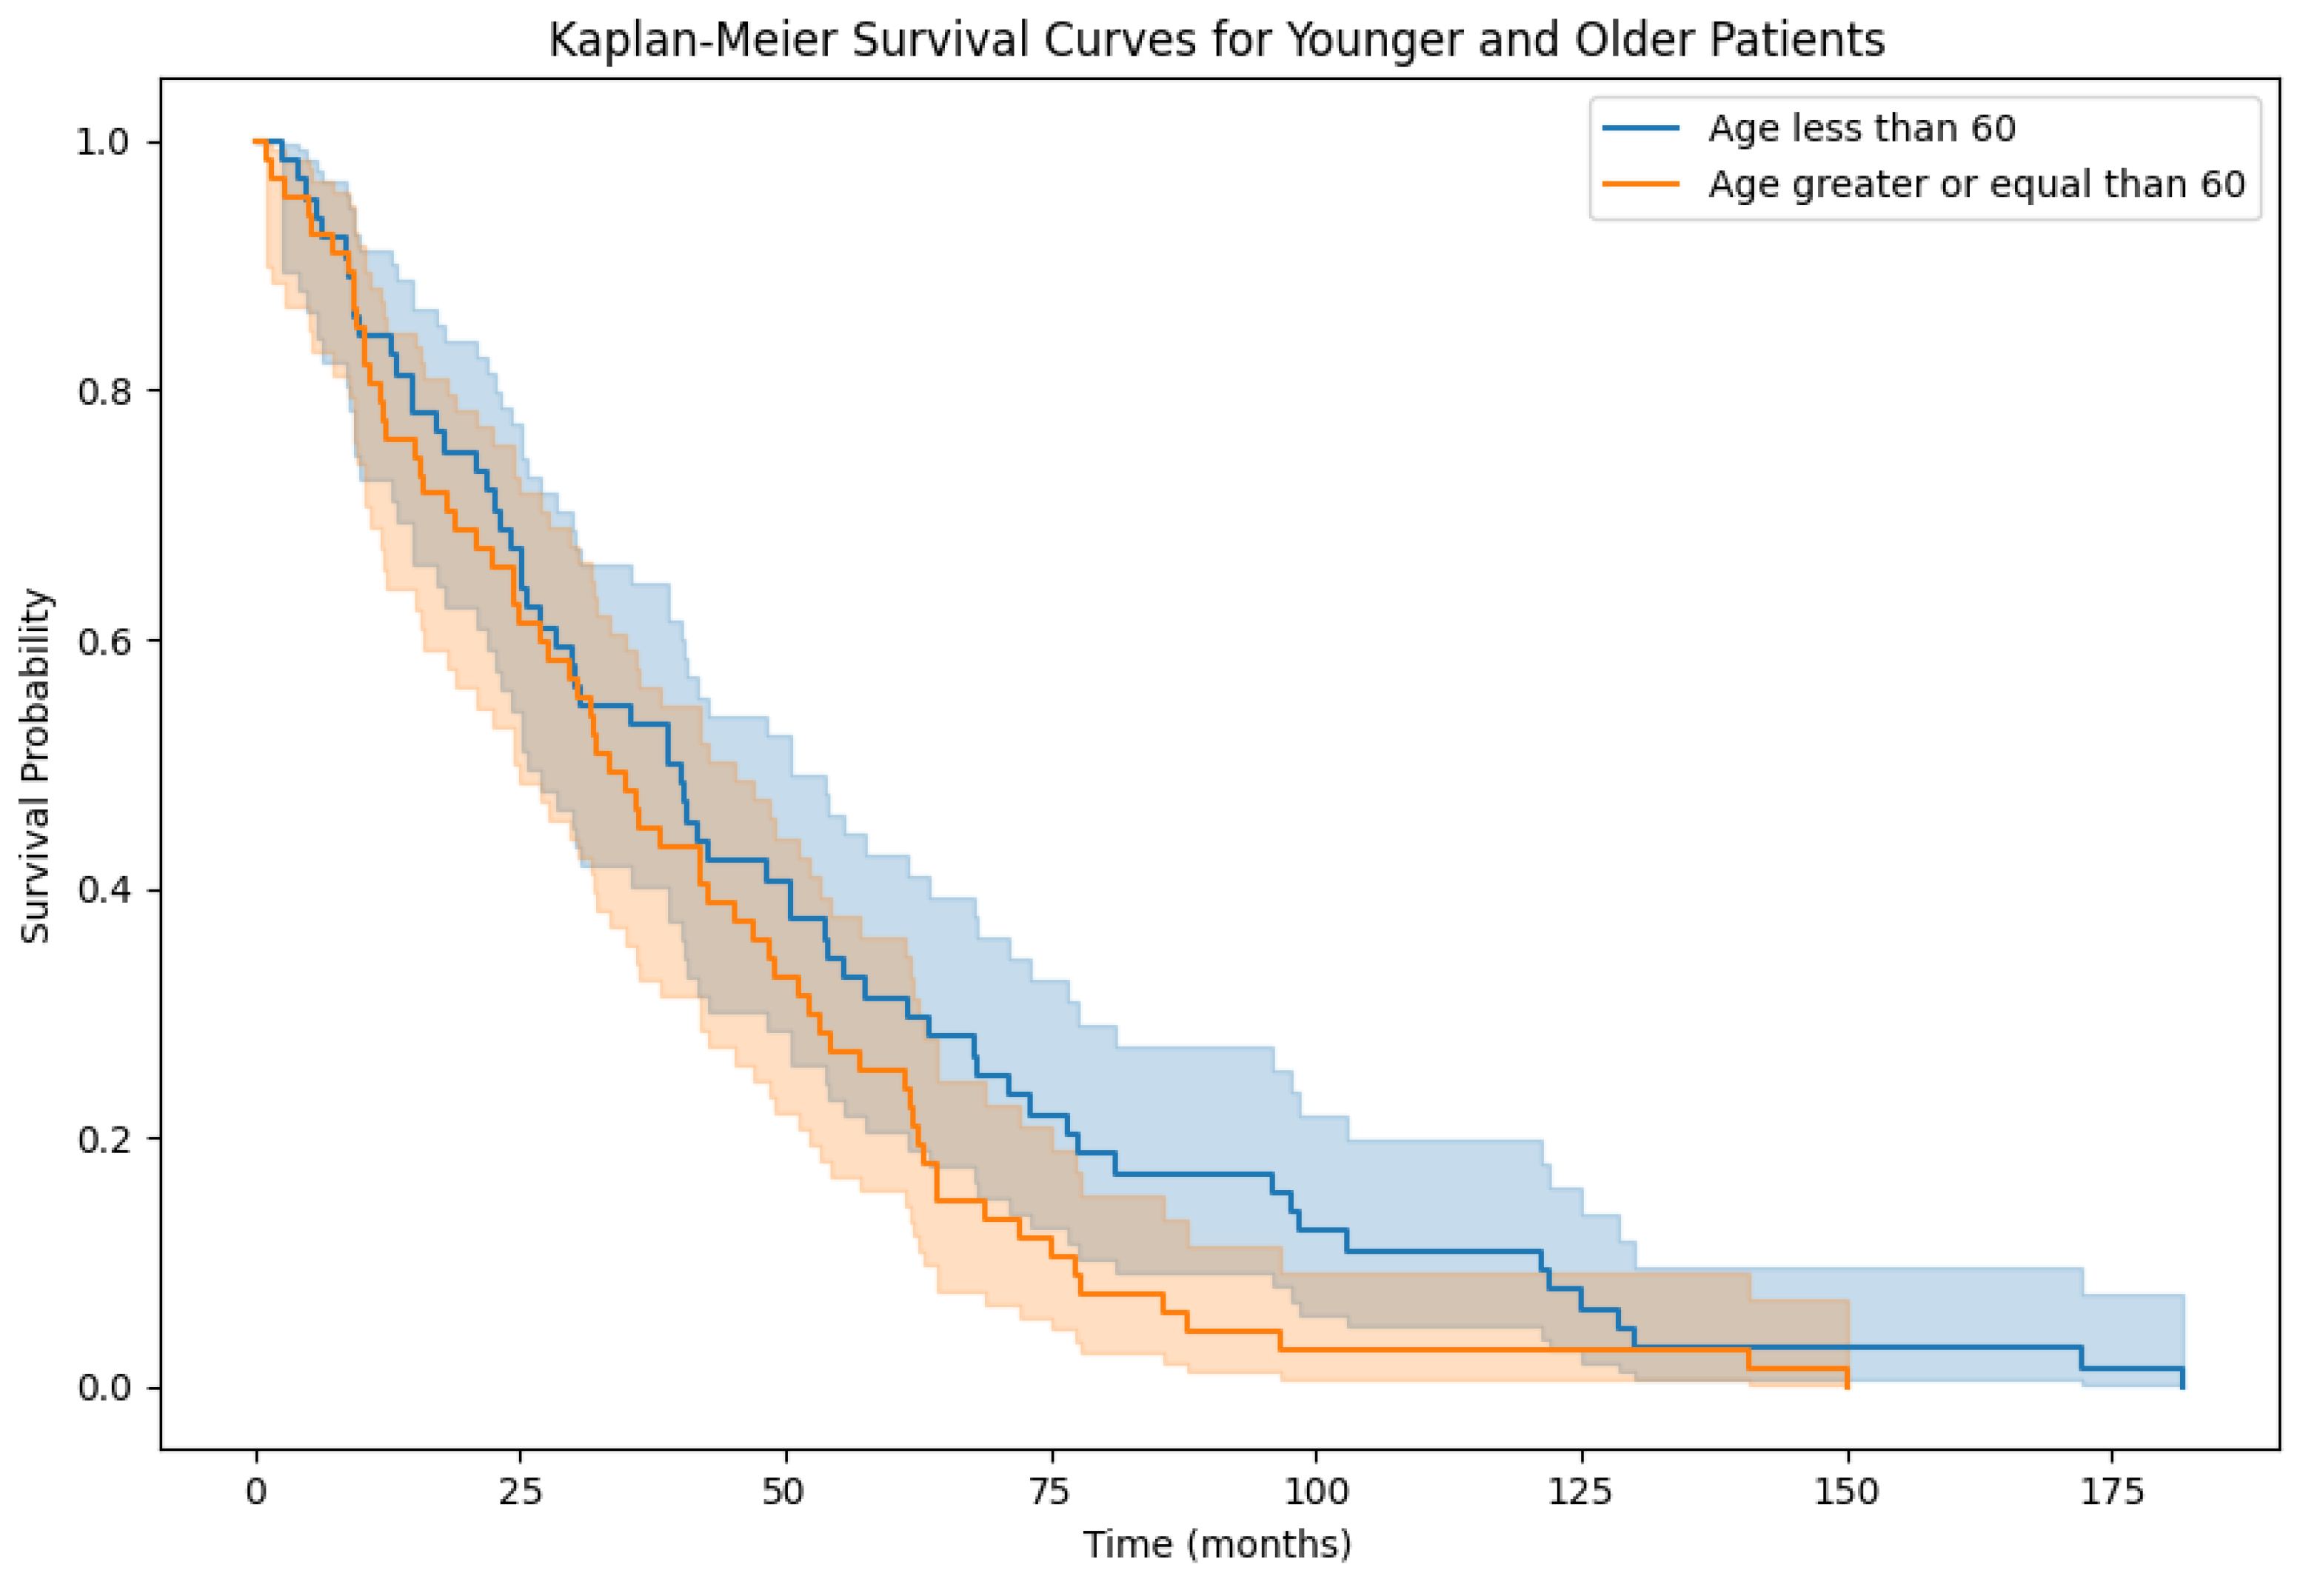
Table 4 suggest that providing the model with prior knowledge of demographic variables does not significantly enhance its predictive ability. This concurs with the analyses undertaken in [25,26], which do not indicate that demographic variables influence survival outcomes.
Authors in [25] discuss the impact of neoadjuvant chemotherapy in EMPeM patients. Their multivariate analysis revealed that chemotherapy was not a good prognostic factor for OS. The observed results shown in Table 5 do not significantly differ, which suggests that MPeMSupervisedSurv did not identify any additional features from either cohort that could enhance its predictive ability. A similar conclusion can be drawn from the results reported in Table 7 regarding HIPEC treatment. In contrast, the reported concordance index results for cohorts stratified using adjuvant chemotherapy in Table 6 differ significantly. This implies that the model identified more meaningful WSI features for OS estimation. It also suggests that MPeMSupervisedSurv could identify patients who respond to adjuvant chemotherapy.
With regards to patient stratification based on the PCI, our findings indicate that the model exhibited robust performance for both low and high PCI groups. The PCI is a score that describes the extent to which the disease has spread [26]. Salo et al. in [26] present statistical analysis which indicates that the PCI is a prognostic factor for OS. Our model’s robust performance across both low and high PCI groups indicates that meaningful features can be identified in WSIs of both cohorts. This therefore appears to confirm that PCI plays a role in survival prediction.
This work can play an important role regarding treatment planning in a clinical setting. There is currently limited evidence on the efficacy of chemotherapy combinations such as cisplatin and pemetrexed [27]. As a result, clinicians often encounter uncertainty when deliberating between utilizing chemotherapy treatment with cisplatin and pemetrexed, considering alternative chemotherapy regimens, or opting for close monitoring. Our model, MPeMSupervisedSurv, serves as an objective tool to aid in this decision-making process. By incorporating chemotherapy data, our model offers insights that can guide clinicians in their decision making. This equips clinicians with valuable insights to optimize patient care and treatment outcomes.
Limitations of this work include the fact that MPeMSupervisedSurv was trained and tested for this particular EMPeM cohort. Thus, further validation with another EMPeM cohort would help improve the model and ensure that it can capture representative and meaningful features from a wide range of patient populations. Another limitation is that the results related to patient stratification based on chemotherapy should be interpreted cautiously because of the smaller training set size for each category. This implies that further validation is required.
Developing an architecture that uses only WSI-level labels for supervision and can extract both local and long-range features by leveraging spatial attention is the primary direction of future work. Our intent is to create a model to extract previously unknown features that can be more informative about OS and general disease outcomes. We aim to validate our future model on a larger and more diverse set of peritoneal mesothelioma cases to ensure minimal bias and applicability in clinical practice.

5. Conclusions

To conclude, MPeMSupervisedSurv is a CNN-based architecture that utilizes patch-level supervision to tackle the OS estimation problem for EMPeM patients. The analysis conducted through patient stratification highlights the impactful role of adjuvant chemotherapy in enhancing the model’s predictive accuracy. Notably, the results suggest a significant correlation between the administration of adjuvant chemotherapy and the model’s improved predictive performance. This indicates that adjuvant chemotherapy is a potential determinant of OS. Conversely, the model’s performance exhibited less notable improvements when utilizing neoadjuvant chemotherapy, HIPEC, PCI, and demographic information as criteria for patient stratification. These criteria therefore do not appear to substantially refine the model’s predictive ability.

Author Contributions

Conceptualization, P.B., N.B. and F.N.K.K.; methodology, K.M.P.; software, K.M.P.; validation, K.M.P.; formal analysis, K.M.P. and P.B.; data curation, P.D., V.K., S.V.-D., C.I.-V., G.A., A.C., M.-H.L., L.V., O.G., S.I., J.H.-F. and N.B.; writing—original draft preparation, K.M.P.; writing—review and editing, K.M.P., P.B. and T.S.; supervision, T.S. All authors have read and agreed to the published version of the manuscript.

Funding

This research received no external funding.

Institutional Review Board Statement

This study was conducted in accordance with the 2013 Declaration of Helsinki. The regulations and ethical principles mentioned in the Declaration of Helsinki are adhered to by RENAPE (French Network For Rare Peritoneal Tumors). The Comité Consultatif sur le Traitement de l’Information en matière de Recherche dans le domaine de la Santé (CCTIRS en_10.257) approved the creation of the RENAPE database. This database is also registered with the Commission Nationale de l’Informatique et des Libertés (CNIL e no. DR-2010-297), which was completed on 4 October 2010. The registration was completed in accordance with the provisions contained in law no. 78-17 of the French Republic regarding data processing, files, and individuals’ right to privacy that was adopted on 6 January 1978 (ClinicalTrials.gov Identifier: NCT02834169 [16]).

Informed Consent Statement

Informed consent was obtained from all subjects involved in the study.

Data Availability Statement

The data presented in this study may be provided on request from Dr. Nazim Benzerdjeb. This study uses a private dataset of Whole-Slide Images. Due to its large size, it cannot be made available on a cloud network.

Conflicts of Interest

The authors declare no conflicts of interest.

Abbreviations

The following abbreviations are used in this manuscript:
OSOverall Survival
EMPeMEpithelioid Malignant Peritoneal Mesothelioma
CNNConvolutional Neural Network
WSIWhole-Slide Image
PCIPeritoneal Cancer Index
ResNetResidual Network
HIPECHyperthermic Intraperitoneal Chemotherapy
SVMSupport Vector Machine
RSFRandom Survival Forest

Appendix A

The Kaplan–Meier survival probability curve for the patient cohort is shown in Figure A1. The Kaplan–Meier curves obtained from patient stratification based on sex, age, and nuclear grade are displayed in Figure A2, Figure A3 and Figure A4.
Figure A1. Kaplan–Meier survival curve for the patient population.
Biomedinformatics 04 00046 g0a1
Figure A2. Kaplan–Meier survival curve based on patient stratification by sex.
Biomedinformatics 04 00046 g0a2
Figure A3. Kaplan–Meier survival curve based on patient stratification by age.
Biomedinformatics 04 00046 g0a3
Figure A4. Kaplan–Meier survival curve based on patient stratification by nuclear grade.
Biomedinformatics 04 00046 g0a4

References

  1. Boffetta, P. Epidemiology of peritoneal mesothelioma: A review. Ann. Oncol. 2007, 18, 985–990. [Google Scholar] [CrossRef] [PubMed]
  2. Kim, J.; Bhagwandin, S.; Labow, D.M. Malignant peritoneal mesothelioma: A review. Ann. Transl. Med. 2017, 5, 236. [Google Scholar] [CrossRef] [PubMed]
  3. Van der Laak, J.; Litjens, G.; Ciompi, F. Deep learning in histopathology: The path to the clinic. Nat. Med. 2021, 27, 775–784. [Google Scholar] [CrossRef]
  4. Qaiser, T.; Lee, C.Y.; Vandenberghe, M.; Yeh, J.; Gavrielides, M.; Hipp, J.; Scott, M.; Reischl, J. Usability of deep learning and HE images predict disease outcome-emerging tool to optimize clinical trials. NPJ Precis. Oncol. 2022, 6, 37. [Google Scholar] [CrossRef]
  5. Hess, L.M.; Brnabic, A.; Mason, O.; Lee, P.; Barker, S. Relationship between Progression-free Survival and Overall Survival in Randomized Clinical Trials of Targeted and Biologic Agents in Oncology. J. Cancer 2019, 10, 3717–3727. [Google Scholar] [CrossRef] [PubMed]
  6. Ishwaran, H.; Kogalur, U.B.; Blackstone, E.H.; Lauer, M.S. Random survival forests. Ann. Appl. Stat. 2008, 2, 841–860. [Google Scholar] [CrossRef]
  7. Ding, Z. The application of support vector machine in survival analysis. In Proceedings of the 2011 2nd International Conference on Artificial Intelligence, Management Science and Electronic Commerce (AIMSEC), Zhengzhou, China, 8–10 August 2011; pp. 6816–6819. [Google Scholar]
  8. Zhu, X.; Yao, J.; Huang, J. Deep convolutional neural network for survival analysis with pathological images. In Proceedings of the 2016 IEEE International Conference on Bioinformatics and Biomedicine (BIBM), Shenzhen, China, 15–18 December 2016; pp. 544–547. [Google Scholar]
  9. Zhu, X.; Yao, J.; Zhu, F.; Huang, J. WSISA: Making Survival Prediction From Whole Slide Histopathological Images. In Proceedings of the IEEE Conference on Computer Vision and Pattern Recognition (CVPR), Honolulu, HI, USA, 21–26 July 2017; pp. 6855–6863. [Google Scholar]
  10. Laleh, N.G.; Echle, A.; Muti, H.S.; Hewitt, K.J.; Volkmar, S.; Kather, J.N. Deep Learning for interpretable end-to-end survival (E-ESurv) prediction in gastrointestinal cancer histopathology. In Proceedings of the MICCAI Workshop on Computational Pathology, Online, 27 September–1 October 2021; Volume 156, pp. 81–93. [Google Scholar]
  11. Courtiol, P.; Maussion, C.; Moarii, M.; Pronier, E.; Pilcer, S.; Sefta, M.; Manceron, P.; Toldo, S.; Zaslavskiy, M.; Le Stang, N.; et al. Deep learning-based classification of mesothelioma improves prediction of patient outcome. Nat. Med. 2019, 25, 1519–1525. [Google Scholar] [CrossRef] [PubMed]
  12. Shen, Y.; Liu, L.; Tang, Z.; Chen, Z.; Ma, G.; Dong, J.; Zhang, X.; Yang, L.; Zheng, Q. Explainable Survival Analysis with Convolution-Involved Vision Transformer. In Proceedings of the AAAI Conference on Artificial Intelligence, Singapore, China, 17–20 June 2022; Volume 36, pp. 2207–2215. [Google Scholar]
  13. Steck, H.; Krishnapuram, B.; Dehing-oberije, C.; Lambin, P.; Raykar, V.C. On Ranking in Survival Analysis: Bounds on the Concordance Index. In Proceedings of the Advances in Neural Information Processing Systems, Vancouver, BC, Canada, 3–6 December 2007; Volume 20, pp. 1209–1216. [Google Scholar]
  14. Wulczyn, E.; Steiner, D.F.; Xu, Z.; Sadhwani, A.; Wang, H.; Flament-Auvigne, I.; Mermel, C.H.; Chen, P.H.C.; Liu, Y.; Stumpe, M.C. Deep learning-based survival prediction for multiple cancer types using histopathology images. PLOS ONE 2020, 15, e0233678. [Google Scholar] [CrossRef] [PubMed]
  15. Wang, Z.; Gao, Q.; Yi, X.; Zhang, X.; Zhang, Y.; Zhang, D.; Liò, P.; Bain, C.; Bassed, R.; Li, S.; et al. Surformer: An interpretable pattern-perceptive survival transformer for cancer survival prediction from histopathology whole slide images. Comput. Methods Programs Biomed. 2023, 241, 107733. [Google Scholar] [CrossRef] [PubMed]
  16. French National Registry of Rare Peritoneal Surface Malignancies (RENAPE). Available online: https://clinicaltrials.gov/study/NCT02834169 (accessed on 10 September 2023).
  17. Echle, A.; Rindtorff, N.T.; Brinker, T.J.; Luedde, T.; Pearson, A.T.; Kather, J.N. Deep learning in cancer pathology: A new generation of clinical biomarkers. Br. J. Cancer 2021, 124, 686–696. [Google Scholar] [CrossRef] [PubMed]
  18. Wsi-Tile-Cleanup. Available online: https://github.com/lucasrla/wsi-tile-cleanup (accessed on 23 September 2023).
  19. Jiang, J.; Trundle, P.; Ren, J. Medical image analysis with artificial neural networks. Comput. Med. Imaging Graph. 2010, 34, 617–631. [Google Scholar] [CrossRef] [PubMed]
  20. He, K.; Zhang, X.; Ren, S.; Sun, J. Deep Residual Learning for Image Recognition. In Proceedings of the 2016 IEEE Conference on Computer Vision and Pattern Recognition, Las Vegas, NV, USA, 27–30 June 2016; pp. 770–778. [Google Scholar]
  21. Toğaçar, M.; Ergen, B.; Tümen, V. Use of dominant activations obtained by processing OCT images with the CNNs and slime mold method in retinal disease detection. Biocybern. Biomed. Eng. 2022, 42, 646–666. [Google Scholar] [CrossRef]
  22. Mormont, R.; Geurts, P.; Marée, R. Multi-Task Pre-Training of Deep Neural Networks for Digital Pathology. IEEE J. Biomed. Health Inform. 2021, 25, 412–421. [Google Scholar] [CrossRef] [PubMed]
  23. Scikit-Survival. Available online: https://scikit-survival.readthedocs.io/en/stable/ (accessed on 13 December 2023).
  24. Hosna, A.; Merry, E.; Gyalmo, J.; Alom, Z.; Aung, Z.; Azim, M.A. Transfer learning: A friendly introduction. J. Big Data 2022, 9, 102. [Google Scholar] [CrossRef] [PubMed]
  25. Naffouje, S.A.; Tulla, K.A.; Salti, G.I. The impact of chemotherapy and its timing on survival in malignant peritoneal mesothelioma treated with complete debulking. Med. Oncol. 2018, 35, 69. [Google Scholar] [CrossRef] [PubMed]
  26. Salo, S.; Lantto, E.; Robinson, E.; Myllarniemi, M.; Laaksonen, S.; Salo, J.; Rantanen, T.; Ilonen, I. Prognostic role of radiological peritoneal cancer index in malignant peritoneal mesothelioma: National cohort study. Sci. Rep. 2020, 10, 13257. [Google Scholar] [CrossRef] [PubMed]
  27. Yamaguchi, S.; Asao, T.; Tsutsumi, S.; Fujii, T.; Yamauchi, H.; Kigure, W.; Morita, H.; Yajima, R.; Suto, T.; Kuwano, H. Effectiveness of Intraperitoneal Hyperthermo-Chemotherapy for Malignant Peritoneal Mesothelioma and Estimation of its Effect by Repeated FDG-PET: A Case Report. Hepato-Gastroentorology 2011, 58, 861–864. [Google Scholar]
Figure 1. Example Whole-Slide Image from one of the patients in the cohort.
Biomedinformatics 04 00046 g001
Figure 2. Second WSI example from another patient in the cohort.
Biomedinformatics 04 00046 g002
Figure 3. WSI preprocessing to obtain tissue patches for model development.
Biomedinformatics 04 00046 g003
Figure 4. MPeMSupervisedSurv architecture diagram.
Biomedinformatics 04 00046 g004
Table 1. MPeMSupervisedSurv hyperparameters.
HyperparameterValue
Number of patches per WSI250
Batch size128
Learning rate0.0001
Table 2. Performance comparison with other survival analysis methods.
DatasetMethodC-Index
EMPeM WSIsSurvivalSVM [7]0.48
EMPeM WSIsRandom Survival Forests [6]0.50
EMPeM WSIsDeepConvSurv [8]0.60
EMPeM WSIsEE-Surv [10]0.65
EMPeM WSIsMPeMSupervisedSurv0.66
Table 3. Performance comparison for male and female patients.
DatasetCohortC-Index
EMPeM WSIsMale patients0.60
EMPeM WSIsFemale patients0.59
Table 4. Performance comparison for patients older and younger than the median age.
DatasetCohortC-Index
EMPeM WSIsPatients with age ≥ 600.59
EMPeM WSIsPatients with age < 600.60
Table 5. Performance comparison for patients who did and did not receive neoadjuvant chemotherapy.
DatasetCohortC-Index
EMPeM WSIsPatients with Neoadjuvant Chemotherapy0.61
EMPeM WSIsPatients without Neoadjuvant Chemotherapy0.59
Table 6. Performance comparison for patients who did and did not undergo adjuvant chemotherapy.
DatasetCohortC-Index
EMPeM WSIsPatients with Adjuvant Chemotherapy0.73
EMPeM WSIsPatients without Adjuvant Chemotherapy0.59
Table 7. Performance comparison for patients who did and did not undergo HIPEC.
DatasetCohortC-Index
EMPeM WSIsPatients with HIPEC0.57
EMPeM WSIsPatients without HIPEC0.59
Table 8. Performance comparison for patients with PCI lower and higher than the population median.
DatasetCohortC-Index
EMPeM WSIsPatients with P C I < 21.5 0.64
EMPeM WSIsPatients with P C I 21.5 0.69
Disclaimer/Publisher’s Note: The statements, opinions and data contained in all publications are solely those of the individual author(s) and contributor(s) and not of MDPI and/or the editor(s). MDPI and/or the editor(s) disclaim responsibility for any injury to people or property resulting from any ideas, methods, instructions or products referred to in the content.

