1. Introduction
Studying diseases at the molecular level, particularly complex cancers like glioblastoma multiforme (GBM), has been pivotal in uncovering their complex causes. Among the various forms of cancer, GBM stands out due to its heterogeneity, with subtypes such as the mesenchymal and proneural states exhibiting distinct molecular profiles and clinical behaviors [
1]. The advent of advanced gene sequencing technologies, such as single-cell RNA sequencing (scRNA-seq), has provided critical insights into these conditions, leading to more precise diagnoses and customized treatments. The technique examines gene activity in individual cells, capturing the intrinsic differences within tissue populations, which is crucial in understanding the diverse nature of GBM subtypes. This method allows for a nuanced measurement of gene expression variation across single cells, revealing intricate disease mechanisms specific to GBM and its subtypes. However, analyzing the detailed data provided by scRNA-seq presents its own set of challenges, particularly in the context of the highly variable and complex nature of GBM. Identifying important genes across various cell types can be daunting, due to the presence of errors and artifacts in raw scRNA-seq data. Therefore, meticulous data cleaning is imperative before any effective use of this information can be made.
In the realm of scRNA-seq data analysis, several critical steps lay the groundwork for meaningful biological discoveries. Dimensionality reduction techniques, which are crucial for managing the substantial data generated by scRNA-seq, play a pivotal role in simplifying the inherent complexity of high-dimensional data while safeguarding the integrity of cell populations. This preservation is vital for accurate cell type identification and subsequent analyses, highlighting the indispensability of dimensionality reduction [
2,
3]. In addition to traditional dimensionality reduction methods, feature selection is a critical technique in scRNA-seq [
4]. This approach focuses on identifying key genes, which process is equally essential as it enables more targeted and efficient analysis. Advanced methods significantly enhance the purity of cell clustering and the accuracy of lineage reconstruction, demonstrating the critical role of feature selection in mitigating noise and improving the precision of scRNA-seq data analysis [
5].
While dimensionality reduction and feature selection are fundamental in refining the complexity of scRNA-seq data for more accurate analysis, the application of genetic algorithms (GAs) introduces a complementary, evolutionary-based approach to optimizing this analysis process.
Genetic algorithms (GAs) are adaptive metaheuristic search algorithms classified as evolutionary computing algorithms, which use techniques inspired by natural evolution. They are efficient tools for solving optimization problems. GA is a discrete and non-linear process that is not mathematically guided, wherein optima evolve from one generation to another without mathematical formulation. Integration among GA parameters, including mutation and crossover rates in addition to population, is vital for a successful GA search. GA implementation operates on a binary chromosome representation, where each gene is denoted by a bit in the chromosome. The presence or absence of a gene in the feature set is represented by a 1 or 0, respectively. The GA initiates with a population of randomly generated chromosomes and iteratively evolves this population using genetic operators such as crossover and mutation [
6,
7].
Moreover, the analysis of scRNA-seq data frequently involves comparing transcript abundance across various conditions or cell types to identify differentially expressed genes (DEGs). These DEGs are pivotal in unveiling the dynamics of gene regulation and the cellular heterogeneity inherent in scRNA-seq data. Serving as more than mere markers of cellular diversity, DEGs are crucial in unraveling the intricate gene expression landscape within individual cells [
8,
9,
10]. This makes them invaluable for advancing biomedical research and the development of personalized medicine, as they offer deep insights into gene regulation, development, and disease.
Furthermore, the significance of variance in scRNA-seq data cannot be overstated. It plays a pivotal role in identifying DEGs and profoundly impacts the overall analysis. The effectiveness of variance-driven approaches in integrating scRNA-seq data leads to the discovery of new cell types and markers. These findings underscore the importance of capturing hidden variations for robust analysis [
11,
12]. Such insights highlight the necessity of comprehensively understanding and accounting for variance in scRNA-seq data. High-variability genes (HVGs) play a pivotal role in scRNA-seq analysis, as they exhibit significant variation in expression levels across individual cells within a sample [
13]. This variability extends beyond mere technical noise or experimental errors, often reflecting genuine biological differences among cells. The identification of HVGs is crucial, as these genes provide insights into cellular heterogeneity and are instrumental in unraveling the underlying biological processes and cellular states [
14]. In the context of scRNA-seq data, understanding gene variance is integral to deciphering cellular heterogeneity. Genes with high variance typically indicate a diversity of biological processes or cell states, thus facilitating the identification of distinct cell types or states in complex samples. Conversely, genes exhibiting low variance generally show uniform expression across cells, which could indicate housekeeping functions or consistent expression regardless of cell type or state [
15].
Despite the significance of DEGs and HVGs in scRNA-seq analysis, relying solely on these metrics can sometimes be misleading. High-variability genes (HVGs), for instance, may not always reflect true biological variation but could be influenced by technical noise, such as dropout events, potentially leading to false conclusions about cellular heterogeneity [
16]. Similarly, DEGs may not fully capture the complexity of gene regulation dynamics, as they might overlook subtle but biologically relevant changes in gene expression [
17]. Therefore, a balanced approach that considers both DEGs and HVGs, along with additional validation methods, is crucial for accurate scRNA-seq data interpretation.
To effectively navigate the complexities of scRNA-seq data, particularly for intricate cancers like glioblastoma multiforme (GBM), the GeneSelector framework has been developed. It addresses the heterogeneity seen in GBM subtypes such as the mesenchymal and proneural categories. The framework begins with comprehensive preprocessing, enhancing data quality by removing noise and artifacts. Central to GeneSelector is a sophisticated genetic algorithm (GA) that not only emphasizes gene variance but also incorporates differentially expressed genes (DEGs). Through a well-constructed fitness function, this approach allows for identifying genes that are both biologically significant and highly variable, thus aiding in the discovery of potential GBM biomarkers. This paper delves into the multifaceted methodology of GeneSelector, showcasing its effectiveness in providing a thorough and biologically pertinent analysis of scRNA-seq data in the context of GBM’s cellular complexity.
2. Methodology
In the GeneSelector framework, scRNA-seq data preprocessing plays an integral part, beginning with the Seurat package for quality control and normalization. Initial steps involve filtering cells based on gene count thresholds to remove potential technical noise and non-informative signals [
18]. The pipeline then systematically filters the genes to retain those genes expressed in a sufficient number of cells, enhancing signal clarity. Seurat’s normalization method is applied, in which the feature counts for each cell are first normalized by dividing them by the total counts for that cell and then scaled using the scale factor. Following this process, these values undergo a natural logarithm transformation using the log1p function [
19].
The genetic algorithm (GA) feature selection phase is enhanced with a sophisticated selection operator using the “GA” package in R [
20]. This operator selects the top 50% of individuals from the population, based on performance, ensuring the retention of high-quality genetic combinations. Additionally, the best individual from each generation is always carried over to the new population, making the algorithm elitist. This approach, combined with a custom initialization giving each gene a 1% chance of selection, ensures a balance between diversity and the preservation of superior solution gene sets.
The fitness function is a pivotal component of our genetic algorithm (GA), which has been meticulously designed to assess genes for their expression variability, statistical significance, and changes in expression. It plays a critical role in highlighting the algorithm’s capacity to discern genes characterized by both considerable variance and biological importance [
21]. By leveraging a tour-selection approach alongside carefully calibrated crossover and mutation rates, our GA is strategically optimized to enhance genetic diversity and facilitate thorough exploration. This multifaceted evaluation mechanism ensures the identification of genes that are not only significantly differentially expressed but also demonstrate substantial variance and relevance to biological processes, thereby reinforcing the algorithm’s effectiveness in uncovering biologically significant gene markers.
In each generation of the analysis, key metrics such as variance, p-value, and log fold change (logFC) are evaluated to determine gene significance. The algorithm employs a weighted scoring system for these metrics: assigning 50% to variance 30% to logFC, and 20% to the p-value score. Once these scores are computed, they undergo normalization to ensure uniformity and comparability across the dataset. Subsequently, an average of these normalized, weighted scores is calculated. This systematic approach aids in identifying genes that are not only statistically significant but also demonstrate significant biological variance and expression changes, ensuring a comprehensive assessment of gene relevance.
The DEGs are identified using the Wilcoxon rank sum test, a non-parametric approach that allows us to detect statistically significant differences in gene expression between subtypes. This method is complemented by variance analysis to pinpoint HVGs, focusing on genes that exhibit significant expression variability across samples, which is indicative of their potential regulatory roles in glioblastoma.
Building upon this evaluation, the genetic algorithm then applies the principles of natural selection and evolution through its crossover and mutation processes. The process of crossover entails the blending of genetic information from two parent individuals to produce a descendant, whereby certain portions of the parental genetic sequences are chosen at random for exchange. This influences the genetic composition of the offspring. Similarly, the mutation process affects every new individual by introducing random changes to their genetic makeup. By randomly flipping elements in their genetic code, variations in the traits that are passed on for future classification purposes are created. Each individual has a certain probability of undergoing these alterations, which introduces diversity and adaptability into the population, fostering the evolution of more effective solutions over successive generations.
To provide comprehensive insights into our algorithmic methodology and ensure reproducibility, we have made our full codebase, datasets, and a detailed table of the 92 gene markers identified available on GitHub. Interested parties can access these resources at
https://github.com/PaplomatasP/GeneSelector, accessed on 2 February 2024. This repository encompasses the genetic algorithm scripts, data preprocessing and analysis procedures, and detailed findings concerning the 92 gene markers. By sharing these resources, we aim to facilitate the replication of our study, validation of our results, and further investigation into the identified genetic markers by our peers and the scientific community at large.
3. Results
This study’s results highlight the effectiveness of the GeneSelector framework in identifying critical biomarkers in glioblastoma multiforme (GBM) through a novel genetic algorithm (GA)-based feature selection process. The integration of differentially expressed genes (DEGs) and highly variable genes (HVGs) within this framework facilitates the discovery of genes that are both biologically significant and exhibit high variance, a necessary step in understanding GBM’s complexity.
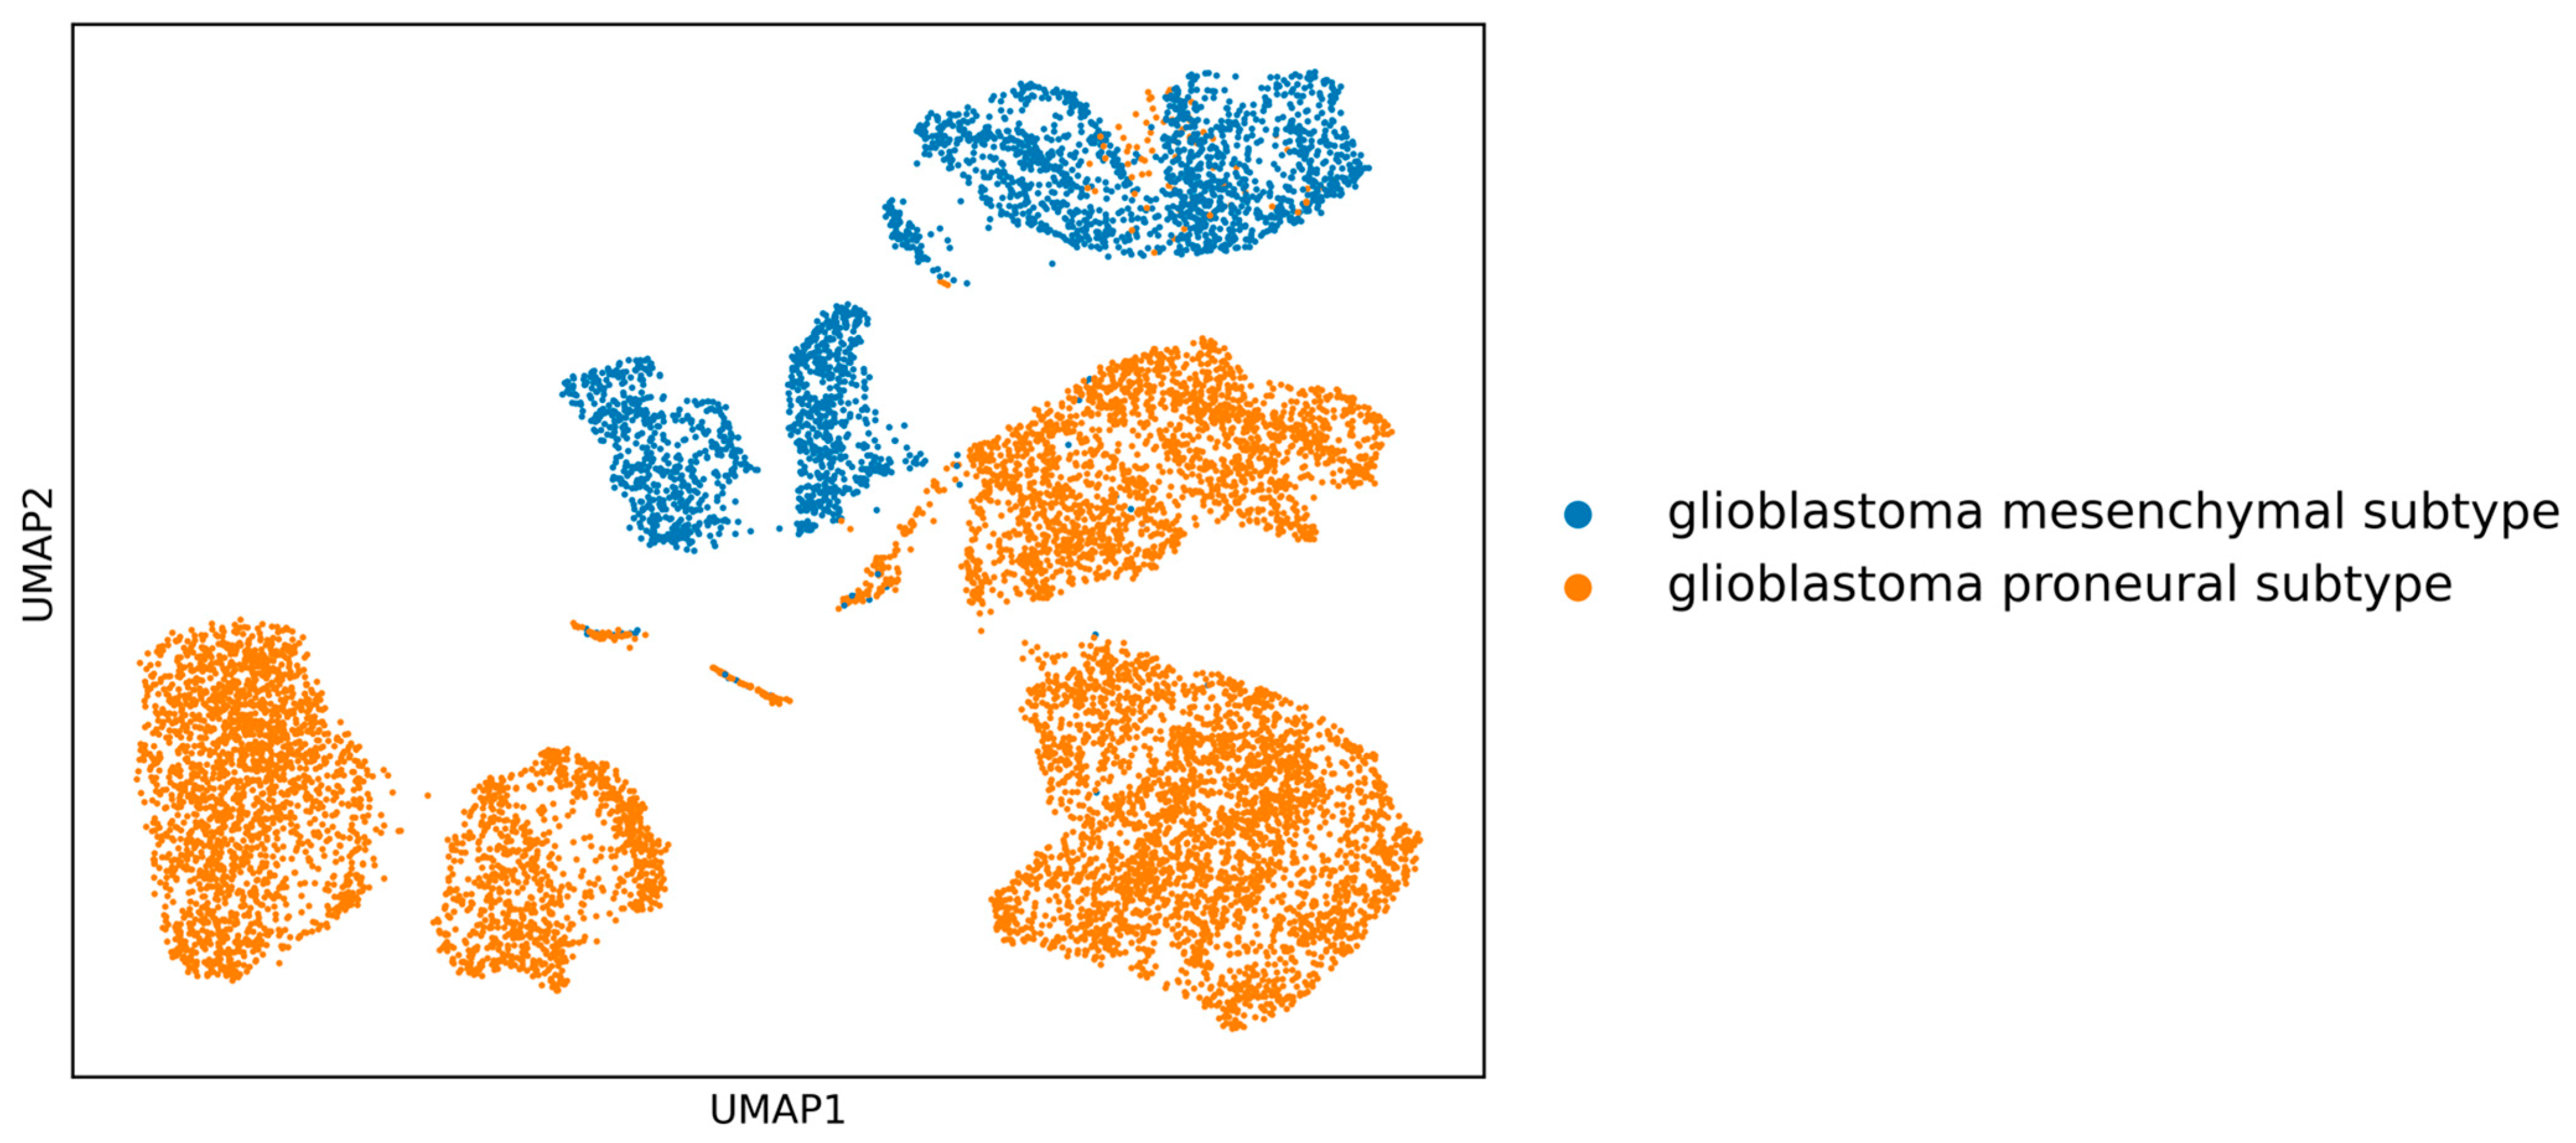
Initially, the clear separation between the two GBM subtypes (see
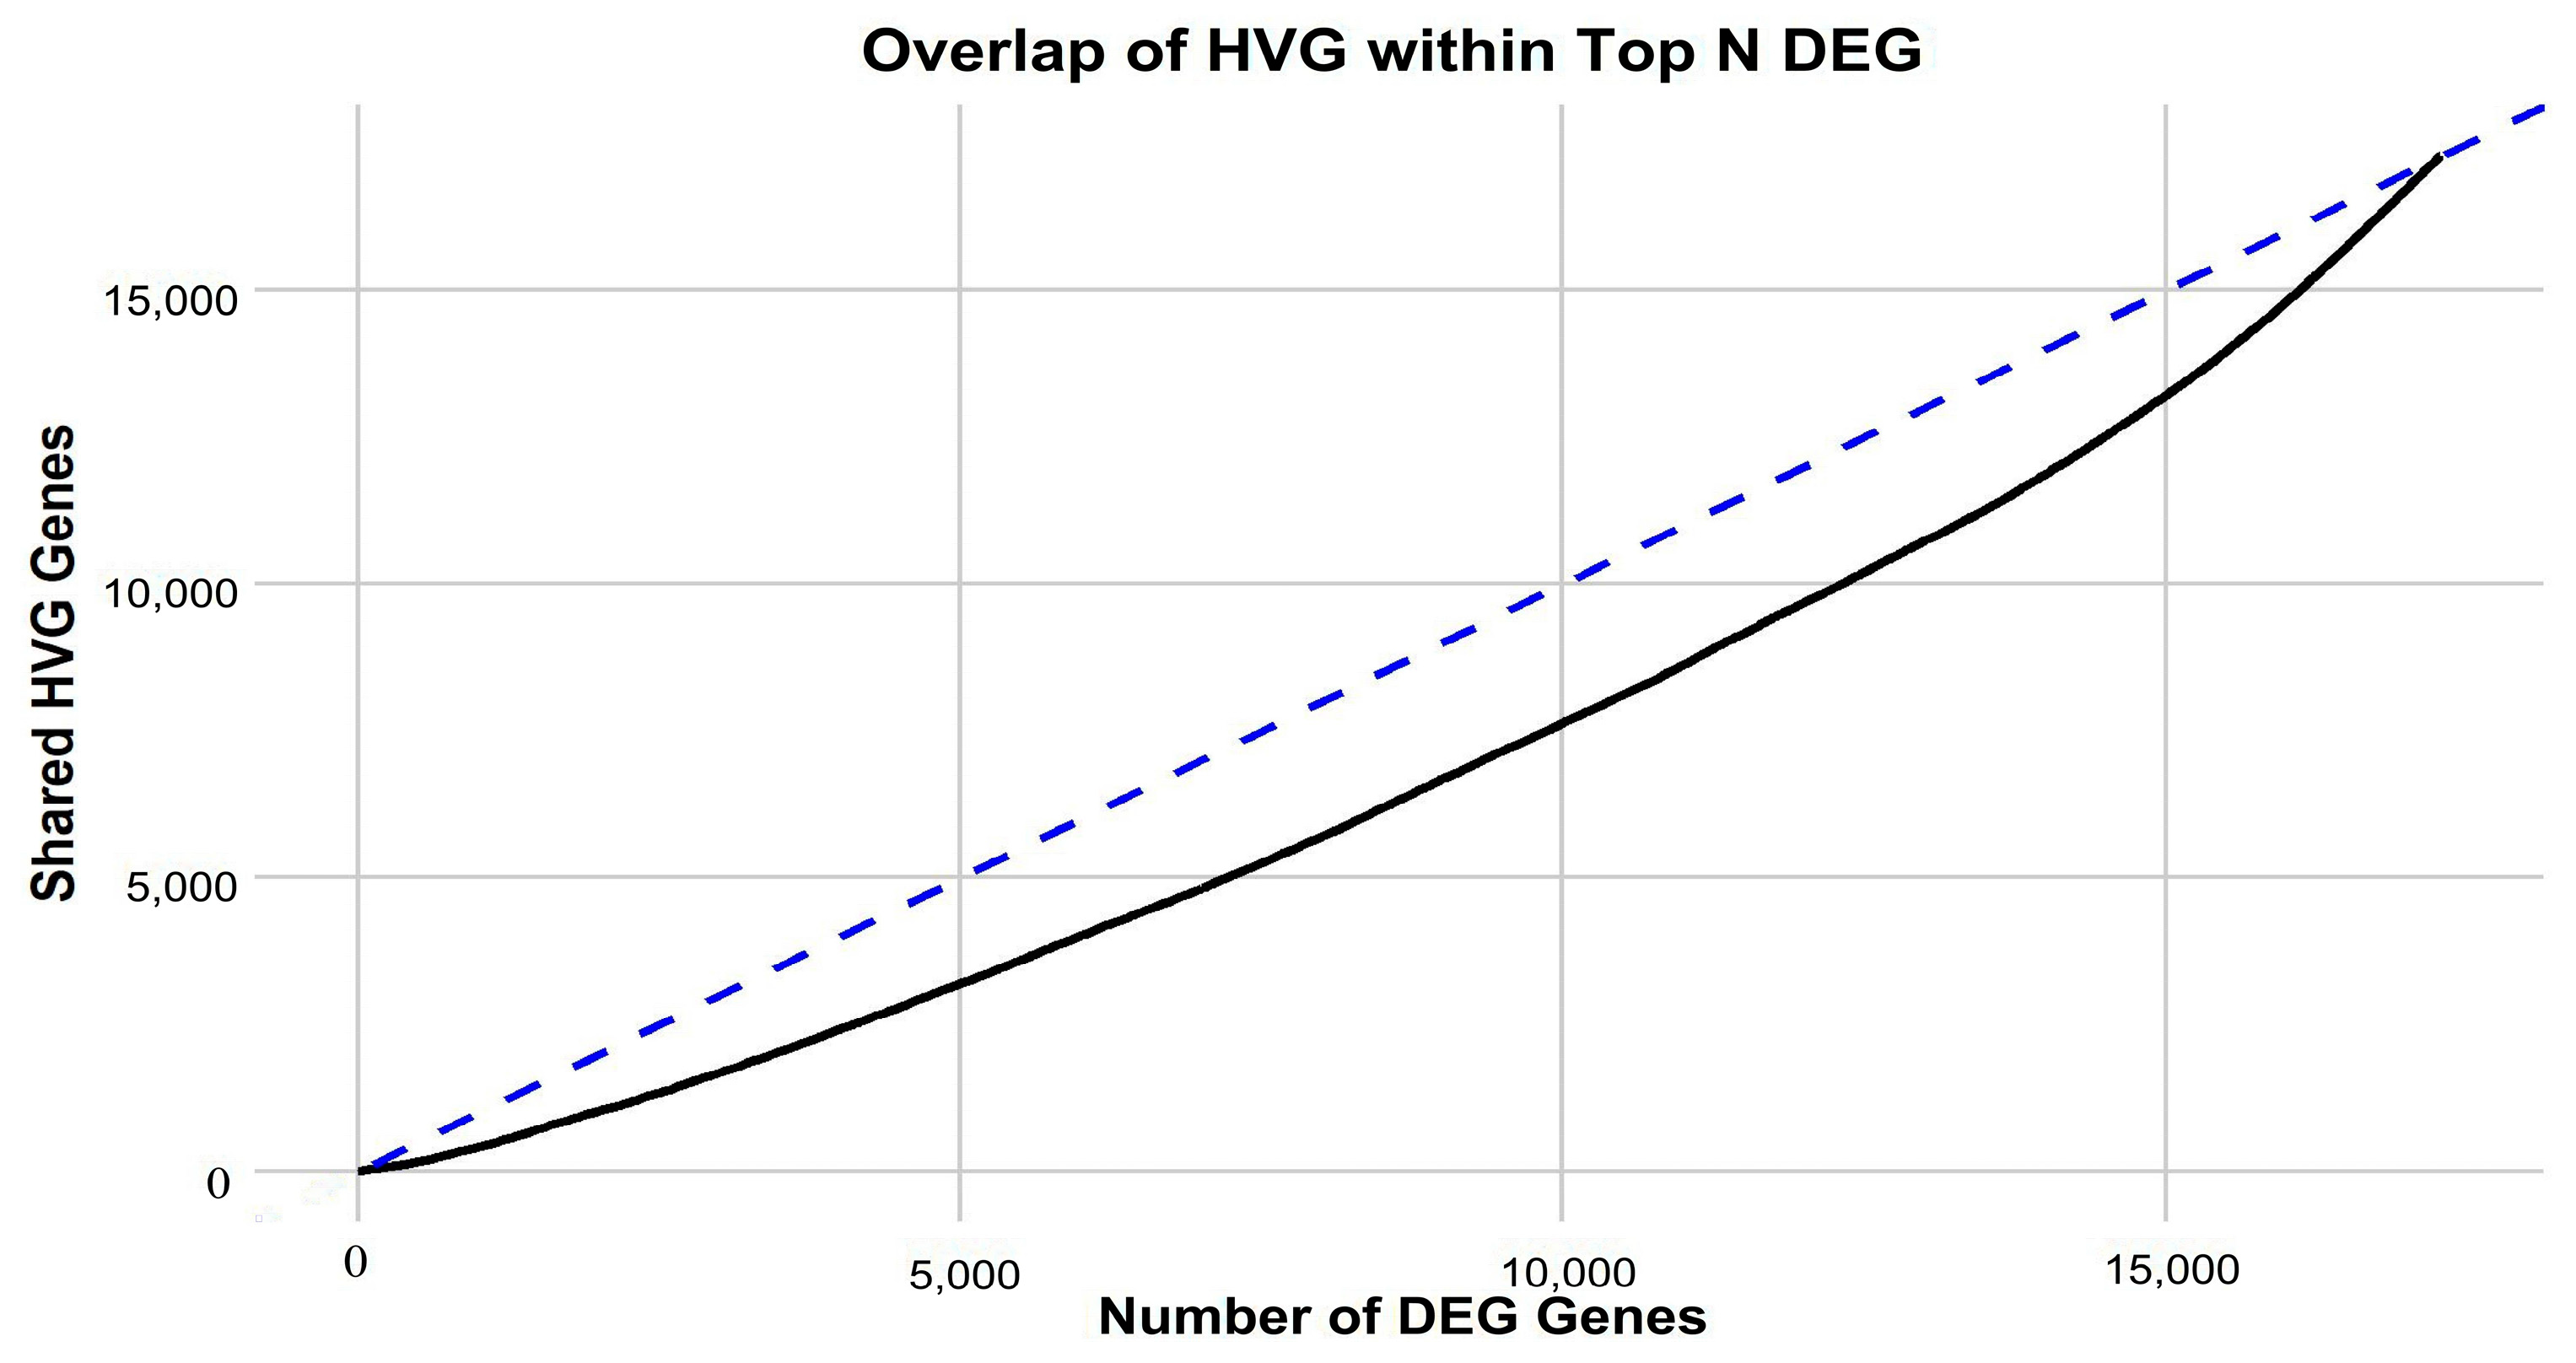
Figure 1) is apparent, implying that in-depth gene-centric analysis holds the promise of uncovering substantial insights regarding their interrelation. Employing the well-established dimensionality reduction method of UMAP, we condensed the gene feature space into a 2D representation, providing a clearer perspective on our samples. An initial investigation into the selection of genes revealed a pivotal observation: the actual overlap between DEGs and HVGs is limited (
Figure 2). This discrepancy highlights the inherent differences in gene selection with each method and suggests that a considerable number of relevant genes might be overlooked if only one selection method is employed. By utilizing both DEGs and HVGs within a genetic algorithm framework, the possibility arises of harnessing a more complete representation of the genomic landscape. This dual-method approach increases the chances of identifying genes that are both biologically significant and exhibit high variability, which may be crucial in understanding complex disease mechanisms, such as those found in GBM. Moreover, the integration of DEGs and HVGs within a GA provides a strategic balance; while DEGs offer insights into differential expression under various conditions, HVGs reveal intrinsic expression variability that can pinpoint cellular heterogeneity. The combination within a GA thus enriches the feature selection process, yielding a robust set of candidate biomarkers and providing a comprehensive genetic profile that is essential for advancing precision medicine.
Motivated by the limited convergence between differentially expressed genes (DEGs) and highly variable genes (HVGs) (
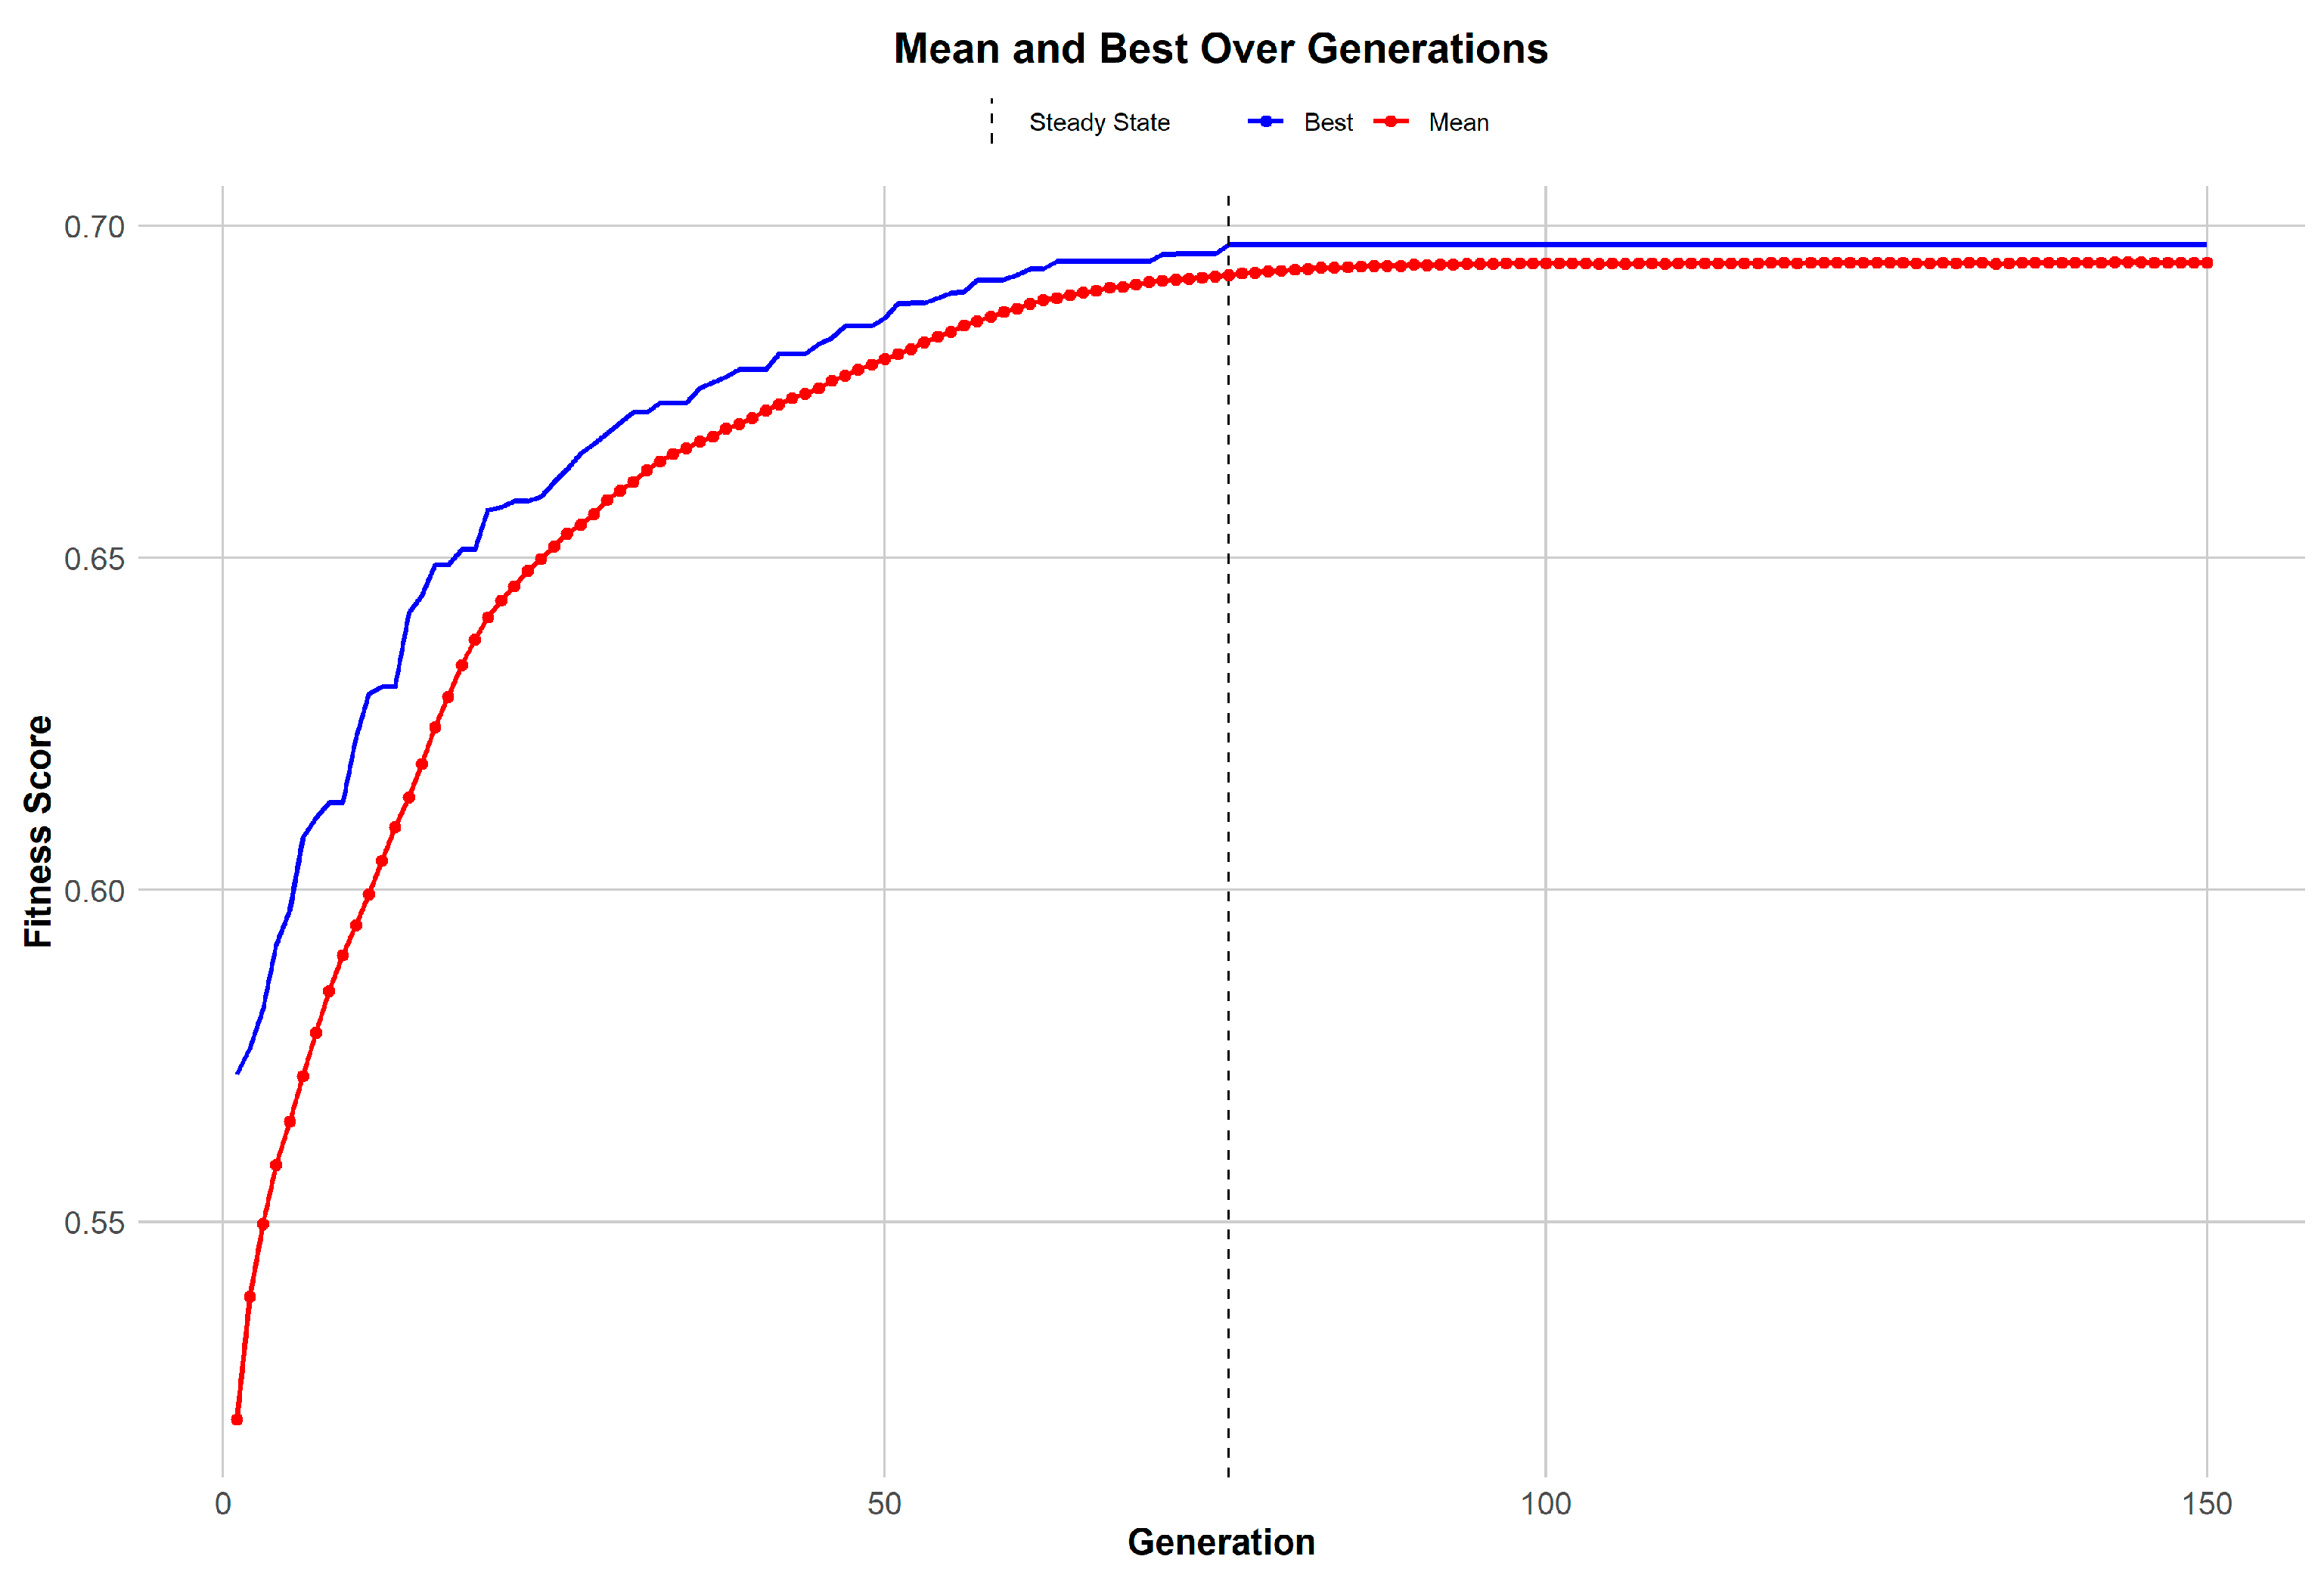
Figure 2), a genetic algorithm (GA) was utilized to amalgamate these distinct gene sets effectively. The trajectory of the GA’s performance, illustrated in
Figure 3, reveals a consistent improvement in gene selection quality within the population over successive generations. The mean fitness score climbs steadily, indicating a concentrated effort by the GA to identify genes that have significant biological relevance. This is complemented by the observation that the best individual fitness score in each generation surpasses the mean, evidencing the algorithm’s evolutionary advantage in identifying and retaining the most promising gene candidates. As the GA progresses, it reaches a point of stability, a steady state wherein further improvements in fitness scores begin to plateau. This stabilization signals that the algorithm is nearing an optimal gene set, thereby highlighting the GA’s adeptness at narrowing down the most biologically pertinent features for disease understanding and biomarker discovery.
In the exploration of the genetic landscape pertaining to glioblastoma multiforme (GBM) subtypes, particularly the mesenchymal and proneural categories, a panel of 92 genes was rigorously examined. The genes were selected based on their functional roles within cancer biology, their expression profiles within GBM subtypes, and any documented correlations with patient prognoses or responses to treatment. The selection process was informed by reliance on the established literature due to the absence of specific gene expression-level data.
The gene ATM, known for its critical role in DNA repair and cell cycle control, was identified as a key player, with its mutations and signaling pathways being recurrent themes across various cancer types, including GBM [
22]. Similarly, the gene HDAC6, a member of the histone deacetylase family, was noted for its significance in chromatin remodeling and gene expression regulation, with ongoing research investigating its potential as a therapeutic target in GBM [
23]. Furthermore, the gene ANGPTL2 was highlighted for its involvement in angiogenesis, a process quintessential to cancer progression that is specifically noted for its potential impact on the vascularization of GBM tumors.
Additionally, STAG2 [
24] was recognized for its integral role within the cohesin complex and its contribution to chromosomal stability, a pivotal aspect in the pathogenesis of cancer. The gene LAMB2, which encodes a component of the extracellular matrix, was noted for its influence on cellular differentiation, migration, and survival—factors pertinent to the pathology of GBM. The importance of these genes was emphasized by their functional attributes within the realms of cancer biology. However, it was acknowledged that a more precise determination of genes related to the mesenchymal and proneural GBM subtypes would necessitate a comprehensive analysis of gene expression data, along with a review of the current scientific literature specific to GBM subtypes. Such an approach would provide a contextually richer understanding, taking into account the presence of these genes in GBM stem cells and their roles within the tumor microenvironment.
For the mesenchymal subtype, those genes implicated in mesenchymal differentiation, angiogenesis, inflammatory responses, and extracellular matrix remodeling were given particular attention. Although the provided gene list did not include specific data on differential expression or functional studies, two genes, ANGPTL2 and HDAC6, were repeatedly referenced due to their known biological functions and potential relevance to the mesenchymal transition in GBM [
25]. In contrast, the proneural GBM subtype, which is characterized by those genes involved in neural development and oligodendrocyte lineage transcriptional programs, presented a different challenge. Without specific expression data, the association of genes with this subtype was less clear. Nonetheless, genes like OLIG2 and PDGFRA, which were not listed but are known to be associated with the proneural subtype, were discussed for their roles in neural progenitor cell development and maintenance.
In summary, the discussion elucidated the complexity of selecting and analyzing genes in relation to GBM subtypes. It underscored the need for a multifaceted approach that combines bioinformatics analyses with experimental validation and a literature review. This would enhance the identification of genes most pertinent to the mesenchymal and proneural subtypes of GBM, thereby advancing the understanding of their respective biological underpinnings and contributing to the development of subtype-specific therapeutic strategies.
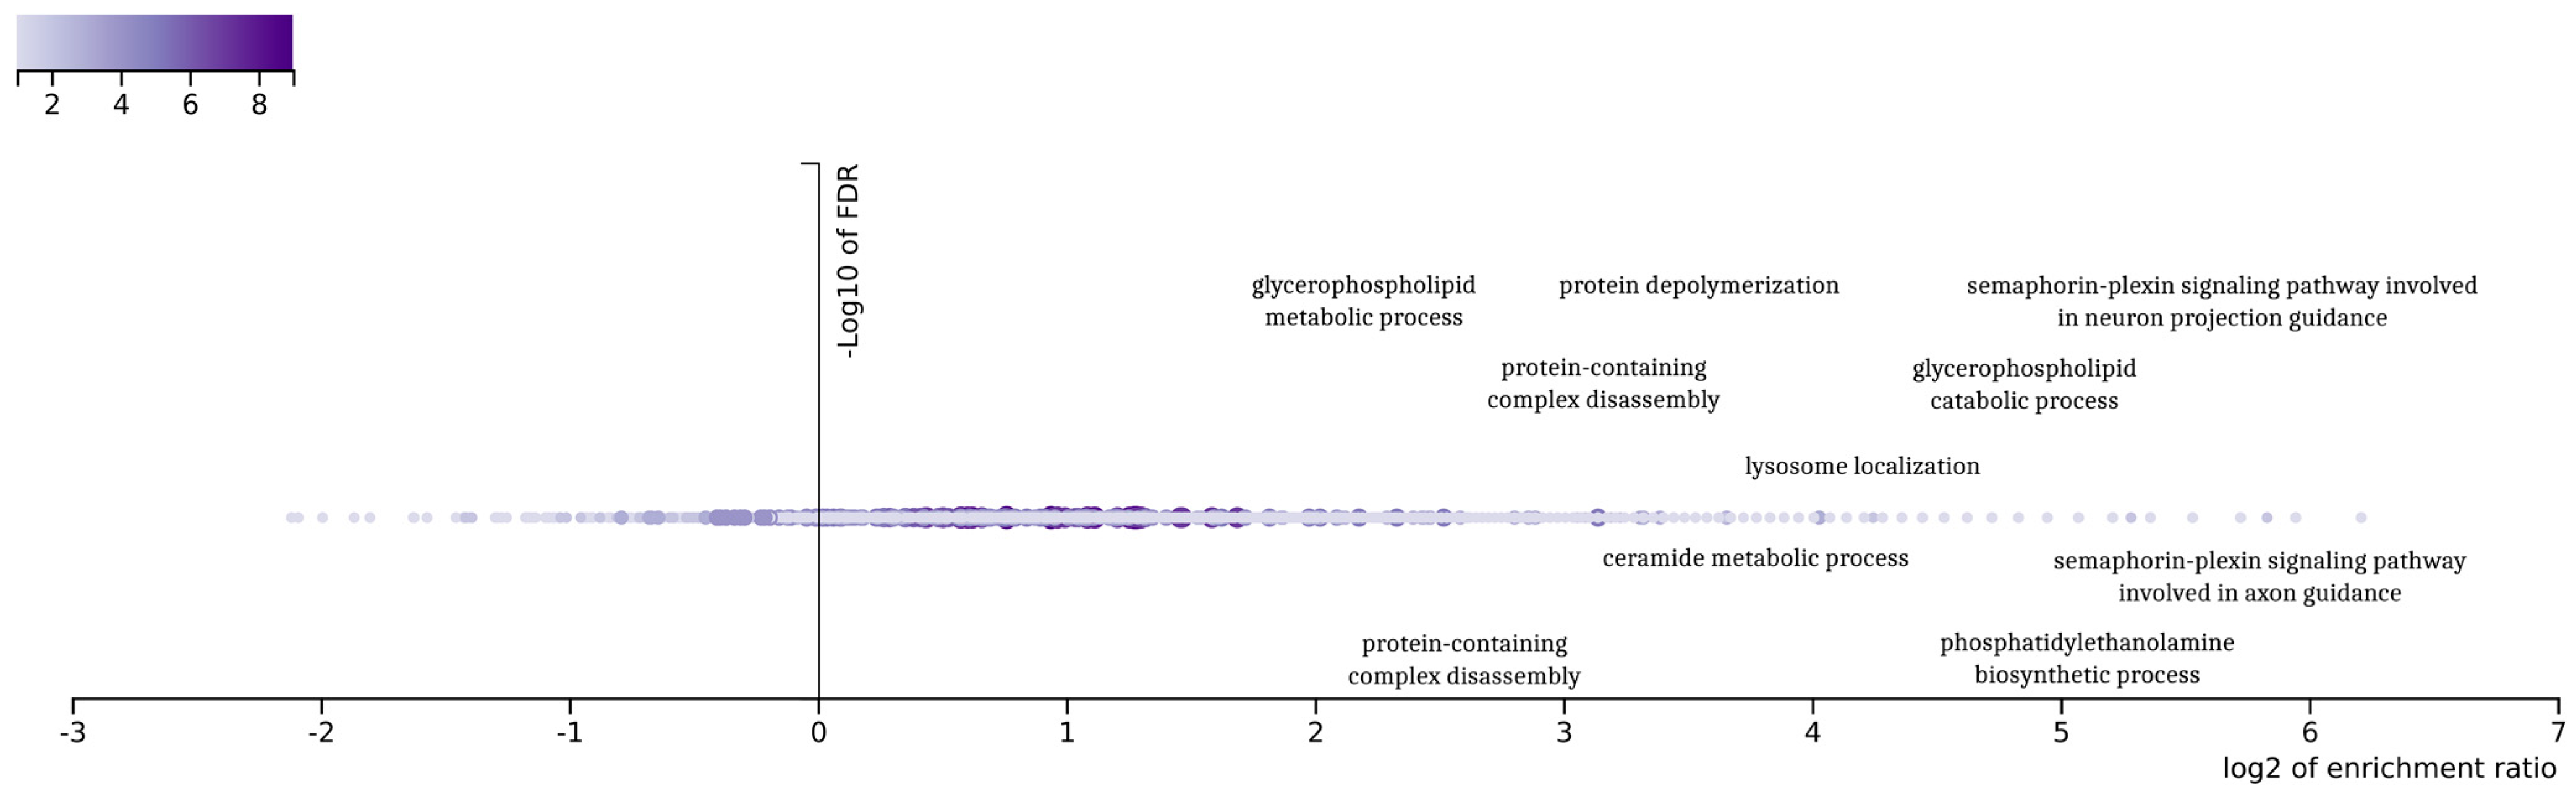
The final 92 genes that resulted from the genetic optimization-based pipeline were examined in an enrichment analysis based on gene ontologies (
Figure 4). The analysis was conducted using WebGestal [
26], a popular tool for the interpretation of gene lists derived from large-scale -omics studies. It was found that the gene ontologies associated with these genes displayed a variety related to glioblastoma. The outcomes of the enrichment analysis demonstrate a variety in those gene ontologies related to the complex biological processes associated with glioblastoma multiforme (GBM) subtypes. Indicatively, the ontology term “glycerophospholipid metabolic process” is related to the metabolic pathways that are crucial for maintaining cellular membrane integrity and the signaling, processes that are often altered in cancer cells, including those in GBM.
Furthermore, the term “semaphorin-plexin signaling pathway” is particularly noteworthy due to its involvement in neural development, which aligns with the characteristics of the proneural subtype of GBM. This pathway is known to play a significant role in neural patterning and development, making it a point of interest for further investigation in the context of GBM. Additionally, “protein-containing complex disassembly” and “protein depolymerization” are GO terms that may highlight important aspects of protein regulation and degradation in GBM. These processes could be pivotal in understanding the aberrant protein dynamics within GBM cells.
The GO term “lysosome localization” also emerges as relevant, potentially indicating alterations in the cellular trafficking and degradation pathways within the GBM tumor microenvironment [
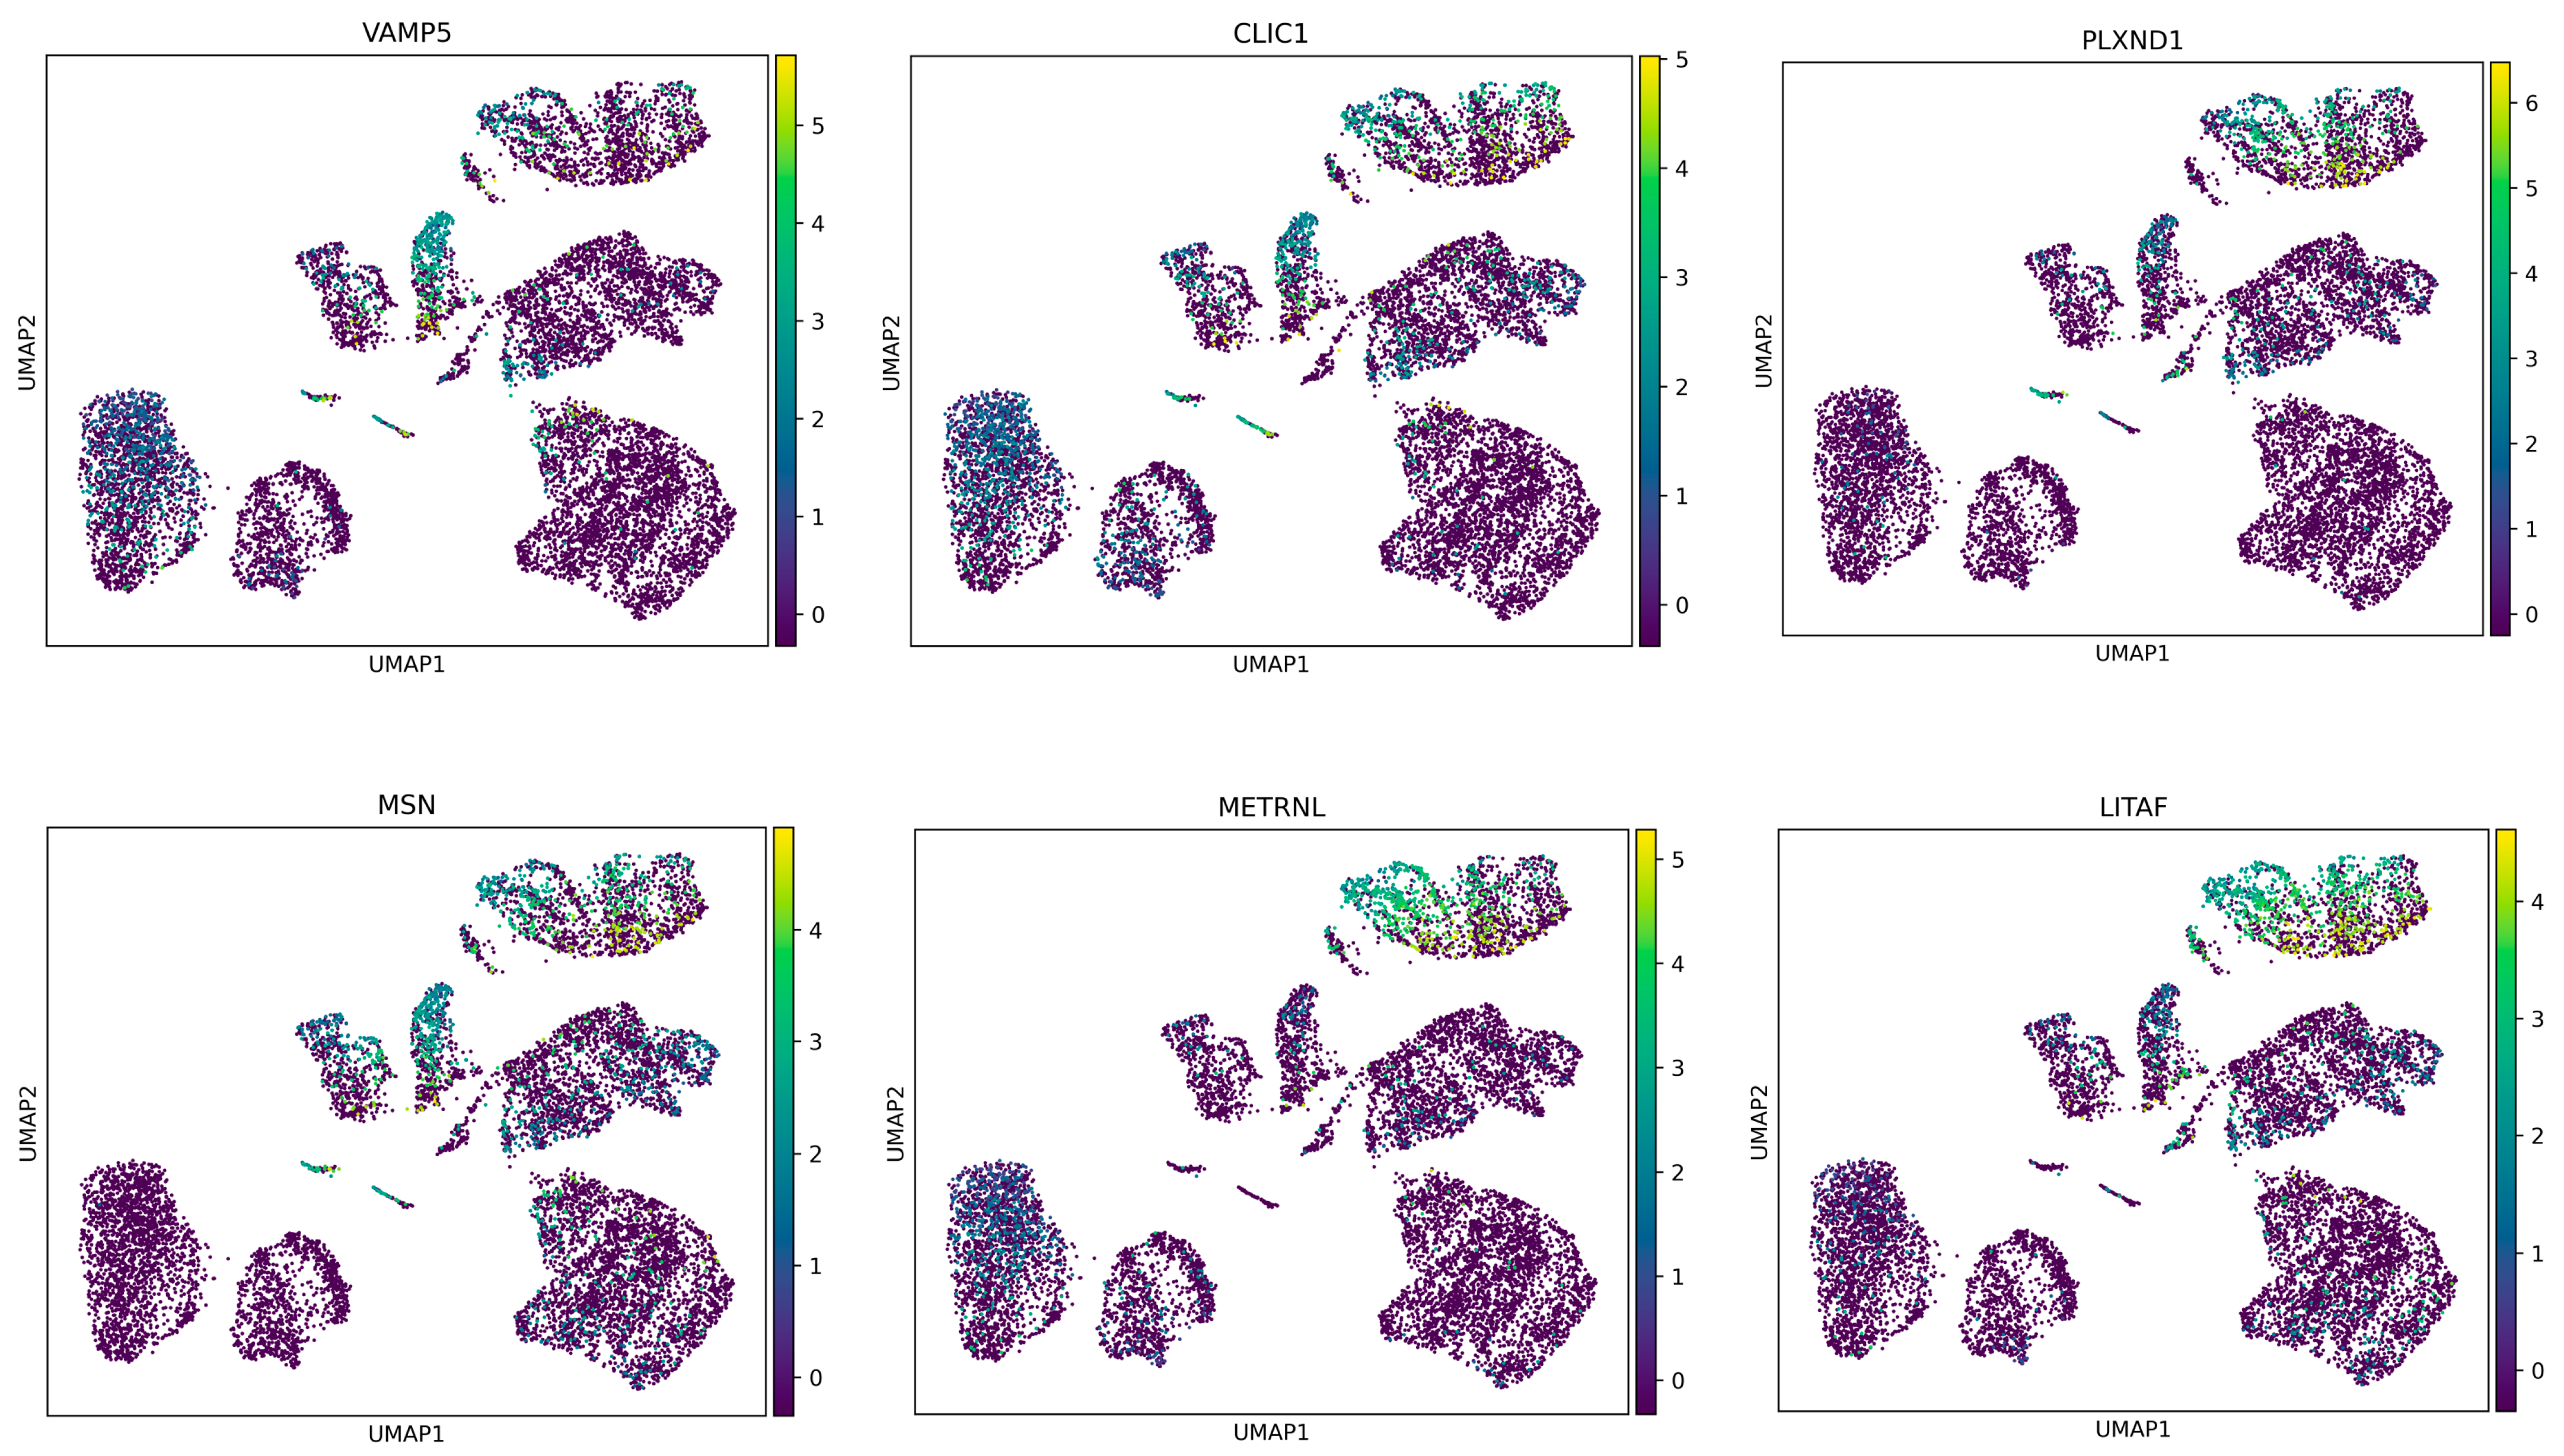
27]. This aspect could provide insights into how GBM cells manage cellular waste and recycling, which are critical for their survival and proliferation. Given the objective of achieving a more comprehensive cellular analysis, the analytical phase of this research focused on isolating the most significant differentially expressed genes (DEGs) that differentiate between the proneural and mesenchymal states of glioblastoma multiforme (GBM). Their expression profiles across all cell samples were then examined (refer to
Figure 5). It was observed that these genes exhibited a higher level of expression in cells derived from patients with the mesenchymal subtype of GBM, while a lower level of expression was noted in cells from the proneural subtype.
This in-depth analysis at the cellular level highlighted the potential of these DEGs to interpret the differences between the two GBM subtypes. The findings provided insights into the molecular mechanisms underlying the distinct pathological features of the proneural and mesenchymal GBM subtypes. The approach enabled a detailed understanding of the gene expression variations that contribute to the unique characteristics of each subtype, thereby offering a foundation for future research aimed at targeted therapeutic strategies.
In our study, a set of key genes, including VAMP5, CLIC1, PLXND1, MSN, METRNL, and LITAF, were identified as having higher mRNA expression levels in mesenchymal cells compared to the proneural cells of glioblastoma multiforme (GBM). This differential expression suggests a potential overproduction of the respective proteins in the mesenchymal subtype.
Among these, VAMP5 (vesicle-associated membrane protein 5) and CLIC1 (chloride intracellular channel 1) are particularly noteworthy. VAMP5 plays a role in vesicular transport and membrane fusion, processes that are crucial for cellular trafficking and signaling. Its elevated expression in mesenchymal cells may contribute to the altered cellular dynamics characteristic of this GBM subtype [
28]. Meanwhile, CLIC1 is involved in chloride ion transport and cell cycle control, and its upregulation could be linked to the enhanced proliferative capacity and invasiveness observed in mesenchymal GBM cells. PLXND1 (Plexin D1), another gene from the list, is integral to the semaphorin signaling pathway, which is implicated in angiogenesis and cellular migration. Its increased expression in mesenchymal cells aligns with the subtype’s aggressive nature, marked by enhanced angiogenesis and invasiveness.
MSN (moesin) and METRNL (meteorin-like) are also of interest. MSN is part of the ERM (ezrin, radixin, moesin) protein family, playing a role in cytoskeletal rearrangement and cellular morphology, potentially influencing cell motility and invasion in mesenchymal GBM. METRNL, which is implicated in immunometabolic responses, could contribute to the unique inflammatory microenvironment of the mesenchymal subtype [
29]. Finally, LITAF (lipopolysaccharide-induced tumor necrosis factor-alpha factor), with its role in inflammatory response regulation, may reflect the mesenchymal subtype’s pro-inflammatory traits.
Furthermore, the mesenchymal gene signature in glioblastoma multiforme (GBM) is associated with aggressive tumor behavior and poor patient outcomes. Elevated expression of VAMP5, CLIC1, PLXND1, MSN, METRNL, and LITAF genes has been observed within this subtype, indicating their potential involvement in driving disease progression. These genes are implicated in various cellular processes, such as vesicle trafficking (VAMP5), ion transport (CLIC1), cell signaling (PLXND1), cytoskeletal organization (MSN), and immune regulation (METRNL and LITAF). Their collective impact likely contributes to the invasive and treatment-resistant nature of mesenchymal GBM. Understanding the specific roles of these genes within the mesenchymal subtype could offer insights into novel therapeutic strategies aimed at mitigating disease aggressiveness and improving patient outcomes.
The elevated mRNA expression of these genes in mesenchymal cells compared to the proneural cells of GBM provides valuable insight into the molecular distinctions driving the pathophysiology of these subtypes. This understanding could pave the way for targeted therapeutic strategies tailored to the unique characteristics of each GBM subtype.
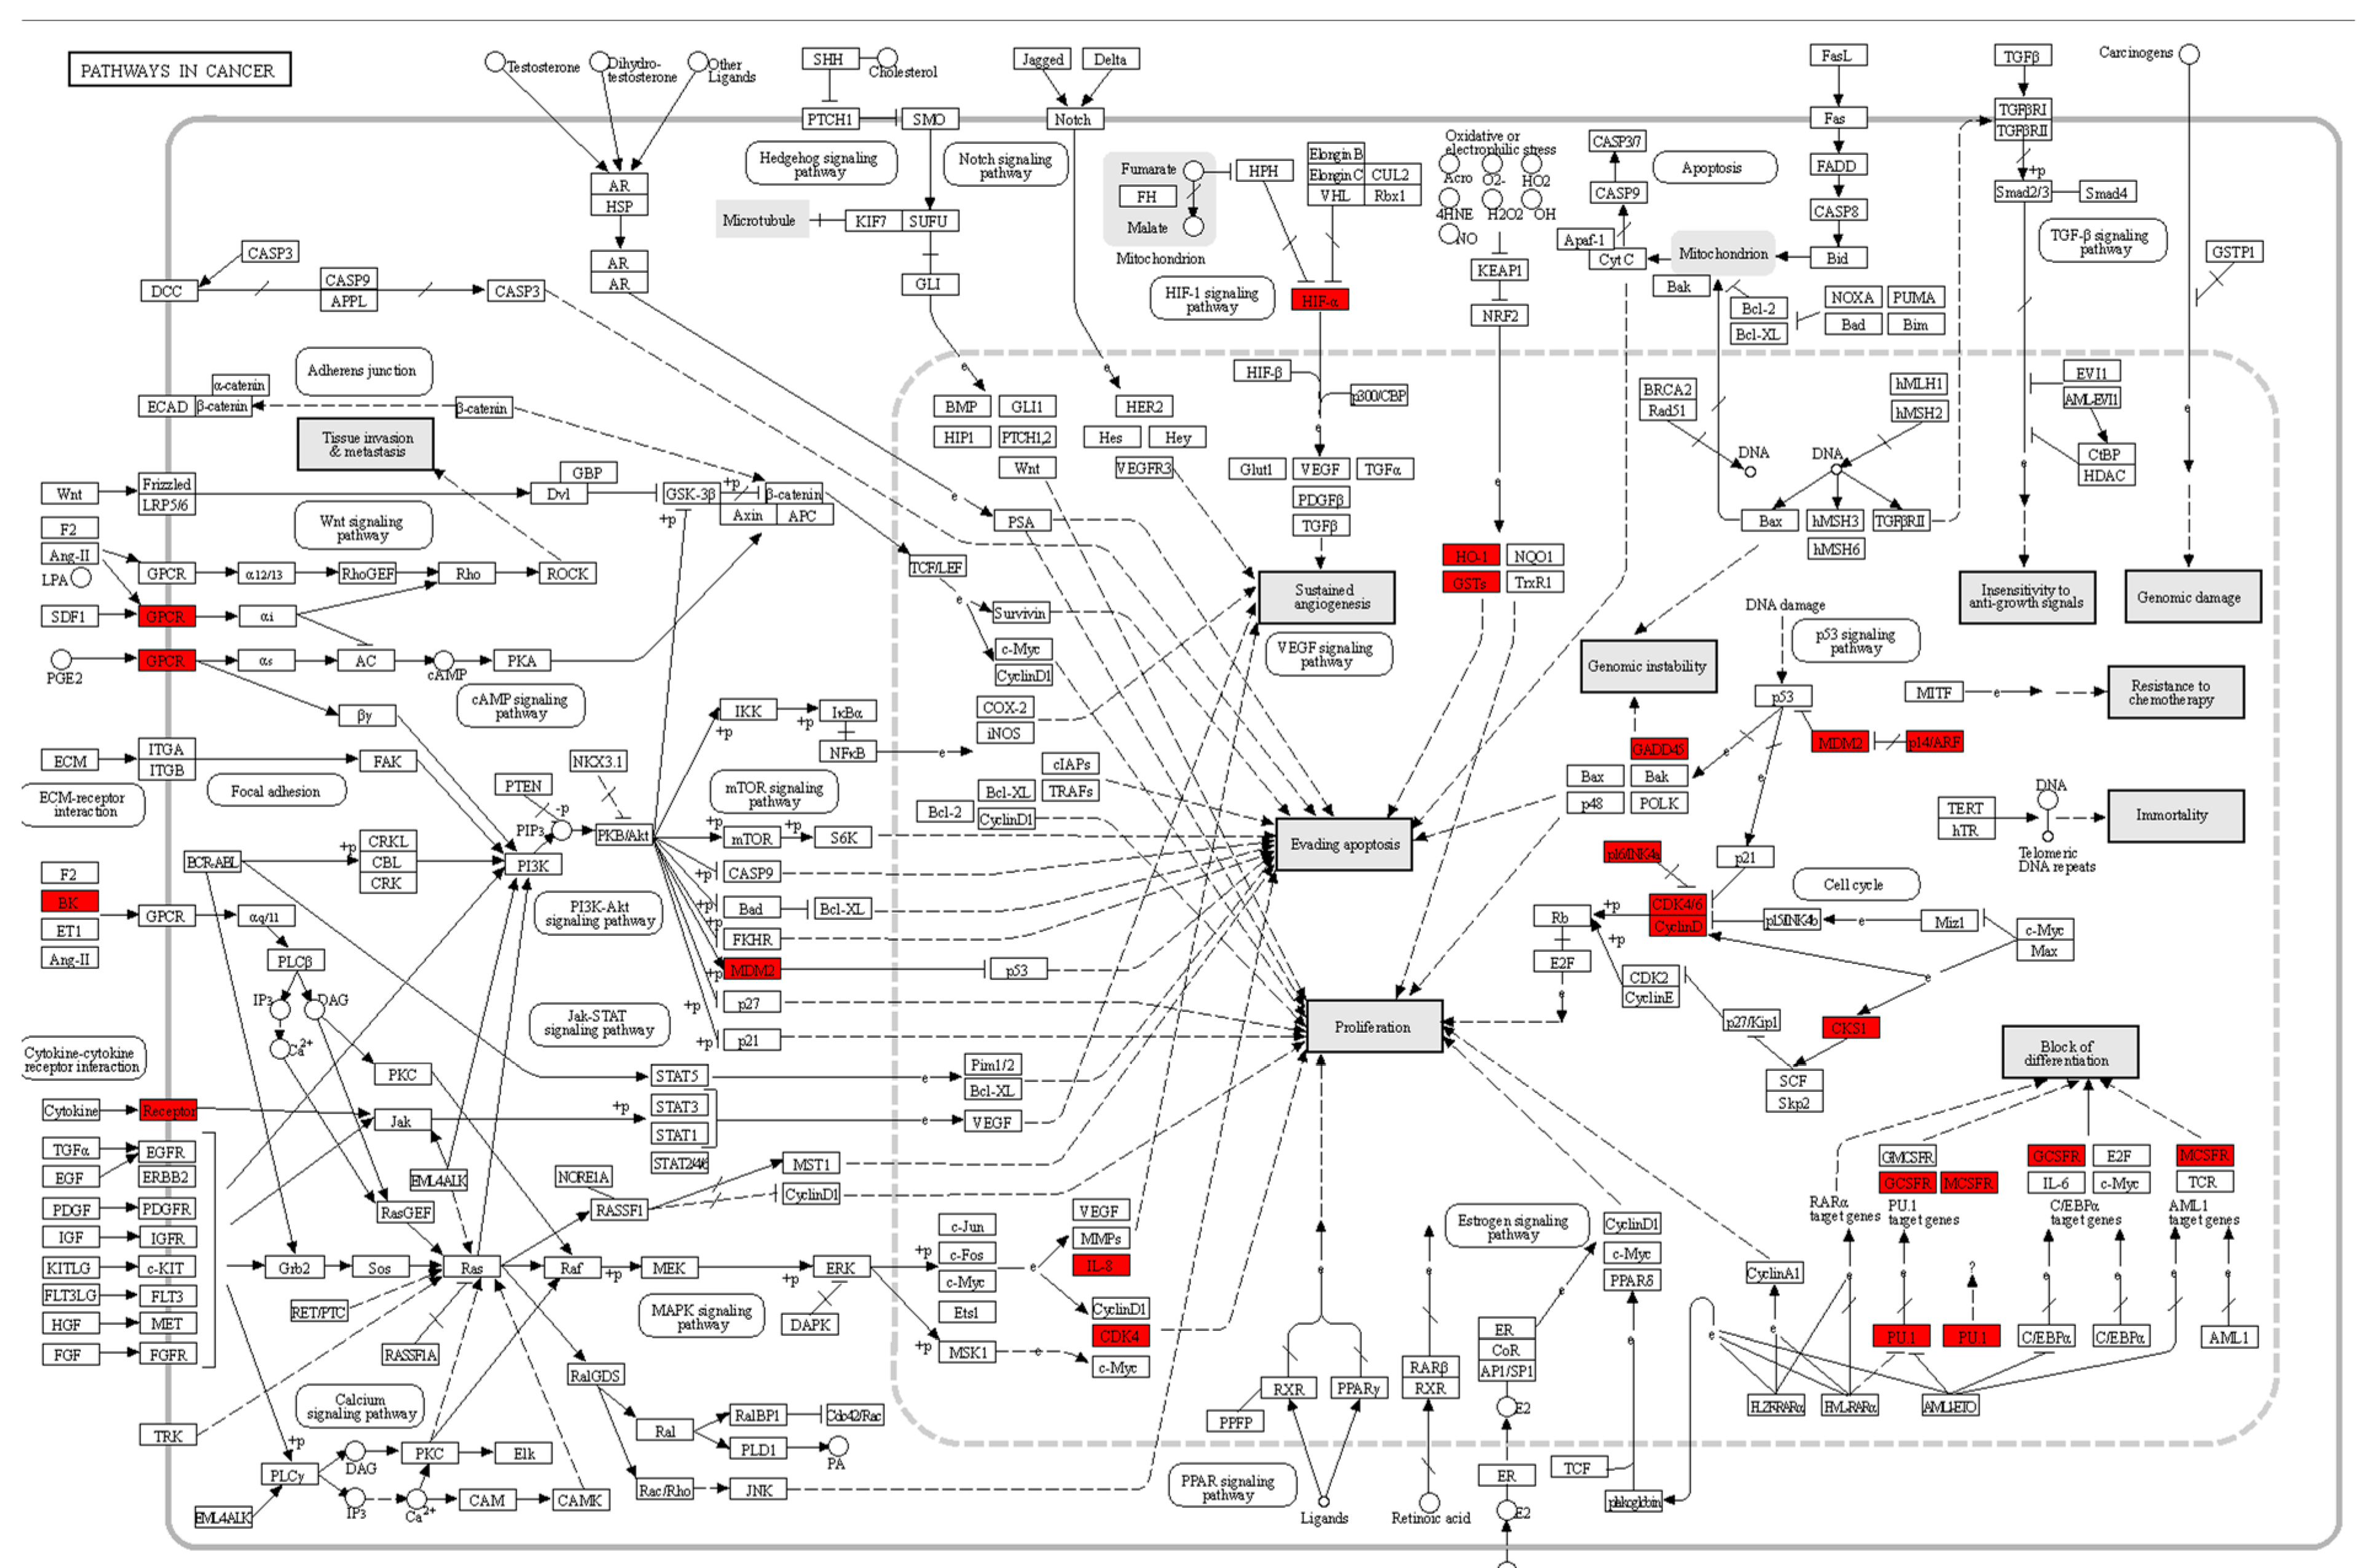
In our study, the “Pathways in Cancer” KEGG pathway map (see
Figure 6) plays a pivotal role in elucidating the molecular mechanisms underlying the transition from proneural to mesenchymal glioblastoma (GBM) cells. The above map highlights those genes with the most significant differential expression (DEGs) by enclosing them within red boxes, providing a visual representation of their importance within the broader context of cancer-related pathways. Notably, these DEGs are portrayed as central players in cancer biology, suggesting their potential roles as key regulators in GBM progression. Furthermore, we observe 23 genes displaying considerable activity. This observation underscores the substantial involvement of the “Pathways in Cancer” KEGG pathway in the transition between GBM cell subtypes, reaffirming the relevance of our experimental results in shedding light on the underlying molecular processes that drive GBM pathogenesis.


