1. Introduction
In a hospital or healthcare facility, urine is collected and analyzed to evaluate kidney function. Accurately measuring urine output in hospitalized patients is critical in the treatment of patients with acute renal injury, sepsis, and other medical conditions [
1]. Most urine measurements are done by nurses who manually examine the gradation markings on the urine collection bag to approximate the amount of urine collected. The Foley catheter is inserted through a patient’s urethra into the bladder, which collects urine into a bag, which is then quantified visually and calculated as urine output over a period of hours (mL/h) [
2]. Manual measurements are laborious for the nursing staff, and this is one reason why it is usually not done frequently. Furthermore, studies have shown that electronic measurement of urine output is more accurate than manual measurements [
3]. However, such electronic devices are extremely expensive, so their uses are currently very limited.
One type of electronic device currently on the market to measure urine output is the RenalSense Clarity RMS Sensor Kit [
4]. The device involves the use of patented sensors and costs about 5000 USD for the console, and 85 USD for each single-use specialized temperature-sensing urine collection bag [
5]. The technology is based on the principle of thermal transfer. The literature available does not elaborate further on the specifics of this technology. This equipment is cost-prohibitive for most hospitals, resulting in few hospitals using this device.
Sensica Urine Output System [
6] is another commercially available continuous urine monitoring device, but it was recalled in 2022 due to inaccuracies [
7]. A thorough literature search did not yield information on what engineering principles the device was based on or how the device was developed. There are several other devices that are commercially available, such as the Accuryn Monitoring System [
8], but the companies do not disclose the technology used in the development or the accuracy of the devices. Furthermore, most of them are approved only in certain countries, such as Israel, and not in the USA.
There have been other urine output measurement systems proposed, but they were not commercially developed due to various reasons. One such proposal was by Otero et al. That device used capacitive sensors in the form of floating rods for measuring the amount of urine within a rigid container. The rods would move depending on how much fluid was in the container. The rods’ relative position in the container would be an indicator of how much urine was collected. The device required a significant amount of space and time to set up [
9]. Likely due to these limitations, the device was not commercially developed.
This paper provides a new device for automatic urine output measurements. The primary feature of this device is to eliminate the need to take urine volume measurements manually by visual inspection. It reduces the labor and cost of the process by automatically and constantly measuring the weight and hence the volume of the urine. The collected data is sent wirelessly to a server and directly to mobile devices accessible to doctors and other healthcare providers. This device is designed to have a very low cost compared to other available automated urine measurement systems. The device provides highly accurate and frequent readings that far exceed what is available with manual measurements (i.e., visual inspections).
The enhanced frequency and accuracy of this device are expected to provide additional data to the healthcare provider that can have greater therapeutic value and lead to better health outcomes. This device may have applications in healthcare areas where fluids are collected and can be measured cheaply and accurately. These additional uses are under investigation.
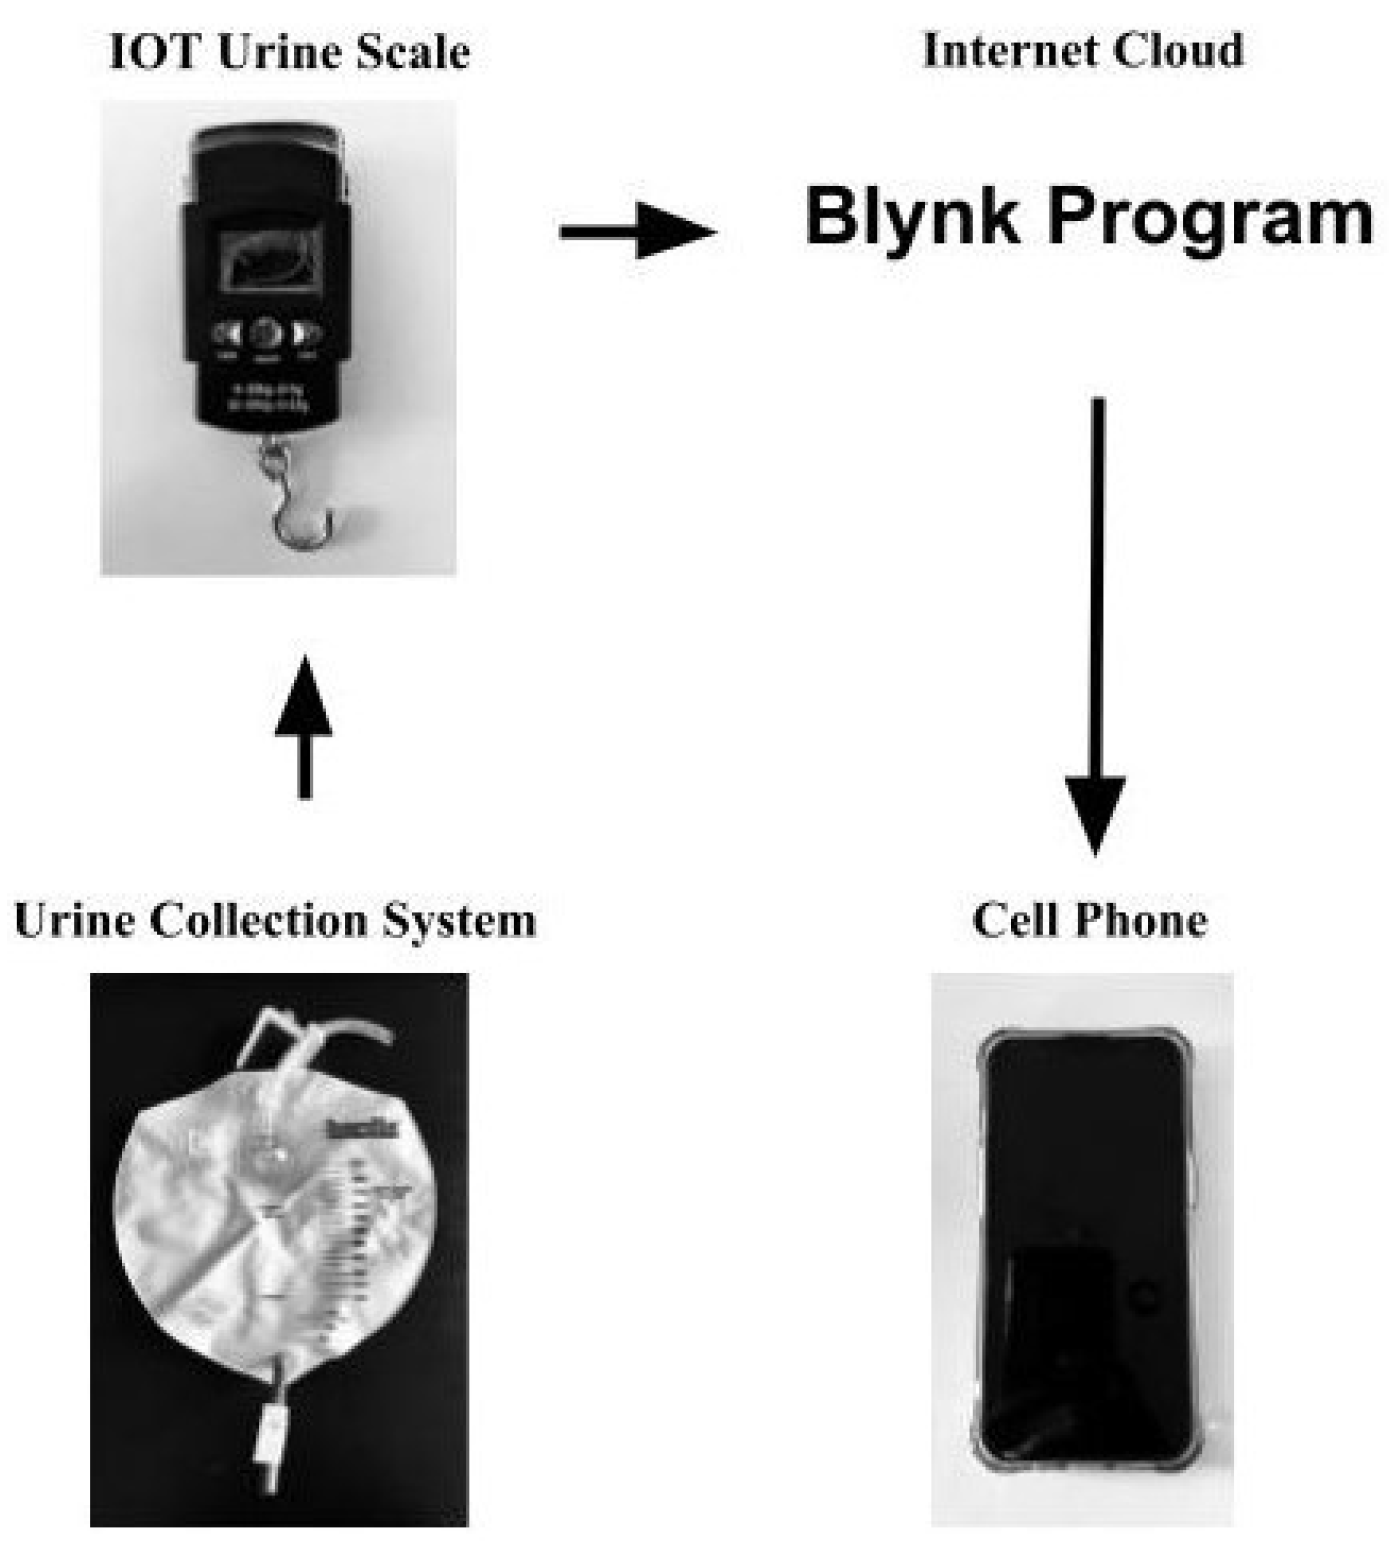
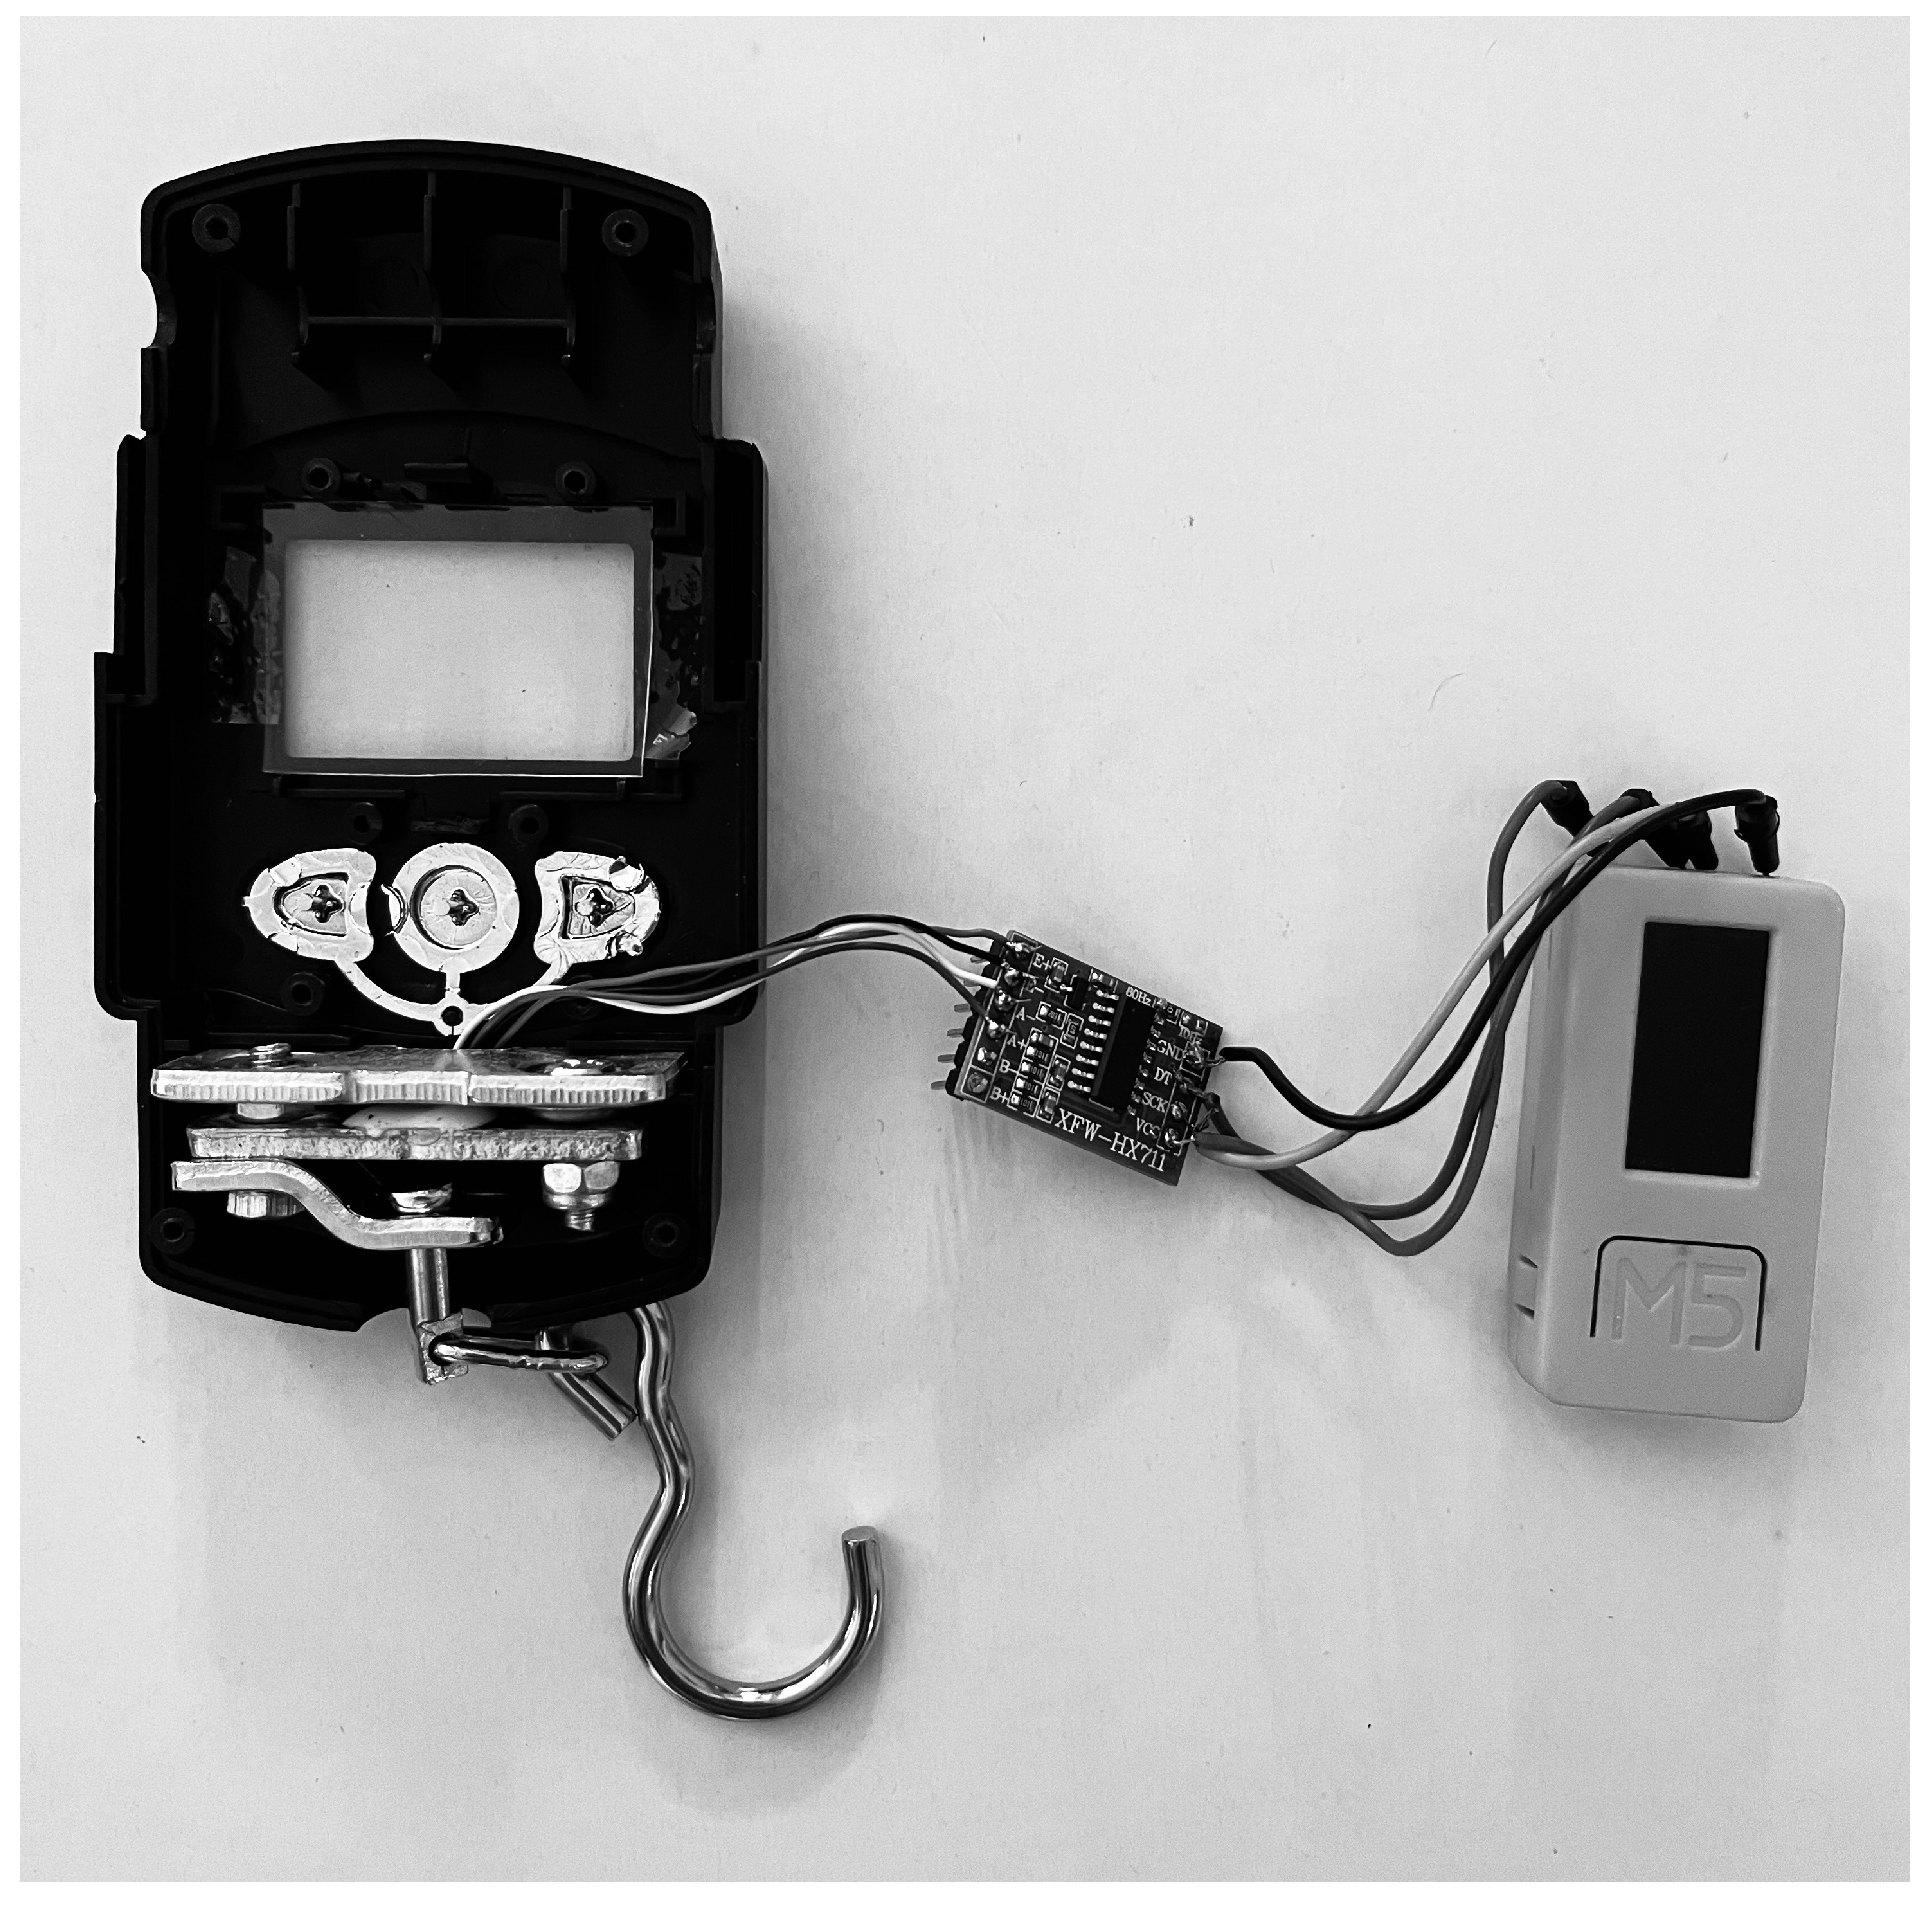
This device, referred to as the Internet-of-Things (IoT) Urine Scale, was developed at a minimal cost of 26 USD and was built using a strain gauge load cell, an integrated circuit that contained an amplifier, analog-to-digital converter, and a WiFi-enabled microcontroller. The data was sent via wireless networking to a data collection and analysis server, which provided accurate analyses of urine output. A mobile application utilizing the Blynk.io system was used to display the data (
Figure 1). This device was built specifically to measure urine output in a hospital setting. For this device to measure other types of fluid collection, additional computer programming would be required to incorporate the different fluid densities required to convert the fluid weight into volume.
The device was able to measure as frequently as in 1 s intervals the volume of urine collected with a high level of accuracy. The commercially available RenalSense Clarity RMS Sensor Kit measures urine output every 15 min, and the Sensica Urine Output System measures urine output in 1 min intervals. There are currently no commercially available devices that measure urine output in the 1 s interval range.
5. Discussion and Conclusions
The developed IoT Urine Scale has been very successful in capturing simulated urine output. There was a 16.3 mL mean difference (median 12.5, SD 17.3, 95% CI 11.2 to 21.4) between the IoT Urine Scale measurement to the actual volume in measuring volumes ranging from 0 to 2000 mL. The IoT Urine Scale is still more accurate than the manual measurement of urine output. In clinical medicine, this percentage error is negligible and will not affect patient treatment and outcome. The IoT Urine Scale measurement results were also analyzed and compared to the most common measurement technique used today, which is manual measurements done by nurses visually looking at the urine bag gradations. In a study conducted by Goldman et al., the measurements done by the nurses had a mean difference from the actual volume of 8.5 mL (SD 46.091, 95% CI 5.4 to 11.7). The nursing measurement had a significantly large standard deviation of 46.091 mL. In that same study, the mean difference from the commercially available RenalSense Clarity RMS Sensor Kit to the actual volume was
mL (SD 25.771, 95% CI
to
). Although the mean difference was smaller, the RenalSense ClarityRMS Sensor Kit still had a notably large standard deviation of 25.771 mL. The mean urine volume measured in Golman et al.’s study was 97 mL. Our IoT Urine scale, when tested 20 times at 97 mL, had a difference of 0.8 mL (median 1.0, SD 1.2, 95% CI 0.7 to 0.9) between the actual versus measured volumes. The mean volume difference and standard deviation for our device were significantly smaller than the RenalSense Clarity RMS Sensor Kit and the nursing measurements. There are other electronic urine output measuring devices, such as the Accuryn Monitoring System and Sensica Urine Output System; however, there are no published studies evaluating the accuracy of these devices. It should be noted that the Sensica Urine Output System was recalled by the US Food and Drug Administration in 2022 due to its inaccuracies [
7]. At the time of recall, there were 457 units in use. This also shows that very few of these electronic urine measurement devices were being used in hospitals.
The IoT Urine Scale developed by us is able to measure fluid volume collection over a wide-ranging frequency of time, from seconds to hours, depending on the user’s preference, and transmits the data directly to the physician or other healthcare provider. This technology bypasses the labor-intensive, inaccurate, and infrequent measurements made by the nurse, which may be done only two to three times a day. Infrequent monitoring may be disadvantageous to a patient’s health. For instance, in specific hospital settings, especially the intensive care unit or operating room, careful and frequent urine output monitoring can be extremely important. For patients with heart failure, urine output is an essential measurement because the physician reviews that data to determine if adequate amounts of fluid have been removed from the patient and if medication needs to be adjusted. In one study, researchers found that minute-to-minute changes in urine output can provide earlier detection of life-threatening conditions, such as sepsis [
19]. It would be very beneficial to have real-time, continuous measurement of the urine output in minutes (mL/min) or even in seconds (mL/s), compared to the current standard of hours (mL/h), to improve the health outcome of patients. Our device is able to provide measurements in a smaller time interval of 1 s compared to the electronic devices in the market, which, at best, measure at 1 min time intervals [
4].
The change in the rate of urine output ( mL/min) has previously not been mentioned in medical journals because it is too difficult for the nursing staff to monitor the urine output at short intervals, such as in minutes or seconds. The urine bag and gradation markings inherently make urine volume measurement inaccurate. As a result, the change in the rate of urine output cannot be accurately calculated. In hospitals and nursing homes, the urine output is usually manually measured once every 1 to 24 h, with 1 h usually reserved for the most critically ill patients, as it is very labor intensive. Since this IoT Urine Scale is able to measure the urine volume change over 1 s, an accurate change in urine output rate ( mL/sec) can also be calculated. A change in urine rate can allow for the monitoring of subtle changes in kidney function, which will alert the clinician to the possible onset of acute renal injury or renal failure much sooner and thus implement life-saving measures quickly.
The integrated battery in the M5StickC is small (120 mAh), and the run time is low at approximately 1 h per charge using the current firmware. Significantly longer run-time can be achieved by taking readings at longer intervals and putting the M5StickC device to low-power consumption sleep mode while not actively taking a reading. For example, the estimated run time using a 5 min reading interval can improve the run time to more than 10 h while still being able to provide a good urine output rate in mL/h. An external battery pack can also be connected via USB to the M5StickC through a port on the hanging scale housing, or a larger integrated battery such as the 18650C HAT [
20] module that provides 2200 mAh of power for 19 times the run time. The size of the battery module is 150 mm × 24 mm × 24 mm, and the weight is 90 g, which will require a larger housing. This would result in a run time of 19 h to at least 190 h using a 5 min reading interval. If an electrical outlet is nearby, which is usually the case in most clinical settings, the IoT Urine Scale can be adapted to plug into it via USB, just as with other medical equipment. The battery life would not be an issue in this case, and the IoT device could run indefinitely.
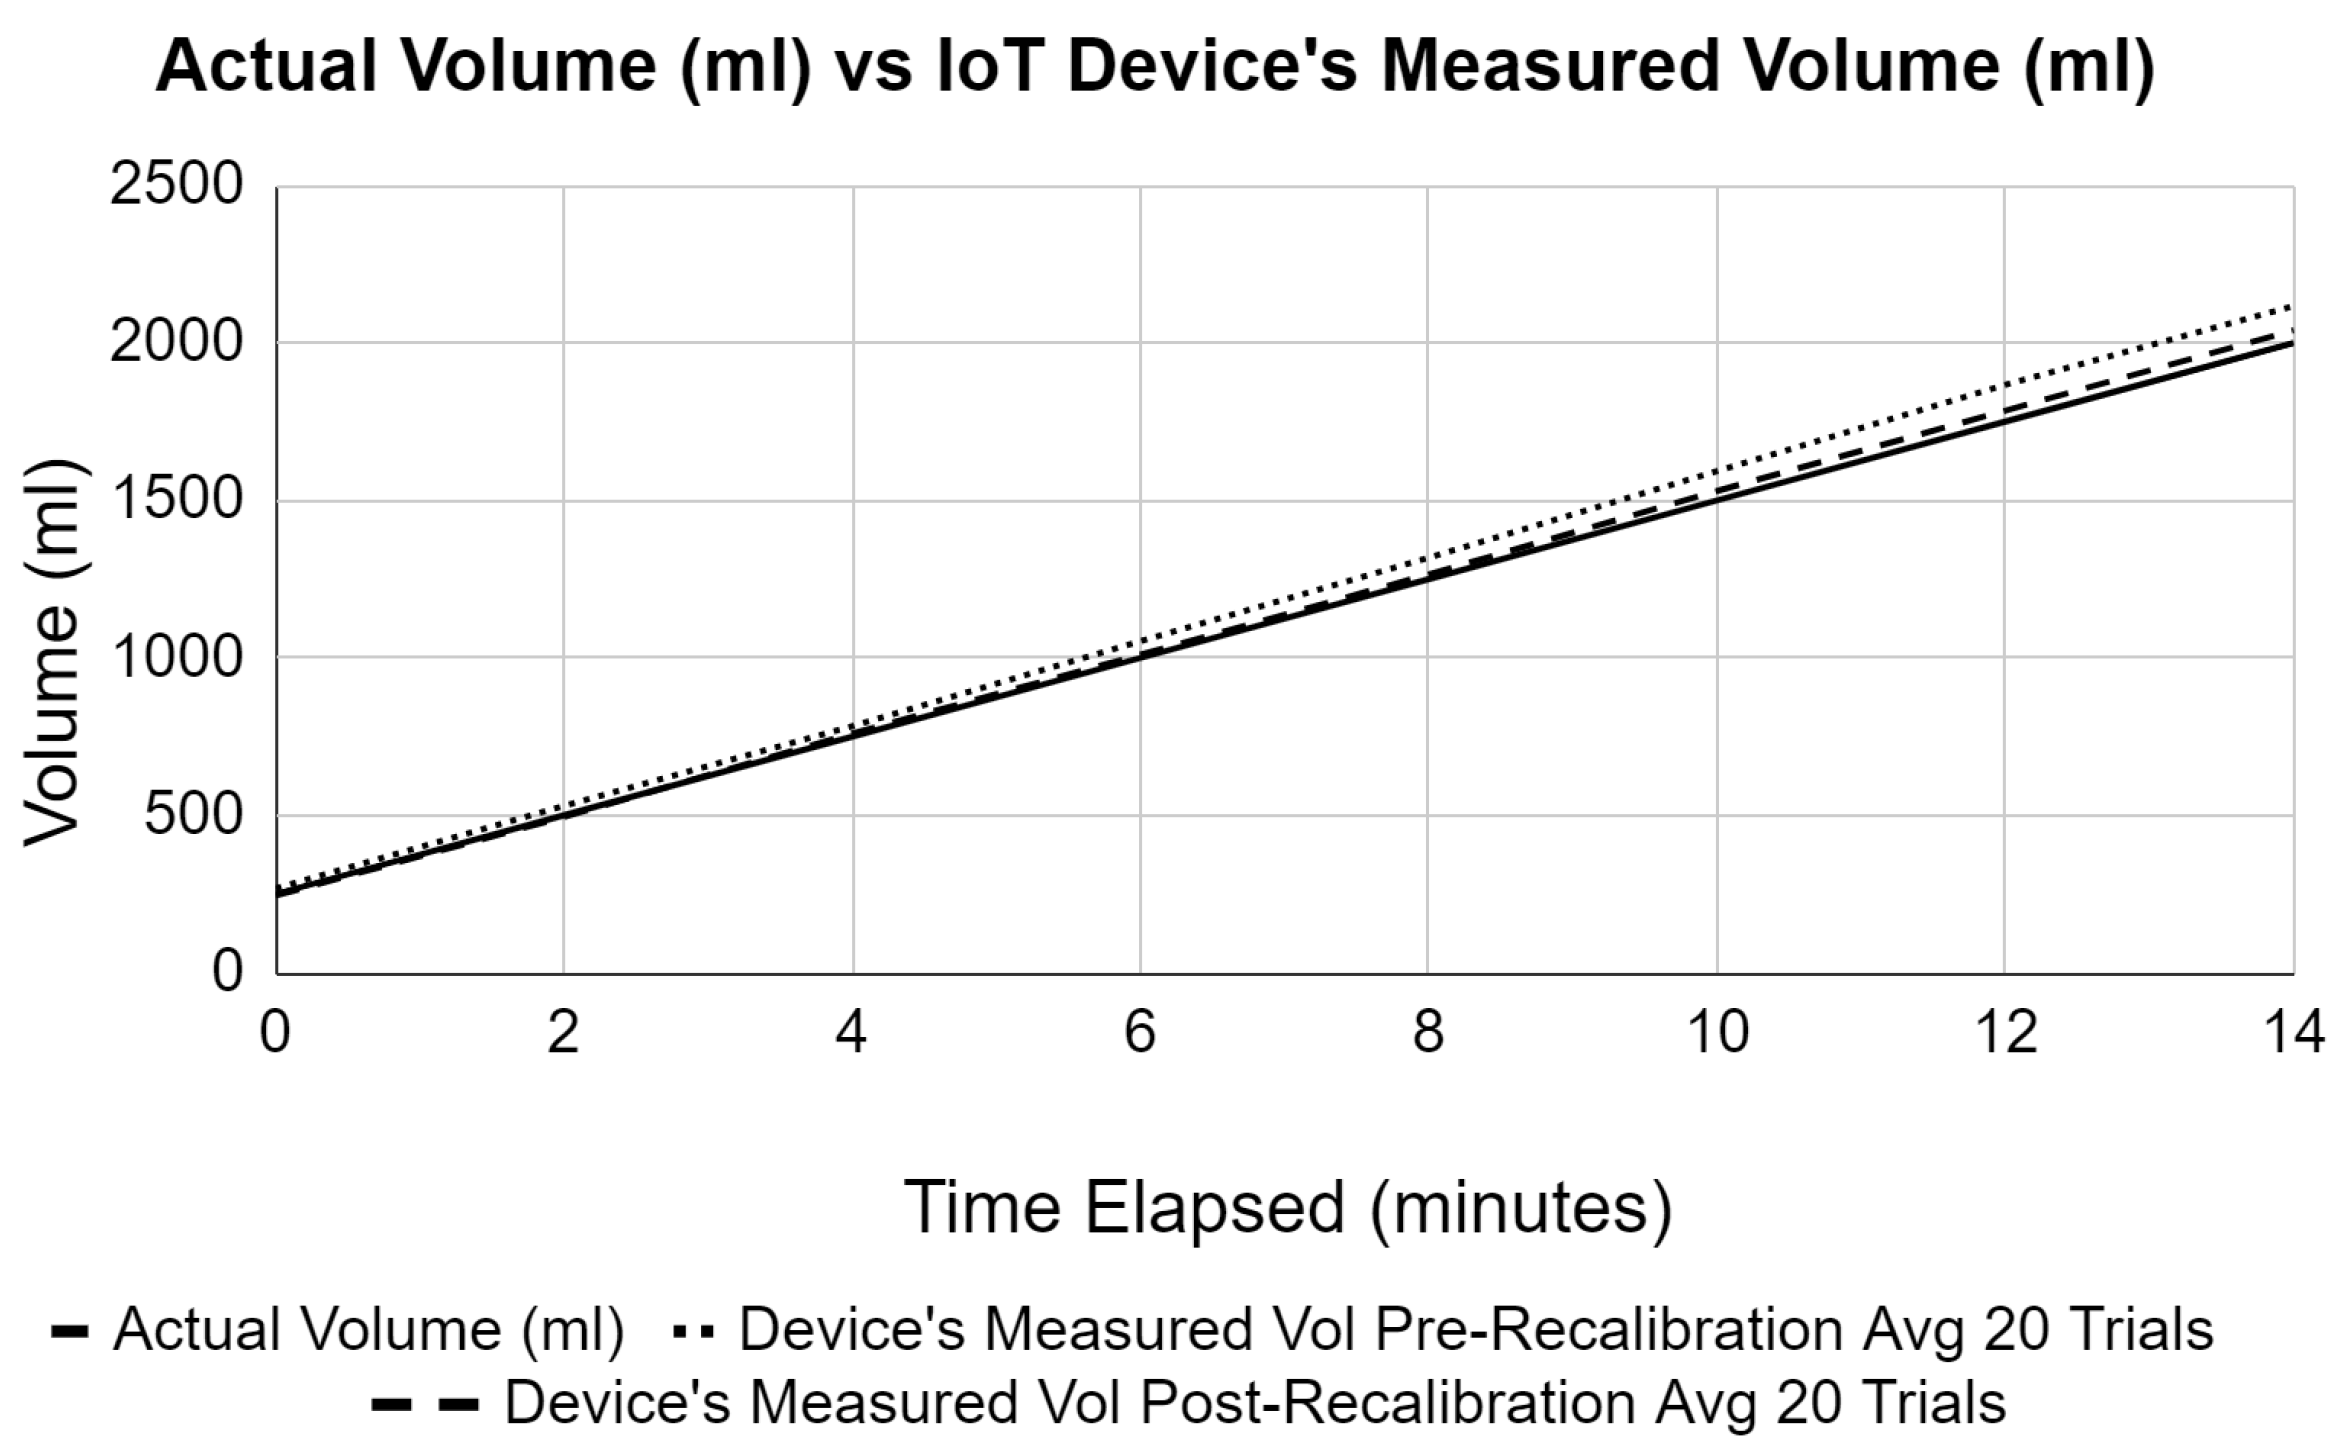
We propose the difference in the actual versus the measured volume of the simulated urine is due to the accuracy of the calibration constant. Re-calibrating this constant helped tremendously, and the measured volume became much more accurate. With production devices, it is expected that each device is to be calibrated individually during production to accurately set the calibration constant. Another possibility for the percentage error may be the fluctuation in the ambient temperature, which may affect the hardware in the device. Future work can be done on refining the accuracy of urine measurements. This IoT Urine Scale thus far has been shown to be much more accurate than manual measurements and even with commercially available electronic measurement devices.
Future experimentation on this device can include testing the device’s accuracy over a 24 h period. This would more precisely simulate the time frame urine output would be monitored in hospitalized patients. In hospital settings, different patient rooms in the hospital may have different temperatures. The device can also be tested for accuracy at these slightly different room temperatures.
In summary, the developed IoT Urine Scale is of a very low cost (26 USD), compatible with current standard urine collection bags, and highly accurate. Due to the device’s affordability and adaptability, and ability to provide real-time urine output to a doctor remotely, we feel this device has the potential to be adopted by hospitals around the world to improve patient care and save lives.
Author Contributions
Conceptualization, A.L.; methodology, A.L.; software, H.-J.J.Y.; validation, M.L.; formal analysis, A.L. and M.L.; investigation, A.L. and M.L.; resources, H.-J.J.Y.; data curation, A.L., M.L. and H.-J.J.Y.; writing—original draft preparation, A.L., M.L. and H.-J.J.Y.; writing—review and editing, A.L., M.L. and H.-J.J.Y.; visualization, A.L.; supervision, H.-J.J.Y.; project administration, M.L. All authors have read and agreed to the published version of the manuscript.
Funding
This research received no external funding.
Institutional Review Board Statement
Not applicable.
Informed Consent Statement
Not applicable.
Data Availability Statement
Not applicable.
Conflicts of Interest
The authors declare no conflict of interest.
References
- Schrier, R.W.; Wang, W. Acute Renal Failure and Sepsis. N. Engl. J. Med. 2004, 351, 159–169. [Google Scholar] [CrossRef] [PubMed]
- Urinary Catheterization—Uses, Types, and Complications. Available online: https://www.starhealth.in/blog/urinary-catheterisation-uses-types-and-complications (accessed on 30 December 2022).
- Minor, J.; Smith, A.; Deutsch, F.; Kellum, J. Automated versus manual urine output monitoring in the intensive care unit. Sci. Rep. 2021, 11, 17429. [Google Scholar] [CrossRef] [PubMed]
- Goldman, A.; Azran, H.; Stern, H.; Grinstein, M.; Wilner, D. A Novel Electronic Device for Measuring Urine Flow Rate: A Clinical Investigation. Clin. Med. Insights Trauma Intensive Med. 2017, 8, 1179560317730032. [Google Scholar] [CrossRef] [Green Version]
- RenalSense Clarity RMS for Acute Kidney Injury. Available online: https://www.nice.org.uk/advice/mib256/resources/renalsense-clarity-rms-for-acute-kidney-injury-pdf-2285965696772293 (accessed on 30 December 2022).
- Sensica Urine Output System. Available online: https://www.bd.com/en-us/products-and-solutions/products/product-243page.SCCS1002specifications (accessed on 1 May 2023).
- Class 2 Device Recall Sensica. Available online: https://www.accessdata.fda.gov/scripts/cdrh/cfdocs/cfres/res.cfm?id=193881 (accessed on 1 May 2023).
- Accuryn Monitoring System. Available online: https://potreromed.com/why-accuryn/ (accessed on 2 May 2023).
- Otero, A.; Apalkov, A.; Fernadez, R.; Armada, M. A New Device to Automate the Monitoring of Critical Patients’ Urine Output. Biomed. Res Int. 2014, 587593. [Google Scholar] [CrossRef] [PubMed] [Green Version]
- Amazon.com. Digital Fish Scale Fishing Weights Scale, Hanging Scale Digital Weight Backlight LCD Display 110 lb/50 kg Electronic Balance Digital Fishing Postal Hanging Hook Scale With Measuring Tape 2 AAA Batteries: Sports and Outdoors. Available online: https://www.amazon.com/OtooKing-Backlight-Electronic-Measuring-Batteries/dp/B083FRBQ69 (accessed on 30 December 2022).
- Fraden, J. Force and Strain. In Handbook of Modern Sensors; Springer: Cham, Switzerland, 2016; pp. 413–428. ISBN 978-3-319-19302-1. [Google Scholar]
- Avia Semiconductor. Available online: https://cdn.sparkfun.com/datasheets/Sensors/ForceFlex/hx711_english.pdf (accessed on 30 December 2022).
- M5Stack. Available online: docs.m5stack.com/en/core/m5stickc (accessed on 30 December 2022).
- Espressif Systems ESP32 Series Datasheet. Available online: https://www.espressif.com/sites/default/files/documentation/esp32_datasheet_en.pdf (accessed on 30 December 2022).
- Arduino. Available online: https://www.arduino.cc/ (accessed on 30 December 2022).
- Blynk Inc. Available online: https://blynk.io (accessed on 30 December 2022).
- Engineering ToolBox: Water- Specific Gravity vs. Temperature. Available online: https://www.engineeringtoolbox.com/water-temperature-specific-gravity-d_1179.html (accessed on 19 May 2023).
- Urine Specific Gravity Test: MedlinePlus: U.S. National Library of Medicine. Available online: https://medlineplus.gov/ency/article/003587.htm (accessed on 19 May 2023).
- Otero, A.; Cardinal-Fernández, P.; Rojas, Y.; Nin, N.; Martínez-Caro, L.; Esteban, A.; Lorente, J.A. On the minute by minute variations of urine output: A study in a Porcine Model. J. Nephrol. 2014, 27, 45–50. [Google Scholar] [CrossRef] [PubMed]
- M5Stack. Available online: https://shop.m5stack.com/products/m5stickc-18650 (accessed on 30 December 2022).
| Disclaimer/Publisher’s Note: The statements, opinions and data contained in all publications are solely those of the individual author(s) and contributor(s) and not of MDPI and/or the editor(s). MDPI and/or the editor(s) disclaim responsibility for any injury to people or property resulting from any ideas, methods, instructions or products referred to in the content. |
© 2023 by the authors. Licensee MDPI, Basel, Switzerland. This article is an open access article distributed under the terms and conditions of the Creative Commons Attribution (CC BY) license (https://creativecommons.org/licenses/by/4.0/).


