Review

Review of Remote Sensing Approaches and Soft Computing for Infrastructure Monitoring

by
Aggeliki Kyriou
1,
Vassiliki Mpelogianni
2,
Konstantinos Nikolakopoulos
1,* and
Peter P. Groumpos
2
1
Department of Geology, University of Patras, 265 04 Patras, Greece
2
Department of Electrical and Computer Engineering, University of Patras, 265 04 Patras, Greece
*
Author to whom correspondence should be addressed.
Geomatics 2023, 3(3), 367-392; https://doi.org/10.3390/geomatics3030021
Submission received: 11 May 2023 / Revised: 5 July 2023 / Accepted: 10 July 2023 / Published: 16 July 2023

Abstract

:
During the past few decades, remote sensing has been established as an innovative, effective and cost-efficient option for the provision of high-quality information concerning infrastructure to governments or decision makers in order to update their plans and/or take actions towards the mitigation of the infrastructure risk. Meanwhile, climate change has emerged as a serious global challenge and hence there is an urgent need to develop reliable and cost-efficient infrastructure monitoring solutions. In this framework, the current study conducts a comprehensive review concerning the use of different remote-sensing sensors for the monitoring of multiple types of infrastructure including roads and railways, dams, bridges, archaeological sites and buildings. The aim of this contribution is to identify the best practices and processing methodologies for the comprehensive monitoring of critical national infrastructure falling under the research project named “PROION”. In light of this, the review summarizes the wide variety of approaches that have been utilized for the monitoring of infrastructure and are based on the collection of remote-sensing data, acquired using the global navigation satellite system (GNSS), synthetic aperture radar (SAR), light detection and ranging (LiDAR) and unmanned aerial vehicles (UAV) sensors. Moreover, great emphasis is given to the contribution of the state-of-the-art soft computing methods throughout infrastructure monitoring aiming to increase the automation of the procedure. The statistical analysis of the reviewing publications revealed that SARs and LiDARs are the prevalent remote-sensing sensors used in infrastructure monitoring concepts, while regarding the type of infrastructure, research is orientated onto transportation networks (road and railway) and bridges. Added to this, deep learning-, fuzzy logic- and expert-based approaches have gained ground in the field of infrastructure monitoring over the past few years.

1. Introduction

The main objective of the current work is to provide valuable insights into the state-of-the-art infrastructure monitoring approaches. The acquired knowledge will be used for the comprehensive monitoring of critical infrastructure, falling under the “PROION” project. In this framework, the “Introduction” section is divided into three subsections, “1.1 General overview”, “1.2 Related works” and “1.3 PROION project and scope of the review”. Specifically, Section 1.1 underlines the need to develop effective infrastructure-monitoring methodologies and points out the integration of remote sensing over the years into such concepts. A brief description of previous review works is presented in Section 1.2, while Section 1.3 provides details concerning the “PROION” project and the aim of the current research. More information about advanced features or improvements of remote-sensing technologies or soft computing methods is listed in the respective chapters of sections “2. Infrastructure monitoring using remote-sensing data and techniques” and “3. Contribution of soft computing in infrastructure monitoring”.

1.1. General Overview

The need for the development of reliable cost-effective systems for monitoring engineering infrastructure is increasing, especially considering the effects of ageing and the impact of natural hazards. Despite these typical threats, infrastructure is additionally affected by a growing risk which is associated with the rising temperatures and frequent weather extremes (droughts, floods, etc.) [1,2,3,4]. Currently, more than 40% of the world’s population lives in areas that are exceptionally vulnerable to climate change hazards and infrastructure risks [5]. Therefore, the scientific community should provide reliable, cost-effective and globally applied infrastructure-monitoring solutions to decision makers and stakeholders in order to ensure resilience and mitigate risk.
The first documented attempt to utilize remote-sensing technology for infrastructure damage assessment was traced in 1906 after a devastating earthquake that shook the city of San Francisco [6]. Since then, the remarkable advances in sensor and communication technologies have created opportunities to obtain observable data at an unexpected rate and quantity.
A rapid increase in publications, associated with remote-sensing data for infrastructure monitoring, has been noticed in the last decade (2012–2022). This rising trend of utilizing remote-sensing data, obtained by GNSS, SAR, LiDAR and UAV sensors is displayed in Figure 1. Moreover, it is evident that after 2016, UAV and SAR sensors have recorded the dominant remote-sensing data used in infrastructure investigations, which is probably related to the fact that both are affordable and easy to apply. The search was based on the keywords on the Scopus database, which appear in the legend of the diagram, and just the first four months of 2022 were considered.
Although nearly every type of spaceborne or airborne imagery has already been utilized to detect damages to infrastructure for more than a century [7,8], it remains an active topic of research.

1.2. Related Works

In the light of developing novel methods and approaches towards a more efficient and detailed monitoring of infrastructure, several studies have been conducted up till now. In this framework, multiple review papers have already been published concerning the state-of-the-art remote-sensing approaches for the monitoring of various types of infrastructure (Table 1).
Specifically, GNSS data, as well as advanced differential interferometric techniques, have been widely used for the monitoring and analysis of ground deformation in dams during the last decades, providing reliable measurements of the surface horizontal and/or vertical displacements either at specific location or in the entire infrastructure [9]. As GNSS technology has evolved, new GNSS-based dynamic monitoring approaches have been developed. These approaches, consisting of real-time kinematics (RTK), instantaneous displacement measurements and precise point positioning (PPP), have been described in detail and applied in numerous cases for the monitoring of the structural health in the distinct components of bridges [10]. Moreover, various researchers, working in bridge engineering, have utilized TLS sensors to create a 3D structural model, evaluate the structural quality and model the bridge behavior during the different phases of construction, operation, and maintenance [11]. Laser scanning technology has also contributed to the effective monitoring of road and rail infrastructure, while the integration of artificial intelligence methods has improved the automation of the procedure [12]. The design and execution of terrestrial laser scanning surveys for infrastructure monitoring purposes, as well as the proper handling of processing issues during the steps of registration and georeferencing, have been analyzed in several studies [13]. In recent years, the utilization of UAVs in infrastructure monitoring has gained significant momentum, mainly due to the ability to access remote and inaccessible areas and the cost/time efficiency. Therefore, there are more than a hundred published studies in which the monitoring and assessment of the structural conditions of infrastructure are based on the collection of UAV data [14,15]. These studies provided useful information on the appropriate collection and processing of UAV imagery and the various factors that affect the execution of UAV flights, as well as the strengths and limitations of UAV performance in infrastructure monitoring. In the field of transportation, UAVs have been utilized in a variety of applications including road safety and highway infrastructure management [16].
The rapid advances in soft computing have been a step forward in the direction of infrastructure monitoring. Specifically, the more sophisticated infrastructure monitoring approaches are based on the exploitation of UAV imagery along with machine learning algorithms to generate strategies and processing pipelines for structural building damage mapping and assessment [17]. In this framework, deep-learning applications are growing exponentially in the field of structural health monitoring, including structural recognition, change detection, crack detection, damage identification, damage quantification, etc. [18,19].
Table 1. Previous review studies concerning the application of remote-sensing sensors and soft computing methods in infrastructure monitoring.
ReferenceYearScopeData/MethodNumber of Papers ReviewedCovered Period
[13]2017change detection and deformation monitoring of structuresLiDAR951992–2017
[9]2018dam deformation monitoringGNSS, SAR1541977–2018
[17]2019automated structural damage detectionUAV, soft computing972004–2019
[10]2019structural health monitoringGNSS1701995–2019
[12]2019transportation monitoring (road and railway)LiDAR1731998–2019
[14]2019structural health monitoringUAV1411996–2019
[19]2019structural health monitoringDeep learning1701992–2019
[18]2020structural health monitoring and damage detectionUAV, Deep learning2351997–2020
[16]2020road safety and highway infrastructure management.UAV1032000–2020
[11]2020bridge structural assessment and managementLiDAR2222000–2020
[15]2021bridge condition assessmentUAV962015–2021

1.3. PROION Project and Scope of the Review

The main objective of the study is to carry out a brief literature review on innovative infrastructure monitoring methodologies in order to identify the best practices and processing methodologies for the comprehensive monitoring of critical national infrastructure falling under the research project named “PROION”.
The purpose of the project is to develop a platform for the continuous monitoring of high priority infrastructure located in an extremely active area in terms of tectonics and seismicity. Monitoring is based on the combination of instrumental and remote-sensing measurements along with fuzzy logic networks methods and machine learning algorithms (Figure 2). In more detail, measurements obtained by three-axis accelerometers, GNSS receivers and persistent scatterer interferometry will be imported into the platform, in which they will be validated using high-precision reference representations derived from TLS surveys and UAV campaigns. Afterwards, soft computing methods will contribute to decision-making. The detection, quantification, and localization of damage to civil infrastructure using the proposed framework can directly be used in the prognosis of the structure’s ability to withstand service loads and/or their future satisfactory and safe operation. “PROION” project is financially supported by the European Union and the Hellenic government. The overall architecture of the “PROION” project is depicted in Figure 2. It should be noted that the European Commission (EC) has funded corresponding initiatives to support the research and development of new decision-making systems and tools. The projects tCat, AutoScan and NeTIRail-INFRA are some indicative EC-funded projects for the evaluation and monitoring of transportation infrastructure [20,21,22].
In this context, the current study conducts a comprehensive review on the state-of-the-art remote-sensing approaches and soft computing methods for the monitoring of multiple types of infrastructure, i.e., roads and railways, dams, bridges, archeological sites, and buildings. More than a hundred research publications were collected and analyzed, covering all the recent infrastructure-monitoring applications which were implemented over the last decade (2012–2022). Remote-sensing data were obtained by GNSS, SAR, LiDAR and UAV sensors, while the analysis of soft computing methods revolved around the following terms: statistical analysis and machine learning, deep learning and neural networks, fuzzy logic and fuzzy inference system.
The combined use of various remote-sensing sensors overcomes the limitations of individually using each technique. In particular, permanent GNSS stations provide very accurate and continuous measurements; however, the method lacks spatial coverage. This shortcoming can be addressed through the use of SAR approaches. SAR measurements have the advantage of large coverage, but the analysis is performed on a limited temporal resolution. For instance, Sentinel-1 mission has a 12-day revisit time. On the contrary, UAVs and LIDAR can provide robust and dense 3D information on a user-based repeatability. Hence, the synergy of the above-mentioned techniques as described in the PROION project constitutes an ideal monitoring approach that minimizes the limitations of the individual remote-sensing methods and integrates the benefits.
In the following section, the remote-sensing methodologies, based on the utilization of GNSS, SAR, LiDAR and UAV sensors for infrastructure monitoring are described, while in Section 3 the state-of-art soft computing algorithms are analyzed in detail. An in-depth discussion, accompanied by a quantitative analysis of the reviewing papers as well as future insights are presented in Section 4. Finally, the main points of the review are summarized in Section 5.

2. Infrastructure Monitoring Using Remote-Sensing Data and Techniques

2.1. GNSS

The Global Positioning System (GPS) constitutes the first satellite-positioning system, which was developed by the US Department of Defense in 1973. In 1993, the system became operational, while in 2000, GPS’s data was fully publicly available. Since then, other satellite positioning systems have been launched, such as GLONASS, BEIDOU, GALILEO, etc. The term GNSS encompasses all measurements of these compatible systems, providing to users dense time-series of precise positions for long intervals.
The first attempts to monitor infrastructure using GNSS are traced back to 1988 and 1995, through the collection of high-precision geodetic measurements over dams [23,24]. The approaches provided continuous measurements of displacement over time, contributing to the analysis of the dam deformation with accuracy of approximately 0.5 cm. After these first successful attempts, several researchers dealt with GNSS-based dam monitoring and various processing methodologies were developed towards the automation of the monitoring procedure and the improvement of the achieved accuracy at millimeter-scale [9,25,26,27,28]. In particular, a continuous GNSS monitoring system was proposed for the monitoring of dam deformation and the subsequent investigation of the role of the water level within the reservoir. The system was based on the creation of a permanent GNSS network, which contributed to an excellent performance (millimetric-scale) monitoring of the different parts of the dam in order to obtain useful information for dam deformation that cannot be retrieved through conventional GNSS methods [29]. In a retrospective study, dam horizontal displacements were determined using terrestrial measurements and GNSS-based techniques, taking into account 25 reference stations that were established outside of the dam’s deformation zone [30]. On the other hand, real-time kinematic (RTK) GNSS sensors have also been utilized for high-precision deformation monitoring [26,31,32]. In other studies, displacements, resulting from GNSS processing, were analyzed and compared with pendulum data with sub-millimeter standard deviation, however the integrated data should be in the same reference system [
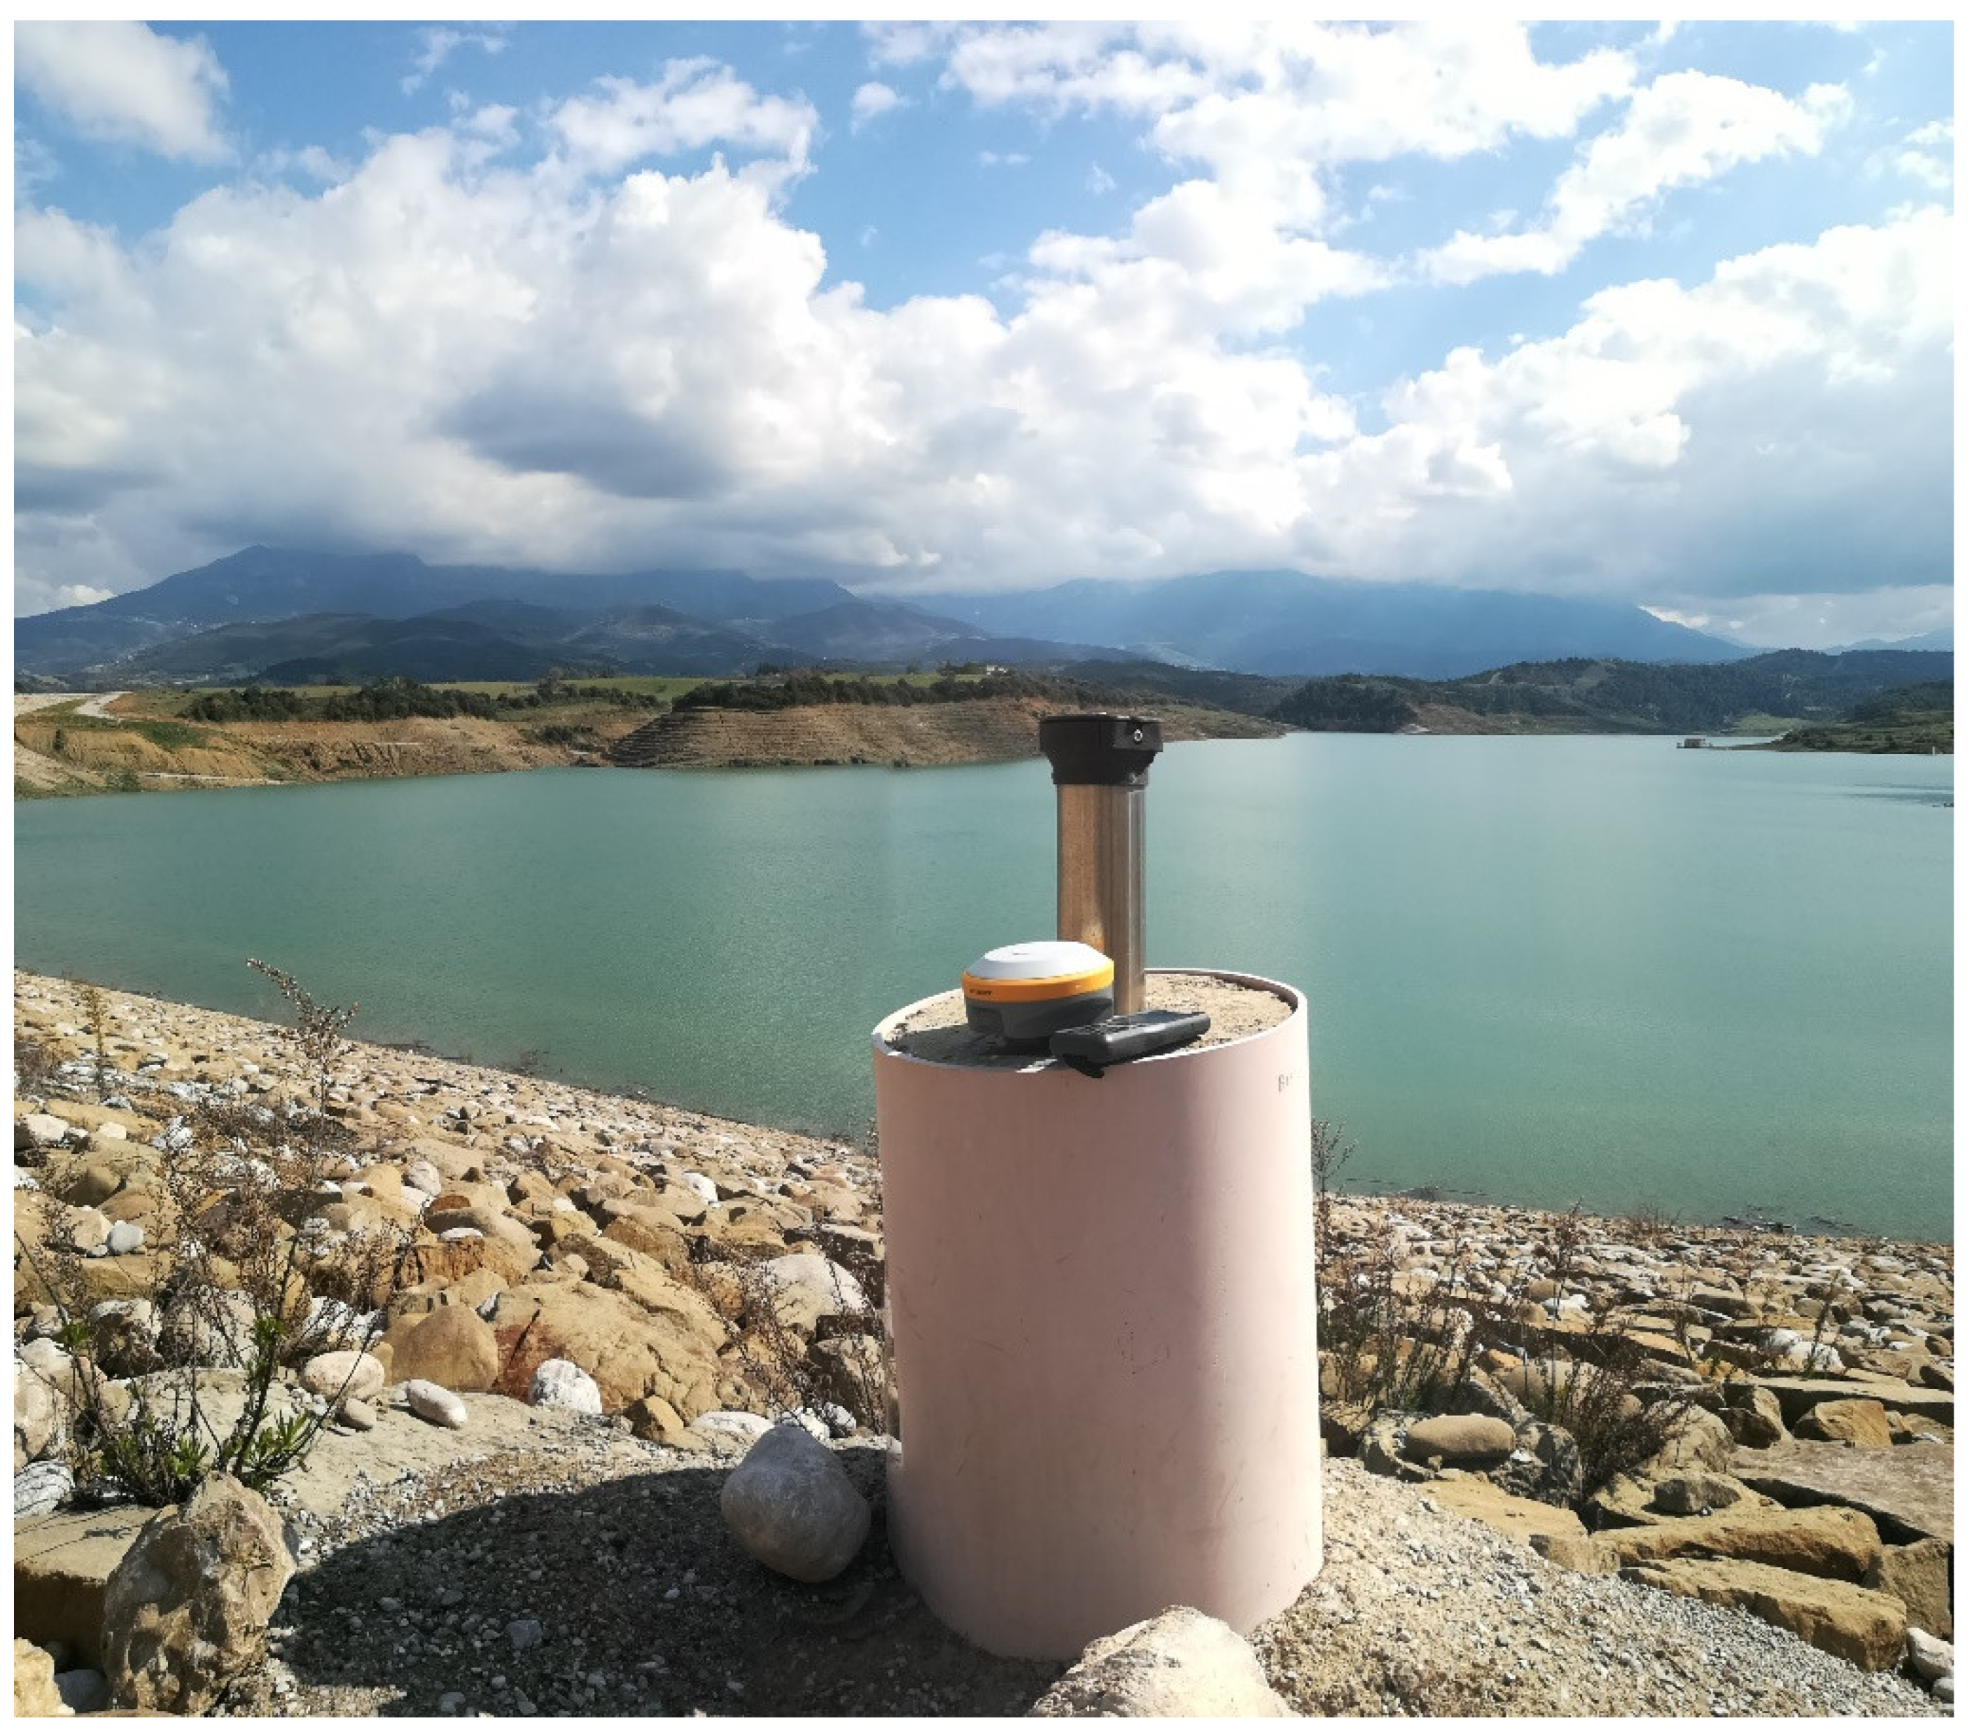
33]. A typical dam-monitoring survey using GNSS receiver is displayed in Figure 3.
Moreover, GNSS sensors are widely used in the monitoring and maintenance of bridges. In fact, the first bridge-monitoring campaign was performed in 1996, with remarkable results, through the installation of 1 Hz GPS RTK receivers onto the Humber Bridge parapet, while various surveys on other bridges were subsequently conducted, utilizing either carrier phase/pseudorange GPS receivers or GNSS receivers [34,35,36]. However, RTK technique is still facing many shortcomings such as the non-guaranteed quality of base station observation, the correct placement of the reference station in a stable location, etc. These shortcomings can be overcome by utilizing RTK network technology, which is a real-time, high-precision positioning approach, based on carrier phase. Network-based RTK uses a regional, more reliable network error correction model, derived from the processing of data from continuous operation reference stations. In this way, dynamic bridge displacements are provided with adequate efficiency and lower operating costs [37,38]. Another, GNSS-based monitoring technology is precise point position (PPP), which performs accurate positioning using a single receiver and without the need of a reference station [39]. PPP was focused on the estimation of fixed position; however, it has been a research hotspot in recent years with several published studies concerning displacement monitoring [40,41].
At the same time, other researchers examined the exploitation of a fully low-cost monitoring system, both in terms of hardware and software. Thus, several combinations of GNSS receivers and antennas as well as various sets of processing parameters were evaluated, while data processing was executed in open source and commercial software, taking into account different experimental bridge monitoring scenarios [42,43,44,45]. Moreover, many studies have focused on eliminating GPS measurement errors through the application of common non-linear methods during GPS positioning adjustment such as nonlinear adaptive-recursive least square, extended Kalman filter or wavelet principal component analysis [45,46]. The wavelet principal component method proved to be the most satisfactory solution for the improvement of the quality of high-frequency GPS time series observations [46].
As the automation of the infrastructure-monitoring procedure evolves and the need to record and predict any potential deformation grows, soft computing algorithms and soft computing techniques are constantly gaining momentum. Therefore, artificial neural networks and adaptive neuro-fuzzy inference systems have been successfully used as further processing steps in GNSS observations for displacement prediction and risk assessment [47,48].
Finally, it is worth mentioning that an integrated methodology, consisting of GNSS measurements and other types of remote-sensing data, has been proposed and sufficiently implemented for evaluation of the deformation on buildings, located in the Italian pre-Alps [49].

2.2. SAR

Infrastructure monitoring using SAR imagery constitutes a common practice that goes beyond the growing monitoring requirements (large-scale monitoring, regular deformation measurements, cost efficiency, etc.). In this context, SAR data and interferometric techniques are able to estimate the deformation of multiple parts of a given infrastructure with sub-centimeter accuracy.
In more detail, conventional dam-monitoring methodologies are time consuming, usually expensive, and high-demanding. On the other hand, SAR Interferometry (InSAR) is able to provide accurate and dense deformation measurements even in slow-moving areas. The first dam deformation studies were based on the utilization of ERS-1/2 and ENVISAT imagery. In particular, almost two hundred interferograms were generated from the processing of the aforementioned data through the Small BAseline Subset (SBAS) InSAR technique, aiming at analyzing the deformation behavior of the Genzano di Lucania Dam in Italy [50]. In retrospective studies, long-term time series of ERS-1/2 and ENVISAT data were supplemented by imagery obtained by either TerraSAR-X or Sentinel-1 mission in order to analyze and understand the deformation process and dam’s behavior mechanisms [51,52]. In fact, the launch of the Sentinel-1 mission breathed new life into dam-deformation monitoring by providing denser time-series of freely available observations. Therefore, a rapid growth in publications concerning the monitoring of dam stability and dam maintenance using Sentinel-1 imagery has been observed in recent years [53,54,55,56]. InSAR deformation measurements derived from Sentinel-1 data have proven to be consistent with the in-situ measurements with RMSE at about 2 mm/year [57]. In addition, high-resolution SAR data (COSMO-SkyMed, TerraSAR-X/TanDEM-X) have been effectively utilized for dam monitoring, aiming at achieving better results due to the higher resolution of the missions [58,59]. SAR imagery, processing techniques and software that were utilized in the aforementioned studies are displayed in Table 2.
Moreover, large-scale surface deformation measurements derived using radar data and interferometric techniques—especially persistent scatterer interferometry (PSI)—have been widely used for the detection of damage to bridges in order to mitigate the risk and plan properly their future maintenance. Specifically, 61 COSMO-SkyMed images were submitted to PSI processing to identify damage in a bridge from 2011 to 2017, and damage causes were then analyzed [60]. Corresponding high-resolution radar data, obtained by X-band missions (COSMO-SkyMed, TerraSAR-X) have been utilized either solely or in combination with C-band radar images for the assessment of the stability and consequent structural health of bridges [61,62,63]. Recently, bridge-monitoring studies have been based on the acquisition of Sentinel-1 data due to their short revisit time, which allows the provision of almost real-time deformation measurements (vertical and horizontal) along the construction [64,65]. In this framework, the high-temporal resolution Sentinel-1 imagery is combined with archived ERS/ENVISAT data and high-spatial resolution COSMO-SkyMed images for the long-term monitoring (more than twenty years) of the displacement patterns and the investigation of viaduct stability [66]. Despite the differences in the spatial resolution of the datasets, the evaluation and analysis of the derived displacements demonstrated a spatio-temporal consistency of the patterns, which was compared with in-situ measurements. Additionally, other researchers have tried to improve the accuracy of the results of the interferometric procedure by applying various approaches such as: (a) the use of the long–short baseline iteration method along with the LLL lattice reduction algorithm for the reduction of ambiguities during phase unwrapping [67], or (b) the utilization of seasonal variation models for the post-analysis of PSI displacements [68]. Some indicative bridge-monitoring studies, based on SAR imagery and interferometric techniques, are presented in Table 3. At the same time, pioneering works has been carried out on how to tackle thermal dilation phenomena in order to derive higher-quality deformation velocity maps. In this context, high-resolution SAR data, obtained by X-band sensors have been exploited to isolate the thermal expansion parameter occurred over viaduct from the observed deformation pattern [69,70]. While similar approaches have been adopted for the analysis of the static structure of bridges and the estimation of high-precision topography [71,72].
Ensuring the safety of large-scale transportation infrastructure, such as road network and railways, constitutes a critical issue for the public and an important area of research for many scientists. In particular, high-resolution SAR data, acquired by TerraSAR-X or COSMOS-skymed mission have effectively applied in the analysis of the long-term deformation of large-scale linear infrastructure, consisting of highways and railways [73,74,75,76,77]. Furthermore, a method for the quantification and characterization of the seasonal surface deformation of highways was proposed [78]. The method was based on the estimation of the surface deformation and the subsequently calculation of seasonal indices (i.e., deformation concentration degree, deformation concentration period). In other studies, surface deformation of transportation infrastructure, derived by C-band SAR data, was correlated with the local soil characteristics and geological setting in order to obtain a more comprehensive understanding of the risk [79,80,81]. Moreover, it has been demonstrated that the synergistic use of PSI and LiDAR measurements contributes to the optimization of the deformation monitoring procedure as well as the improvement of the quality of the 3D geolocation of the permanent scatterers [72,73,74,75,76,77,78,79,80,81,82,83,84]. Recently, more sophisticated transportation infrastructure monitoring approaches have been developed to: (a) fully automate the detection of displacements and/or potential warnings over large-scale transport networks and (b) create effective decision-making tools [85,86]. These approaches combined interferometric deformation measurements with GIS method and/or machine learning algorithms (i.e., regression tree, support vector machine, boosted regression trees, random forest). An overview of SAR data, processing techniques and software, which are utilized in some indicative transportation infrastructure monitoring studies, is presented in Table 4.
It is worth mentioning that SAR imagery and interferometric techniques have also been used for the monitoring of the deformation of buildings [87,88]. In this context, various processing methodologies were examined, including stable point network approach, interferometric point target analysis, hierarchical clustering methods [89,90,91].

2.3. LiDAR

The latest advances in sensor technology and data-processing capabilities have highlighted LiDAR as a promising technique for high-precision three-dimensional mapping with a wide range of applications. The use of LiDAR technology for infrastructure management and maintenance purposes has grown significantly over the last decade, due to the ability to collect dense 3D representations of the investigated objective, at high speed and low cost. Thus, several studies have already been published, dealing with the exploitation of LiDAR data for infrastructure applications [11,12,13].
In particular, terrestrial laser scanning (TLS) data have been effectively utilized to create 3D bridge reconstruction models [92,93]. In fact, methodologies have been proposed concerning the evaluation of the generated point clouds in terms of quality and geometric accuracy in order to produce higher quality 3D bridge models [93]. In retrospective studies, TLS imagery were used along with other multi-source data (i.e., data obtained by mobile mapping systems, photogrammetric data) or semi-automated algorithm-based approaches to create detailed informative models of the efficient building information modeling (BIM) and structural health monitoring (SHM) [94,95]. Furthermore, the specific type of remote-sensing data has proven its high potential in the detection and evaluation of cracks in concrete bridges [60,96]. On the other hand, other researchers have attempted to measure the vertical seasonal displacements of steel bridges using TLS data and a strictly defined processing methodology [97]. In more detail, the approach is based on the differentiation of high-resolution TLS point clouds as well as the high-pression georeferencing of a defined control network. Lately, innovative methodologies, formulated on deep learning algorithms or octree algorithms have been effectively utilized for the robust and automated recognition of bridge components as well as the creation of a shape information model and the subsequent monitoring of shape deformation [98,99]. At the same time, data acquired by LiDAR sensors, combined with 4D design models, were used for the successful and rapid identification of workflow discrepancies during an on-going construction of a bridge [100].
Moreover, numerous studies have demonstrated that laser-scanning technology is capable of detection millimetric-scale deformation within monitoring and management projects of road and rail transportation networks [12,13]. In this framework, mobile laser scanners have been efficiently used in the extraction of road edges and the detection of road curbs, contributing to the assessment of the risk safety along roads as well as the maintenance of the transportation networks [101,102,103]. In fact, the processing of corresponding data provided useful information on roadways, which are located in a complex environment, and they are characterized by heterogeneity and lack of a raised curb [104]. In addition, LiDAR data have been correlated with roughness descriptors for the automated segmentation and classification of asphalt and stone pavements [105]. Other studies focused on improving the processing quality or the achievable accuracy of the derived point clouds. Specifically, methodologies both for the alignment of the lanes of highways as well as the correction of navigation accuracy and point cloud quality, based on the extraction of feature information, were proposed [106,107]. Regarding railway industry, TLS data managed to collect significant amount of surface information in a short time, while monitoring the progress of the renovation of a railway structure [108]. Meanwhile, methods have been developed for the identification of railway assets (rail tracks, contact cables, catenary cables, etc.) on point clouds, derived from LiDAR sensors [109]. The approach showed average recognition accuracy greater than 95%.
Although there are not enough studies due to the great dependence on conventional monitoring practices, LiDAR sensors have been utilized to monitor the deformation of multi-type dams (earth-rock, concrete-faced rockfill), allowing the determination of displacements in both horizontal and vertical directions [110,111,112]. In particular, the exploitation of TLS data is sufficiently accurate for the inventory of a dam under construction and the deformation analysis on the upstream face, which is independent of the position uncertainties of the scanner due to the high precision of alignment of the repetitive point clouds [113]. Equally few are the studies dealing with the use of laser scanning technology for the assessment of structural deformation in archaeological sites [114,115]. Specifically, the processing of TLS data obtained over archaeological monuments allowed the identification of displacements and the evaluation of the mechanisms of instability, providing an immediate warning of possible failures and a useful tool to support preservation activities [114]. A list of studies associated with the use of LiDAR data for different infrastructure monitoring purposes is displayed in Table 5.

2.4. UAV

The demand for health assessment and the monitoring of infrastructure—consisting of bridges, road and railway networks, dams, etc.—is constantly growing over time. The conventional monitoring techniques have serious disadvantages such as such as inadequate evaluation, poor accessibility and high cost. Novel remote-sensing methodologies overcome these limitations and allow the extraction of robust and operational information on infrastructure management. Thus, several studies have adopted UAVs for multiple infrastructure monitoring purposes [14,15,16,17,18]. Some indicative studies dealing with the use of UAVs for infrastructure-monitoring applications are listed in Table 6.
In more detail, the first attempts focused on the creation of three-dimensional reconstruction models of bridges through the processing of the obtained UAV imagery using structure from motion (SfM) algorithm [93,116]. In other studies, UAV data were used either in combination with measurements obtained by other remote-sensing sensors or in conjunction with the 3D digital image correlation methods in order to monitor and assess the structural health of bridges [48,
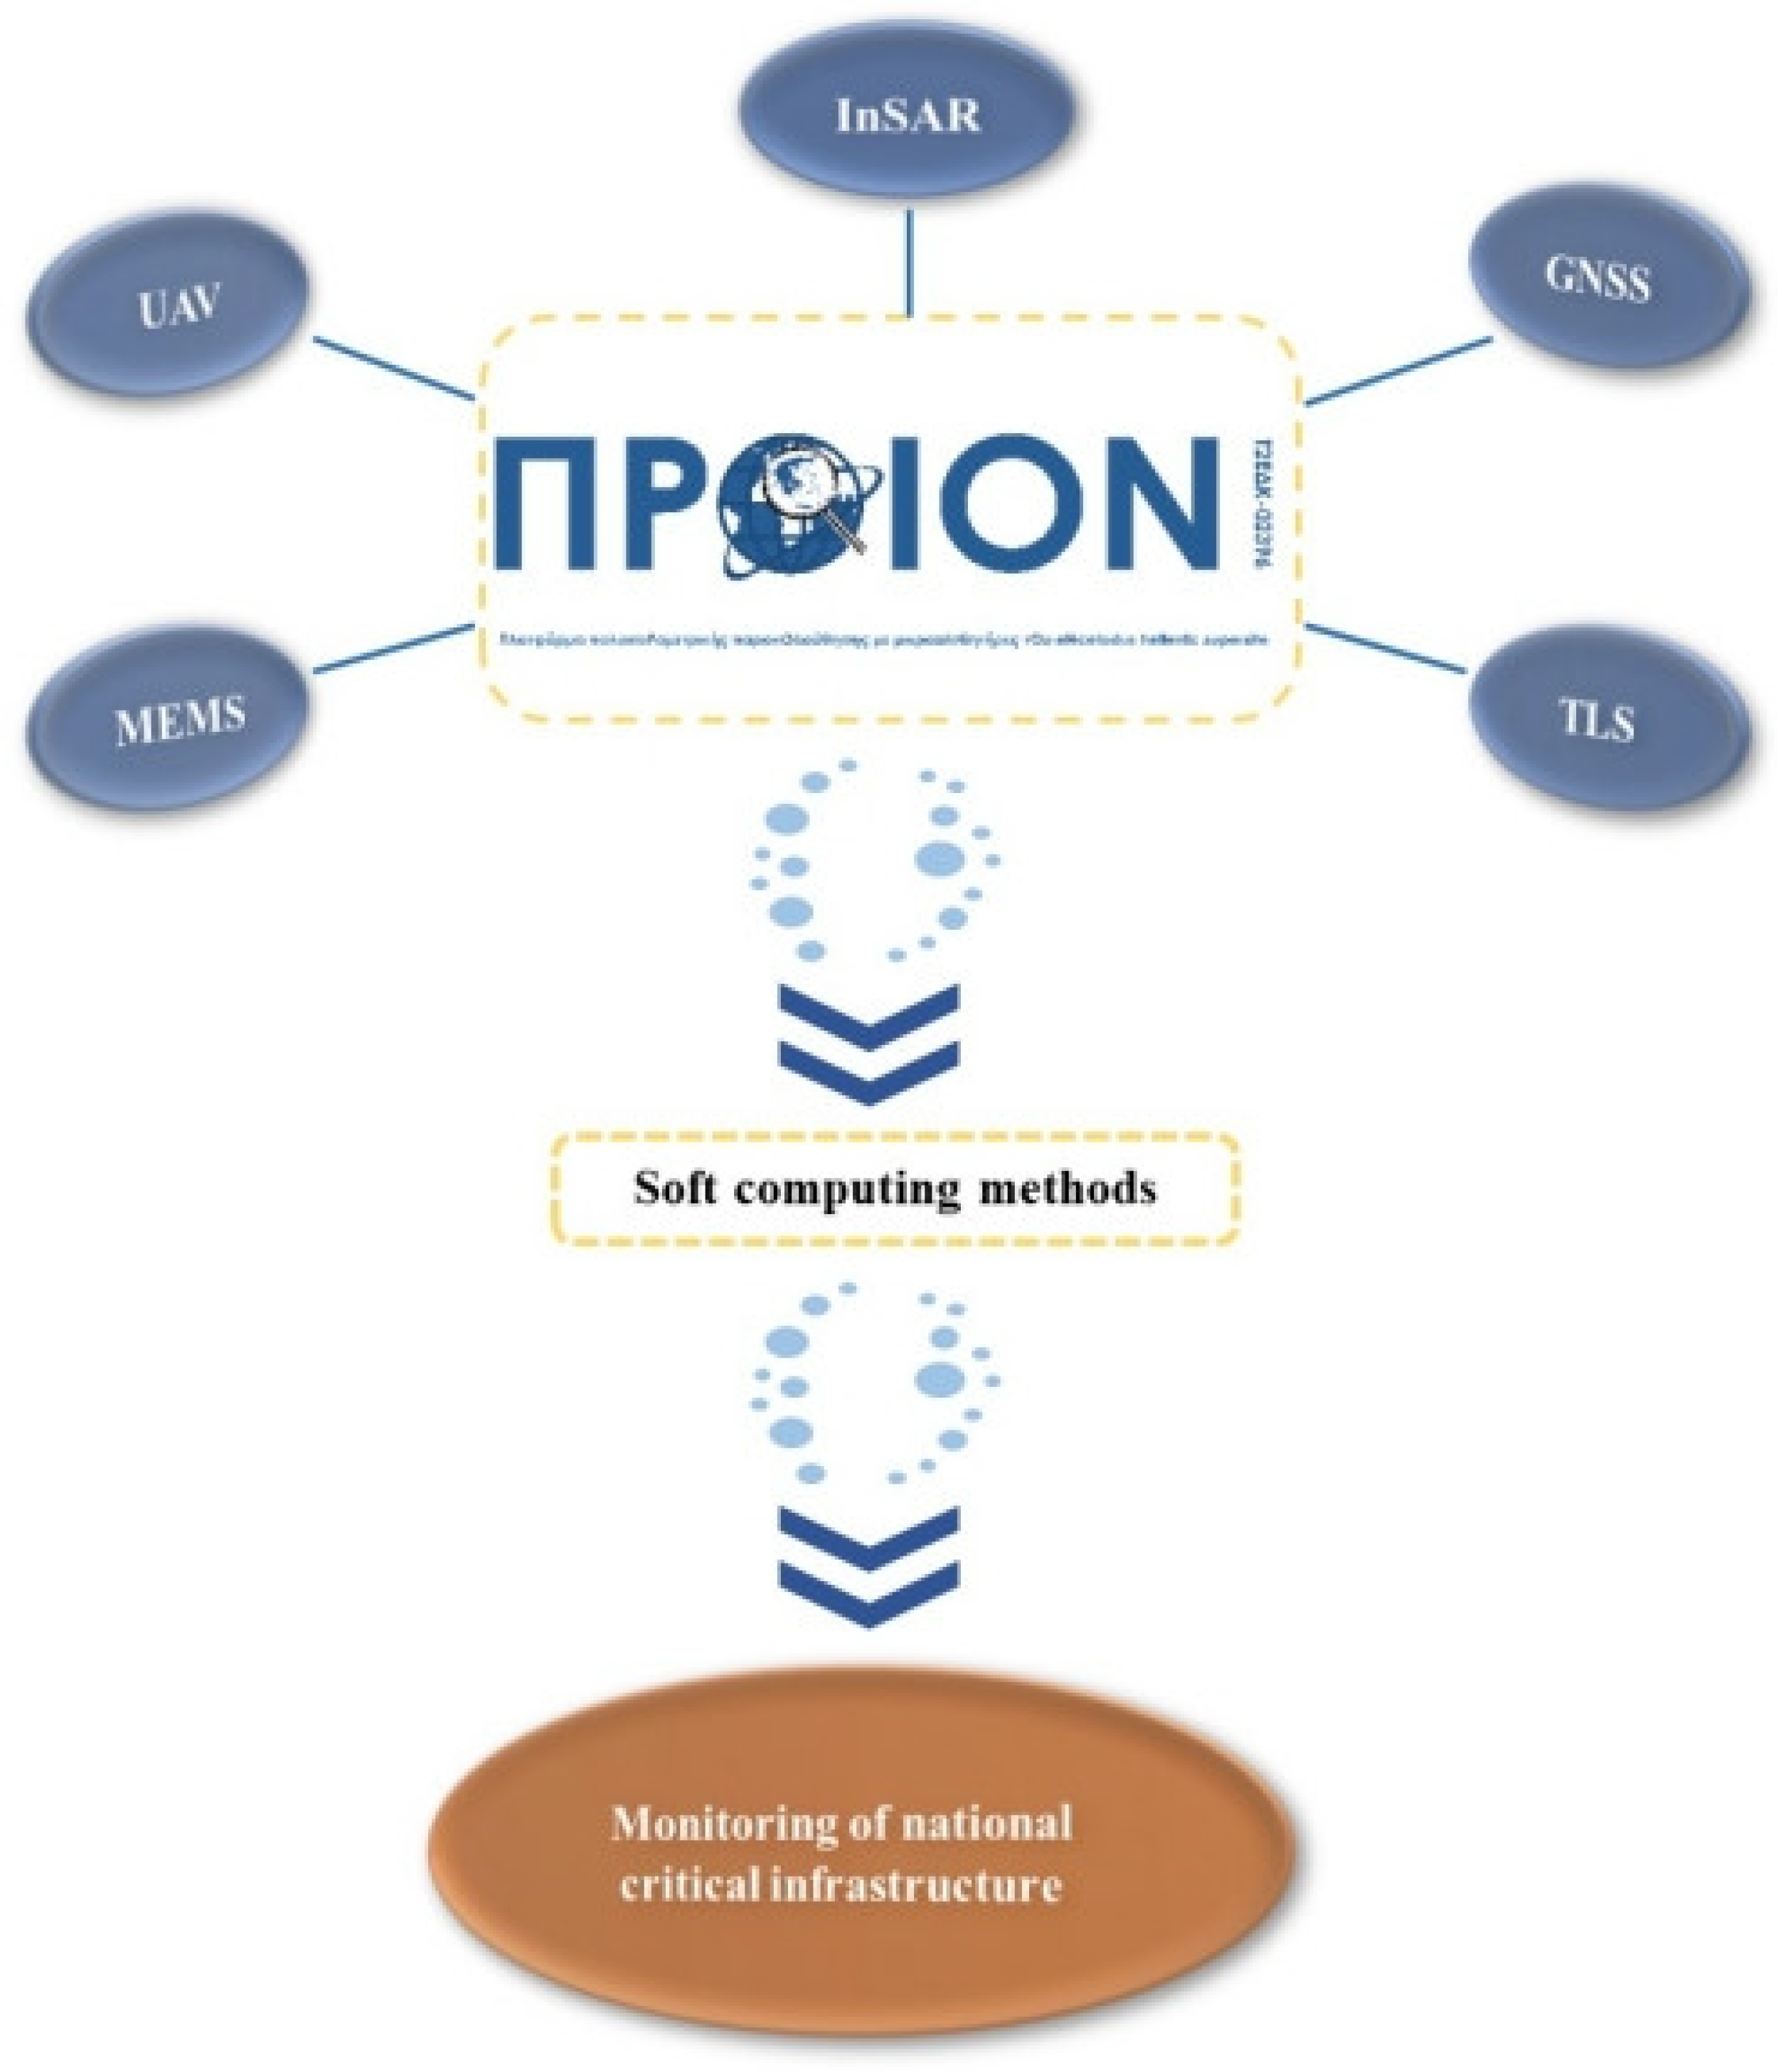
117]. In fact, the methodology proposed by [48] is quite similar to that of the “PROION” project. However, the main difference between them is that the current work (i.e., “PROION”) utilizes diverse remote-sensing data (UAV, TLS, SAR, GNSS) for the monitoring of different types of infrastructure, while the previous one is more orientated to the assessment of the structural behavior of bridges. Added to this, there are some dissimilarities regarding the in situ instrumentation.
Furthermore, UAV imagery along with object-based image analysis (OBIA) have been effectively utilized for the identification and quantification (width, length, extension) of deteriorated areas in concrete bridges, contributing to the monitoring of deterioration’s evolution and the appropriate execution of maintenance measures [118]. Meanwhile, numerous different UAVs, along with a variety of soft computing algorithms, have been proposed for the efficient crack detection and damage quantification and assessment [119,120,121,122].
Moreover, UAVs are able to generate detailed 3D reconstruction models of road surface, to determine successful the road conditions as well as to assess immediately the road degradation [123,124,125]. Innovative soft computing algorithms and soft computing have been applied to UAV imagery to effectively predict road cracks and understand the current damage status of transportation networks [126,127]. Additionally, UAV photogrammetry has proven to be sufficient to monitor surface changes and operation progress during the construction of expressways [128]. Relevant studies have been carried out for the evaluation of railway conditions and the monitoring of rail tracks, within the context of infrastructure hazard mitigation [129,130].
Equally important is the contribution of UAV sensors to the mapping and evaluation of structural damage of buildings. Therefore, high-resolution oblique UAV images have been utilized along with the OBIA technique for the identification and assessment of damage to building facades and roofs [131]. Remarkable progress has been made in the last decade in UAV technology, soft computing and image processing, leading to robust and sophisticated infrastructure monitoring solutions. Deep learning algorithms have proven to be particularly capable of detecting cracks and assessing the structural health of buildings in a rapid and high-precision manner within UAV imagery [132,133,134].

3. Contribution of Soft Computing in Infrastructure Monitoring

Condition assessment of civil engineering structures for their safety and remaining lifetime has been investigated in many studies for recent decades. Mostly, they consisted of harnessing of non-structured information and knowledge and know how capitalization in integrated engineering structures. This is achieved by measuring the “dynamic response” by attaching acceleration, displacement sensors and other smart equipment. These “data-information” are further processed to evaluate the presence of damage in these civil structures [135,136]. Ensuring life safety and the need to reduce inspection costs have emerged as the top priorities for practicing engineers and researchers the last few decades. Therefore, the significance of cost-effective SHM to ensure long-term structural integrity and safety levels has been highlighted on many platforms [135,136].
The rapid increase of data science has offered many effective techniques in handling the huge amount of data available, by detecting and extracting patterns, with the aim of grasping the structural condition and characteristics of the long-term deterioration of the target structure after natural disasters [12]. In addition, in these situations, issue of warning information and make decisions regarding inspection, repair and strengthening the damage of civil structures are critical. The data analysis methods based on the current literature are divided into two major categories the quantitative and semi-quantitative ones [137]. The former group includes methods based on the statistical analysis of data. These methods offer the ability to manipulate large sets of data to cluster, classify and overall extract useful results using machine learning, deep learning and all the methods which fall into the scope of artificial intelligence. The latter one includes methods based on fuzzy logic and experts’ knowledge who offer the ability to model less case-specific data and overcome the uncertainty that comes up due to the lack of data [137].

3.1. Statistical Analysis and Machine Learning

Machine learning is a field of understanding and creating ways to leverage data to make predictions or decisions. The algorithms created using machine learning have a wide variety of applications in many fields from medicine to the energy field, to email filtering, speech recognition, soft computing, etc. The field of geology is one of these fields that has benefited significantly from the application of machine-learning techniques. Soilan et al., 2020 [12], have studied the application of such techniques in road and railway infrastructure monitoring. Data collected from LiDAR were analyzed using support vector machines (SVMs), principal component analysis (PCA) and random forests (RFs), which were some of the methods used to perform off-road-surface monitoring by detecting traffic signs, pole-like objects and roadside trees to classify road markings, driving lanes, cracks and manholes. In the same paper, the random sample consensus (RANSAC) algorithm is also presented as a commonly used methodology for railway monitoring, power line detection for energy supply to trains, etc. The RANSAC algorithm has been widely used in detecting cracks in concrete surfaces [122] and bridge inspection [112]. The data collected for road monitoring have been the subject of application of many more techniques including SVMs, RFs, boosted regression trees, and the Bayesian optimization algorithm [86,126]. Structural-damage sensing is a field where SVMs and RFs have been used to identify damage regions and have presented a rather high success rate [17]. Machine learning along with statistical analysis, namely through the application of reduced error pruning trees (REPT,) logistic regression, support vector regression, likelihood frequency ratio, and multivariate statistical approach constituted a very rich core of methods that contributed to the study, analysis, detection and assessment of landslide susceptibility in various parts of the world [137,138,139,140,141].

3.2. Deep Learning and Neural Networks

In cases where we needed to recognize the underlying relationships in a set of data, artificial neural networks (ANNs) emerged to facilitate this endeavor. The basic element of an ANN is the neural cell; this concept has remained the same since it was first proposed in 1943 by McCulloch and Pitts [142]. A simplified presentation of a basic neural network is presented in Figure 4. The neural cell consists of three input and one output element. The input elements multiplied by the weights are summed. A bias is added for modification and an activation function is used to ensure the non-linear nature of the process and produce the final output.
Through the years, ANNs have been widely used by the scientific community and have experienced many changes and adjustments, especially on the part of using learning techniques to adjust their weights to produce more accurate results.
Displacement prediction for suspension highway bridges and landslide susceptibility mapping are two fields that have benefited from the use of ANNs [47,138]. In many cases, more computational complexity is required to extract the desired results. For such cases, deep-learning architectures have emerged; they offer the use of multiple layers in the network, which permits practical application and optimized implementation. Deep neural networks (DNNs), deep reinforcement learning, recurrent neural networks (RNN) and convolutional neural networks (CNN) are some of the forms of deep learning that have been applied to many fields. Ye et al., 2019 [19], have conducted a very informed review in the way various methods of deep learning that have been used for the structural health monitoring of civil infrastructure. Bridges, tunnels, roadways, railways, concrete and steel buildings are some of the infrastructure under investigation where deep learning was applied, mainly CNNs. CNNs are a method that has proven very effective on image recognition, so it is commonly preferred in applications were the analysis of images is required. UAV-assisted rail track inspection [130], building inspection using drones [134], and detection and quantification of cracks on concrete surfaces from UAV videos [122], are only some of these applications.
Despite the very promising results in all the applications and in many others where they have been used, highway crack segmentation [127], landslide susceptibility [137], structural health monitoring [133], and deep learning approaches face some challenges in a theoretical as well as a technical point of view. Their ability to handle large sets of data is the basis of many of their challenges as the quality and quantity of the available data play a very important role in the training process, which in many cases requires a lot of time and can sometimes lead to overfitting [19]. With the aim of reducing the training time, Azimi et al., 2020 [18] and Gopalakrishnan et al. 2018 [132] have used the method of transfer learning. By using a pre-trained network from a similar application, a fine-tuning can be performed to the existing network with a lower computational cost and fewer data samples. Another issue which scholars and engineers try to address is the ability to interpret the results and generalize upon them. [19]. The following methods try to offer an alternative approach to help overcome this problem.

3.3. Fuzzy Logic and Fuzzy Inference Systems

Fuzzy logic is a theory based on the premise that one value can be part of more than one set, when each set has a different membership degree. This theory expressed for the first time from Zadeh in 1965, has since gained a lot of ground in the scientific world and has been applied to many fields, from energy, to medicine, economics etc. Fuzzy logic provides a versatile way to describe a system by using the knowledge of experts and operate under uncertain and vague information without requiring precise figures of the system parameters. What fuzzy logic essentially does is model the knowledge and experience of an experienced user through a set of simple linguistic rules, thus forming a system based on knowledge, which leads to simpler models which are more manageable and closer to human reason. A fuzzy logic-based system has been developed to map landslide susceptibility [143]. The method was considered a useful tool in landslide susceptibility assessment as it has a considerable capacity to model complex and nonlinear systems. Moreover, when combine with other methodologies fuzzy logic can provide useful insights and promising results. In the field of structural health monitoring, specifically for the prediction of displacement of suspension highway bridges, an adaptive neuro fuzzy inference system was integrated and characterized as the optimum model and technique for GNSS observations in these cases, especially when compared to ANNs [47].
In other applications, fuzzy logic is combined with expert-based systems, which are also designed to emulate the decision-making ability of a human expert. As in fuzzy logic, expert-based systems have, in many cases, the experts themselves involved in the design process of the system helping to define the inputs and the interconnections between them. Such a system is the analytical hierarchy process (AHP), which has in many cases been used in landslide susceptibility mapping with very promising results [137,144,145,146]. The Fuzzy–AHP is a method that combines the two methodologies, and when applied in the same field, landslide susceptibility mapping, provides more comprehensive, flexible, and substantial results when the decision criteria as in this case cannot easily be quantified [147,148,149].

4. Research Summary and Future Insights

4.1. Overview

In recent decades, civil engineering structures (bridges, government buildings, school and university buildings, hospitals, highways, dams, nuclear reactors, prisons, stadiums, etc.) have been particularly prone to a significant loss of “functionality” and safe operations due to structural deficiencies that are primarily caused by material deterioration and loadings from earthquakes, strong winds, floods, landslides, debris flows, or ambient vibrations. Indeed, in the United States, on a grade scale of A (excellent condition) to F (unacceptable condition), the overall score was as low as D+ for infrastructure, and C+ for bridges with an estimated $123Bn for retrofitting according to the American Society of Civil Engineers (ASCE) [150]. The report states that 7.5% of bridges rated structurally deficient and mostly below standard, with many elements approaching their end of service life. Furthermore, more than 30% of the approximately 617,000 highway bridges in the US need immediate attention due to deteriorating conditions according to the USA Federal Highway Administration (FHWA), (FHWA 2019) [151].
In this framework, effective infrastructure-monitoring solutions, based on remote-sensing data, have been developed. In fact, historical trends demonstrate that the number of publications using remote-sensing data for the monitoring of different types of infrastructure is constantly increasing (Figure 1), confirming the growing interest of the scientific community for time- and cost- efficient approaches in the specific domain. The current review collected and analyzed the recent publications (2012–2022), in which researchers utilized data obtained by GNSS, SAR, LiDAR and UAV sensors aiming at the monitoring and maintenance of multi-type civil engineering structures, including roads and railways, dams, bridges, archaeological sites and buildings.
The statistical analysis of the reviewing publications was performed using a descriptive statistical analysis method. Descriptive statistics constitute a simple form of statistical analysis, in which numbers describe the properties of a data group. The method contributes to simplifying and summarizing large data sets that can be easily interpreted. In particular, the reviewing data were processed according to frequency and percentage statistics. It was revealed that the widely used remote-sensing sensors applied in infrastructure monitoring concepts are SARs and LiDARs (Figure 5a), while regarding the type of infrastructure, the research is mainly focused on transportation networks (road and railway) and bridges Figure 5b. The sunburst charts of Figure 5 depict the percentage distribution of remote-sensing sensors (Figure 5a) and type of infrastructure application (Figure 5b) within the total number of reviewing publications. In a further analysis, the proportion of publications focusing on a specific civil engineering structure in accordance with a given remote-sensing sensor, was estimated (Figure 6). As it can be observed, the majority of GNSS-based studies is related to the monitoring of dams and bridges (Figure 6a), while SAR sensors cover a larger field of infrastructure types, consisting of transportation networks, dams and bridges (Figure 6b). LiDARs present an equally wide range of structure types such as dams, bridges and transportation networks, but they have also been sufficiently utilized in the monitoring of archaeological sites, mainly due to their remarkable accuracy. (Figure 6c). UAVs have been effectively used in the monitoring and identification of deficiencies in roads and railways, bridges and buildings (Figure 6d).
Meanwhile, the significant technological advantages, as well as the increasing demand of handling the enormous amount of remote-sensing data, brought to the fore more sophisticated processing approaches for the monitoring and assessment of the structural health, which are based on soft computing methods. These methods are divided into two major categories: (a) the quantitative ones, including machine and deep learning, and artificial neural networks, which mainly focus on data manipulation by applying advanced statistical analysis for analysis, classification, etc., [18,19] and (b) the semi-quantitative ones who operate based on expert intelligence and fuzzy logic and apply well in cases with high uncertainty and when it is necessary to combine different sources of data [137]. Publications of both categories, related to infrastructure purposes, were reviewed and analyzed. Figure 7 displays the widely used soft computing methods within the reviewed studies in accordance with the year of publication. In general, it was proven that deep learning/neural networks as well as statistical analysis/machine learning constitute the most popular soft computing approaches for infrastructure projects (Figure 8 and Figure 9).
In more detail, Figure 7, Figure 8 and Figure 9 attempt to contribute to the understanding of how the four different approaches been used in remote-sensing approaches and soft computing for infrastructure monitoring. The four different approaches for the papers that have been reviewed are: (1) expert-Based approach, (2) fuzzy-based, (3) deep learning/neural networks and (4) statistical analysis/machine learning. Figure 7 displays the evolution of the widely used soft computing methods throughout the years. It is interesting that throughout the years while statistical analysis and machine learning constitute a constant in the preferred methodologies, in recent years deep learning, fuzzy logic and expert-based approaches have started to gain a considerable amount of ground in the field of infrastructure monitoring. Figure 8 displays the percentage for each of the four soft-computing methods in relation to the total reviewed papers, providing a better overview on the most-used methodologies. Figure 9 displays the percentage for each of the four soft computing methos in relation to the infrastructure application. Interesting and useful conclusions can be drawn from Figure 7, Figure 8 and Figure 9. At least one or combination of the four approaches have been used in each year (Figure 7). Deep learning/neural networks as well as statistical analysis/machine learning approaches constitute the most popular soft computing methods (red and blue colors) compared to the other two methods (Figure 8). Figure 9 also provides us with some useful information for different infrastructure applications and how our research can contribute by applying soft computer methodologies in infrastructure for which, to our knowledge, few applications exist.

4.2. Selected Case Studies

According to statistical analysis of the reviewing publications, UAV and TLS sensors are widely used for bridge structural monitoring [48,94]. Despite the fact that TLS sensors provide structural models of ultra-high accuracy [94], the survey is time-consuming, especially in large bridges, and the purchase of the equipment may not be affordable. On the contrary, UAVs constitute a more cost-efficient solution, extracting satisfactory results. For instance, UAV data were combined with sensors measuring the physical quantities (environmental parameters, structural responses) as well as neural network algorithms to monitor the structural behavior of Petrace bridge in Italy and establish an early warning system [48].
GNSS surveys and InSAR approaches are among the most common methods for dam monitoring. In this regard, a complementary methodology, consisting of GNSS data and a quasi-persistent scattered interferometric technique, was applied to monitor the triggering factors and the resulting displacements of Castello dam in Sicily [56]. GNSS data were collected on the crest of the dam using a permanent station. The results of both approaches were comparable. It is worth mentioning that it is important to have a large archive of observations and to ensure that GNSS and InSAR measurements are consistent.
SAR-based methodologies are a commonplace for the structural monitoring of road/railway networks, due to the large extent of these types of infrastructure. In fact, some researchers developed a quite promising methodology for the monitoring of Betuwe Freight Corridor in Netherlands, which is based on improving the geolocation of persistent scatterers using laser scanning data [82].

4.3. Future Insights

As already mentioned, the current study was carried out to review and identify the most effective and innovative remote sensing and soft computing techniques for infrastructure monitoring aiming at utilizing the knowledge gained within the objectives of “PROION” project. Therefore, this literature review constitutes our first step in proposing a synergistic approach, consisting of remote-sensing techniques and soft-computing methods to produce an efficient platform of collecting, studying, and analyzing data to achieve the improvement of human wellbeing by offering safer and more secure infrastructure. Such a newly developed platform will provide the global behavioral pattern of the civil structure under investigation through the analysis of local damage indications. Moreover, fuzzy logic and dynamic fuzzy cognitive maps would improve the understanding of the dynamic behavior of the civil structure after a natural disaster [152]. In this framework, future research should focus on combining both the quantitative as well as the semi-qualitative techniques to produce the most efficient way of studying and analyzing data, while fuzzy logic and fuzzy cognitive maps should be further explored.
Meanwhile, time series prediction is always a very challenging subject, especially when combined with remote-sensing data where the amount of data is particularly large. InSAR displacements have a lot of variations, making it difficult to produce a methodology to adjust to them and accurately predict future values. TLS and UAV data create extremely large datasets that require many computing resources to be able to handle all of them and produce useful insights. As soft computing methodologies progress in the field of remote sensing, we believe that new, more agile solutions will emerge. Image recognition and image comparison will play a very important role in infrastructure monitoring. However, purely computational approaches, no matter how accurate they may be, cannot be entirely successful unless they find a way to incorporate human knowledge and expertise. For this reason, we support that hybrid methods that combine human/expert knowledge with the computational power of traditional computing methodologies can offer versatile solutions in the problem of infrastructure monitoring.

5. Conclusions

Many important examples of civil infrastructure, such as hospitals, university and school buildings, bridges, nuclear reactors, government buildings and dams, are affected by climate change. Thus, the ability to immediately assess the structural integrity of this infrastructure after a natural disaster is of paramount importance. In this research paper, an extensive literature review is provided for all types of infrastructure that are subject to structural deficiencies caused by material deterioration due to the passing of time, earthquakes, wind, vehicles, or ambient vibrations. The issue of warning information and make decisions regarding inspection, repair and strengthening is a crucial part of the procedure. Nowadays, infrastructure monitoring and assessment takes place with novel approaches based on remote-sensing data and soft computing methods. In this context, almost 150 publications were review and discussed. Remote-sensing approaches included data acquired by GNSS, SAR, LiDAR and UAV sensors, while the methods of statistical analysis and machine learning, deep learning and neural networks, fuzzy logic and fuzzy inference systems were briefly analyzed.

Author Contributions

Conceptualization, A.K. and K.N.; methodology, A.K.; formal analysis, A.K. and V.M.; writing—original draft preparation, A.K. and V.M.; writing—review and editing, A.K.; P.P.G. and K.N.; project administration, K.N. All authors have read and agreed to the published version of the manuscript.

Funding

This research has been co-financed by the European Regional Development Fund of the European Union and Greek national funds through the Operational Program Competitiveness, Entrepreneurship and Innovation, under the call RESEARCH—CREATE—INNOVATE (project code: T2EΔK-02396 Multiparametric monitoring platform with micro-sensors of eNceladus hellenIc supersite).

Institutional Review Board Statement

Not applicable.

Informed Consent Statement

Not applicable.

Data Availability Statement

All data related to this research is contained within the article.

Conflicts of Interest

The authors declare no conflict of interest.

Abbreviations

GNSSGlobal Navigation Satellite System
SARSynthetic Aperture Radar
LiDARLight Detection And Ranging
UAVUnmanned Aerial Vehicles
RTKReal Time Kinematics
PPPPrecise Point Positioning
ECEuropean Commission
GPSGlobal Positioning System
CORSContinuous Operation Reference Stations
InSARSAR Interferometry
SBASSmall Baseline Subset
RMSERoot Mean Square Error
MT-InSARMulti-temporal InSAR
PSIPersistent Scatterer Interferometry
DInSARDifferential InSAR
TS-InSARTime-series InSAR
TLSTerrestrial Laser Scanner
BIMBuilding Information System
SHMStructural Health Monitoring
SfMStructure from Motion
OBIAObject Based Image Analysis
SVMsSupport Vector Machines
PCAPrincipal Component Analysis
RFsRandom Forests
RANSACRandom Sample Consensus
REPTReduced Error Pruning Trees
ANNsArtificial Neural Networks
DNNsDeep Neural Networks
RNNsRecurrent Neural Networks
CNNConvolutional Neural Networks
AHPAnalytical Hierarchy Process
ASCEAmerican Society of Civil Engineers
FHWAUSA Federal Highway Administration

References

  1. Pecl, G.T.; Araújo, M.B.; Bell, J.D.; Blanchard, J.; Bonebrake, T.C.; Chen, I.C.; Clark, T.D.; Colwell, R.K.; Danielsen, F.; Evengård, B.; et al. Biodiversity redistribution under climate change: Impacts on ecosystems and human well-being. Am. Assoc. Adv. Sci. 2017, 355, 6332. [Google Scholar] [CrossRef] [PubMed]
  2. Hunt, A.; Watkiss, P. Climate change impacts and adaptation in cities: A review of the literature. Clim. Change 2011, 104, 13–49. [Google Scholar] [CrossRef] [Green Version]
  3. World Meteorological Organization. Available online: https://public.wmo.int/en (accessed on 2 May 2022).
  4. Pachauri, R.K.; Allen, M.R.; Barros, V.R.; Broome, J.; Cramer, W.; Christ, R.; Church, J.A.; Clarke, L.; Dahe, Q.; Dasgupta, P.; et al. Climate Change 2014: Synthesis Report; Contribution of Working Groups I, II and III to the Fifth Assessment Report of the Intergovernmental Panel on Climate Change; Pachauri, R., Meyer, L., Eds.; IPCC: Geneva, Switzerland, 2014; 151p.
  5. Climate Change 2022: Impacts, Adaptation and Vulnerability. Available online: https://www.ipcc.ch/report/ar6/wg2/ (accessed on 2 May 2022).
  6. Baker, S. San Francisco in ruins: The 1906 aerial photographs of George R. Lawrence. Landscape 1989, 30, 9–14. [Google Scholar]
  7. Kerle, N. Disasters: Risk assessment, management, and post-disaster studies using remote sensing. In Remote Sensing of Water Resources, Disasters, and Urban Studies (Remote Sensing Handbook); Thenkabail, P.S., Ed.; CRC Press: Boca Raton, FL, USA, 2015; pp. 455–481. [Google Scholar]
  8. Dong, L.G.; Shan, J. A comprehensive review of earthquake-induced building damage detection with remote sensing techniques. ISPRS-J. Photogramm. Remote Sens. 2013, 84, 85–99. [Google Scholar] [CrossRef]
  9. Scaioni, M.; Marsella, M.; Crosetto, M.; Tornatore, V.; Wang, J. Geodetic and remote-sensing sensors for dam deformation monitoring. Sensors 2018, 18, 3682. [Google Scholar] [CrossRef] [Green Version]
  10. Shen, N.; Chen, L.; Liu, J.; Wang, L.; Tao, T.; Wu, D.; Chen, R. A review of Global Navigation Satellite System (GNSS)-based dynamic monitoring technologies for structural health monitoring. Remote Sens. 2019, 11, 1001. [Google Scholar] [CrossRef] [Green Version]
  11. Rashidi, M.; Mohammadi, M.; Kivi, S.S.; Abdolvand, M.M.; Truong-Hong, L.; Samali, B. A decade of modern bridge monitoring using terrestrial laser scanning: Review and future directions. Remote Sens. 2020, 12, 3796. [Google Scholar] [CrossRef]
  12. Soilán, M.; Sánchez-Rodríguez, A.; Del Río-Barral, P.; Perez-Collazo, C.; Arias, P.; Riveiro, B. Review of laser scanning technologies and their applications for road and railway infrastructure monitoring. Infrastructures 2019, 4, 58. [Google Scholar] [CrossRef] [Green Version]
  13. Mukupa, W.; Roberts, G.W.; Hancock, C.M.; Al-Manasir, K. A review of the use of terrestrial laser scanning application for change detection and deformation monitoring of structures. Surv. Rev. 2017, 49, 99–116. [Google Scholar] [CrossRef]
  14. Sony, S.; Laventure, S.; Sadhu, A. A literature review of next-generation smart sensing technology in structural health monitoring. Struct. Control Health Monit. 2019, 26, 62–77. [Google Scholar] [CrossRef]
  15. Feroz, S.; Dabous, S.A. UAV-based remote sensing applications for bridge condition assessment. Remote Sens. 2021, 13, 1809. [Google Scholar] [CrossRef]
  16. Outay, F.; Mengash, H.A.; Adnan, M. Applications of unmanned aerial vehicle (UAV) in road safety, traffic and highway infrastructure management: Recent advances and challenges. Transp. Res. Part A Policy Pract. 2020, 141, 116–129. [Google Scholar] [CrossRef] [PubMed]
  17. Kerle, N.; Nex, F.; Gerke, M.; Duarte, D.; Vetrivel, A. UAV-based structural damage mapping: A review. ISPRS Int. J. Geo-Inf. 2019, 9, 14. [Google Scholar] [CrossRef] [Green Version]
  18. Azimi, M.; Eslamlou, A.D.; Pekcan, G. Data-driven structural health monitoring and damage detection through deep learning: State-ofthe- art review. Sensors 2020, 20, 2778. [Google Scholar] [CrossRef]
  19. Ye, X.W.; Jin, T.; Yun, C.B. A review on deep learning-based structural health monitoring of civil infrastructures. Smart Struct. Syst. 2019, 24, 567–585. [Google Scholar] [CrossRef]
  20. tCat-Disrupting the Rail Maintenance Sector Thanks to the Most Cost-Efficient Solution to Auscultate Railways Overhead Lines Reducing Costs up to 80%. Available online: https://www.fabiodisconzi.com/open-h2020/projects/211356/index.html (accessed on 24 May 2022).
  21. AutoScan. Available online: https://cordis.europa.eu/project/rcn/203338/factsheet/en (accessed on 24 May 2022).
  22. NeTIRail-INFRA. Available online: https://cordis.europa.eu/project/rcn/193387/factsheet/en (accessed on 24 May 2022).
  23. DeLoach, S.R. Continuous Deformation Monitoring with GPS. J. Surv. Eng. 1989, 115, 93–110. [Google Scholar] [CrossRef]
  24. Hudnut, K.W.; Behr, J.A. Continuous GPS Monitoring of Structural Deformation at Pacoima Dam, California. Seismol. Res. Lett. 1998, 69, 299–308. [Google Scholar] [CrossRef]
  25. Kaftan, V.I.; Ustinov, A.V. Use of global navigation satellite systems for monitoring deformations of water-development works. Power Technol. Eng. 2013, 47, 30–37. [Google Scholar] [CrossRef]
  26. Montillet, J.-P.; Szeliga, W.M.; Melbourne, T.I.; Flake, R.M.; Schrock, G. Critical Infrastructure Monitoring with Global Navigation Satellite Systems. J. Surv. Eng. 2016, 142, 04016014. [Google Scholar] [CrossRef] [Green Version]
  27. Xi, R.; Zhou, X.; Jiang, W.; Chen, Q. Simultaneous estimation of dam displacements and reservoir level variation from GPS measurements. Measurements 2018, 122, 247–256. [Google Scholar] [CrossRef]
  28. Xiao, R.; Shi, H.; He, X.; Li, Z.; Jia, D.; Yang, Z. Deformation monitoring of reservoir dams using GNSS: An application to south-to-north water diversion project, China. IEEE Access 2019, 7, 54981–54992. [Google Scholar] [CrossRef]
  29. Dardanelli, G.; La Loggia, G.; Perfetti, N.; Capodici, F.; Puccio, L.; Maltese, A. Monitoring displacements of an earthen dam using GNSS and remote sensing. Proc. SPIE 2014, 9239, 923928. [Google Scholar] [CrossRef]
  30. Yavaşoğlu, H.H.; Kalkan, Y.; Tiryakioğlu Yigit, C.O.; Özbey, V.; Alkan, M.N.; Bilgi, S.; Alkan, R.M. Monitoring the deformation and strain analysis on the Ataturk Dam, Turkey. Geomat. Nat. Hazards Risk 2017, 9, 94–107. [Google Scholar] [CrossRef] [Green Version]
  31. Cifres, R.; Cooksley, G. Satellite Technologies for Dam Motion Monitoring. In Proceedings of the 3rd Joint International Symposium on Deformation Monitoring (JISDM), Vienna, Austria, 30 March–1 April 2016; p. 8. [Google Scholar]
  32. Galan-Martin, D.; Marchamalo-Sacristan, M.; Martinez-Marin, R.; Sanchez-Sobrino, J.A. Geomatics applied to dam safety DGPS real time monitoring. Int. J. Civ. Eng. 2013, 11, 134–141. [Google Scholar]
  33. Barzaghi, R.; Cazzaniga, N.E.; De Gaetani, C.I.; Pinto, L.; Tornatore, V. Estimating and comparing dam deformation using classical and GNSS techniques. Sensors 2018, 18, 756. [Google Scholar] [CrossRef] [PubMed] [Green Version]
  34. Roberts, G.W.; Brown, C.J.; Tang, X.; Meng, X.; Ogundipe, O. A tale of five bridges; The use of GNSS for monitoring the deflections of bridges. J. Appl. Geod. 2014, 8, 241–263. [Google Scholar] [CrossRef]
  35. Ashkenazi, V.; Roberts, G.W. Experimental monitoring of the Humber bridge using GPS. In Proceedings of the Institution of Civil Engineers—Civil Engineering; Thomas Telford Ltd.: London, UK, 2015; Volume 120, pp. 177–182. [Google Scholar] [CrossRef]
  36. Chen, Q.; Jiang, W.; Meng, X.; Jiang, P.; Wang, K.; Xie, Y.; Ye, J. Vertical deformation monitoring of the suspension bridge tower using GNSS: A case study of the Forth Road Bridge in the UK. Remote Sens. 2018, 10, 364. [Google Scholar] [CrossRef] [Green Version]
  37. Pepe, M. CORS architecture and evaluation of positioning by low-cost GNSS receiver. Geod. Cartogr. 2018, 44, 36–44. [Google Scholar] [CrossRef] [Green Version]
  38. Yu, J.; Yan, B.; Meng, X.; Shao, X.; Ye, H. Measurement of Bridge Dynamic Responses Using Network-Based Real-Time Kinematic GNSS Technique. J. Surv. Eng. 2016, 142, 04015013. [Google Scholar] [CrossRef]
  39. Bisnath, S.; Gao, Y. Precise point positioning: A powerful technique with a promising future. GPS World 2009, 20, 43. [Google Scholar]
  40. Teunissen, P.J.G.; Khodabandeh, A. Review and principles of PPP-RTK methods. J. Geod. 2014, 89, 217–240. [Google Scholar] [CrossRef]
  41. Yigit, C.O.; Gurlek, E. Experimental testing of high-rate GNSS precise point positioning (PPP) method for detecting dynamic vertical displacement response of engineering structures. Geomat. Nat. Hazards Risk 2017, 8, 893–904. [Google Scholar] [CrossRef] [Green Version]
  42. Caldera, S.; Realini, E.; Barzaghi, R.; Reguzzoni, M.; Sansò, F. Experimental Study on Low-Cost Satellite-Based Geodetic Monitoring over Short Baselines. J. Surv. Eng. 2016, 142, 04015016. [Google Scholar] [CrossRef]
  43. Manzini, N.; Orcesi, A.; Thom, C.; Brossault, M.A.; Botton, S.; Ortiz, M.; Dumoulin, J. Performance analysis of low-cost GNSS stations for structural health monitoring of civil engineering structures. Struct. Infrastruct. Eng. 2020, 18, 595–611. [Google Scholar] [CrossRef]
  44. McGetrick, P.J.; Hester, D.; Taylor, S.E. Implementation of a drive-by monitoring system for transport infrastructure utilising smartphone technology and GNSS. J. Civ. Struct. Health Monit. 2017, 7, 175–189. [Google Scholar] [CrossRef] [Green Version]
  45. Meng, X.; Nguyen, D.T.; Xie, Y.; Owen, J.S.; Psimoulis, P.; Ince, S.; Chen, Q.; Ye, J.; Bhatia, P. Design and implementation of a new system for large bridge monitoring—GeoSHM. Sensors 2018, 18, 775. [Google Scholar] [CrossRef] [Green Version]
  46. Kaloop, M.R.; Hu, J.W.; Elbeltagi, E. Adjustment and Assessment of the Measurements of Low and High Sampling Frequencies of GPS Real-Time Monitoring of Structural Movement. ISPRS Int. J. Geo-Inf. 2016, 5, 222. [Google Scholar] [CrossRef] [Green Version]
  47. Beshr, A.A.A.; Zarzoura, F.H. Using artificial neural networks for GNSS observations analysis and displacement prediction of suspension highway bridge. Innov. Infrastruct. Solut. 2021, 6, 109. [Google Scholar] [CrossRef]
  48. Barrile, V.; Nocera, R.; Calcagno, S. Geomatics and soft computing methods for infrastructure monitoring. WSEAS Trans. Environ. Dev. 2021, 17, 466–478. [Google Scholar] [CrossRef]
  49. Chen, X.; Achilli, V.; Fabris, M.; Menin, A.; Monego, M.; Tessari, G.; Floris, M. Combining Sentinel-1 interferometry and ground-based geomatics techniques for monitoring buildings affected by mass movements. Remote Sens. 2021, 13, 452. [Google Scholar] [CrossRef]
  50. Corsetti, M.; Fossati, F.; Manunta, M.; Marsella, M. Advanced SBAS-DInSAR technique for controlling large civil infrastructures: An application to the Genzano di Lucania dam. Sensors 2018, 18, 2371. [Google Scholar] [CrossRef] [PubMed] [Green Version]
  51. Tomás, R.; Cano, M.; García-Barba, J.; Vicente, F.; Herrera, G.; Lopez-Sanchez, J.M.; Mallorquí, J.J. Monitoring an earthfill dam using differential SAR interferometry: La Pedrera dam, Alicante, Spain. Eng. Geol. 2013, 157, 21–32. [Google Scholar] [CrossRef]
  52. Ruiz-Armenteros, A.M.; Lazecky, M.; Hlaváčová, I.; Bakoň, M.; Manuel Delgado, J.; Sousa, J.J.; Lamas-Fernández, F.; Marchamalo, M.; Caro-Cuenca, M.; Papco, J.; et al. Deformation monitoring of dam infrastructures via spaceborne MT-InSAR. The case of La Viñuela (Málaga, southern Spain). Procedia Comput. Sci. 2018, 138, 346–353. [Google Scholar] [CrossRef]
  53. Dong, J.; Lai, S.; Wang, N.; Wang, Y.; Zhang, L.; Liao, M. Multi-scale deformation monitoring with Sentinel-1 InSAR analyses along the Middle Route of the South-North Water Diversion Project in China. Int. J. Appl. Earth Obs. Geoinf. 2021, 100, 102324. [Google Scholar] [CrossRef]
  54. Othman, A.A.; Al-Maamar, A.F.; Al-Manmi, D.A.M.; Liesenberg, V.; Hasan, S.E.; Al-Saady, Y.I.; Shihab, A.T.; Khwedim, K. Application of DInSAR-PSI technology for deformation monitoring of the Mosul Dam, Iraq. Remote Sens. 2019, 11, 2632. [Google Scholar] [CrossRef] [Green Version]
  55. Bakon, M.; Czikhardt, R.; Papco, J.; Barlak, J.; Rovnak, M.; Adamisin, P.; Perissin, D. remotIO: A sentinel-1 multi-temporal InSAR infrastructure monitoring service with automatic updates and data mining capabilities. Remote Sens. 2020, 12, 1892. [Google Scholar] [CrossRef]
  56. Maltese, A.; Pipitone, C.; Dardanelli, G.; Capodici, F.; Muller, J.P. Toward a comprehensive dam monitoring: On-site and remote-retrieved forcing factors and resulting displacements (GNSS and PS-InSAR). Remote Sens. 2021, 13, 1543. [Google Scholar] [CrossRef]
  57. Wang, Q.Q.; Huang, Q.H.; He, N.; He, B.; Wang, Z.C.; Wang, Y.A. Displacement monitoring of upper Atbara dam based on time series InSAR. Surv. Rev. 2020, 52, 485–496. [Google Scholar] [CrossRef]
  58. Biondi, F.; Addabbo, P.; Clemente, C.; Ullo, S.L.; Orlando, D. Monitoring of Critical Infrastructures by Micromotion Estimation: The Mosul Dam Destabilization. IEEE J. Sel. Top. Appl. Earth Obs. Remote Sens. 2020, 13, 6337–6351. [Google Scholar] [CrossRef]
  59. Anghel, A.; Vasile, G.; Boudon, R.; d’Urso, G.; Girard, A.; Boldo, D.; Bost, V. Combining spaceborne SAR images with 3D point clouds for infrastructure monitoring applications. ISPRS J. Photogramm. Remote Sens. 2015, 111, 45–61. [Google Scholar] [CrossRef]
  60. Liu, X.; Wang, P.; Lu, Z.; Gao, K.; Wang, H.; Jiao, C.; Zhang, X. Damage detection and analysis of urban bridges using Terrestrial Laser Scanning (TLS), ground-based microwave interferometry, and permanent scatterer interferometry synthetic aperture radar (PS-InSAR). Remote Sens. 2019, 11, 580. [Google Scholar] [CrossRef] [Green Version]
  61. Qin, X.; Liao, M.; Yang, M.; Zhang, L. Monitoring structure health of urban bridges with advanced multi-temporal InSAR analysis. Ann. GIS 2017, 23, 293–302. [Google Scholar] [CrossRef]
  62. Milillo, P.; Giardina, G.; Perissin, D.; Milillo, G.; Coletta, A.; Terranova, C. Pre-Collapse Space Geodetic Observations of Critical. Remote Sens. 2019, 11, 1403. [Google Scholar] [CrossRef] [Green Version]
  63. Jung, J.; Kim, D.J.; Vadivel, S.K.P.; Yun, S.H. Long-term deflection monitoring for bridges using X and C-band time-series SAR interferometry. Remote Sens. 2019, 11, 1258. [Google Scholar] [CrossRef] [Green Version]
  64. Schlögl, M.; Widhalm, B.; Avian, M. Comprehensive time-series analysis of bridge deformation using differential satellite radar interferometry based on Sentinel-1. ISPRS J. Photogramm. Remote Sens. 2021, 172, 132–146. [Google Scholar] [CrossRef]
  65. Huang, Q.; Monserrat, O.; Crosetto, M.; Crippa, B.; Wang, Y.; Jiang, J.; Ding, Y. Displacement monitoring and health evaluation of two bridges using sentinel-1 SAR images. Remote Sens. 2018, 10, 1714. [Google Scholar] [CrossRef] [Green Version]
  66. D’aranno, P.J.V.; Di Benedetto, A.; Fiani, M.; Marsella, M.; Moriero, I.; Baena, J.A.P. An application of persistent scatterer interferometry (PSI) technique for infrastructure monitoring. Remote Sens. 2021, 13, 1052. [Google Scholar] [CrossRef]
  67. Zhao, J.; Wu, J.; Ding, X.; Wang, M. Elevation extraction and deformation monitoring by multitemporal InSAR of Lupu Bridge in Shanghai. Remote Sens. 2017, 9, 897. [Google Scholar] [CrossRef] [Green Version]
  68. Xiong, S.; Wang, C.; Qin, X.; Zhang, B.; Li, Q. Time-series analysis on persistent scatter-interferometric synthetic aperture radar (PS-InSAR) derived displacements of the Hong Kong–Zhuhai–Macao bridge (HZMB) from sentinel-1A observations. Remote Sens. 2021, 13, 546. [Google Scholar] [CrossRef]
  69. Monserrat, O.; Crosetto, M.; Cuevas, M.; Crippa, B. The Thermal Expansion Component of Persistent Scatterer Interferometry Observations. IEEE Geosci. Remote Sens. Lett. 2011, 8, 864–868. [Google Scholar] [CrossRef]
  70. Crosetto, M.; Monserrat, O.; Cuevas-González, M.; Devanthéry, N.; Luzi, G.; Crippa, B. Measuring thermal expansion using X-band persistent scatterer interferometry. ISPRS J. Photogramm. Remote Sens. 2015, 100, 84–91. [Google Scholar] [CrossRef] [Green Version]
  71. Fornaro, G.; Reale, D.; Verde, S. Bridge Thermal Dilation Monitoring with Millimeter Sensitivity via Multidimensional SAR Imaging. IEEE Geosci. Remote Sens. Lett. 2013, 10, 677–681. [Google Scholar] [CrossRef]
  72. Qin, X.; Zhang, L.; Ding, X.; Liao, M.; Yang, M. Mapping and Characterizing Thermal Dilation of Civil Infrastructures with Multi-Temporal X-Band Synthetic Aperture Radar Interferometry. Remote Sens. 2018, 10, 941. [Google Scholar] [CrossRef] [Green Version]
  73. Shi, X.; Liao, M.; Wang, T.; Zhang, L.; Shan, W.; Wang, C. Expressway deformation mapping using high-resolution TerraSAR-X images. Remote Sens. Lett. 2014, 5, 194–203. [Google Scholar] [CrossRef]
  74. Luo, Q.; Zhou, G.; Perissin, D. Monitoring of subsidence along Jingjin Inter-City Railway with high-resolution terraSAR-X MT-InSAR analysis. Remote Sens. 2017, 9, 717. [Google Scholar] [CrossRef] [Green Version]
  75. Wang, R.; Yang, T.; Yang, M.; Liao, M.; Lin, J. A safety analysis of elevated highways in Shanghai linked to dynamic load using long-term time-series of InSAR stacks. Remote Sens. Lett. 2019, 10, 1133–1142. [Google Scholar] [CrossRef]
  76. Wang, H.; Chang, L.; Markine, V. Structural health monitoring of railway transition zones using satellite radar data. Sensors 2018, 18, 413. [Google Scholar] [CrossRef] [Green Version]
  77. Bianchini Ciampoli, L.; Gagliardi, V.; Clementini, C.; Latini, D.; Del Frate, F.; Benedetto, A. Transport Infrastructure Monitoring by InSAR and GPR Data Fusion. Surv. Geophys. 2019, 41, 371–394. [Google Scholar] [CrossRef]
  78. Lyu, M.; Ke, Y.; Li, X.; Zhu, L.; Guo, L.; Gong, H. Detection of seasonal deformation of highway overpasses using the Ps-InSAR technique: A case study in beijing urban area. Remote Sens. 2020, 12, 3071. [Google Scholar] [CrossRef]
  79. North, M.; Farewell, T.; Hallett, S.; Bertelle, A. Monitoring the response of roads and railways to seasonal soil movement with persistent scatterers interferometry over six UK sites. Remote Sens. 2017, 9, 922. [Google Scholar] [CrossRef] [Green Version]
  80. Orellana, F.; Blasco, J.M.D.; Foumelis, M.; D’Aranno, P.J.V.; Marsella, M.A.; Di Mascio, P. Dinsar for road infrastructure monitoring: Case study highway network of Rome metropolitan (Italy). Remote Sens. 2020, 12, 3697. [Google Scholar] [CrossRef]
  81. Cigna, F.; Banks, V.J.; Donald, A.W.; Donohue, S.; Graham, C.; Hughes, D.; McKinley, J.M.; Parker, K. Mapping ground instability in areas of geotechnical infrastructure using satellite InSAR and small UAV surveying: A case study in Northern Ireland. Geoscience 2017, 7, 51. [Google Scholar] [CrossRef] [Green Version]
  82. Chang, L.; Sakpal, N.P.; Elberink, S.O.; Wang, H. Railway infrastructure classification and instability identification using sentinel-1 SAR and laser scanning data. Sensors 2020, 20, 7108. [Google Scholar] [CrossRef] [PubMed]
  83. Fárová, K.; Jelének, J.; Kopačková-Strnadová, V.; Kycl, P. Comparing DInSAR and PSI Techniques Employed to Sentinel-1 Data to Monitor Highway Stability: A Case Study of a Massive Dobkovičky Landslide, Czech Republic. Remote Sens. 2019, 11, 2670. [Google Scholar] [CrossRef] [Green Version]
  84. Hu, F.; van Leijen, F.J.; Chang, L.; Wu, J.; Hanssen, R.F. Monitoring deformation along railway systems combining Multi-temporal InSAR and LiDAR data. Remote Sens. 2019, 11, 2298. [Google Scholar] [CrossRef] [Green Version]
  85. Macchiarulo, V.; Milillo, P.; Blenkinsopp, C.; Giardina, G. Monitoring deformations of infrastructure networks: A fully automated GIS integration and analysis of InSAR time-series. Struct. Health Monit. 2022, 21, 1849–1878. [Google Scholar] [CrossRef]
  86. Fiorentini, N.; Maboudi, M.; Leandri, P.; Losa, M.; Gerke, M. Surface motion prediction and mapping for road infrastructures management by PS-InSAR measurements and machine learning algorithms. Remote Sens. 2020, 12, 3976. [Google Scholar] [CrossRef]
  87. Gernhardt, S.; Bamler, R. Deformation monitoring of single buildings using meter-resolution SAR data in PSI. ISPRS J. Photogramm. Remote Sens. 2012, 73, 68–79. [Google Scholar] [CrossRef]
  88. Gernhardt, S.; Auer, S.; Eder, K. Persistent scatterers at building facades—Evaluation of appearance and localization accuracy. ISPRS J. Photogramm. Remote Sens. 2015, 100, 92–105. [Google Scholar] [CrossRef]
  89. Bru, G.; Herrera, G.; Tomás, R.; Duro, J.; de la Vega, R.; Mulas, J. Control of deformation of buildings affected by subsidence using persistent scatterer interferometry. Struct. Infrastruct. Eng. 2013, 9, 188–200. [Google Scholar] [CrossRef]
  90. Yang, K.; Yan, L.; Huang, G.; Chen, C.; Wu, Z. Monitoring building deformation with InSAR: Experiments and validation. Sensors 2016, 16, 2182. [Google Scholar] [CrossRef]
  91. Zhu, M.; Wan, X.; Fei, B.; Qiao, Z.; Ge, C.; Minati, F.; Vecchioli, F.; Li, J.; Costantini, M. Detection of building and infrastructure instabilities by automatic spatiotemporal analysis of satellite SAR interferometry measurements. Remote Sens. 2018, 10, 1816. [Google Scholar] [CrossRef] [Green Version]
  92. Popescu, C.; Täljsten, B.; Blanksvärd, T.; Elfgren, L. 3D reconstruction of existing concrete bridges using optical methods. Struct. Infrastruct. Eng. 2019, 15, 912–924. [Google Scholar] [CrossRef] [Green Version]
  93. Mohammadi, M.; Rashidi, M.; Mousavi, V.; Karami, A.; Yu, Y.; Samali, B. Quality evaluation of digital twins generated based on UAV photogrammetry and TLS: Bridge case study. Remote Sens. 2021, 13, 3499. [Google Scholar] [CrossRef]
  94. Previtali, M.; Brumana, R.; Banfi, F. Existing infrastructure cost effective informative modelling with multisource sensed data: TLS, MMS and photogrammetry. Appl. Geomat. 2022, 14, 21–40. [Google Scholar] [CrossRef]
  95. Yang, L.; Cheng, J.C.P.; Wang, Q. Semi-automated generation of parametric BIM for steel structures based on terrestrial laser scanning data. Autom. Constr. 2020, 112, 103037. [Google Scholar] [CrossRef]
  96. Valença, J.; Puente, I.; Júlio, E.; González-Jorge, H.; Arias-Sánchez, P. Assessment of cracks on concrete bridges using image processing supported by laser scanning survey. Constr. Build. Mater. 2017, 146, 668–678. [Google Scholar] [CrossRef]
  97. Gawronek, P.; Makuch, M.; Mitka, B.; Gargula, T. Measurements of the vertical displacements of a railway bridge using TLS technology in the context of the upgrade of the polish railway transport. Sensors 2019, 19, 4275. [Google Scholar] [CrossRef] [Green Version]
  98. Kim, H.; Yoon, J.; Sim, S.H. Automated bridge component recognition from point clouds using deep learning. Struct. Control Health Monit. 2020, 27, e2591. [Google Scholar] [CrossRef]
  99. Cha, G.; Park, S.; Oh, T. A Terrestrial LiDAR-Based Detection of Shape Deformation for Maintenance of Bridge Structures. J. Constr. Eng. Manag. 2019, 145, 04019075. [Google Scholar] [CrossRef]
  100. Puri, N.; Turkan, Y. Bridge construction progress monitoring using lidar and 4D design models. Autom. Constr. 2020, 109, 102961. [Google Scholar] [CrossRef]
  101. Kumar, P.; McElhinney, C.P.; Lewis, P.; McCarthy, T.; Kumar, P.; McElhinney, C.P.; Lewis, P.; McCarthy, T. An automated algorithm for extracting road edges from terrestrial mobile LiDAR data. JPRS 2013, 85, 44–55. [Google Scholar] [CrossRef] [Green Version]
  102. Rodríguez-Cuenca, B.; García-Cortés, S.; Ordóñez, C.; Alonso, M.C. Morphological Operations to Extract Urban Curbs in 3D MLS Point Clouds. ISPRS Int. J. Geo-Inf. 2016, 5, 93. [Google Scholar] [CrossRef] [Green Version]
  103. Xu, S.; Wang, R.; Zheng, H. Road Curb Extraction from Mobile LiDAR Point Clouds. IEEE Trans. Geosci. Remote Sens. 2016, 55, 996–1009. [Google Scholar] [CrossRef] [Green Version]
  104. Yadav, M.; Singh, A.K.; Lohani, B. Extraction of road surface from mobile LiDAR data of complex road environment. Int. J. Remote Sens. 2017, 38, 4645–4672. [Google Scholar] [CrossRef]
  105. Díaz-Vilariño, L.; González-Jorge, H.; Bueno, M.; Arias, P.; Puente, I. Automatic classification of urban pavements using mobile LiDAR data and roughness descriptors. Constr. Build. Mater. 2016, P1, 208–215. [Google Scholar] [CrossRef]
  106. Soilán, M.; Justo, A.; Sánchez-Rodríguez, A.; Riveiro, B. 3D point cloud to BIM: Semi-automated framework to define IFC alignment entities from MLS-acquired LiDAR data of highway roads. Remote Sens. 2020, 12, 2301. [Google Scholar] [CrossRef]
  107. Jing, H.; Meng, X.; Slatcher, N.; Hunter, G. Efficient point cloud corrections for mobile monitoring applications using road/rail-side infrastructure. Surv. Rev. 2021, 53, 235–251. [Google Scholar] [CrossRef]
  108. Soni, A.; Robson, S.; Gleeson, B. Structural monitoring for the rail industry using conventional survey, laser scanning and photogrammetry. Appl. Geomat. 2015, 7, 123–138. [Google Scholar] [CrossRef]
  109. Arastounia, M. An Enhanced Algorithm for Concurrent Recognition of Rail Tracks and Power Cables from Terrestrial and Airborne LiDAR Point Clouds. Infrastructures 2017, 2, 8. [Google Scholar] [CrossRef] [Green Version]
  110. Wang, J.; Zhang, C.C. Deformation monitoring of earth-rock dams based on three-dimensional laser scanning technology. J. Geotech. Eng. 2014, 36, 2345–2350. [Google Scholar] [CrossRef]
  111. Wan, Z.Y.; Huang, Y.Y.; Zhao, X.R.; Zuo, Q.Y.; Li, X.H. Application of Three-dimensional Laser Scanning Technique in Deformation Monitoring of Extrusion Sidewall of Concrete-faced Rockfill Dam. J. Yangtze River Sci. Res. Inst. 2017, 34, 56–61. [Google Scholar]
  112. Xu, H.; Li, H.B.; Yang, X.G.; Qi, S.C.; Zhou, J.W. Integration of terrestrial laser scanning and NURBS modeling for the deformation monitoring of an earth-rock dam. Sensors 2019, 19, 22. [Google Scholar] [CrossRef] [Green Version]
  113. Xiao, P.; Zhao, R.; Li, D.; Zeng, Z.; Qi, S.; Yang, X. As-Built Inventory and Deformation Analysis of a High Rockfill Dam under Construction with Terrestrial Laser Scanning. Sensors 2022, 22, 521. [Google Scholar] [CrossRef] [PubMed]
  114. Tapete, D.; Casagli, N.; Luzi, G.; Fanti, R.; Gigli, G.; Leva, D. Integrating radar and laser-based remote sensing techniques for monitoring structural deformation of archaeological monuments. J. Archaeol. Sci. 2013, 40, 176–189. [Google Scholar] [CrossRef] [Green Version]
  115. Castellazzi, G.; D’Altri, A.M.; de Miranda, S.; Ubertini, F. An innovative numerical modeling strategy for the structural analysis of historical monumental buildings. Eng. Struct. 2017, 132, 229–248. [Google Scholar] [CrossRef]
  116. Khaloo, A.; Lattanzi, D.; Cunningham, K.; Dell’Andrea, R.; Riley, M. Unmanned aerial vehicle inspection of the Placer River Trail Bridge thrshaoough image-based 3D modelling. Struct. Infrastruct. Eng. 2018, 14, 124–136. [Google Scholar] [CrossRef]
  117. Reagan, D.; Sabato, A.; Niezrecki, C. Feasibility of using digital image correlation for unmanned aerial vehicle structural health monitoring of bridges. Struct. Health Monit. 2018, 17, 1056–1072. [Google Scholar] [CrossRef]
  118. Zollini, S.; Alicandro, M.; Dominici, D.; Quaresima, R.; Giallonardo, M. UAV photogrammetry for concrete bridge inspection using object-based image analysis (OBIA). Remote Sens. 2020, 12, 3180. [Google Scholar] [CrossRef]
  119. Ellenberg, A.; Kontsos, A.; Moon, F.; Bartoli, I. Bridge related damage quantification using unmanned aerial vehicle imagery. Struct. Control Health Monit. 2016, 23, 1168–1179. [Google Scholar] [CrossRef]
  120. Liu, Y.F.; Nie, X.; Fan, J.S.; Liu, X.G. Image-based crack assessment of bridge piers using unmanned aerial vehicles and three-dimensional scene reconstruction. Comput. Aided Civ. Infrastruct. Eng. 2020, 35, 511–529. [Google Scholar] [CrossRef]
  121. Rau, J.Y.; Hsiao, K.W.; Jhan, J.P.; Wang, S.H.; Fang, W.C.; Wang, J.L. Bridge crack detection using multi-rotary UAV and object-based image analysis. International Archives of the Photogrammetry. Remote Sens. Spat. Inf. Sci. 2017, 42, 311–318. [Google Scholar] [CrossRef] [Green Version]
  122. Bhowmick, S.; Nagarajaiah, S.; Veeraraghavan, A. Vision and deep learning-based algorithms to detect and quantify cracks on concrete surfaces from UAV videos. Sensors 2020, 20, 6299. [Google Scholar] [CrossRef]
  123. Knyaz, V.A.; Chibunichev, A.G. Photogrammetric techniques for road surface analysis. Int. Arch. Photogramm. Remote Sens. Spat. Inf. Sci. 2016, 41, 515–520. [Google Scholar] [CrossRef] [Green Version]
  124. Dobson, R.J.; Brooks, C.; Roussi, C.; Colling, T. Developing an unpaved road assessment system for practical deployment with high-resolution optical data collection using a helicopter UAV. In Proceedings of the 2013 International Conference on Unmanned Aircraft Systems, ICUAS, Atlanta, GA, USA, 28–31 May 2013; pp. 235–243. [Google Scholar] [CrossRef]
  125. Barrile, V.; Bernardo, E.; Fotia, A.; Candela, G.; Bilotta, G. Road safety: Road degradation survey through images by UAV. WSEAS Trans. Environ. Dev. 2020, 16, 649–659. [Google Scholar] [CrossRef]
  126. Bernardo, E.; Bonfa, S.; Calcagno, S. Techniques of geomatics and soft computing for the monitoring of infrastructures and the management of big data. WSEAS Trans. Environ. Dev. 2021, 17, 371–385. [Google Scholar] [CrossRef]
  127. Hong, Z.; Yang, F.; Pan, H.; Zhou, R.; Zhang, Y.; Han, Y.; Wang, J.; Yang, S.; Chen, P.; Tong, X.; et al. Highway Crack Segmentation from Unmanned Aerial Vehicle Images Using Deep Learning. IEEE Geosci. Remote Sens. Lett. 2022, 19, 21526281. [Google Scholar] [CrossRef]
  128. Lee, S.B.; Song, M.; Kim, S.; Won, J.H. Change monitoring at expressway infrastructure construction sites using drone. Sens. Mater. 2020, 32, 3923–3933. [Google Scholar] [CrossRef]
  129. Kovacevic, M.S.; Gavin, K.; Oslakovic, I.S.; Bacic, M. A New Methodology for Assessment of Railway Infrastructure Condition. Transp. Res. Procedia 2016, 14, 1930–1939. [Google Scholar] [CrossRef] [Green Version]
  130. Mammeri, A.; Jabbar Siddiqui, A.; Zhao, Y. UAV-assisted Railway Track Segmentation based on Convolutional Neural Networks. In Proceedings of the IEEE Vehicular Technology Conference, Helsinki, Finland, 25–28 April 2021. [Google Scholar] [CrossRef]
  131. Fernandez Galarreta, J.; Kerle, N.; Gerke, M. UAV-based urban structural damage assessment using object-based image analysis and semantic reasoning. Nat. Hazards Earth Syst. Sci. 2015, 15, 1087–1101. [Google Scholar] [CrossRef] [Green Version]
  132. Gopalakrishnan, K.; Gholami, H.; Vidyadharan, A.; Agrawal, A. Crack Damage Detection in Unmanned Aerial Vehicle Images of Civil Infrastructure Using Pre-Trained Deep Learning Model. Int. J. Traffic Transp. Eng. 2018, 8, 1–14. [Google Scholar] [CrossRef]
  133. Kang, D.; Cha, Y.J. Autonomous UAVs for Structural Health Monitoring Using Deep Learning and an Ultrasonic Beacon System with Geo-Tagging. Comput.-Aided Civ. Infrastruct. Eng. 2018, 33, 885–902. [Google Scholar] [CrossRef]
  134. Munawar, H.S.; Ullah, F.; Heravi, A.; Thaheem, M.J.; Maqsoom, A. Inspecting buildings using drones and computer vision: A machine learning approach to detect cracks and damages. Drones 2022, 6, 5. [Google Scholar] [CrossRef]
  135. Sohn, H.; Farrar, C.R.; Hemez, F.M.; Shunk, D.D.; Stinemates, D.W.; Nadler, B.R.; Czarnecki, J.J. A review of structural health monitoring literature: 1996–2001. Los Alamos Natl. Lab. 2003, 20, 34–45. [Google Scholar]
  136. An, Y.; Chatzi, E.; Sim, S.H.; Laflamme, S.; Blachowski, B.; Ou, J. Recent progress and future trends on damage identification methods for bridge structures. Struct. Control Health Monit. 2019, 12, e2416. [Google Scholar] [CrossRef]
  137. Shano, L.; Raghuvanshi, T.K.; Meten, M. Landslide susceptibility evaluation and hazard zonation techniques—A review. Geoenviron. Disasters 2020, 7, 18. [Google Scholar] [CrossRef]
  138. Yilmaz, I. Landslide susceptibility mapping using frequency ratio, logistic regression, artificial neural networks and their comparison: A case study from Kat landslides (Tokat—Turkey). Comput. Geosci. 2009, 35, 1125–1138. [Google Scholar] [CrossRef]
  139. Pham, B.T.; Prakash, I.; Singh, S.K.; Shirzadi, A.; Shahabi, H.; Bui, D.T. Landslide susceptibility modeling using Reduced Error Pruning Trees and different ensemble techniques: Hybrid machine learning approaches. Catena 2019, 175, 203–218. [Google Scholar] [CrossRef]
  140. Kavzoglu, T.; Sahin, E.K.; Colkesen, I. Landslide susceptibility mapping using GIS-based multi-criteria decision analysis, support vector machines, and logistic regression. Landslides 2014, 11, 425–439. [Google Scholar] [CrossRef]
  141. Kamp, U.; Growley, B.J.; Khattak, G.A.; Owen, L.A. GIS-based landslide susceptibility mapping for the 2005 Kashmir earthquake region. Geomorphology 2008, 101, 631–642. [Google Scholar] [CrossRef]
  142. McCulloch, W.S.; Pitts, W. A logical calculus of the ideas immanent in nervous activity. Bull. Math. Biophys. 1943, 5, 115–133. [Google Scholar] [CrossRef]
  143. Akgun, A.; Sezer, E.A.; Nefeslioglu, H.A.; Gokceoglu, C.; Pradhan, B. An easy-to-use MATLAB program (MamLand) for the assessment of landslide susceptibility using a Mamdani fuzzy algorithm. Comput. Geosci. 2012, 38, 23–34. [Google Scholar] [CrossRef]
  144. Shahabi, H.; Hashim, M. Landslide susceptibility mapping using GIS-based statistical models and Remote sensing data in tropical environment. Sci. Rep. 2015, 5, 9899. [Google Scholar] [CrossRef] [PubMed] [Green Version]
  145. Kayastha, P.; Dhital, M.R.; De Smedt, F. Application of the analytical hierarchy process (AHP) for landslide susceptibility mapping: A case study from the Tinau watershed, west Nepal. Comput. Geosci. 2013, 52, 398–408. [Google Scholar] [CrossRef]
  146. Jazouli, A.; Barakat, A.; Khellouk, R. GIS-multicriteria evaluation using AHP for landslide susceptibility mapping in Oum Er Rbia high basin (Morocco). Geoenviron. Disasters 2019, 6, 3. [Google Scholar] [CrossRef]
  147. Zhao, H.; Yao, L.; Mei, G.; Liu, T.; Ning, Y. A fuzzy comprehensive evaluation method based on AHP and entropy for a landslide susceptibility map. Entropy 2017, 19, 396. [Google Scholar] [CrossRef]
  148. Sur, U.; Singh, P.; Meena, S.R. Landslide susceptibility assessment in a lesser Himalayan road corridor (India) applying fuzzy AHP technique and earth-observation data. Geomat. Nat. Hazards Risk 2020, 11, 2176–2209. [Google Scholar] [CrossRef]
  149. Pourghasemi, H.R.; Pradhan, B.; Gokceoglu, C. Application of fuzzy logic and analytical hierarchy process (AHP) to landslide susceptibility mapping at Haraz watershed, Iran. Nat. Hazards 2012, 63, 965–996. [Google Scholar] [CrossRef]
  150. ASCE. ASCE’s 2017, Infrastructure Report Card. 2017. Available online: https://www.infrastructurereportcard.org/ (accessed on 29 June 2022).
  151. FHWA. Bridge Condition by Highway System 2019. 2019. Available online: https://www.fhwa.dot.gov/bridge/nbi/no10/condition19.cfm (accessed on 29 June 2022).
  152. Mpelogianni, V.; Groumpos, P.P. Re-approaching fuzzy cognitive maps to increase the knowledge of a system. AI Soc. 2018, 33, 175–188. [Google Scholar] [CrossRef]
Figure 1. Publications per year associated with remote-sensing data for infrastructure monitoring. The keywords of the search on Scopus database are displayed in the legend of the diagram. The first four months of 2022 were considered.
Geomatics 03 00021 g001
Figure 2. Schematic adaptation of the architecture of PROION project.
Geomatics 03 00021 g002
Figure 3. A typical example of performing static GNSS measurements on permanent pillar located on the crest of Asteri dam, Western Greece.
Geomatics 03 00021 g003
Figure 4. A basic neural network model.
Geomatics 03 00021 g004
Figure 5. Statistical analysis of the reviewing papers according to the remote-sensing sensor and the infrastructure application. (a) Remote-sensing sensors and (b) infrastructure applications.
Geomatics 03 00021 g005
Figure 6. Statistical analysis of the reviewing papers according to the remote-sensing sensor and the infrastructure application. (a) GNSS-based studies, (b) SAR-based studies, (c) LiDAR-based studies and (d) UAV-based studies.
Geomatics 03 00021 g006
Figure 7. Soft computing methods by year in accordance with the total number of publications.
Geomatics 03 00021 g007
Figure 8. Pie chart displaying soft computing methods in relation to the total number of references used.
Geomatics 03 00021 g008
Figure 9. Soft computing methods in accordance with the infrastructure application.
Geomatics 03 00021 g009
Table 2. SAR data, processing technique and software, applied in dam deformation monitoring.
ReferenceSAR DataProcessing TechniqueSoftware
[52]ERS-1/2, Envisat, Sentinel-1MT-InSARStaMPS, SARPROZ, ISCE-SALSIT
[53]Sentinel-1PSI, SBASGAMMA, StaMPS
[58]COSMO-SkyMedPSISARPROZ
[57]Sentinel-1PSI-
[59]TerraSAR-X, TanDEM-XPSI-
[50]ERS-1/2, ENVISATSBAS-
[54]Sentinel-1PSISARPROZ
[55]Sentinel-1MT-InSARSARPROZ
[56]Sentinel-1PSISARPROZ
[51]ERS-1/2, Envisat, TerraSAR-X Coherent Pixel PSI-
Table 3. SAR data, processing technique and software, applied in bridge deformation monitoring.
ReferenceSAR DataProcessing TechniqueSoftware
[60]COSMO-SkyMed imagesPSI-
[64]Sentinel-1PSISNAP, Python (snap2stamps), StaMPS
[66]ERS1/2, ENVISAT, COSMO-SkyMedPSISARscape (v 5.2)
[65]Sentinel-1PSI-
[61]TerraSAR-XPSI-
[62]COSMO-SkyMed, Sentinel-1MT-InSARSARPROZ
[68]Sentinel-1PSIGAMMA, StaMPS
[63]COSMO-SkyMed, Sentinel-1PSIGAMMA
[67]Cosmo-SkyMedPSIGAMMA
Table 4. SAR data, processing technique and software, applied in transportation infrastructure deformation monitoring.
ReferenceSAR DataProcessing TechniqueSoftware
[84]RadarSAT-2MT-InSAR-
[85]ERS1/2, ENVISAT, COSMO-SkyMedPSISARscape
[81]ENVISAT, ERS-1/2, Sentinel-1SBASGAMMA
[73]TerraSAR-XSBAS-
[77]Sentinel 1, COSMO-SkyMedPSISARscape
[74]TerraSAR-XMT-InSARSARPROZ
[78]TerraSAR-XPSISARPROZ
[79]Sentinel-1PSISARscape (v5.3.)
[83]Sentinel-1DInSAR, PSISNAP, SARPROZ
[82]Sentinel-1PSI-
[80]Sentinel-1, Cosmo-SkyMedPSI, SBASSNAP(v.3), StaMPS
[86]Sentinel-1PSI-
[75]TerraSAR-XTS-InSARStaMPS
[76]TerraSAR-XPSI-
Table 5. List of studies dealing with the use of LiDAR data for infrastructure applications.
ReferenceInfrastructure TypeApplication
[92,93]bridge3D reconstruction model
[94,95]bridgebuilding information modelling/structure health monitoring
[96]bridgeautomated crack assessment in concrete bridges
[60]bridgedamage detection and analysis
[97]bridgemeasurements of vertical displacements
[98]bridgeautomated bridge component recognition
[99]bridgedetection of shape deformation
[100]bridgemonitoring of construction progress
[101]roadextraction of road edges
[102,103]roadroad curb detection
[104]roadextract road information
[105]roadmaintenance of road pavements
[106,107]roadroad monitoring
[108]railwaymonitoring of renovation progress
[109]railwayrecognition of railroad assets
[110,111,112,113]damdeformation monitoring
[114,115]archaeological sitesstructural deformation monitoring
Table 6. List of studies dealing with the use of UAVs for infrastructure applications.
ReferenceInfrastructure TypeApplicationUAV Type
[116]bridge3D reconstructionHexacopter
(according to DJI S800, SZ DJI Technology Co., Ltd, Shenzhen, China)
[93]bridge3D reconstructionIntel® Falcon 8+
[117]bridgestructural health monitoringPSI InstantEye Gen4
[48]bridgestructural monitoringDJI Inspire 1
[118]bridgeidentification of deteriorated areasFlytop FlyNovex
[119]bridgedamage quantificationDJI Phantom
[120]bridgecrack assessmentDJI UAV of S1000+/M600, DJI Inspire 2
[121]bridgecrack detectionmulti-rotary UAV
[122]bridgedetection and quantification of cracksDJI Phantom 4 Advanced
[123]roadroad surface analysisGeoscan 401
[124]roadroad assessmentsingle-rotor UAV
[125]roadroad degradation assessmentDJI Mavic 2 Pro
[126]roadroad monitoringDJI Mavic 2 Pro
[127]roadroad crack identification-
[128]roaddeformation monitoringSensefly eBee Plus
[129]railwayassessment of railway conditions-
[130]railwayrailway hazard detectionING’s Responder
[131]buildingsstructural damage assessmentAibot X6 V.1
[132]buildingscrack damage detectionHexacopter UAV
[133]buildingsstructural health monitoringPixhawk UAV, Parrot Bebop 2
[134]buildingscrack detection DJI-M200 quadcopter
Disclaimer/Publisher’s Note: The statements, opinions and data contained in all publications are solely those of the individual author(s) and contributor(s) and not of MDPI and/or the editor(s). MDPI and/or the editor(s) disclaim responsibility for any injury to people or property resulting from any ideas, methods, instructions or products referred to in the content.

