
S-PDR: SBAUPT-Based Pedestrian Dead Reckoning Algorithm for Free-Moving Handheld Devices


Abstract
:1. Introduction
2. Related Work
2.1. Step Detection
2.2. Alignment and Walking Direction Estimation
2.3. Step-Length Estimation
3. SBAUPT-Based Pedestrian Dead Reckoning (S-PDR)
3.1. Step Detection
3.1.1. Adaptive Cut-Off Frequency Filter
3.1.2. Temporal Filtering
3.1.3. Sensor Fusion
3.1.4. Step Validation
3.2. Azimuth Step-Based Attitude Update (SBAUPT)
3.2.1. Step-Based Update (SBUPT)
3.2.2. Azimuth Fusion
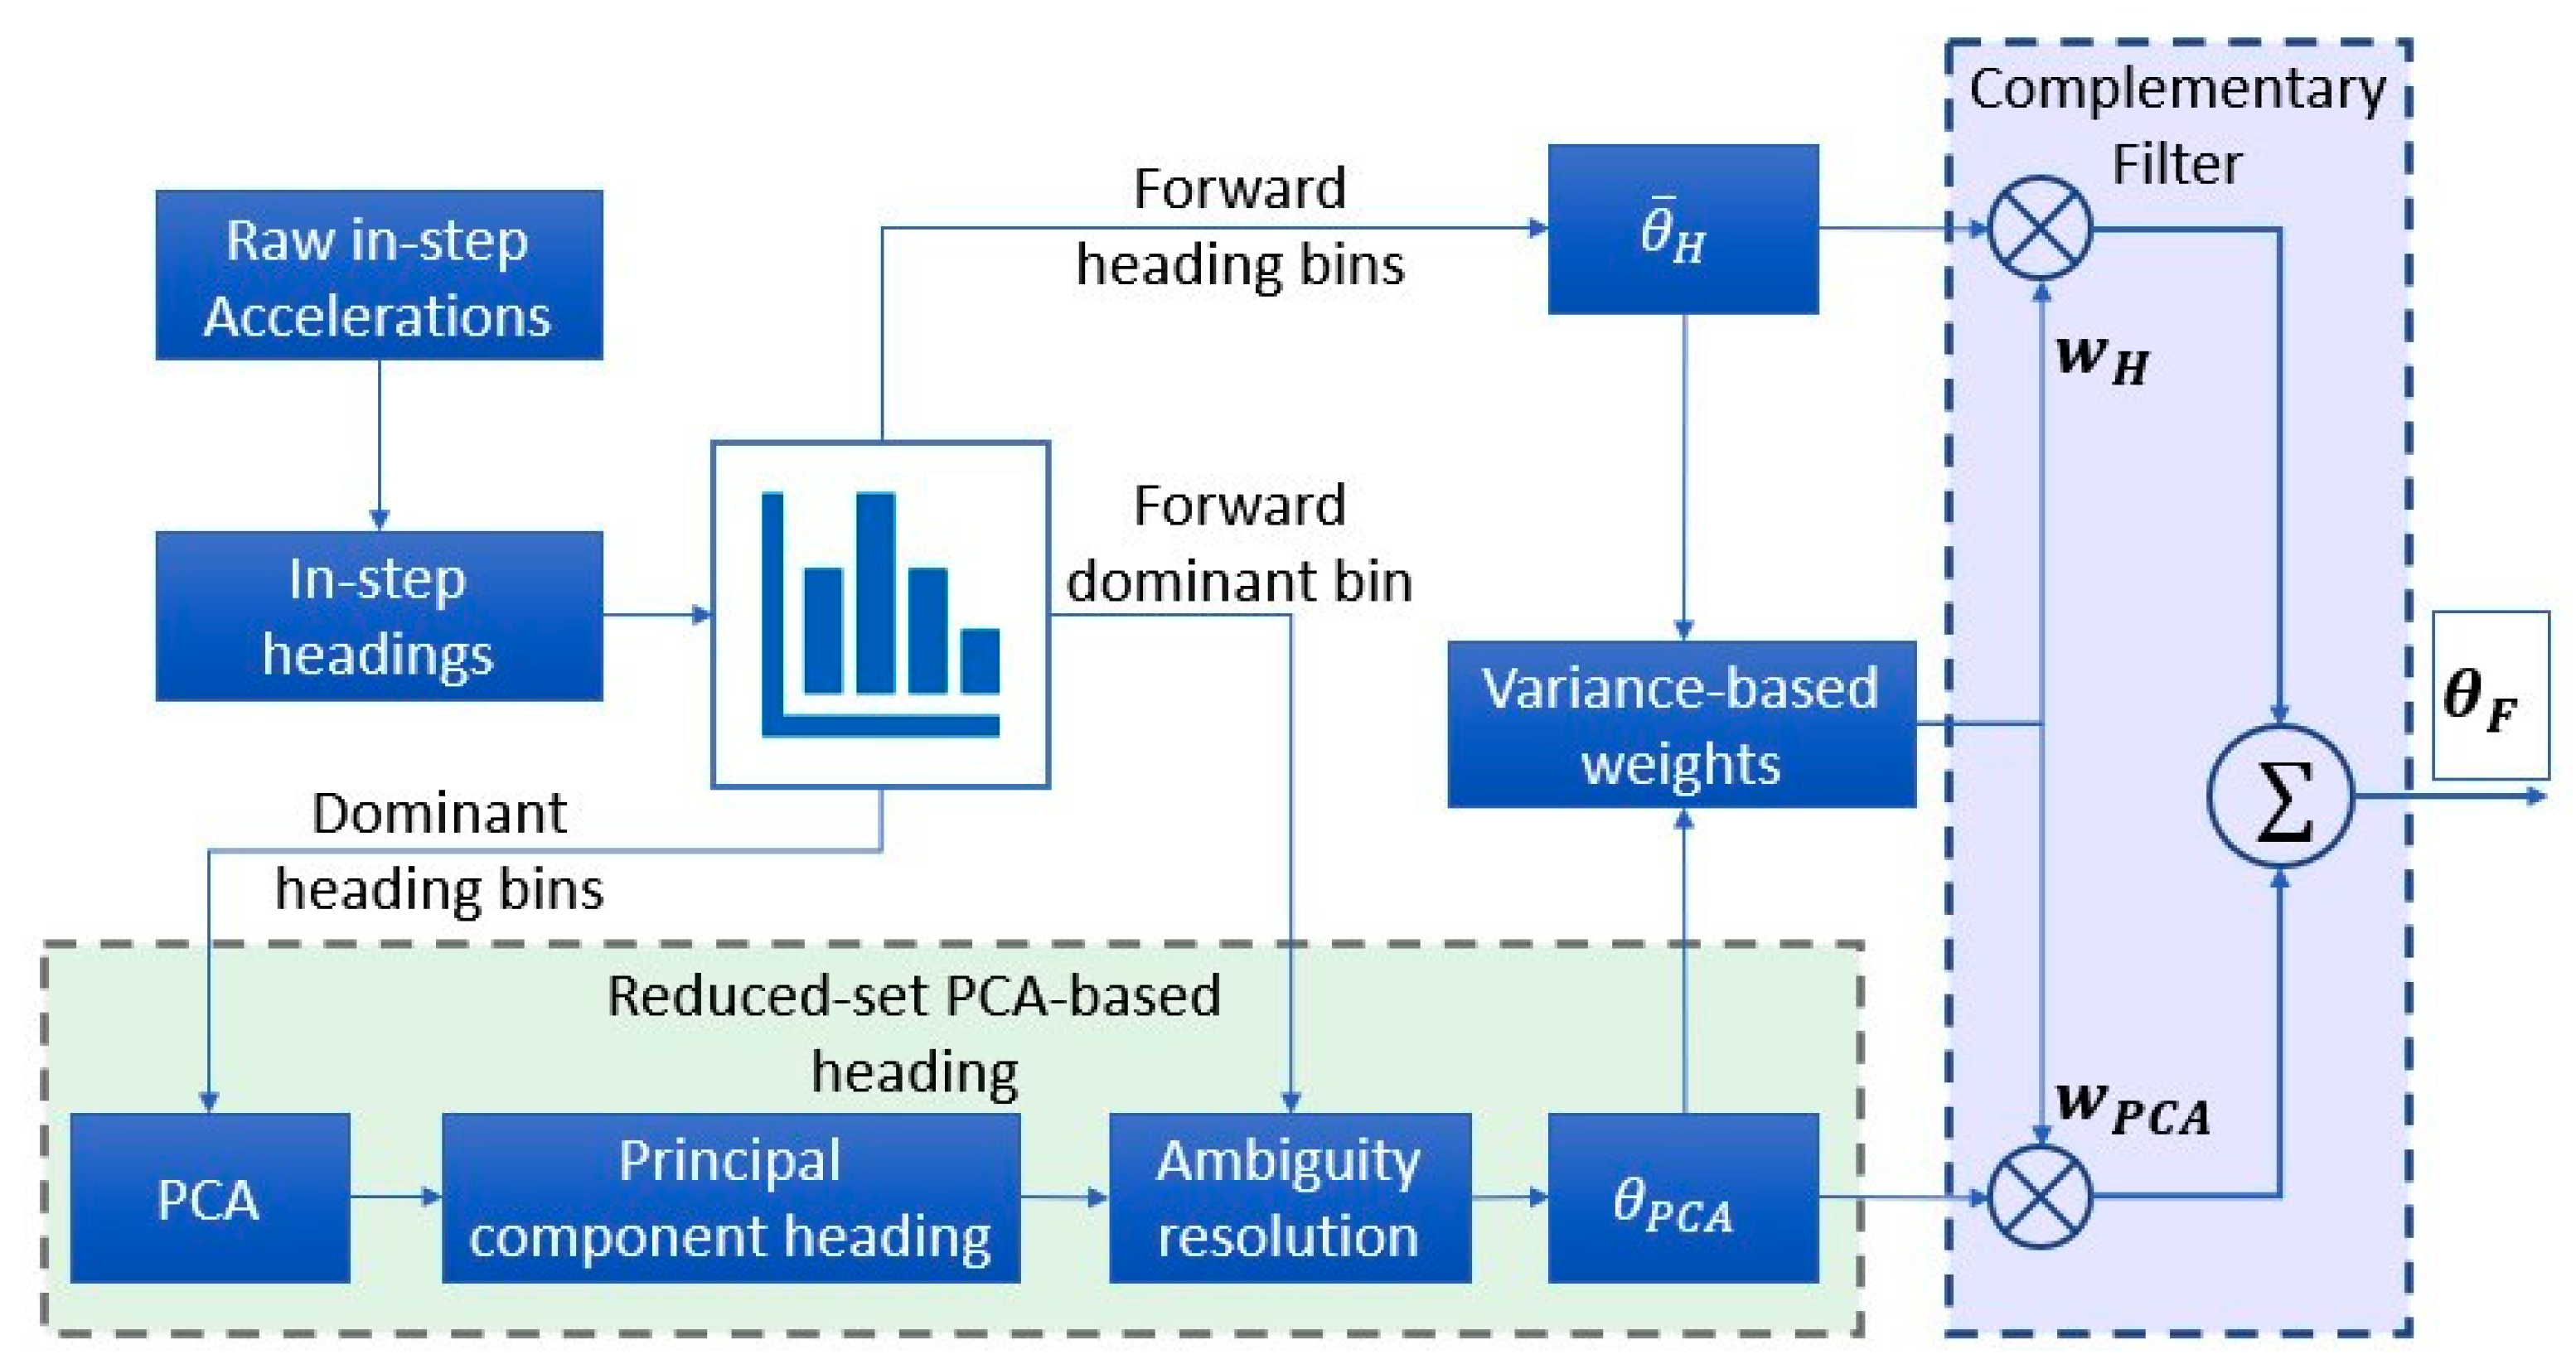
3.3. Heading Estimation
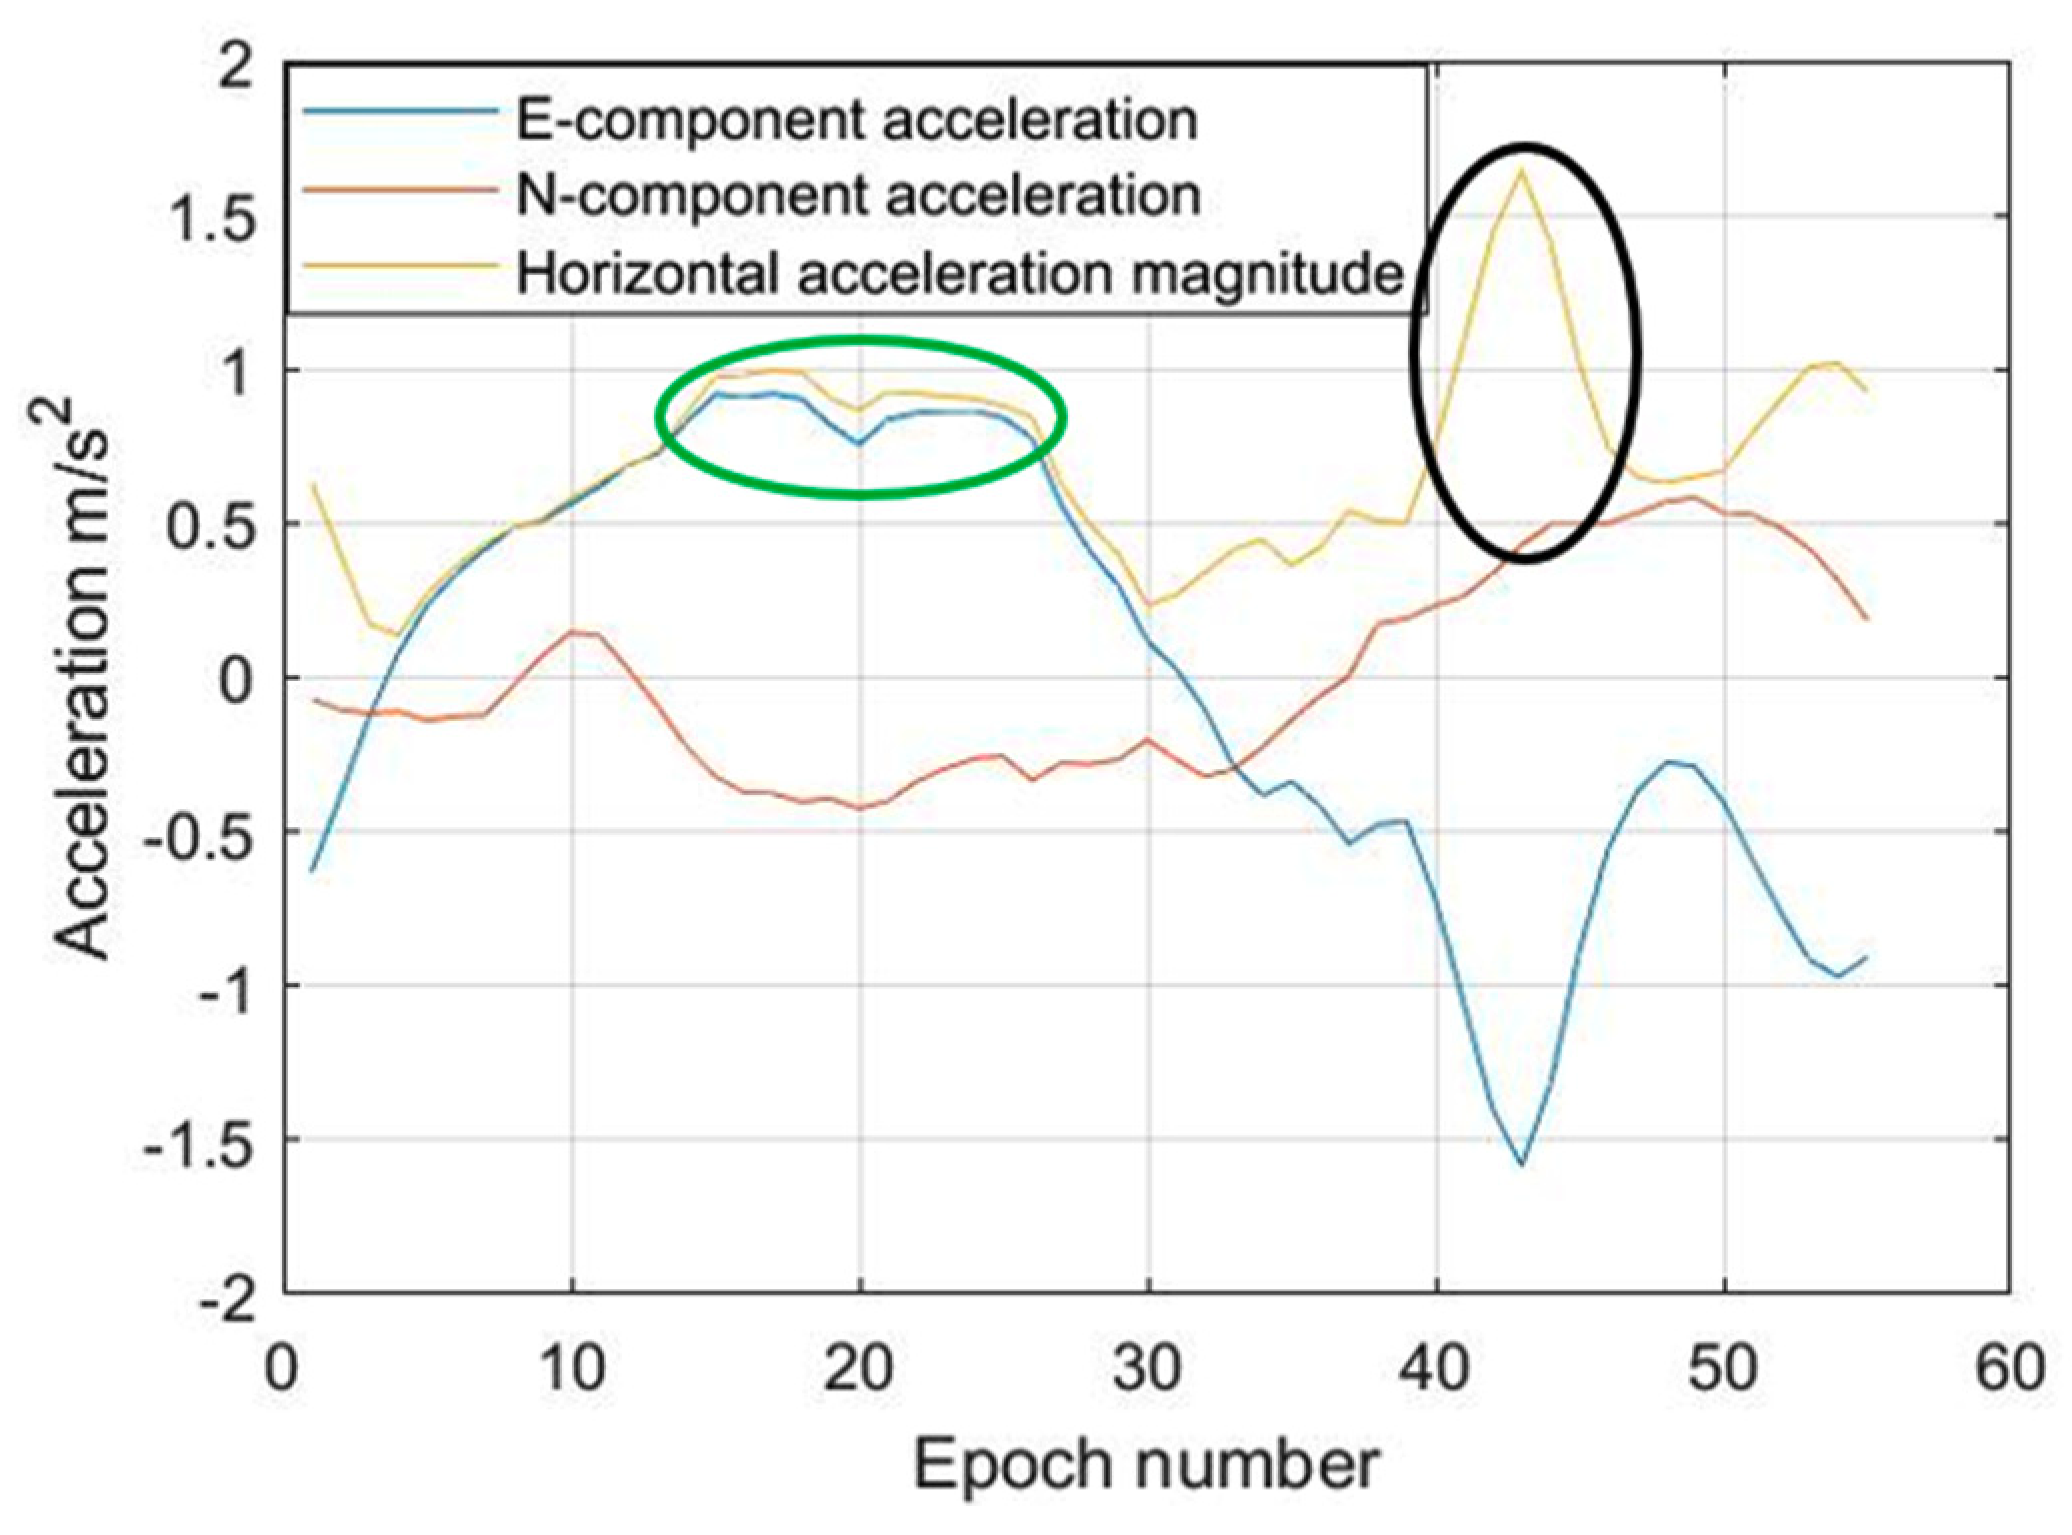
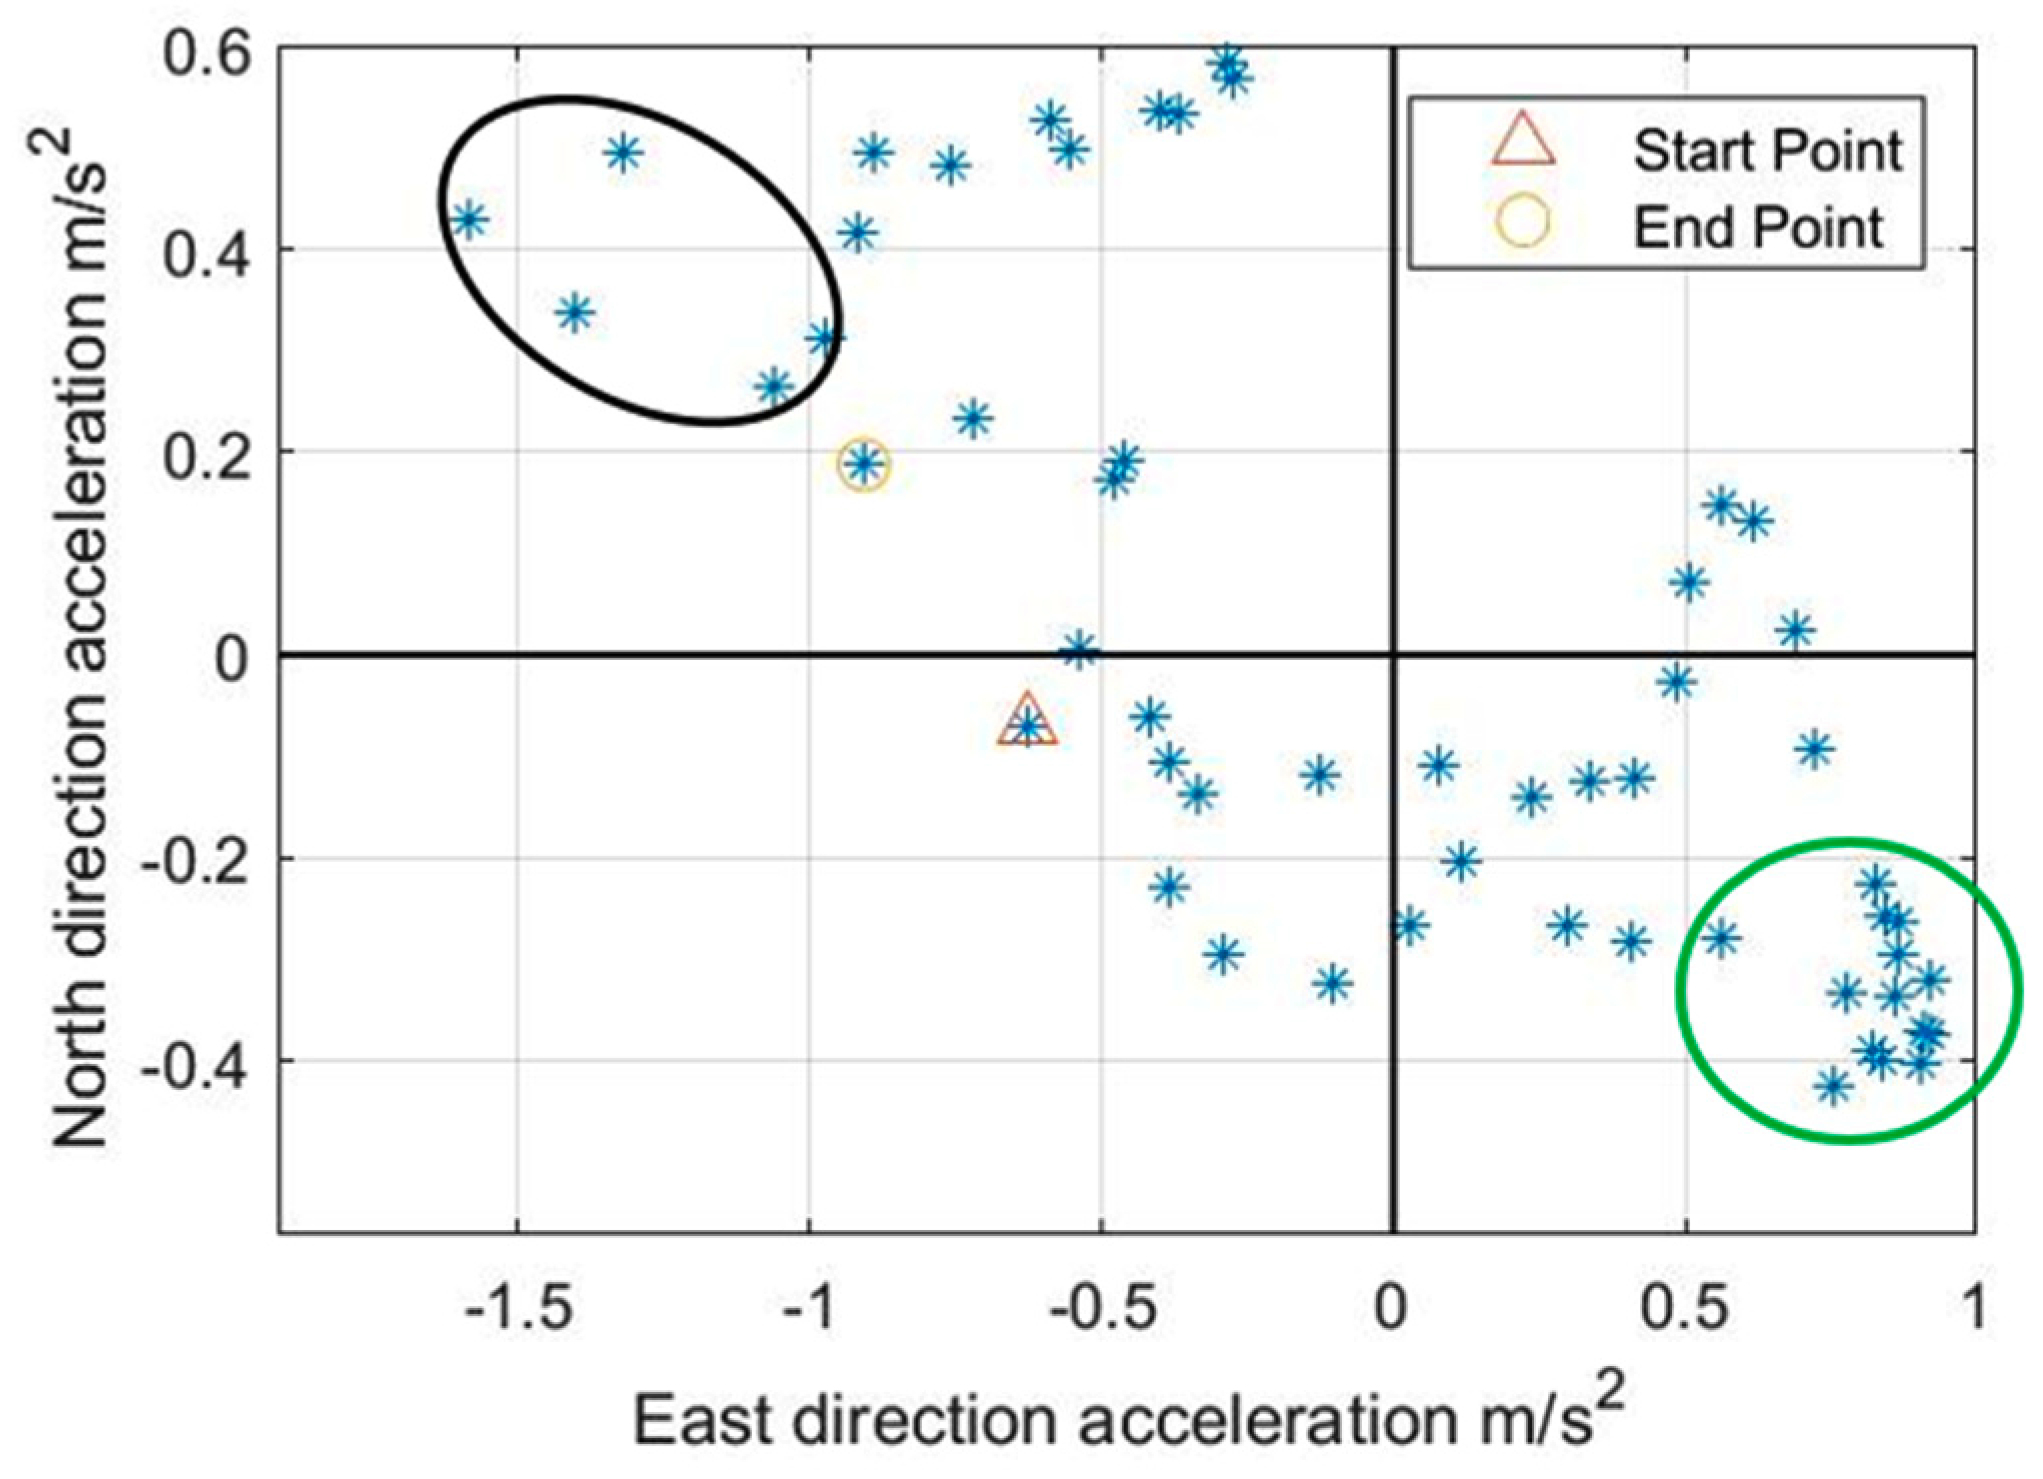
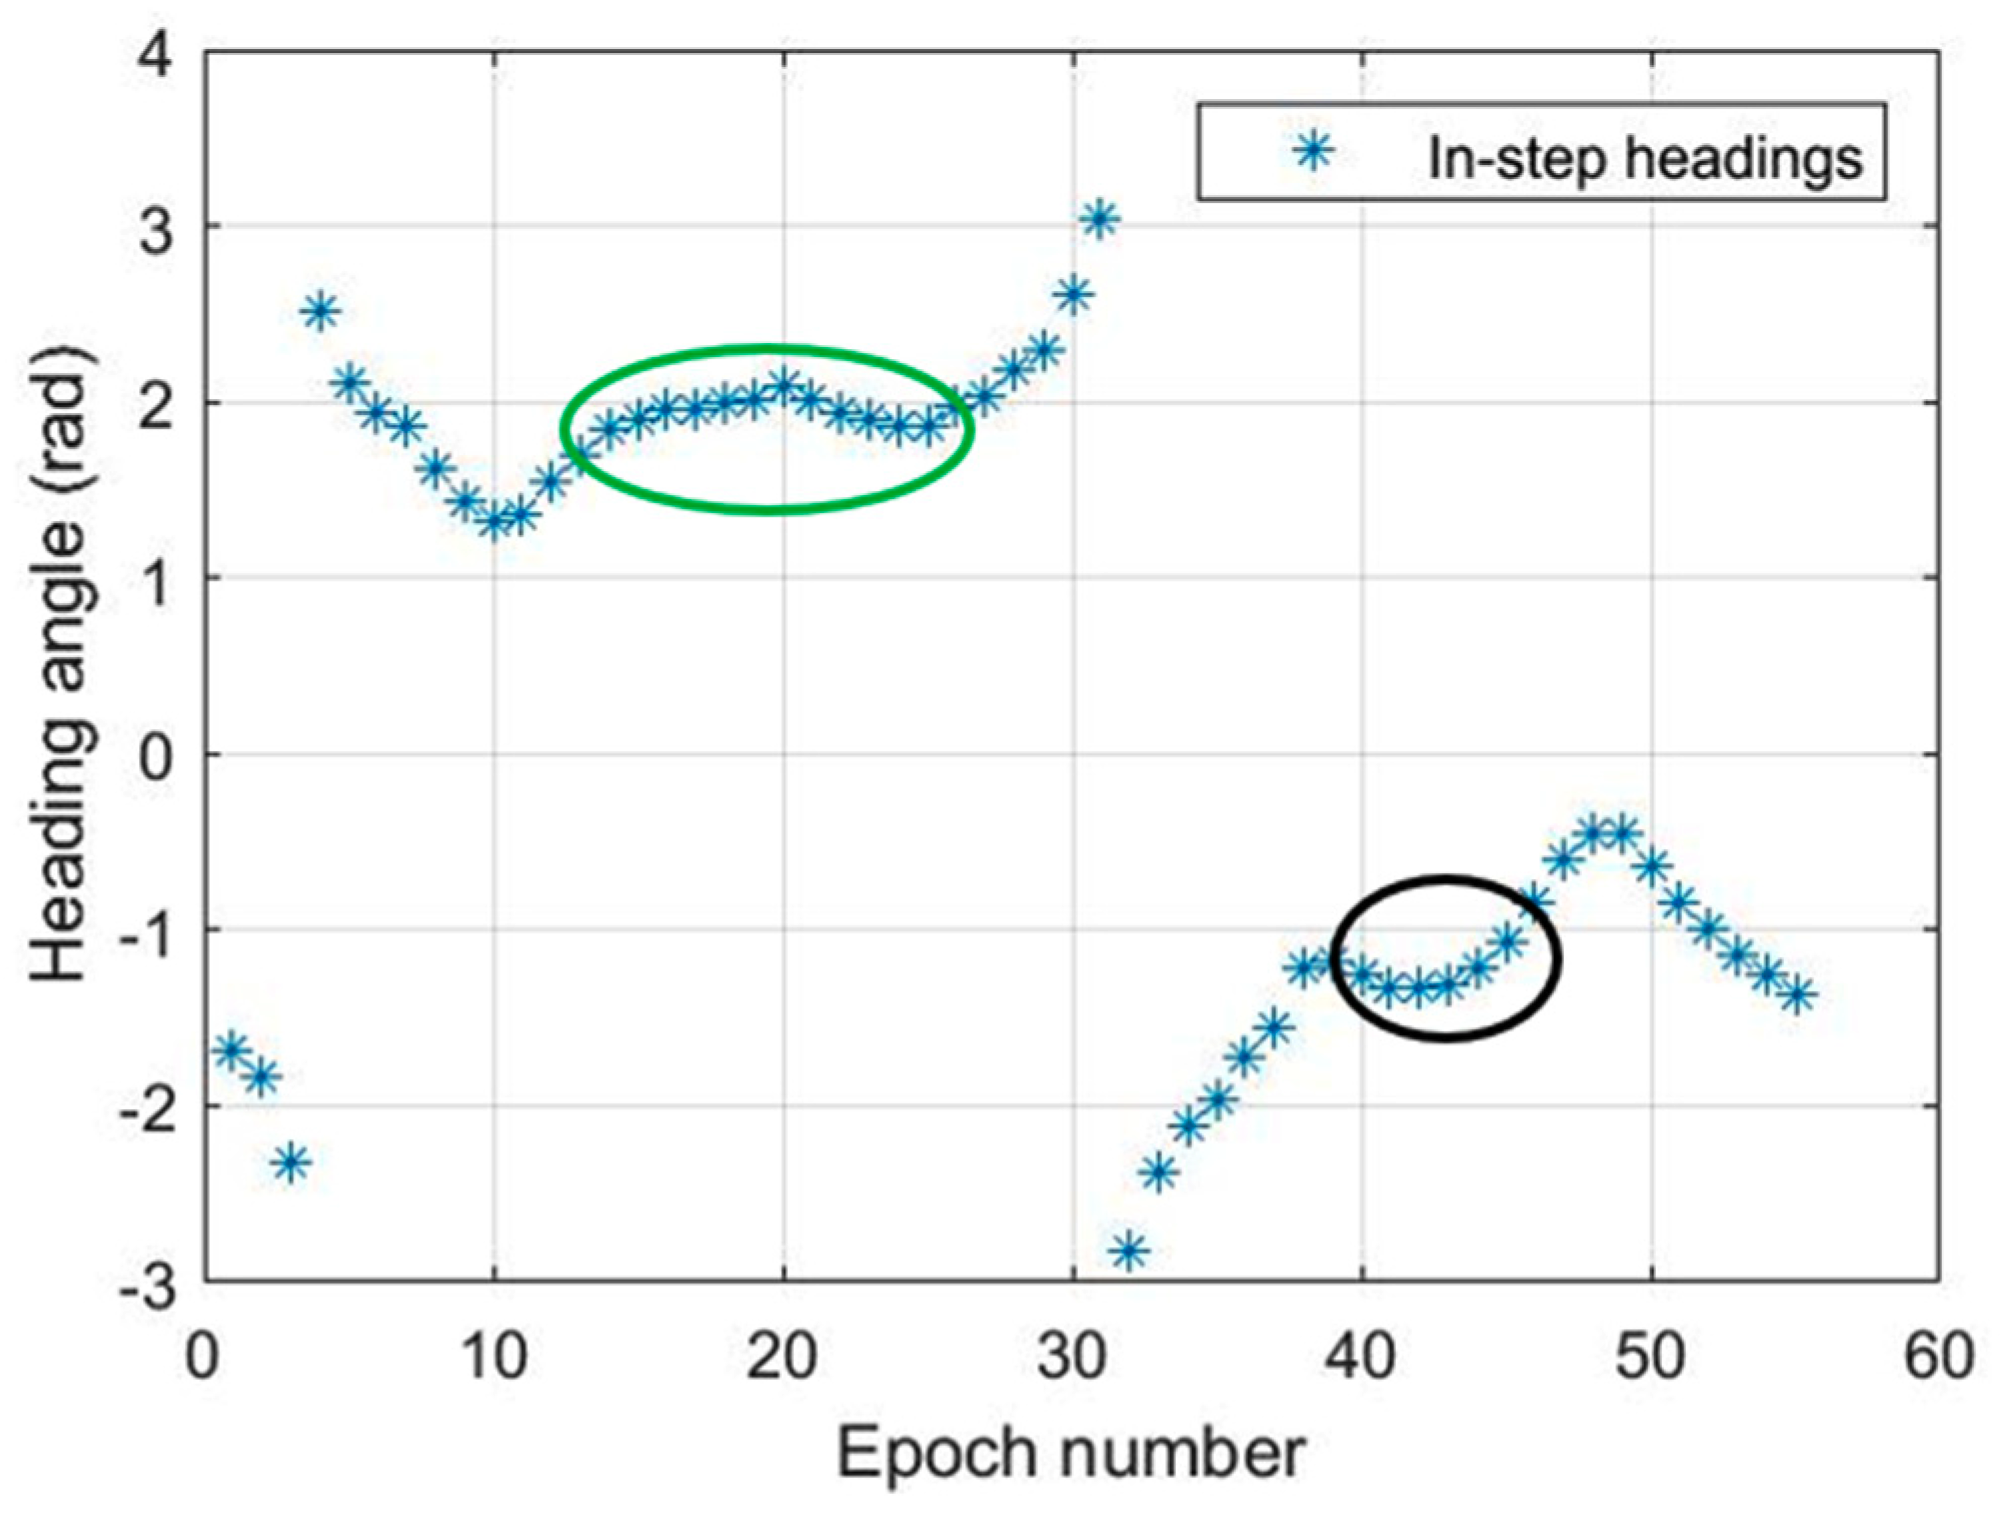
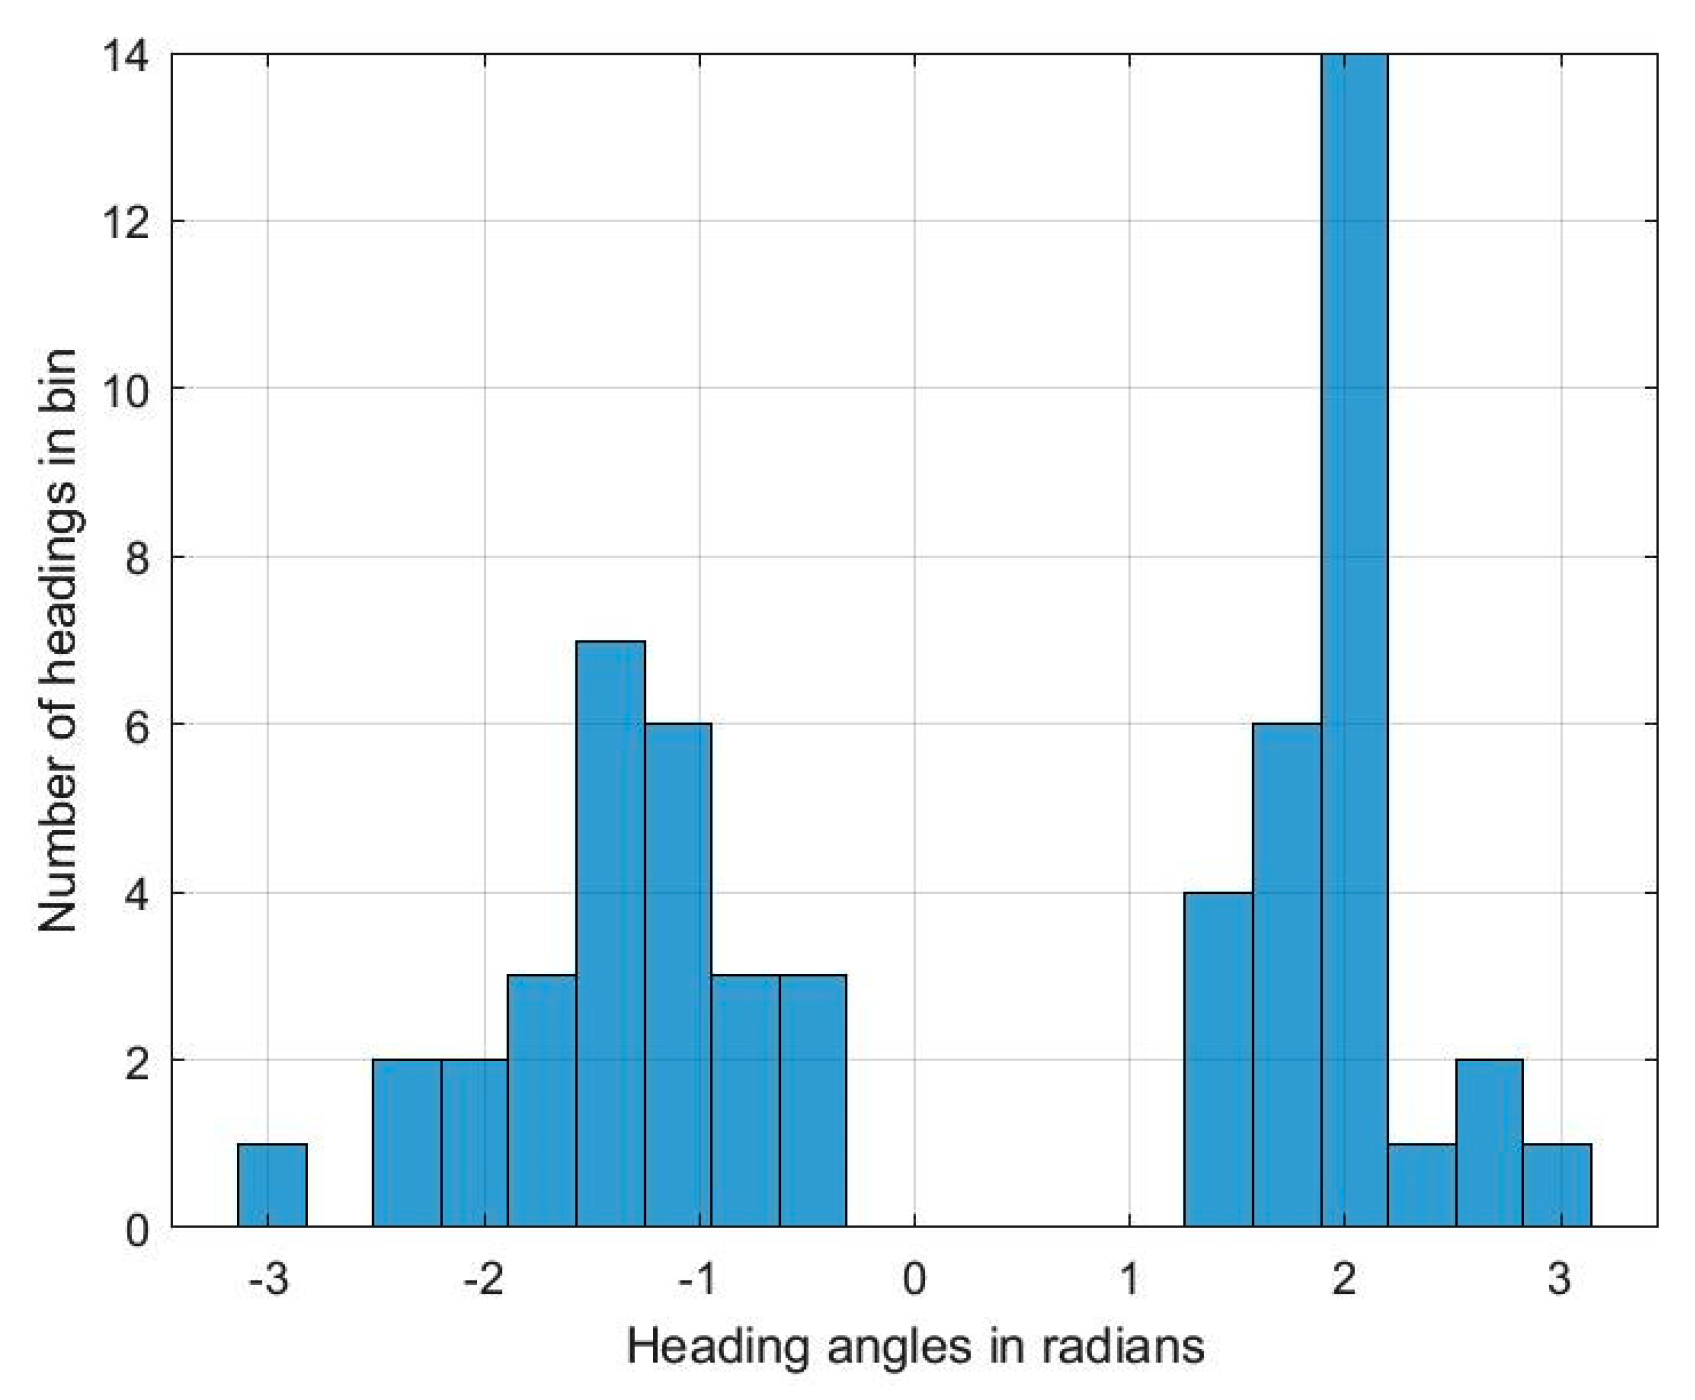
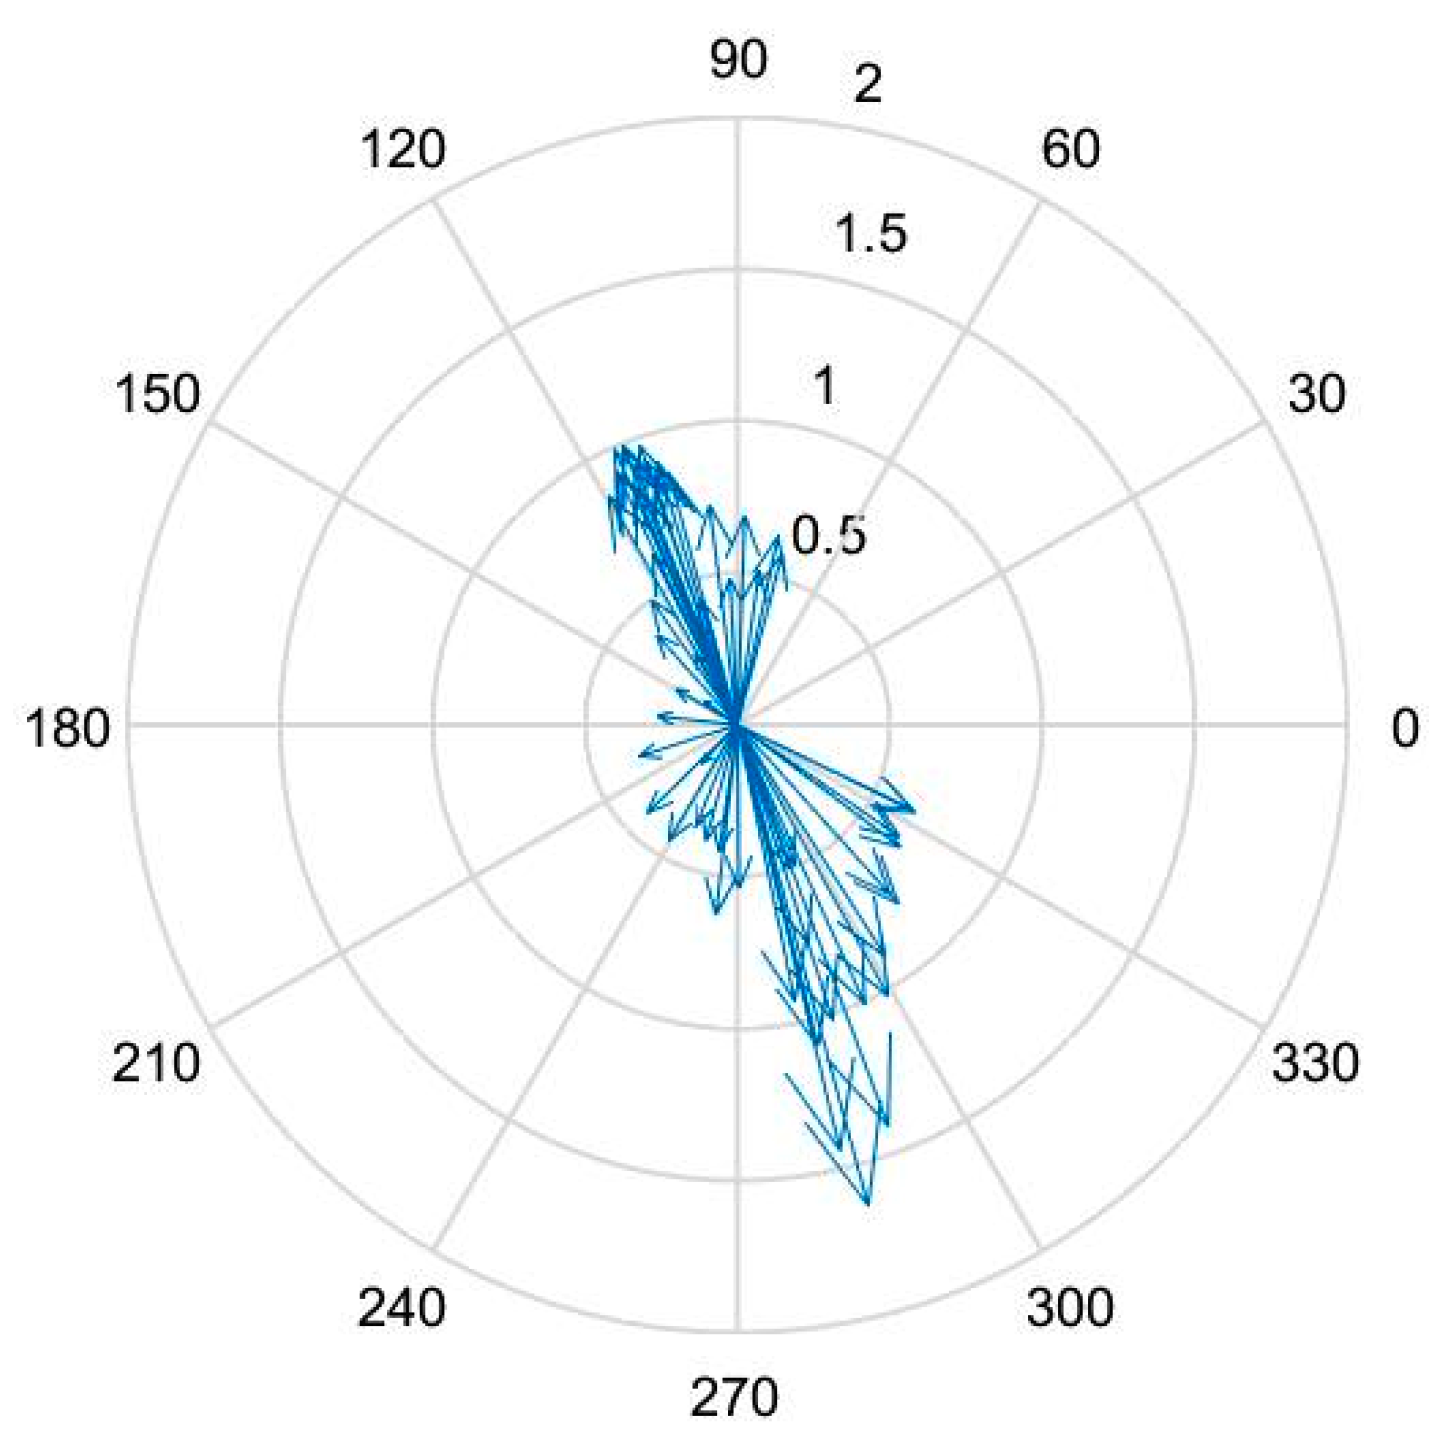
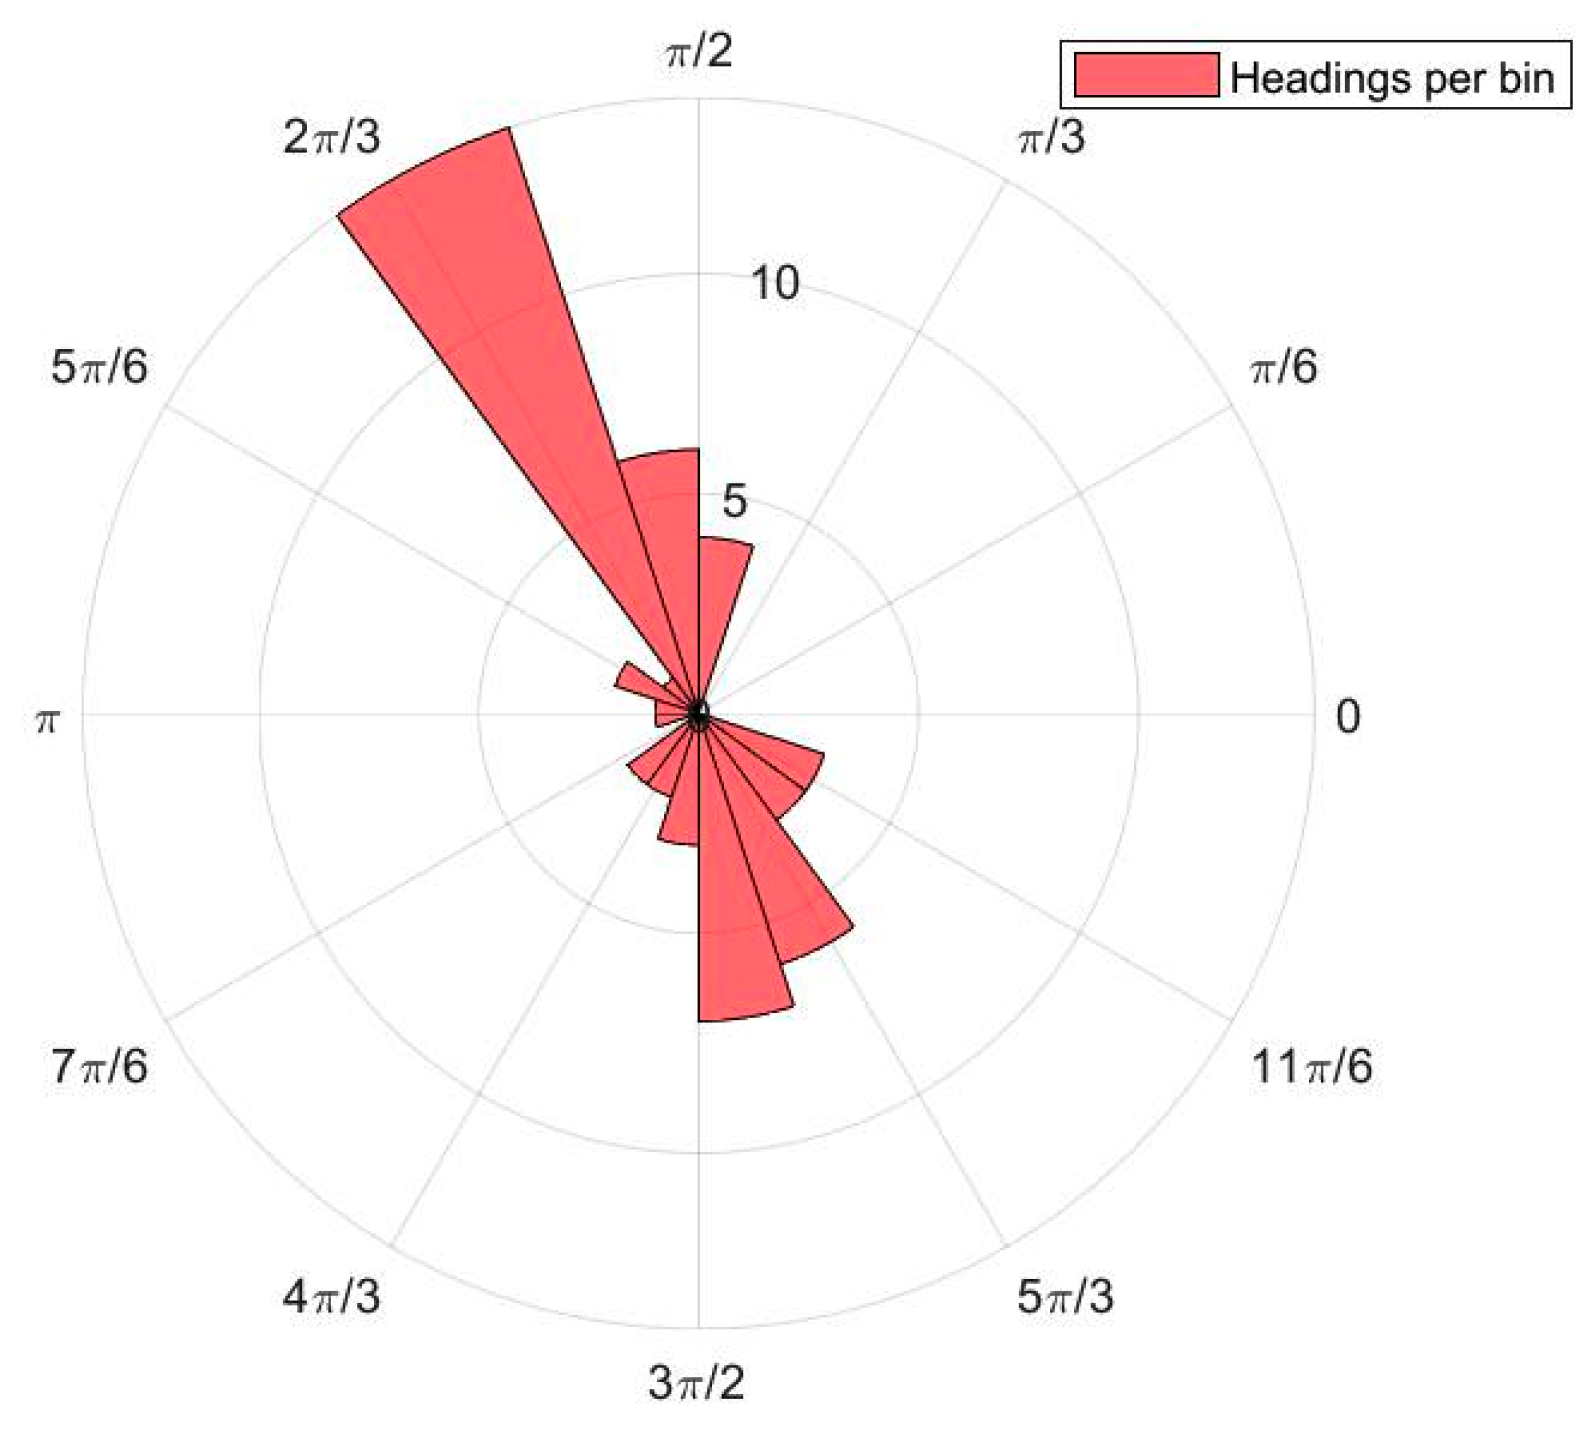
3.3.1. Outlier Rejection and Statistical Heading Estimation
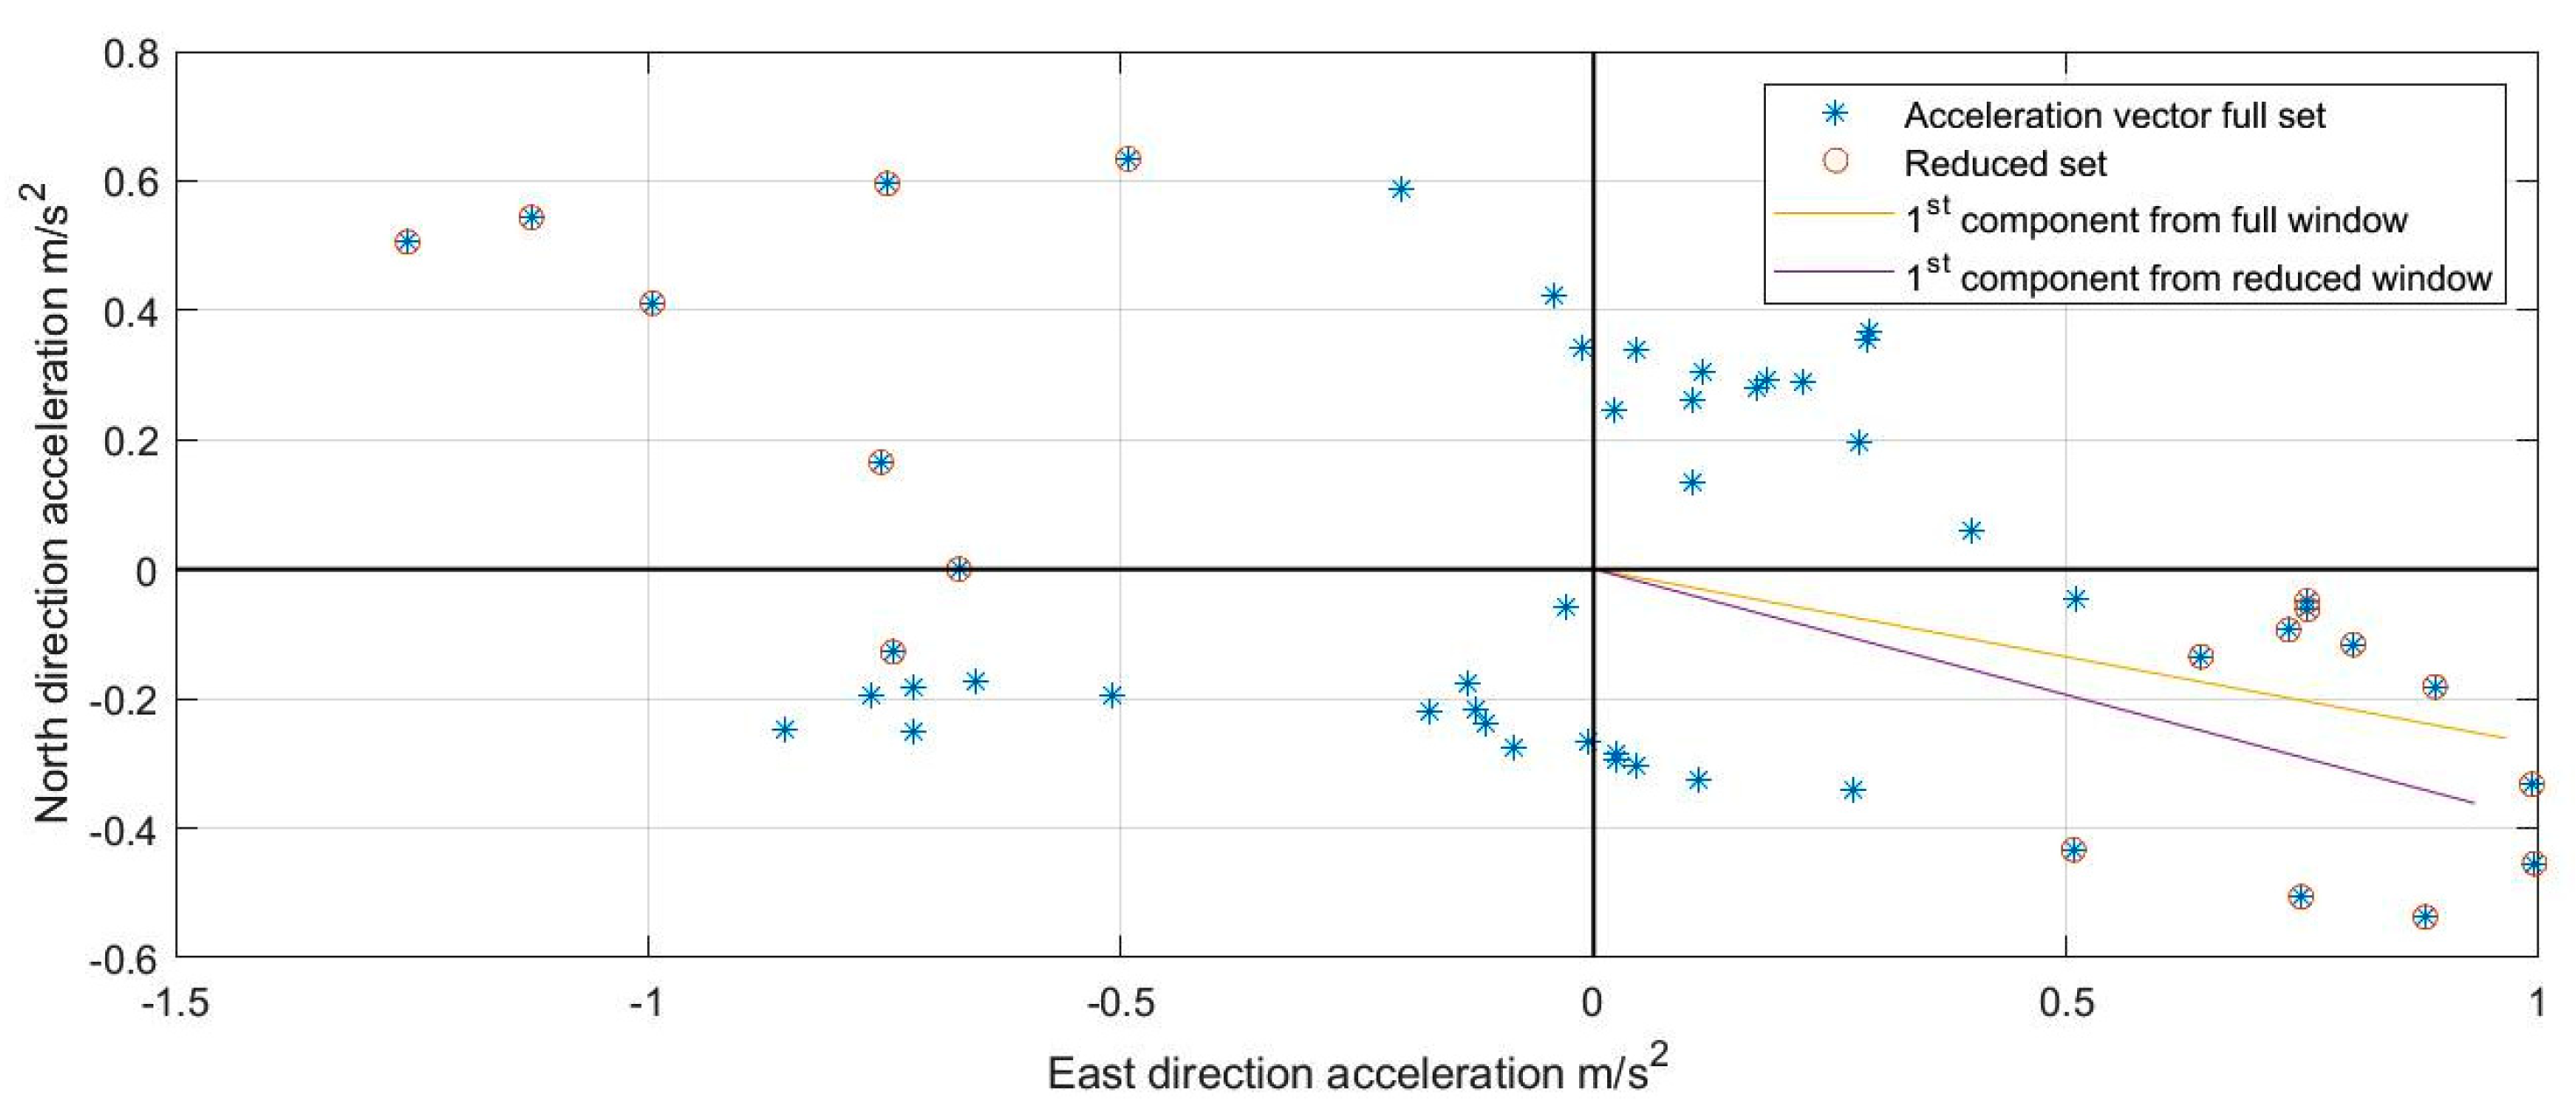
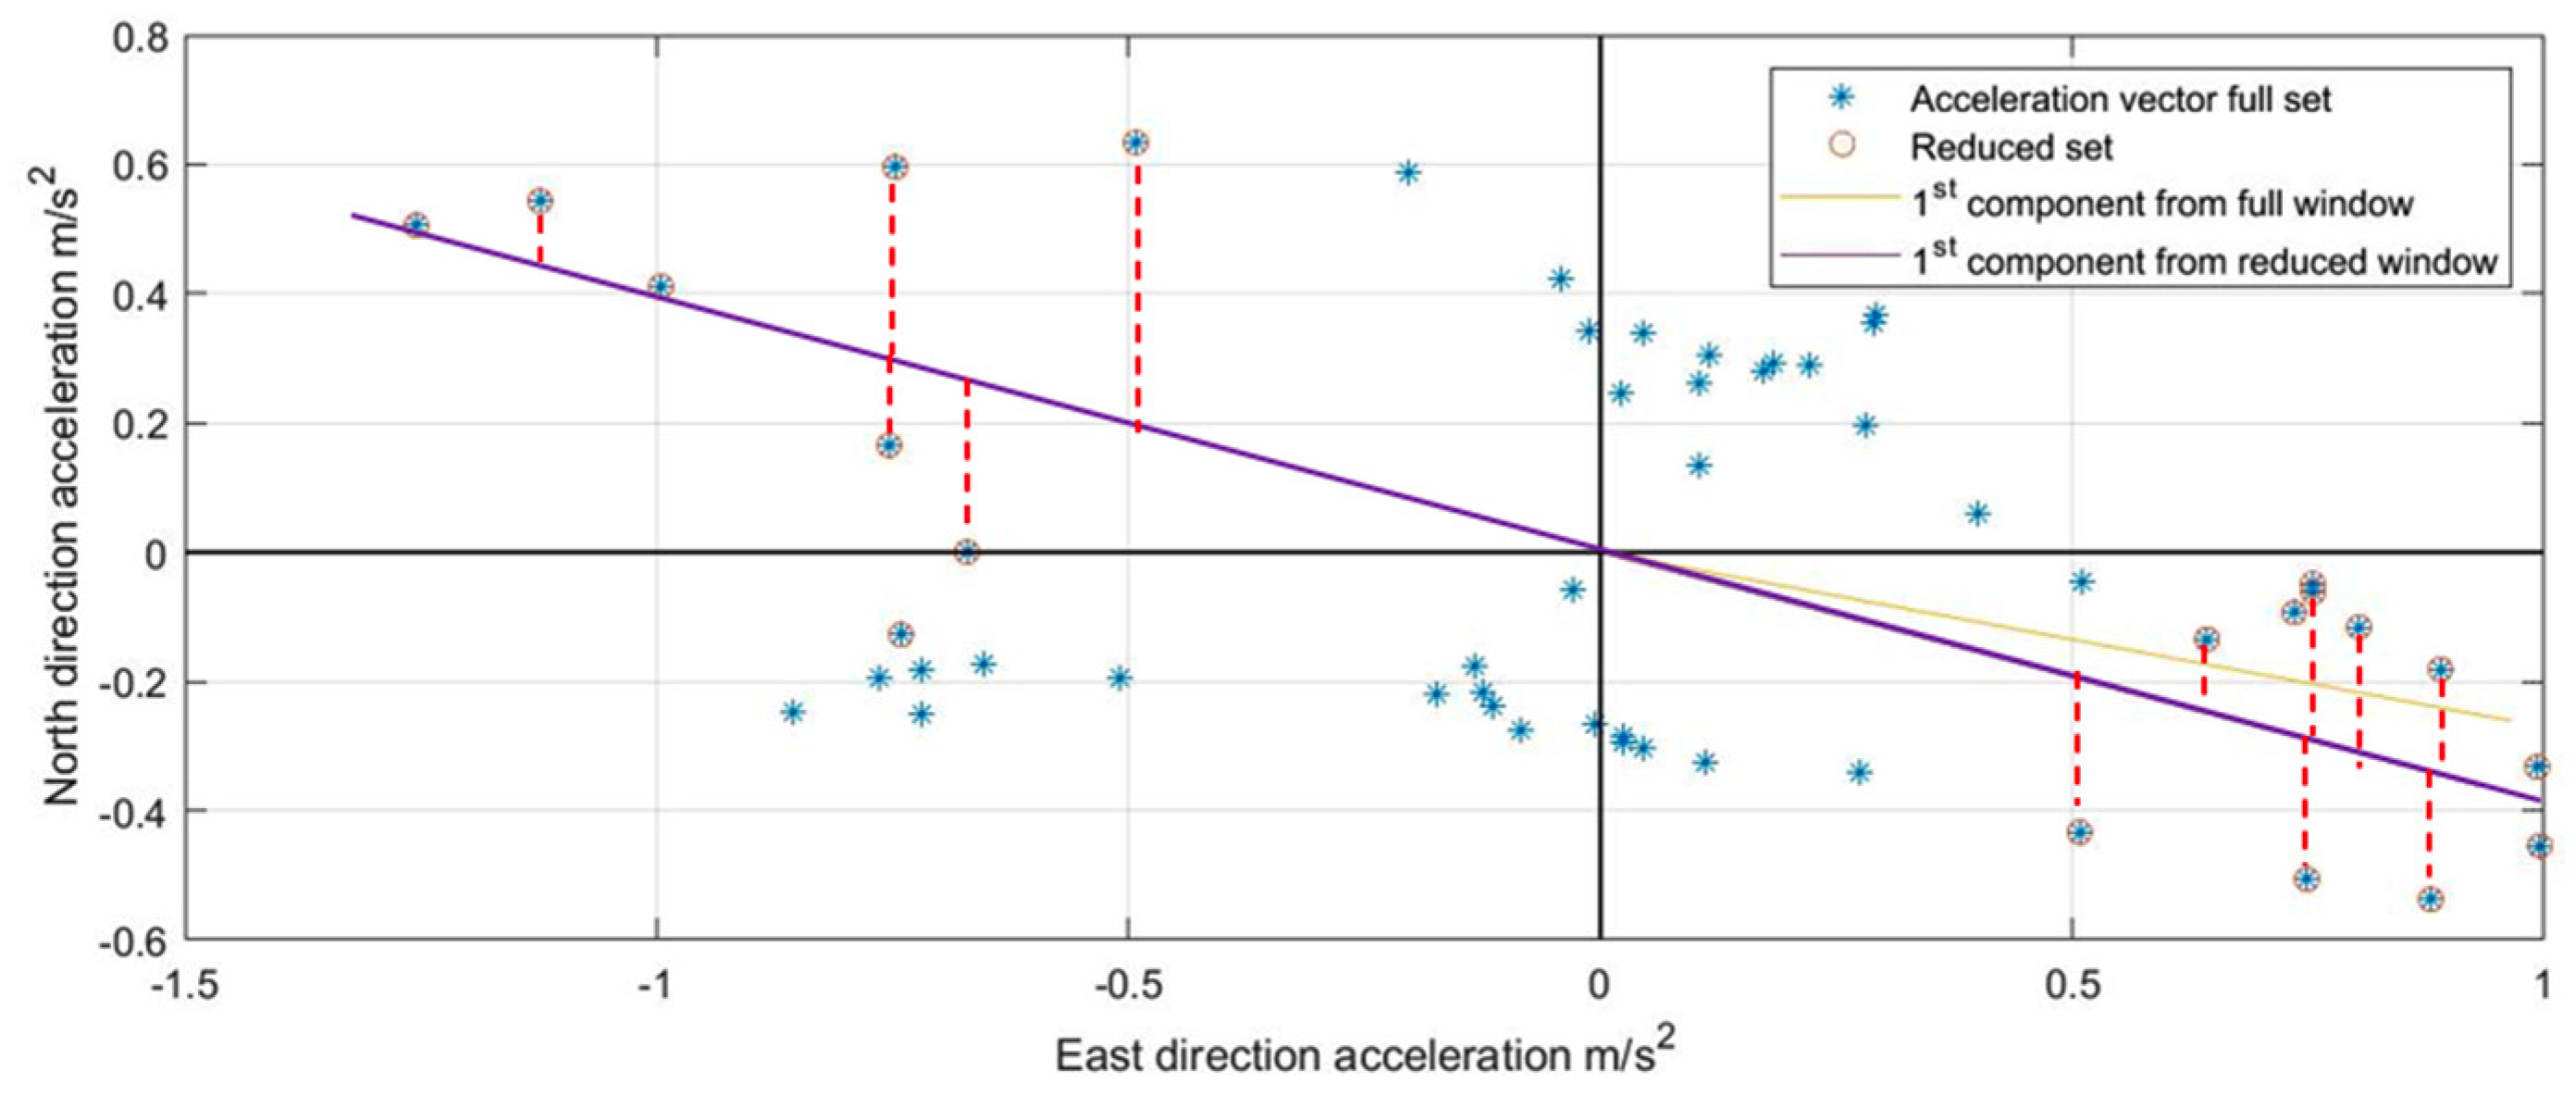
3.3.2. Reduced-Set Acceleration PCA
| Algorithm 1. Heading Estimation () |
------ Statistical heading extraction -------
|
3.4. Step Length Estimation
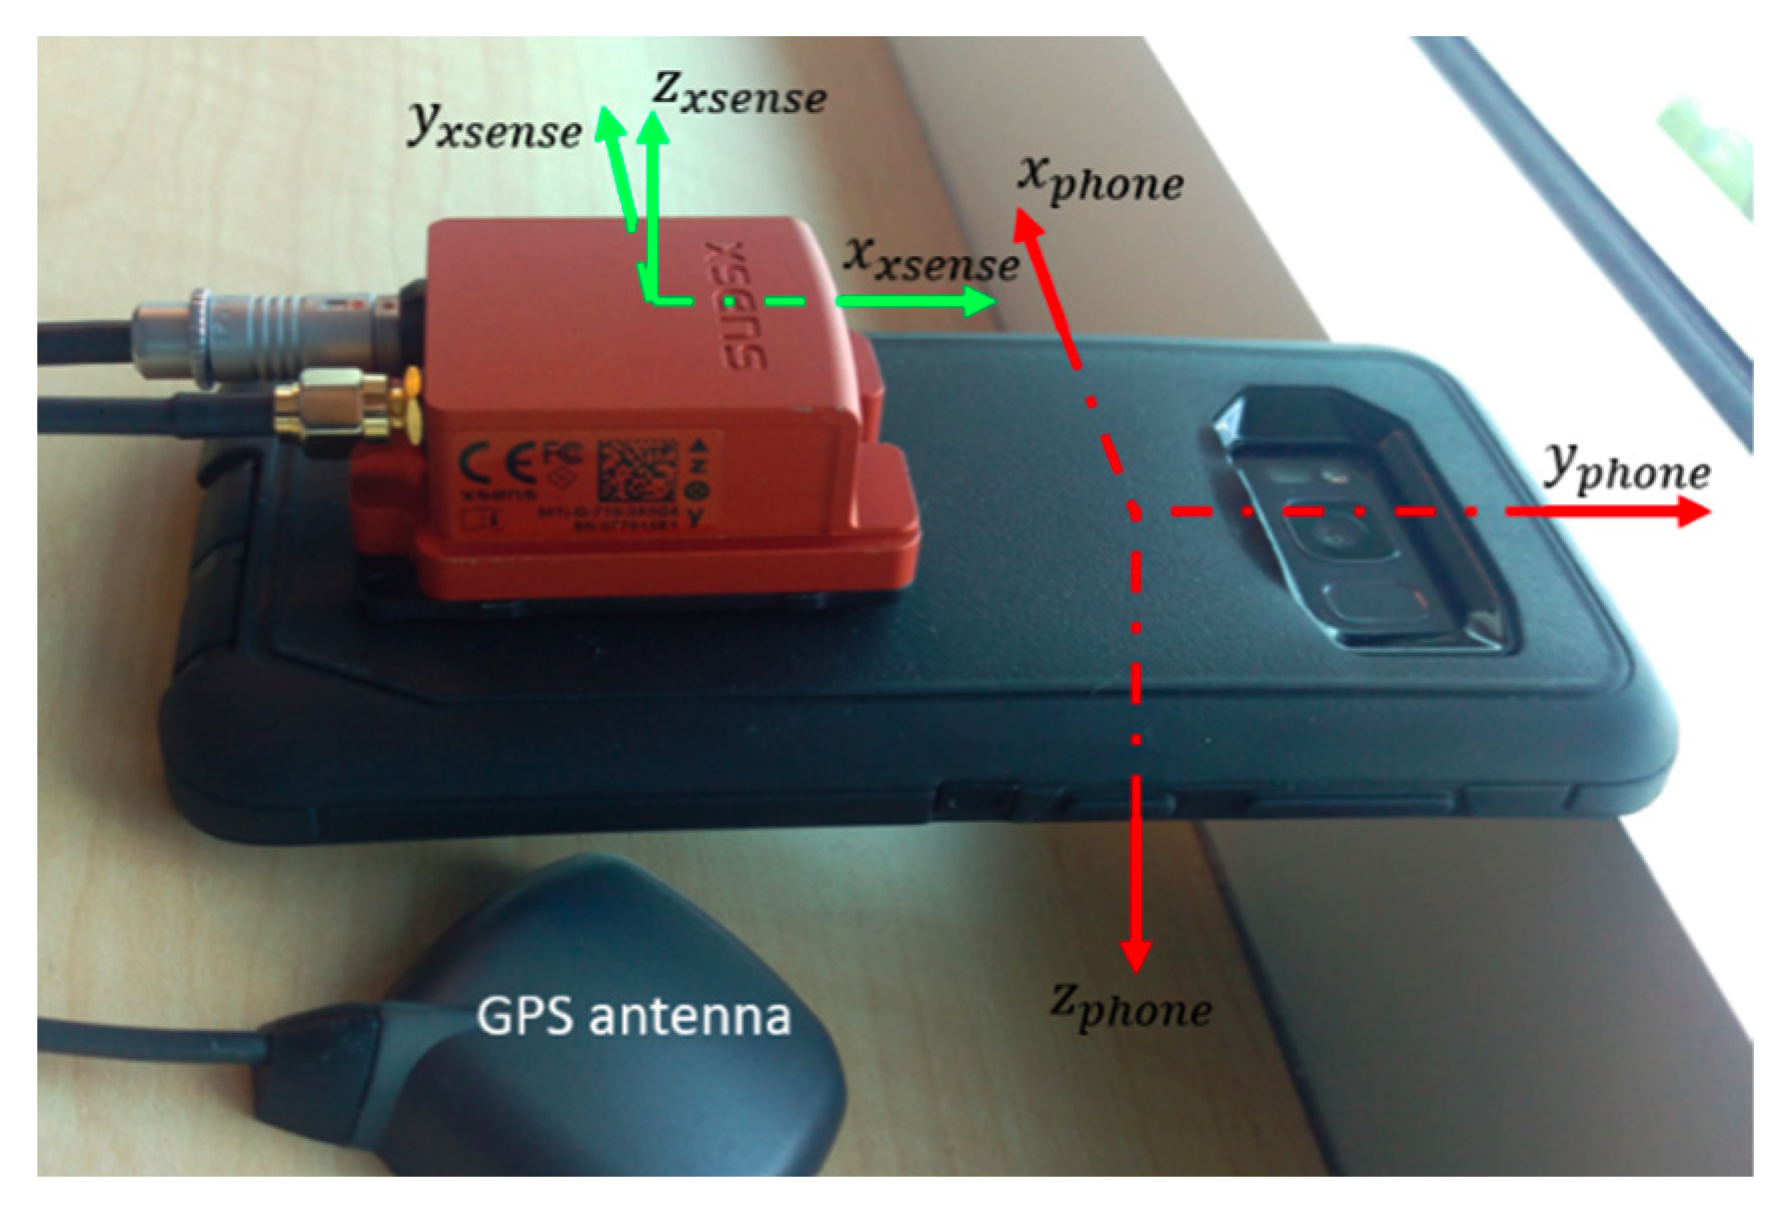
4. Experimental Setup
5. Results and Discussion
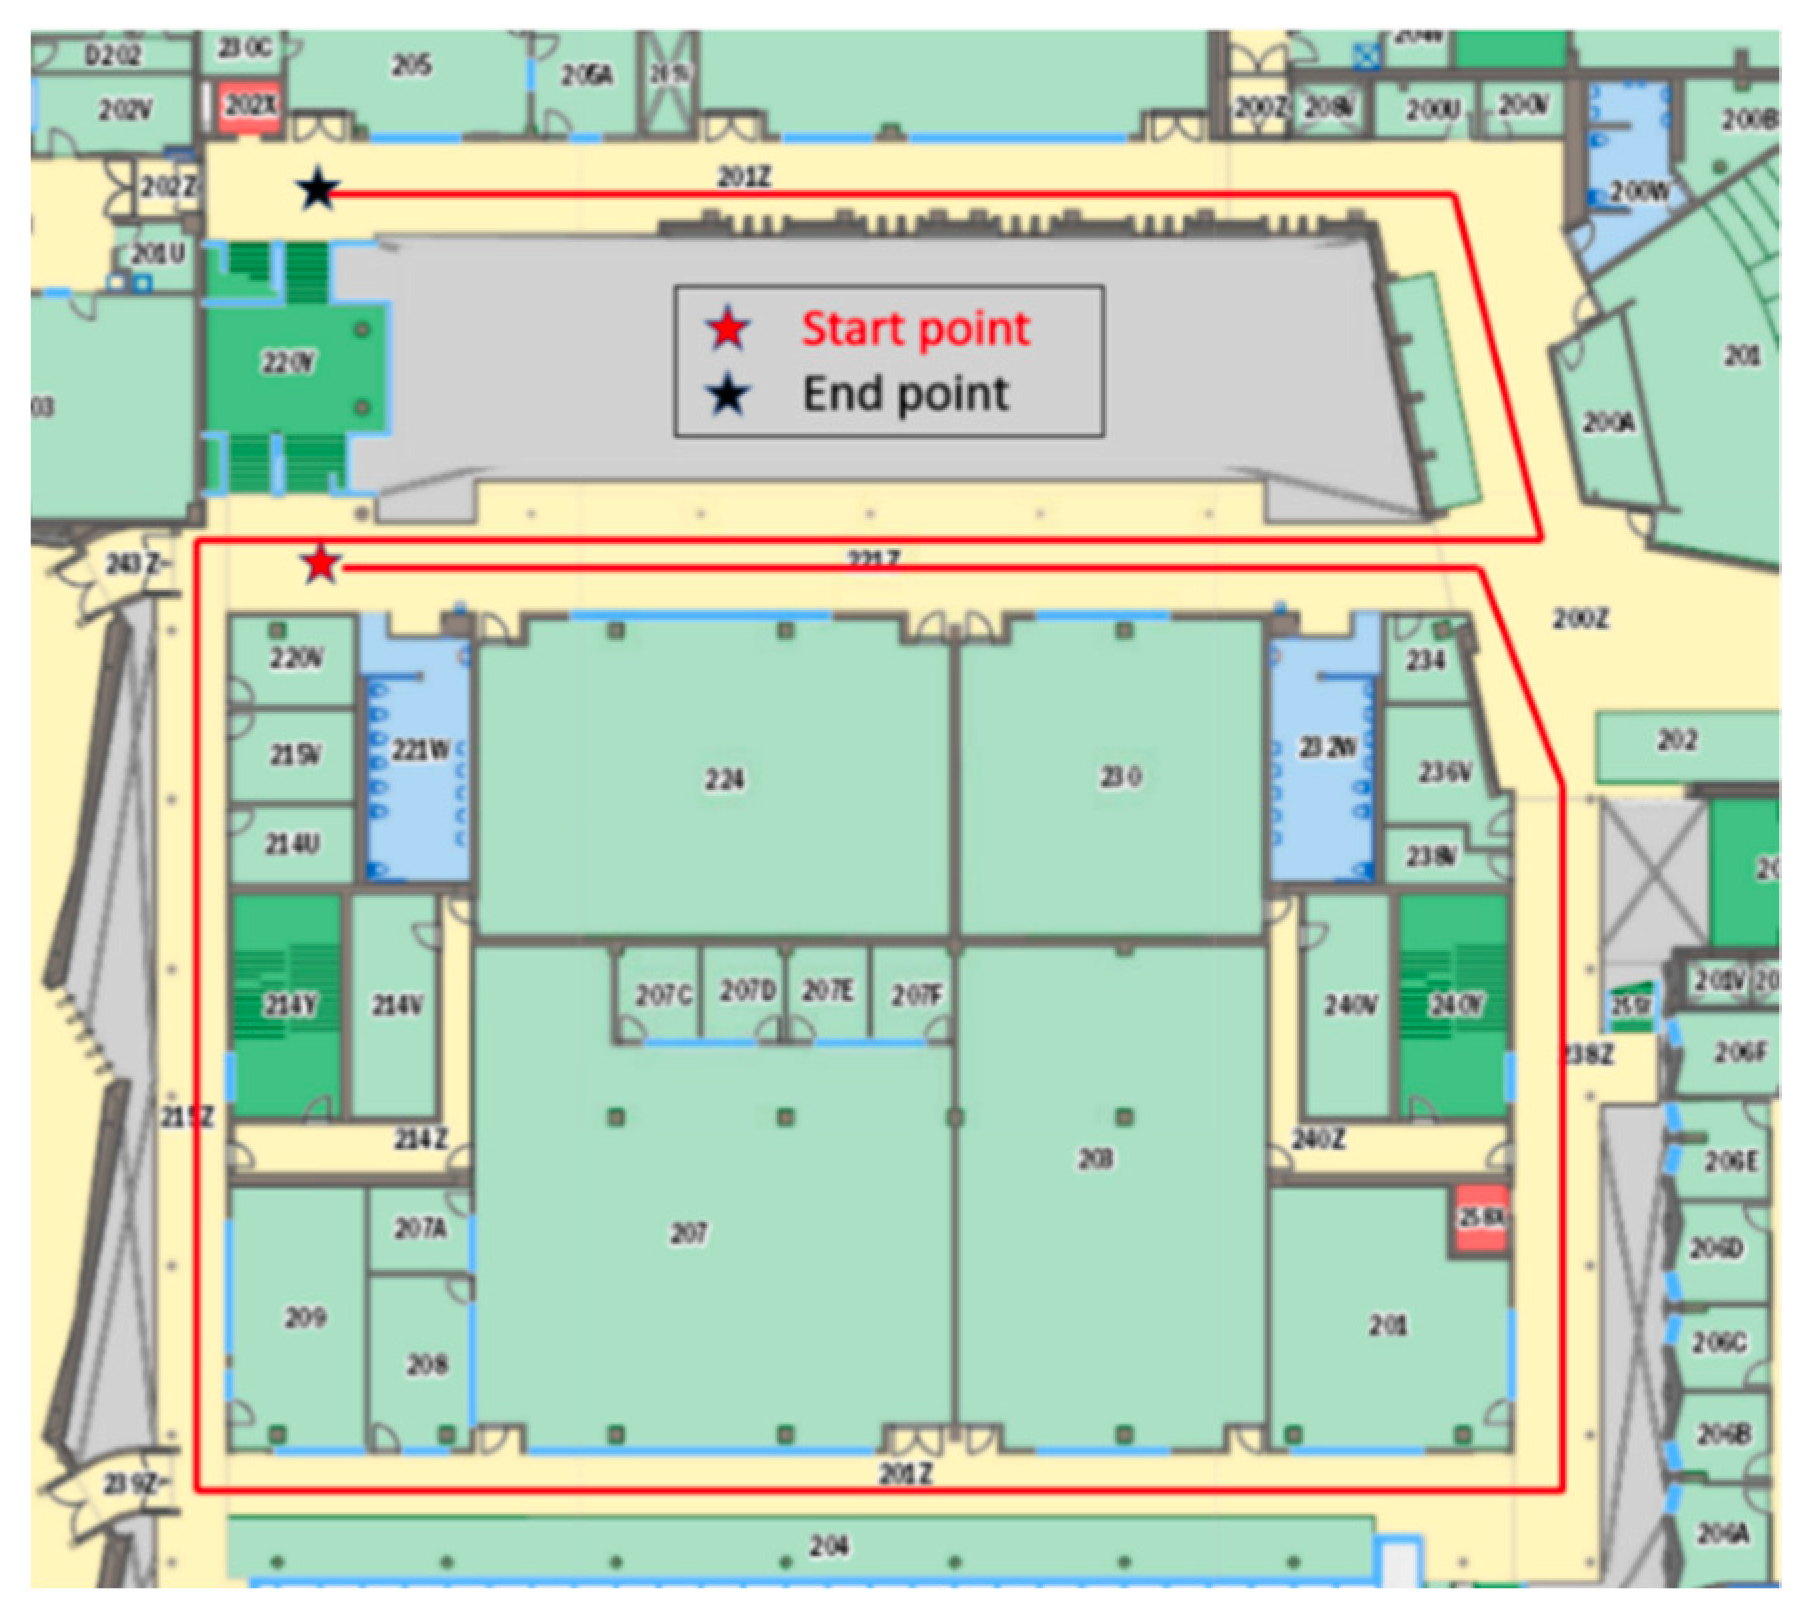
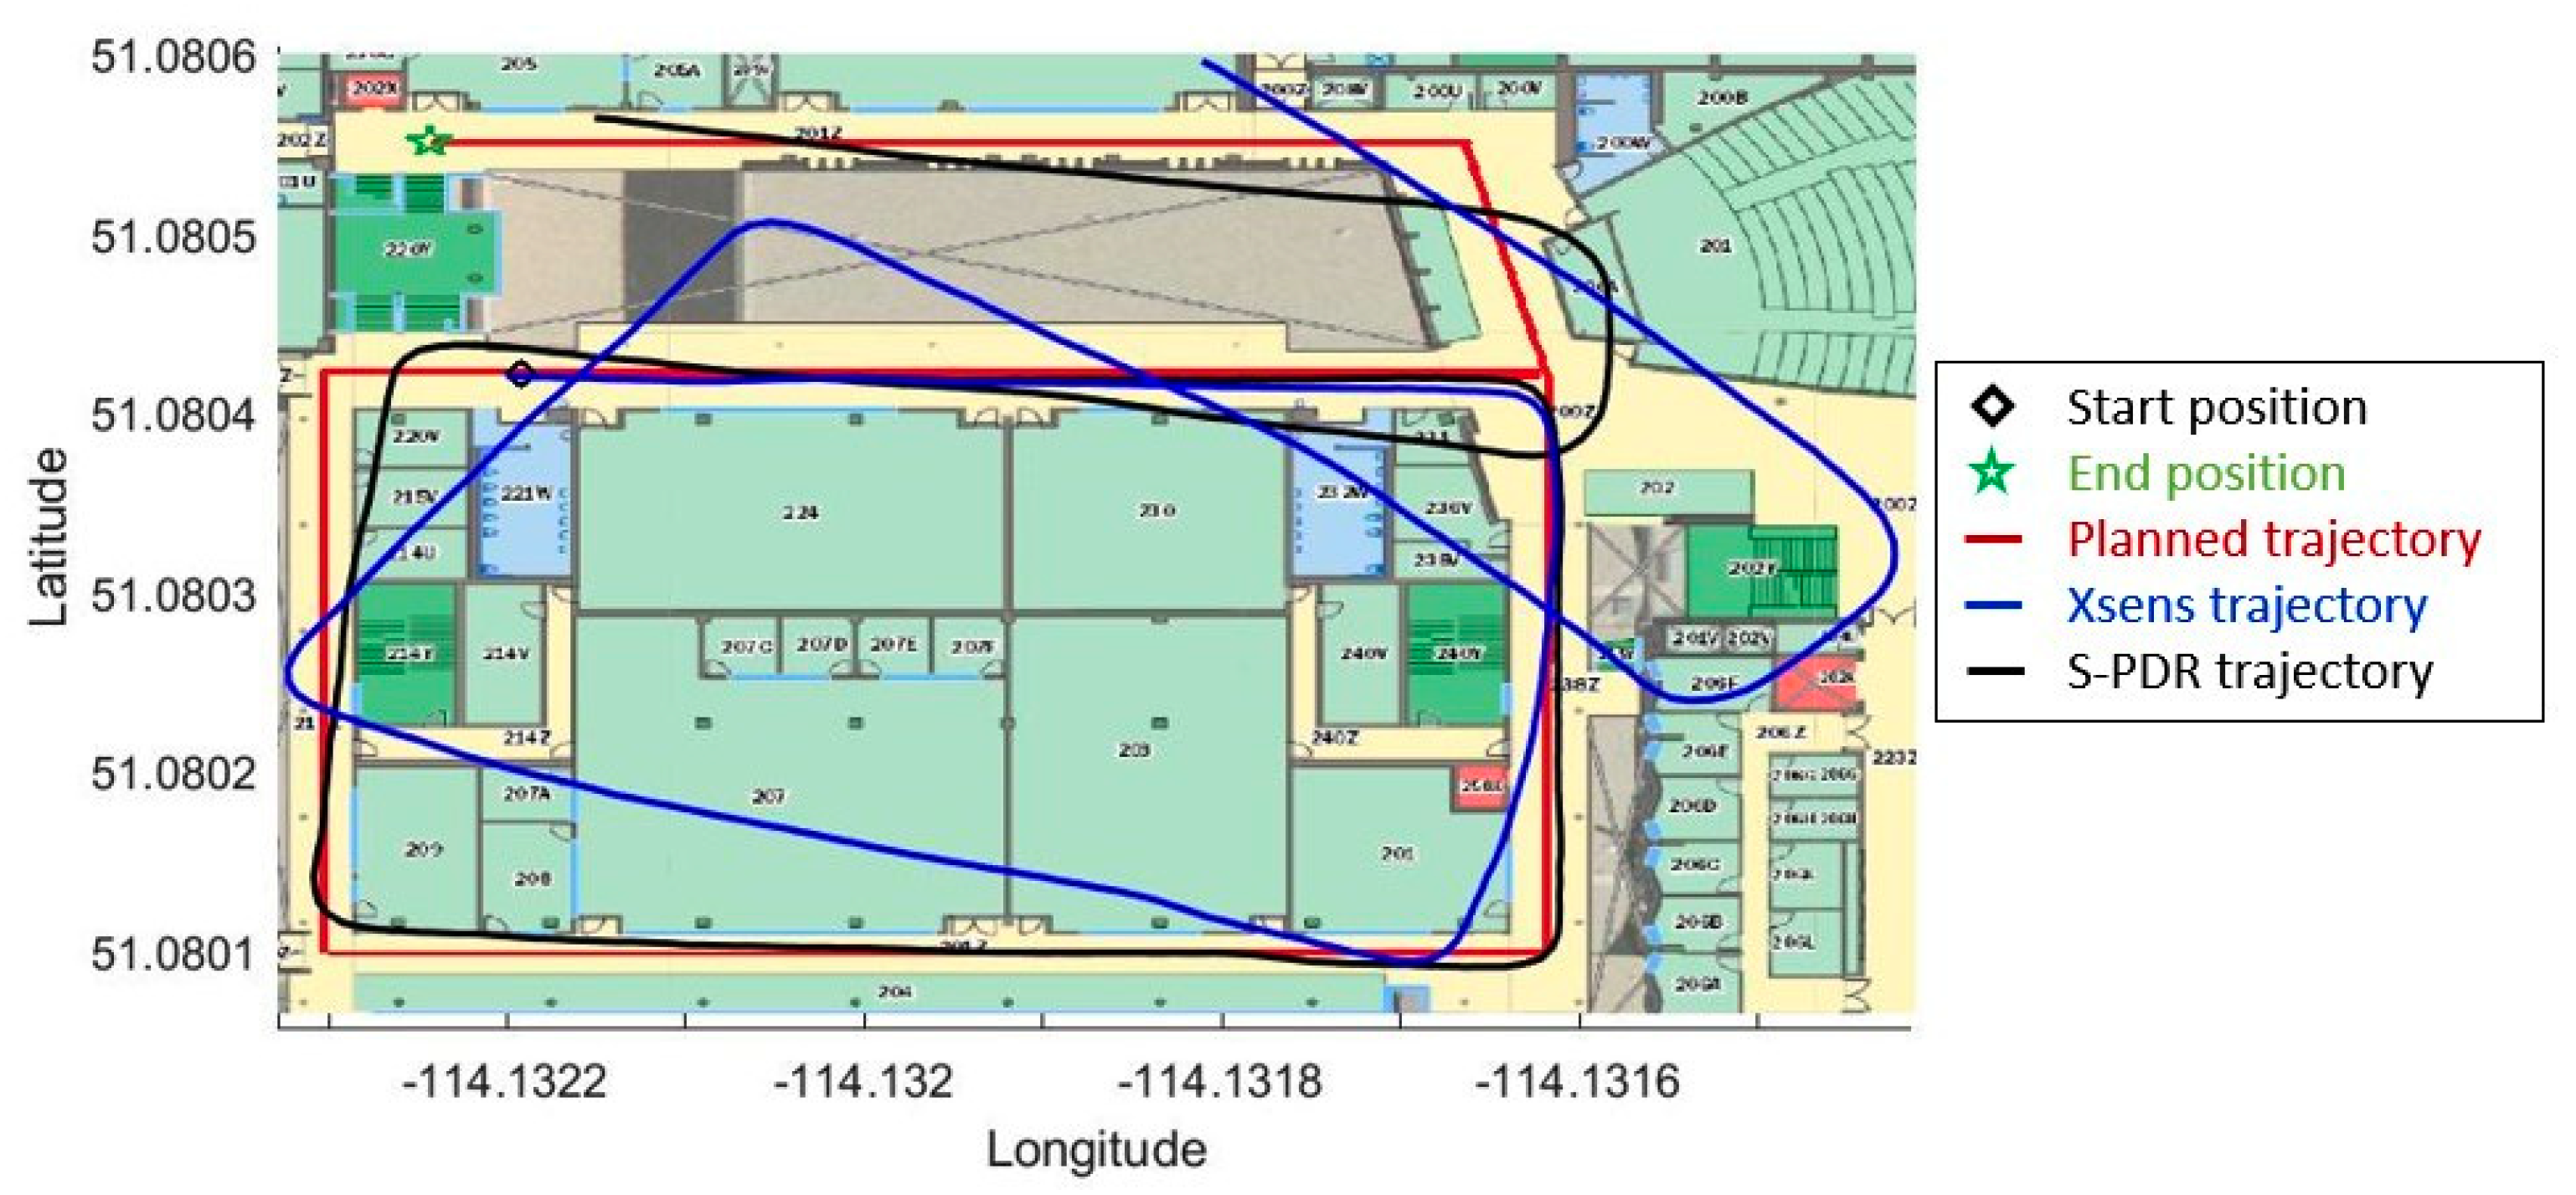
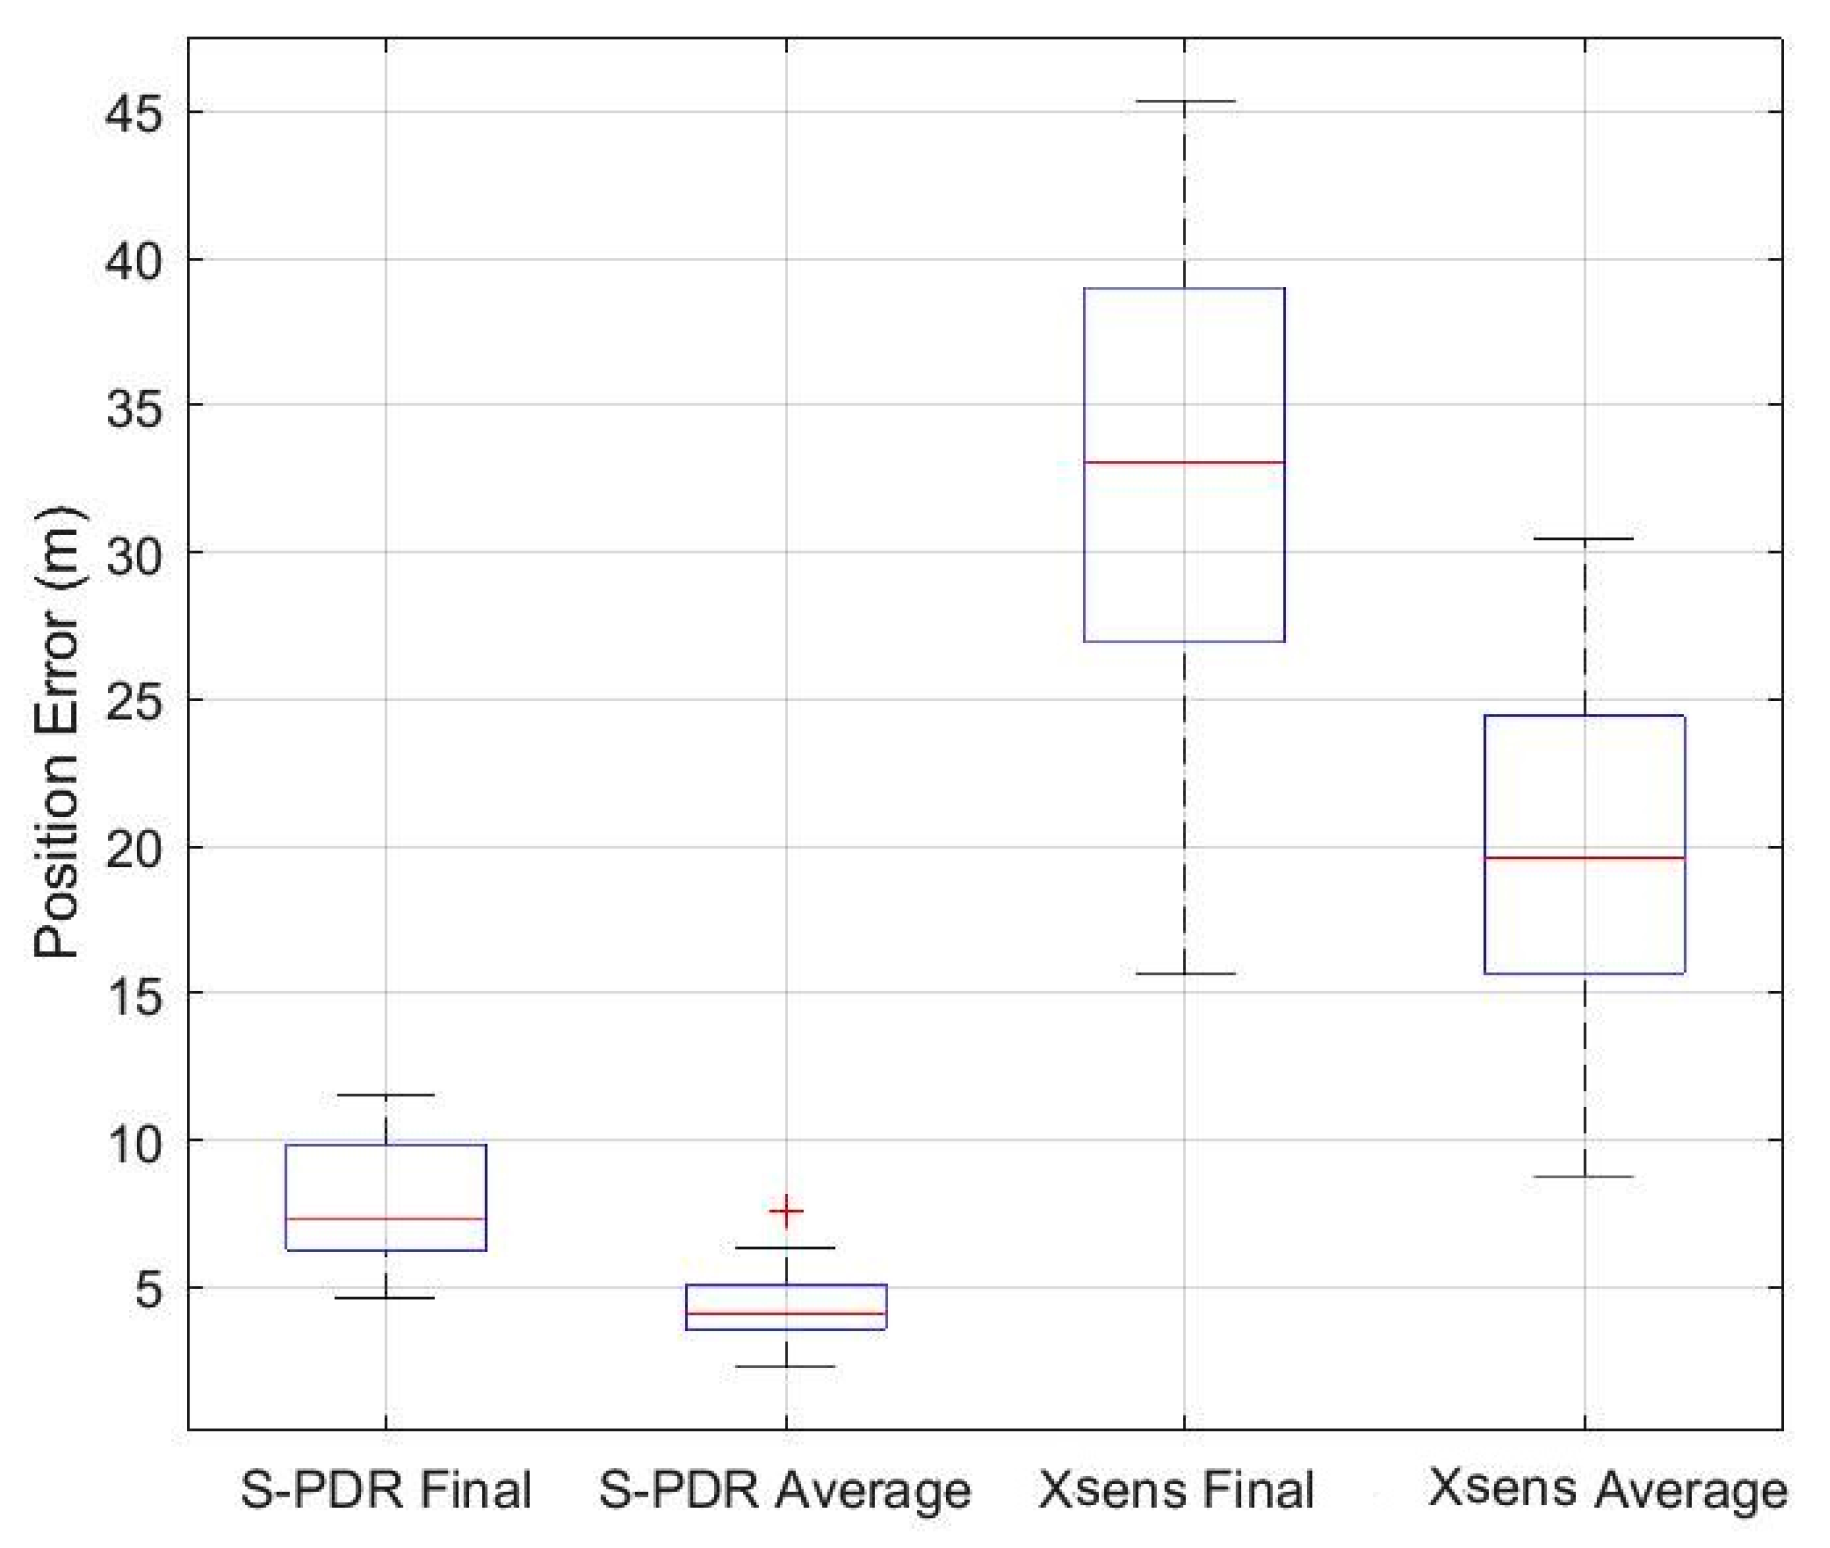
5.1. Indoor Test
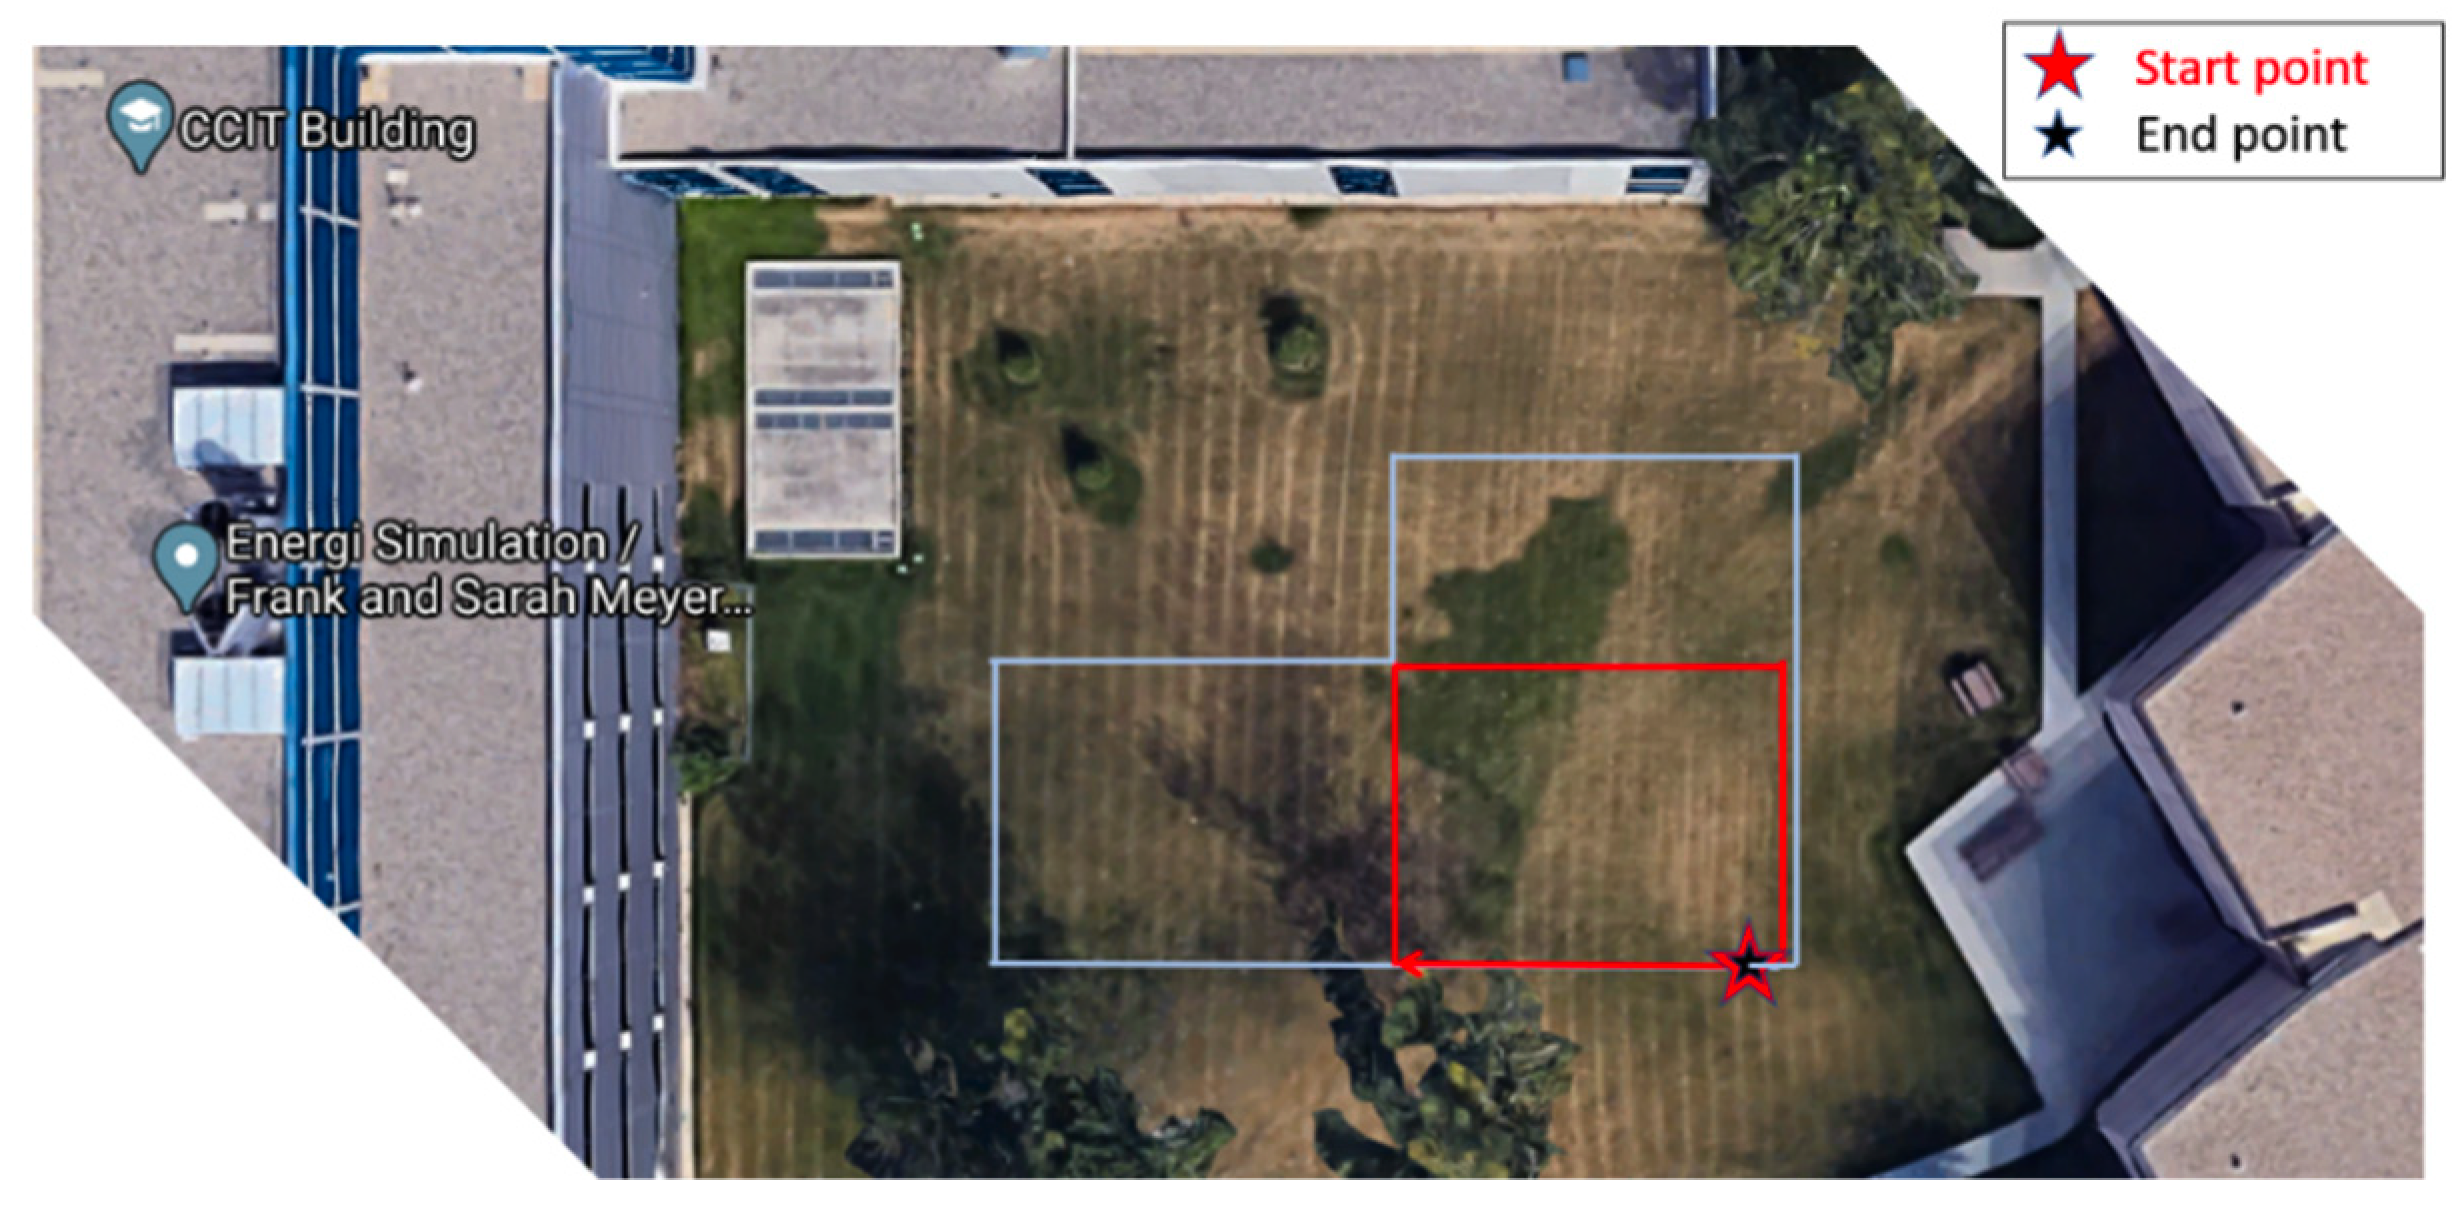
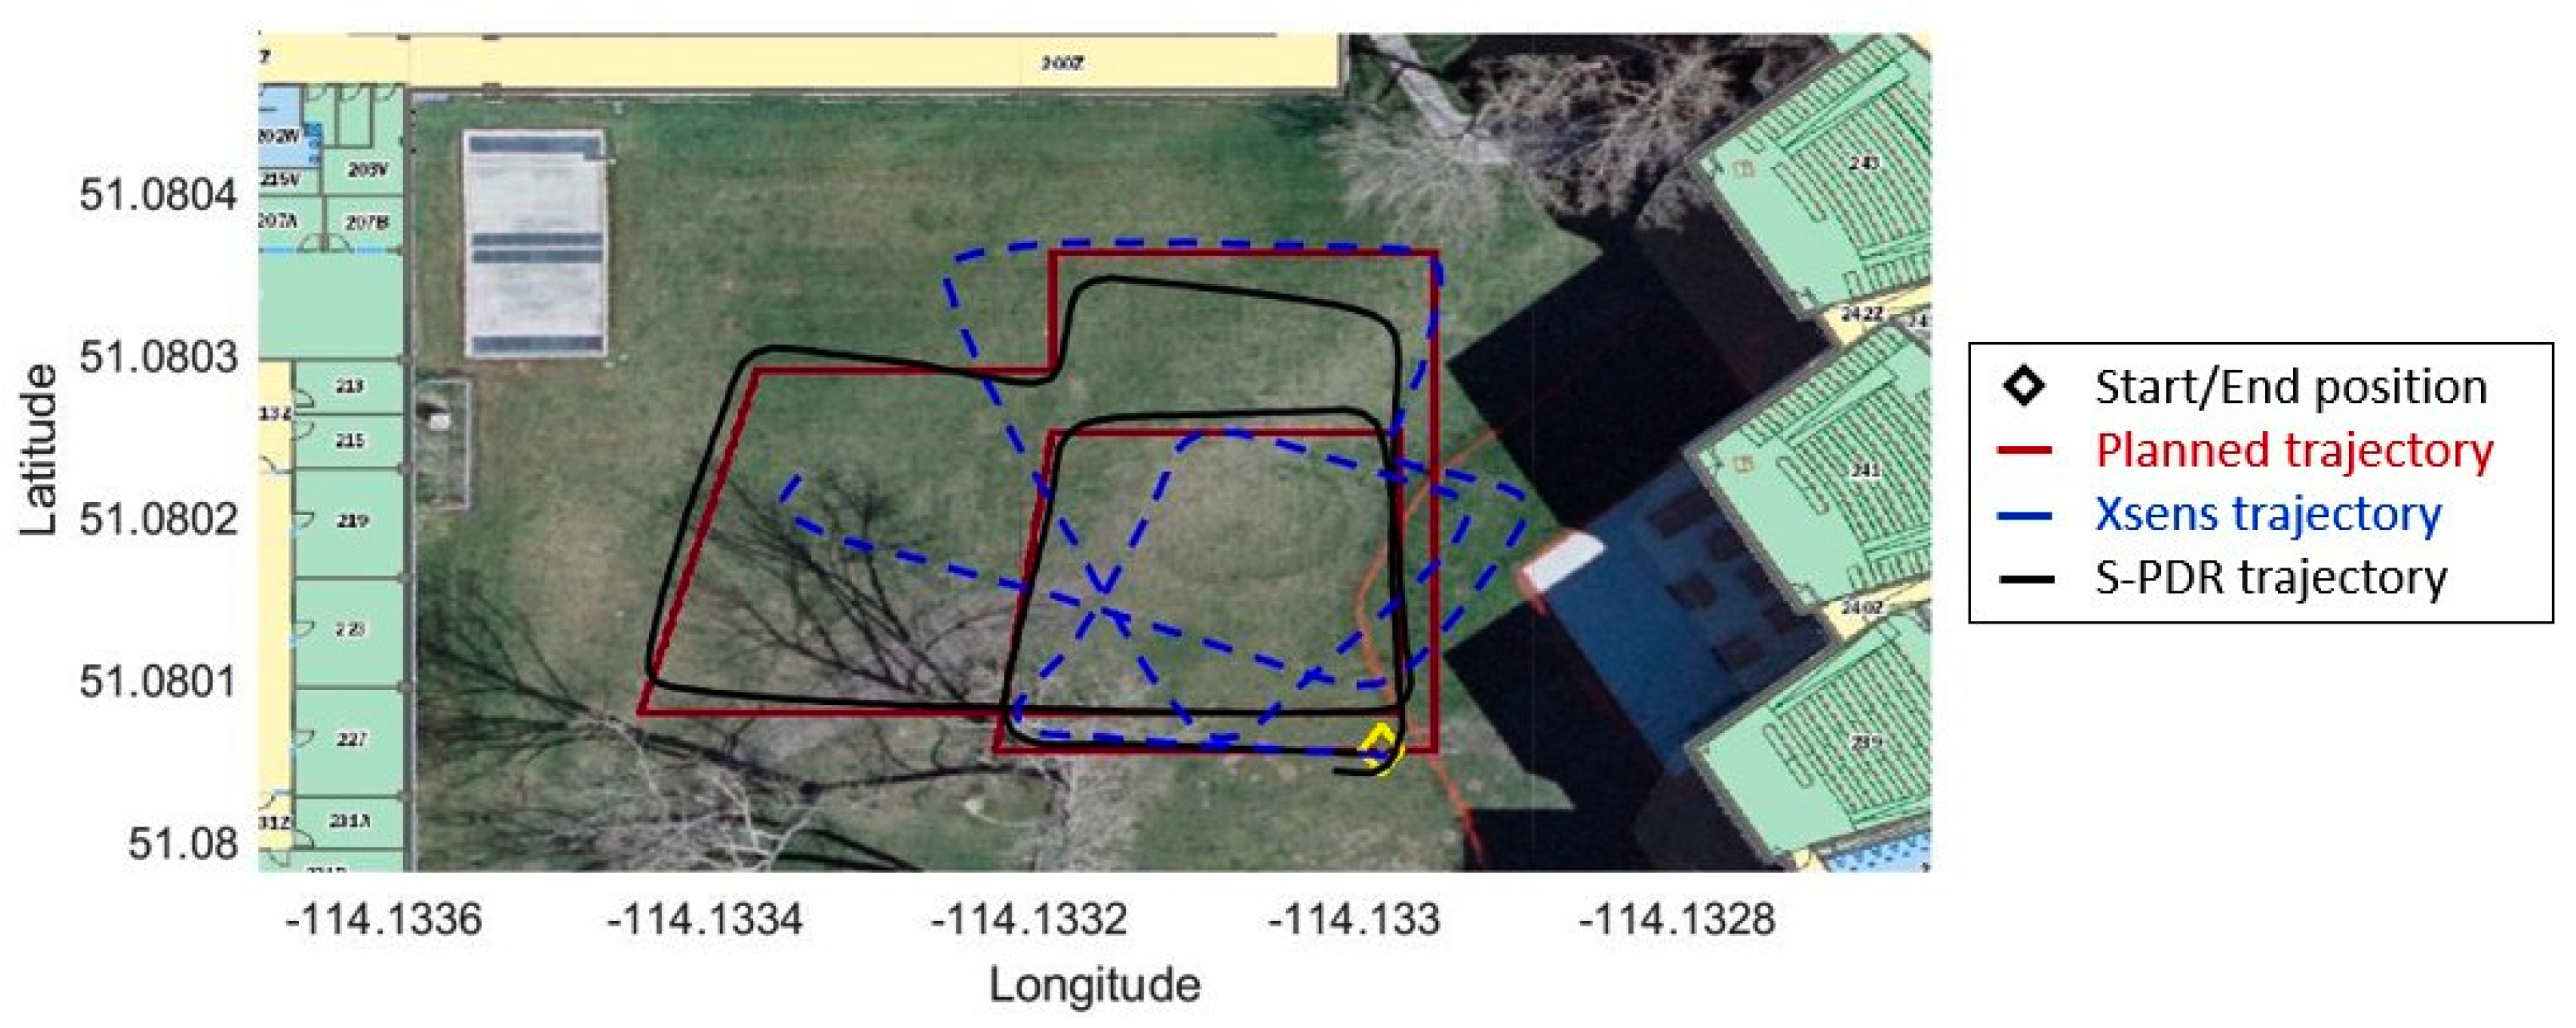
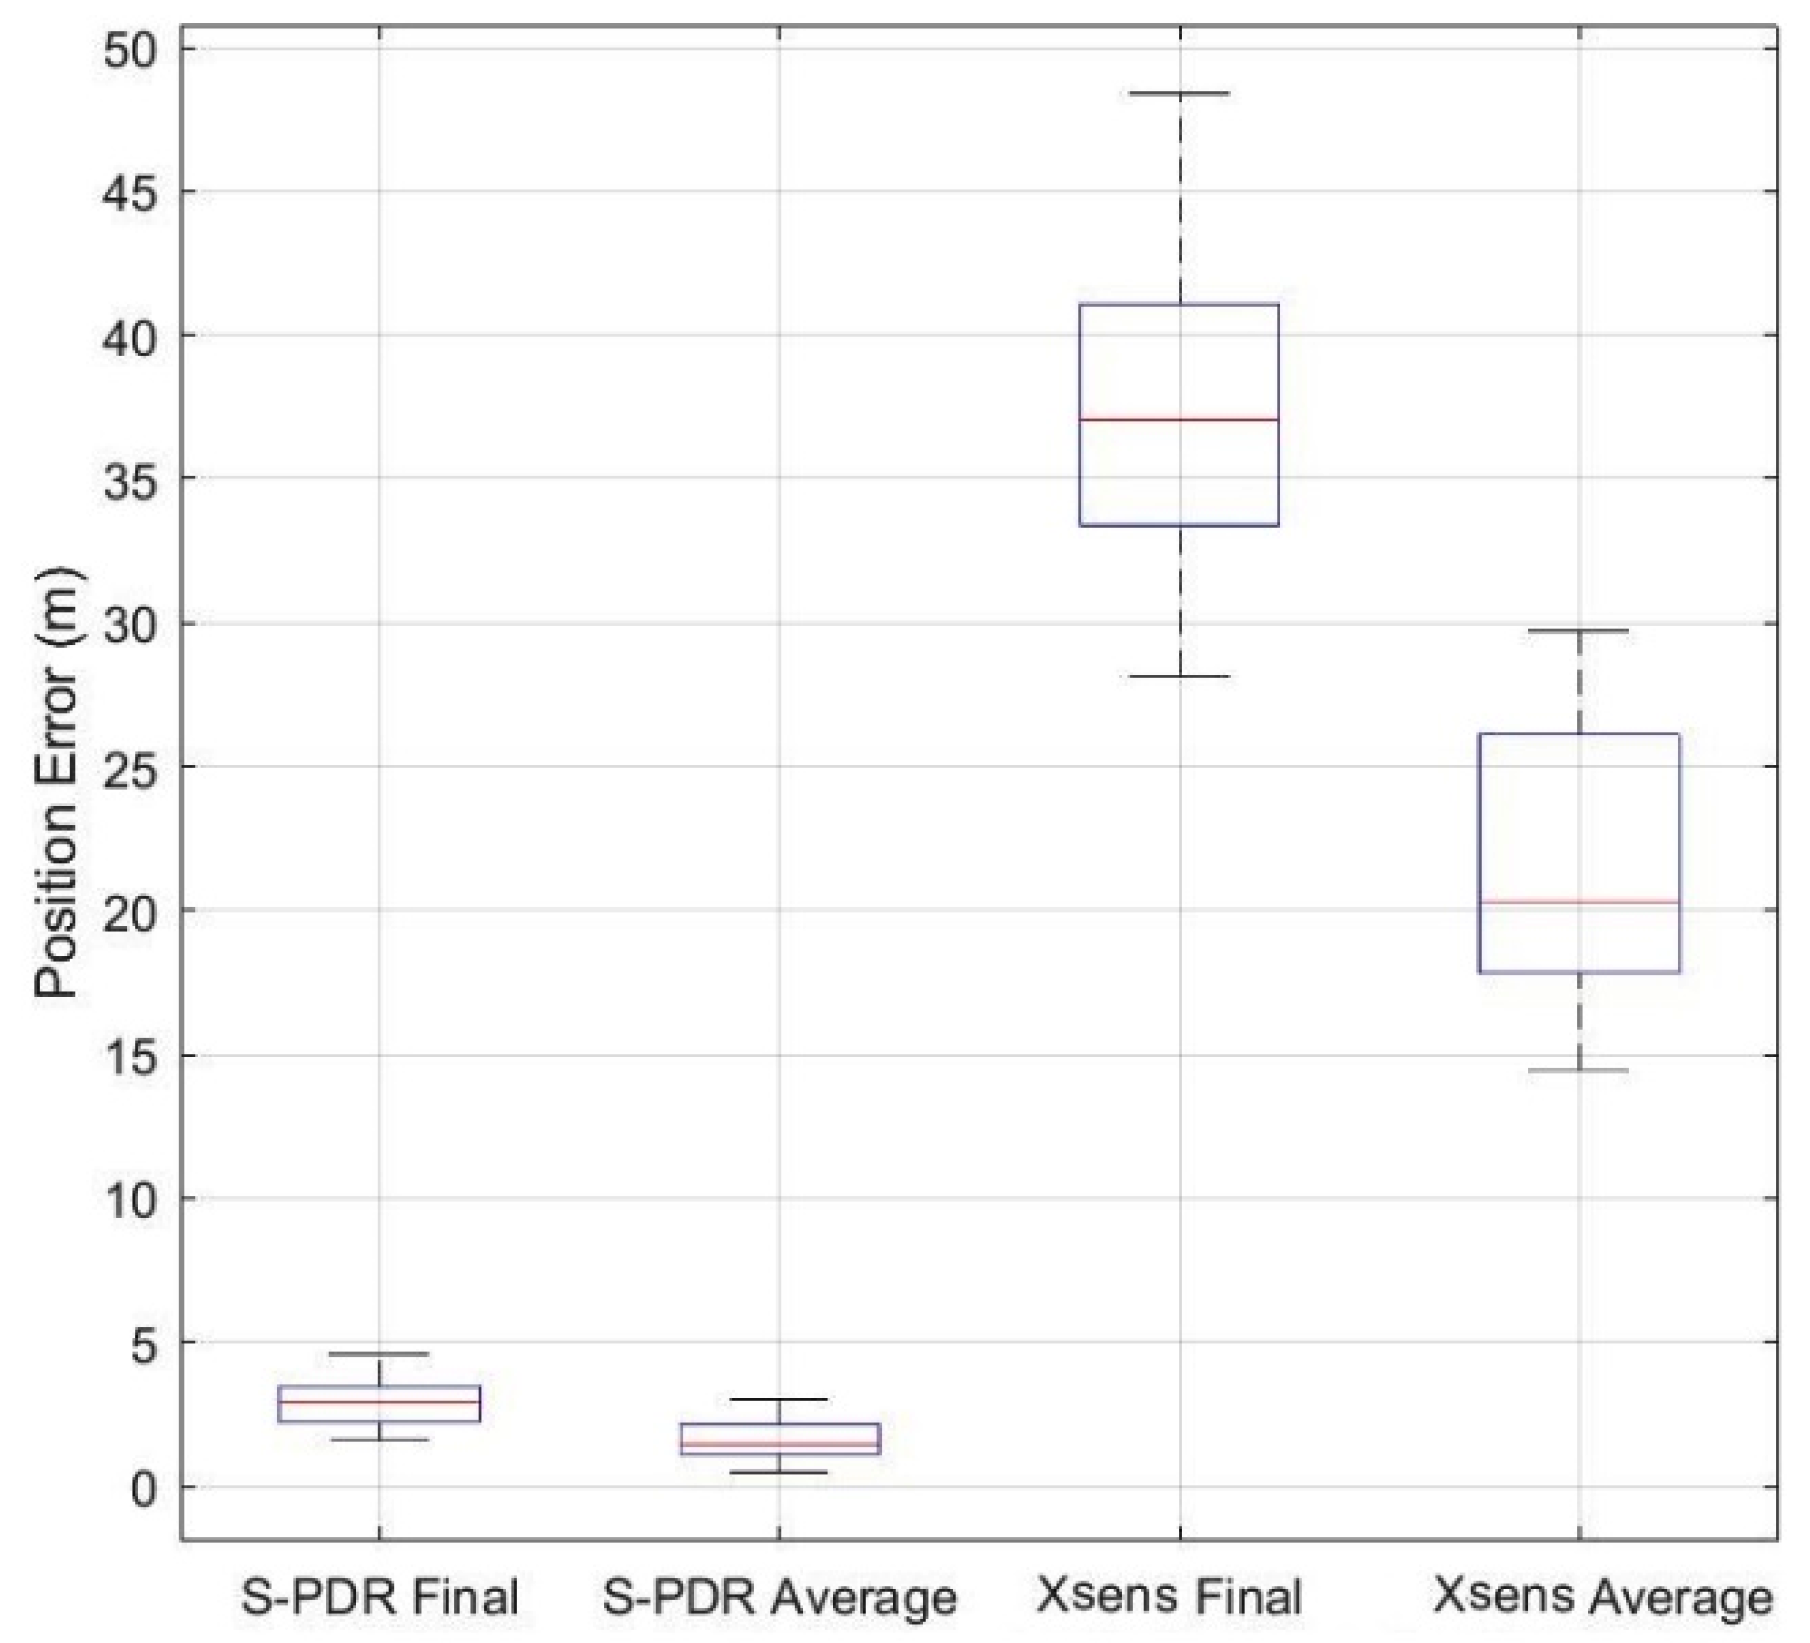
5.2. Outdoor Test
6. Conclusions
Author Contributions
Funding
Institutional Review Board Statement
Informed Consent Statement
Data Availability Statement
Acknowledgments
Conflicts of Interest
References
- Bräunl, T. Localization and Navigation. In Embedded Robotics; Springer: Heidelberg, Germany, 2008; pp. 241–269. [Google Scholar]
- Noureldin, A.; Karamat, T.B.; Georgy, J. Fundamentals of Inertial Navigation, Satellite-Based Positioning and Their Integration; Springer: Berlin, Germany, 2013; ISBN 9783642447907. [Google Scholar]
- Misra, P.; Enge, P. Global Positioning Systems: Signals, Measurements, and Performance, 2nd ed.; Ganga-Jamuna: Lincoln, MA, USA, 2010; ISBN 0970954417. [Google Scholar]
- Grewal, M.S.; Weill, L.R.; Lawrence, R.; Andrews, A.P. Global Positioning Systems, Inertial Navigation, and Integration; Wiley-Interscience: Hoboken, NJ, USA, 2007; ISBN 9780470099711. [Google Scholar]
- Hofmann-Wellenhof, B.; Legat, K.; Wieser, M. Navigation: Principles of Positioning and Guidance; Springer: Vienna, Austria, 2003; ISBN 9783709160787. [Google Scholar]
- Salychev, O.S.; Oleg, S. Applied Inertial Navigation: Problems and Solutions; BMSTU Press: Moscow, Russia, 2004; ISBN 5703823951. [Google Scholar]
- Greiff, P.; Boxenhorn, B.; King, T.; Niles, L. Silicon monolithic micromechanical gyroscope. In Proceedings of the TRANSDUCERS ’91: 1991 International Conference on Solid-State Sensors and Actuators. Digest of Technical Papers, San Francisco, CA, USA, 24–27 June 1991; pp. 966–968. [Google Scholar] [CrossRef]
- Kourepenis, A.; Borenstein, J.; Connelly, J.; Elliott, R.; Ward, P.; Weinberg, M. Performance of MEMS inertial sensors. In Proceedings of the Position Location and Navigation Symposium (Cat. No.98CH36153), Palm Springs, CA, USA, 20–23 April 1996; pp. 1–8. [Google Scholar] [CrossRef]
- El-Sheimy, N.; Niu, X. The promise of MEMS to the navigation community. Insid. Gnss 2007, 2, 46–56. [Google Scholar]
- Davidson, P.; Vazquez, M.A.; Piche, R. Uninterrupted portable car navigation system using GPS, map and inertial sensors data. In Proceedings of the 2009 IEEE 13th International Symposium on Consumer Electronics, Kyoto, Japan, 25–28 May 2009; pp. 836–840. [Google Scholar]
- Huang, C.; Liao, Z.; Zhao, L. Synergism of INS and PDR in Self-Contained Pedestrian Tracking with a Miniature Sensor Module. IEEE Sens. J. 2010, 10, 1349–1359. [Google Scholar] [CrossRef] [Green Version]
- Tazartes, D. An historical perspective on inertial navigation systems. In Proceedings of the 2014 International Symposium on Inertial Sensors and Systems (ISISS), Laguna Beach, CA, USA, 25–26 February 2014; pp. 1–5. [Google Scholar]
- Qian, W.-X.; Zeng, Q.-H.; Wan, J.-W.; Xiong, Z. Pedestrian navigation method based on kinematic mechanism of human lower limb. Zhongguo Guanxing Jishu Xuebao/J. Chin. Inert. Technol. 2015, 23, 24–28. [Google Scholar]
- Renaudin, V.; Yalak, O.; Tomé, P.; Merminod, B. Indoor Navigation of Emergency Agents. Eur. J. Navig. Sci. 2007, 5, 36–45. [Google Scholar]
- Cheema, M.A. Indoor location-based services: Challenges and Opportunities. Sigspatial Spec. 2018, 10, 10–17. [Google Scholar] [CrossRef]
- Nokia Mobile. Mobile Location Services; Nokia Mobile: Espoo, Finland, 2001. [Google Scholar]
- IMU and INS–VectorNav Library. Available online: https://www.vectornav.com/support/library/imu-and-ins (accessed on 10 November 2020).
- Zupt Inertial Survey Technology. Available online: https://www.zupt.com/inertial-technology/ (accessed on 9 November 2020).
- Ojeda, L.; Borenstein, J. Non-GPS navigation for security personnel and first responders. J. Navig. 2007, 60, 391–407. [Google Scholar] [CrossRef] [Green Version]
- Rajagopal, S. Personal Dead Reckoning System with Shoe Mounted Inertial Sensors. Master’s Thesis, KTH Royal Institute of Technology, Stockholm, Sweden, 2008. [Google Scholar]
- Zampella, F.; Khider, M.; Robertson, P.; Jimnez, A. Unscented Kalman filter and Magnetic Angular Rate Update (MARU) for an improved Pedestrian Dead-Reckoning. In Proceedings of the 2012 IEEE/ION Position, Location and Navigation Symposium, Myrtle Beach, SC, USA, 23–26 April 2012; pp. 129–139. [Google Scholar] [CrossRef] [Green Version]
- Borenstein, J.; Ojeda, L.; Kwanmuang, S. Heuristic Reduction of Gyro Drift for Personnel Tracking Systems. J. Navig. 2009. [Google Scholar] [CrossRef] [Green Version]
- Ojeda, L.; Borenstein, J. Personal Dead-reckoning System for GPS-denied Environments. In Proceedings of the 2007 IEEE International Workshop on Safety, Security and Rescue Robotics, Rome, Italy, 27–29 September 2007; pp. 1–6. [Google Scholar]
- Rose, J.; Gamble, J.G. Human Walking; Lippincott Williams and Wilkins: Philadelphia, PA, USA, 2006; ISBN 9780781759540. [Google Scholar]
- Do, T.N.; Suh, Y.S. Gait analysis using floor markers and inertial sensors. Sensors 2012, 12, 1594–1611. [Google Scholar] [CrossRef] [Green Version]
- Parry, J. Gait Analysis Normal and Pathological Function; SLACK: Thorofare, NJ, USA, 1992; ISBN 9781556421921. [Google Scholar]
- Khedr, M.E.; El-Sheimy, N. SBAUPT: Azimuth SBUPT for frequent full attitude correction of smartphone-based PDR. IEEE Sens. J. 2020, 1. [Google Scholar] [CrossRef]
- Shin, S.H. New Map-Matching Algorithm Using Virtual Track for Pedestrian Dead Reckoning. Etri J. 2010, 32, 891–900. [Google Scholar] [CrossRef]
- Huang, Y.; Zheng, H.; Nugent, C.; McCullagh, P.; McDonough, S.M.; Tully, M.A.; Connor, S.O. Activity monitoring using an intelligent mobile phone–A Validation Study. In Proceedings of the 3rd International Conference on Pervasive Technologies Related to Assistive Environments–PETRA ’10, Samos, Greece, 23–25 June 2010; p. 1. [Google Scholar]
- Xu, L.; Xiong, Z.; Zhao, R. An indoor pedestrian navigation algorithm based on smartphone mode recognition. In Proceedings of the 2019 IEEE 3rd Information Technology, Networking, Electronic and Automation Control Conference, ITNEC 2019, Chengu, China, 15–17 March 2019; Institute of Electrical and Electronics Engineers Inc.: New York, NY, USA, 2019; pp. 831–835. [Google Scholar]
- Lee, H.H.; Choi, S.; Lee, M.J. Step detection robust against the dynamics of smartphones. Sensors 2015, 15, 27230–27250. [Google Scholar] [CrossRef] [Green Version]
- Tian, Q.; Salcic, Z.; Wang, K.I.-K.; Pan, Y. A Multi-Mode Dead Reckoning System for Pedestrian Tracking Using Smartphones. IEEE Sens. J. 2016, 16, 2079–2093. [Google Scholar] [CrossRef]
- Kupke, J.; Willemsen, T.; Keller, F.; Sternberg, H. Development of a step counter based on artificial neural networks. J. Locat. Based Serv. 2016, 10, 161–177. [Google Scholar] [CrossRef]
- Susi, M.; Renaudin, V.; Lachapelle, G. Motion mode recognition and step detection algorithms for mobile phone users. Sensors 2013, 13, 1539–1562. [Google Scholar] [CrossRef]
- Kammoun, S.; Pothin, J.B.; Cousin, J.C. An efficient fuzzy logic step detection algorithm for unconstrained smartphones. In Proceedings of the IEEE International Symposium on Personal, Indoor and Mobile Radio Communications, PIMRC, Hong Kong, China, 31 August–3 September 2015. [Google Scholar]
- Park, S.Y.; Heo, S.J.; Park, C.G. Accelerometer-based smartphone step detection using machine learning technique. In Proceedings of the International Electrical Engineering Congress, IEECON 2017, New York, NY, USA, 10 March 2017; Institute of Electrical and Electronics Engineers Inc.: New York, NY, USA, 2017. [Google Scholar]
- Wang, B.; Liu, X.; Yu, B.; Jia, R.; Gan, X. Pedestrian dead reckoning based on motion mode recognition using a smartphone. Sensors 2018, 18, 1811. [Google Scholar] [CrossRef] [PubMed] [Green Version]
- Zhang, H.; Yuan, W.; Shen, Q.; Li, T.; Chang, H. A handheld inertial pedestrian navigation system with accurate step modes and device poses recognition. IEEE Sens. J. 2015, 15, 1421–1429. [Google Scholar] [CrossRef]
- Edel, M.; Koppe, E. An advanced method for pedestrian dead reckoning using BLSTM-RNNs. In Proceedings of the 2015 International Conference on Indoor Positioning and Indoor Navigation, IPIN 2015, Banff, AB, Canada, 3–16 October 2015; Institute of Electrical and Electronics Engineers Inc.: New York, NY, USA, 2015. [Google Scholar]
- Ozcan, K.; Velipasalar, S. Robust and Reliable Step Counting by Mobile Phone Cameras. In Proceedings of the 9th International Conference on Distributed Smart Cameras, Seville, Spain, 8–11 September 2015; pp. 164–169. [Google Scholar] [CrossRef]
- Marouane, C.; Ebert, A.; Linnhoff-Popien, C.; Christil, M. Step and activity detection based on the orientation and scale attributes of the SURF algorithm. In Proceedings of the 2016 International Conference on Indoor Positioning and Indoor Navigation (IPIN), Alcala de Henares, Spain, 4–7 October 2016; pp. 1–8. [Google Scholar]
- Aubeck, F.; Isert, C.; Gusenbauer, D. Camera based step detection on mobile phones. In Proceedings of the 2011 International Conference on Indoor Positioning and Indoor Navigation, IPIN 2011, Guimaraes, Portugal, 21–23 September 2011. [Google Scholar]
- Torteeka, P.; Chundi, X.; Dongkai, Y. Hybrid technique for indoor positioning system based on Wi-Fi received signal strength indication. In Proceedings of the 2014 International Conference on Indoor Positioning and Indoor Navigation (IPIN), Busan, Korea, 27–30 October 2014; pp. 48–57. [Google Scholar]
- Diaz, E.M.; De Ponte Muller, F.; Jimenez, A.R.; Zampella, F. Evaluation of AHRS algorithms for inertial personal localization in industrial environments. In Proceedings of the IEEE International Conference on Industrial Technology, Seville, Spain, 17–19 March 2015; Institute of Electrical and Electronics Engineers Inc.: New York, NY, USA, 2015; Volume 2015, pp. 3412–3417. [Google Scholar]
- Euston, M.; Coote, P.; Mahony, R.; Kim, J.; Hamel, T. A complementary filter for attitude estimation of a fixed-wing UAV. In Proceedings of the 2008 IEEE/RSJ International Conference on Intelligent Robots and Systems, IROS, Nice, France, 22–26 September 2008; pp. 340–345. [Google Scholar]
- Madgwick, S.O.H.; Harrison, A.J.L.; Vaidyanathan, R. Estimation of IMU and MARG orientation using a gradient descent algorithm. In Proceedings of the 2011 IEEE International Conference on Rehabilitation Robotics, Zurich, Switzerland, 29 June 2011; pp. 1–7. [Google Scholar]
- Mizell, D. Using Gravity to Estimate Accelerometer Orientation; IEEE: White Plains, NY, USA, 2003. [Google Scholar]
- Xiao, Z.; Wen, H.; Markham, A.; Trigoni, N. Robust Indoor Positioning with Lifelong Learning. IEEE J. Sel. Areas Commun. 2015, 33, 2287–2301. [Google Scholar] [CrossRef]
- Xiao, Z.; Wen, H.; Markham, A.; Trigoni, N. Robust pedestrian dead reckoning (R-PDR) for arbitrary mobile device placement. In Proceedings of the 2014 International Conference on Indoor Positioning and Indoor Navigation (IPIN), Busan, Korea, 27–30 October 2014; pp. 187–196. [Google Scholar] [CrossRef]
- Diaz, E.M.; Gonzalez, A.L.M.; De Ponte Müller, F. Standalone Inertial Pocket Navigation System. In Proceedings of the Record–IEEE PLANS, Position Location and Navigation Symposium, Monterey, CA, USA, 5–8 May 2014; Institute of Electrical and Electronics Engineers Inc.: New York, NY, USA, 2014; pp. 241–251. [Google Scholar]
- Yadav, N.; Bleakley, C. Accurate orientation estimation using AHRS under conditions of magnetic distortion. Sensors 2014, 14, 20008–20024. [Google Scholar] [CrossRef] [Green Version]
- Daponte, P.; De Vito, L.; Rapuano, S.; Riccio, M.; Picariello, F. Compensating magnetic disturbances on MARG units by means of a low complexity data fusion algorithm. In Proceedings of the 2015 IEEE International Symposium on Medical Measurements and Applications, MeMeA, New York, NY, USA, 4–5 May 2015; pp. 157–162. [Google Scholar]
- Ma, M.; Song, Q.; Gu, Y.; Zhou, Z. Use of magnetic field for mitigating gyroscope errors for indoor pedestrian positioning. Sensors 2018, 18, 2592. [Google Scholar] [CrossRef] [Green Version]
- Li, Y.; Georgy, J.; Niu, X.; Goodall, C.; El-sheimy, N. An Automatic Multi-level Gyro Calibration Architecture for Consumer Portable Devices. In Proceedings of the International Conference on Indoor Positioning and Indoor Navigation (IPIN), Busan, Korea, 27–30 October 2014. [Google Scholar]
- Li, Y.; Georgy, J.; Niu, X.; Li, Q.; El-Sheimy, N. Autonomous Calibration of MEMS Gyros in Consumer Portable Devices. IEEE Sens. J. 2015, 15, 4062–4072. [Google Scholar] [CrossRef] [Green Version]
- Ruotsalainen, L.; Bancroft, J.; Lachapelle, G. Mitigation of attitude and gyro errors through vision aiding. In Proceedings of the 2012 International Conference on Indoor Positioning and Indoor Navigation (IPIN), Sydney, Australia, 13–15 November 2016; pp. 1–9. [Google Scholar]
- Antigny, N.; Servieres, M.; Renaudin, V. Hybrid visual and inertial position and orientation estimation based on known urban 3D models. In Proceedings of the 2016 International Conference on Indoor Positioning and Indoor Navigation (IPIN), Alcala de Henares, Spain, 4–7 October 2016; pp. 1–8. [Google Scholar]
- Del Rosario, M.B.; Lovell, N.H.; Redmond, S.J. Quaternion-Based Complementary Filter for Attitude Determination of a Smartphone. IEEE Sens. J. 2016, 16, 6008–6017. [Google Scholar] [CrossRef]
- Fourati, H. Heterogeneous data fusion algorithm for pedestrian navigation via foot-mounted inertial measurement unit and complementary filter. IEEE Trans. Instrum. Meas. 2015, 64, 221–229. [Google Scholar] [CrossRef]
- Renaudin, V.; Combettes, C. Magnetic, Acceleration Fields and Gyroscope Quaternion (MAGYQ)-Based Attitude Estimation with Smartphone Sensors for Indoor Pedestrian Navigation. Sensors 2014, 14, 22864–22890. [Google Scholar] [CrossRef] [Green Version]
- Yean, S.; Lee, B.S.; Yeo, C.K.; Vun, C.H.; Oh, H.L. Smartphone Orientation Estimation Algorithm Combining Kalman Filter With Gradient Descent. IEEE J. Biomed. Heal. Inf. 2018, 22, 1421–1433. [Google Scholar] [CrossRef]
- Liu, D.; Pei, L.; Qian, J.; Wang, L.; Liu, P.; Dong, Z.; Xie, S.; Wei, W. A novel heading estimation algorithm for pedestrian using a smartphone without attitude constraints. In Proceedings of the 4th International Conference on Ubiquitous Positioning, Indoor Navigation and Location-Based Services–UPINLBS 2016, Shanghai, China, 2–4 November 2016; Institute of Electrical and Electronics Engineers Inc.: Piscataway, NJ, USA, 2017; pp. 29–37. [Google Scholar]
- Lee, J.S.; Huang, S.M. An Experimental Heuristic Approach to Multi-Pose Pedestrian Dead Reckoning Without Using Magnetometers for Indoor Localization. IEEE Sens. J. 2019, 19, 9532–9542. [Google Scholar] [CrossRef]
- Deng, Z.A.; Wang, G.; Hu, Y.; Wu, D. Heading estimation for indoor pedestrian navigation using a smartphone in the pocket. Sensors 2015, 15, 21518–21536. [Google Scholar] [CrossRef]
- Deng, Z.; Si, W.; Qu, Z.; Liu, X.; Na, Z. Heading estimation fusing inertial sensors and landmarks for indoor navigation using a smartphone in the pocket. Eurasip J. Wirel. Commun. Netw. 2017, 2017, 160. [Google Scholar] [CrossRef] [Green Version]
- Kourogi, M.; Kurata, T. Personal positioning based on walking locomotion analysis with self-contained sensors and a wearable camera. In Proceedings of the 2nd IEEE and ACM International Symposium on Mixed and Augmented Reality, ISMAR 2003, Tokyo, Japan, 10 October 2003; pp. 103–112. [Google Scholar]
- Kunze, K.; Lukowicz, P.; Partridge, K.; Begole, B. Which way am I facing: Inferring horizontal device orientation from an accelerometer signal. In Proceedings of the 2009 International Symposium on Wearable Computers, Linz, Austria, 4–7 September 2009; pp. 149–150. [Google Scholar] [CrossRef]
- Bojja, C.; Parviainen, J.; Collin, J.; Hellevaara, J.; Käppi, R.; Alanen, J.; Takala, K. Robust Misalignment Handling in Pedestrian Dead Reckoning. In Proceedings of the 2016 IEEE 84th Vehicular Technology Conference (VTC-Fall), Montreal, QC, Canada, 18–21 September 2016. [Google Scholar] [CrossRef]
- Bao, H.; Wong, W.C. Improved PCA based step direction estimation for dead-reckoning localization. In Proceedings of the 2013 International Conference on Cyber-Enabled Distributed Computing and Knowledge Discovery, CyberC 2013, Washington, DC, USA, 10–12 October 2013; pp. 325–331. [Google Scholar]
- Yang, X.; Huang, B.; Miao, Q. A step-wise algorithm for heading estimation via a smartphone. In Proceedings of the 28th Chinese Control and Decision Conference, CCDC 2016, Yinchuan, China, 26–28 May 2016; pp. 4598–4602. [Google Scholar]
- Shin, B.; Lee, S.; Kim, C.; Kim, J.; Lee, T.; Kee, C.; Heo, S.; Rhee, H. Implementation and performance analysis of smartphone-based 3D PDR system with hybrid motion and heading classifier. In Proceedings of the Record–IEEE PLANS, Position Location and Navigation Symposium, Monserey, CA, USA, 5–8 May 2014; pp. 201–204. [Google Scholar]
- Knauth, S. Smartphone PDR positioning in large environments employing WiFi, particle filter, and backward optimization. In Proceedings of the 2017 International Conference on Indoor Positioning and Indoor Navigation, IPIN 2017, Sapporo, Japan, 18–21 September 2017; Institute of Electrical and Electronics Engineers Inc.: Piscataway, NJ, USA, 2017; Volume 2017, pp. 1–6. [Google Scholar]
- Moder, T.; Wisiol, K.; Hafner, P.; Wieser, M. Smartphone-based indoor positioning utilizing motion recognition. In Proceedings of the 2015 International Conference on Indoor Positioning and Indoor Navigation, IPIN, Banff, AB, Canada, 13–16 October 2015. [Google Scholar]
- Li, Y.; Lan, H.; Zhuang, Y.; Zhang, P.; Niu, X.; El-Sheimy, N. Real-time attitude tracking of mobile devices. In Proceedings of the International Conference on Indoor Positioning and Indoor Navigation IPIN, Banff, AB, Canada, 13–16 October 2015; Volume 13–16. [Google Scholar] [CrossRef]
- Li, Y.; Niu, X.; Zhang, P.; Lan, H.; Zhuang, Y.; El-sheimy, N. Smartphone-based Indoor Navigation using PDR and Magnetic Matching. In Proceedings of the 28th International Technical Meeting of the Satellite Division of the Institute of Navigation, Nashville, TN, USA, 16–20 September 2015; pp. 2060–2066. [Google Scholar]
- Li, Y.; Zhang, P.; Lan, H.; Zhuang, Y.; Niu, X.; El-Sheimy, N. A modularized real-time indoor navigation algorithm on smartphones. In Proceedings of the International Conference on Indoor Positioning and Indoor Navigation, Zurich, Switzerland, 15–17 September 2010; pp. 13–16. [Google Scholar] [CrossRef]
- Li, Y.; Zhuang, Y.; Lan, H.; Zhang, P.; Niu, X.; El-Sheimy, N. WiFi-aided magnetic matching for indoor navigation with consumer portable devices. Micromachines 2015, 6, 747–764. [Google Scholar] [CrossRef] [Green Version]
- Shin, S.H.; Park, C.G.; Kim, J.W.; Hong, H.S.; Lee, J.M. Adaptive Step Length Estimation Algorithm Using Low-Cost MEMS Inertial Sensors. In Proceedings of the 2007 IEEE Sensors Applications Symposium, Atlanta, GA, USA, 28–31 October 2007; pp. 1–5. [Google Scholar] [CrossRef]
- Abadleh, A.; Al-Hawari, E.; Alkafaween, E.; Al-Sawalqah, H. Step detection algorithm for accurate distance estimation using dynamic step length. In Proceedings of the18th IEEE International Conference on Mobile Data Management, MDM 2017, Daejeon, Korea, 29 May–1 June 2017; pp. 324–328. [Google Scholar]
- Kim, J.W.; Jang, H.J.; Hwang, D.-H.; Park, C. A Step, Stride and Heading Determination for the Pedestrian Navigation System; Scientific Research Publishing: Wuhan, China, 2004; Volume 3. [Google Scholar]
- Weinberg, H. Using the ADXL202 in Pedometer and Personal Navigation Applications; Analog Devices Inc.: Norwood, MA, USA, 2002. [Google Scholar]
- Way, O.T.; Scarlett, J. Enhancing the Performance of Pedometers Using a Single Accelerometer; Application Note an-900; Analog Devices Inc.: Norwood, MA, USA, 2007. [Google Scholar]
- LEVI. Robert Dead Reckoning Navigational System Using Accelerometer to Measure Foot Impacts. U.S. Patent No. 5,583,776, 10 December 1996.
- Li, F.; Zhao, C.; Ding, G.; Gong, J.; Liu, C.; Zhao, F. A Reliable and accurate indoor localization method using phone inertial sensors. In Proceedings of the 2012 ACM Conference on Ubiquitous Computing, Association for Computing, Pittsburg, PA, USA, 5–8 September 2012; pp. 421–430. [Google Scholar]
- Renaudin, V.; Susi, M.; Lachapelle, G. Step Length Estimation Using Handheld Inertial Sensors. Sensors 2012, 12, 8507–8525. [Google Scholar] [CrossRef] [PubMed]
- Lee, S.W.; Mase, K. Recognition on walking behaviors for pedestrian navigation. In Proceedings of the IEEE Conference on Control Applications, New Orleans, LA, USA, 4–7 November 2001; pp. 1152–1155. [Google Scholar]
- Pepa, L.; Marangoni, G.; Di Nicola, M.; Ciabattoni, L.; Verdini, F.; Spalazzi, L.; Longhi, S. Real Time Step Length Estimation on Smartphone. In Proceedings of the 2016 IEEE International Conference on Consumer Electronics (ICCE), Nantou, Taiwan, 27–29 May 2016; pp. 315–316. [Google Scholar] [CrossRef]
- González, R.C.; Alvarez, D.; López, A.M.; Alvarez, J.C. Modified pendulum model for mean step length estimation. In Proceedings of the Annual International Conference of the IEEE Engineering in Medicine and Biology, New Orleans, LA, USA, 20 February 2007; pp. 1371–1374. [Google Scholar]
- Wang, Q.; Ye, L.; Luo, H.; Men, A.; Zhao, F.; Huang, Y. Pedestrian stride-length estimation based on LSTM and denoising autoencoders. Sensors 2019, 19, 840. [Google Scholar] [CrossRef] [PubMed] [Green Version]
- Gu, F.; Khoshelham, K.; Yu, C.; Shang, J. Accurate Step Length Estimation for Pedestrian Dead Reckoning Localization Using Stacked Autoencoders. IEEE Trans. Instrum. Meas. 2019, 68, 2705–2713. [Google Scholar] [CrossRef]
- Liu, Y.; Chen, Y.; Shi, L.; Tian, Z.; Zhou, M.; Li, L. Accelerometer based joint step detection and adaptive step length estimation algorithm using handheld devices. J. Commun. 2015, 10, 520–525. [Google Scholar] [CrossRef] [Green Version]
- Shin, B.; Kim, C.; Kim, J.H.; Lee, S.; Kee, C.; Lee, T. Hybrid Model–Based Motion Recognition for Smartphone Users. Etri J. 2014, 36, 1016–1022. [Google Scholar] [CrossRef]
- Ho, N.H.; Truong, P.H.; Jeong, G.M. Step-detection and adaptive step-length estimation for pedestrian dead-reckoning at variouswalking speeds using a smartphone. Sensors 2016, 16, 1423. [Google Scholar] [CrossRef]
- Sun, Y.; Wu, H.; Schiller, J. A Step Length Estimation Model for Position Tracking. In Proceedings of the 2015 International Conference on Localization and GNSS (ICL-GNSS), Turin, Italy, 25–27 June 2015; Institute of Electrical and Electronics Engineers: New York, NY, USA, 2015. [Google Scholar]
- Lee, J.H.; Shin, B.; Lee, S.; Hun, J.; Kim, C.; Lee, T.; Park, J.; Recognition, A.M. Motion based Adaptive Step Length Estimation using Smartphone. In Proceedings of the 18th IEEE International Symposium on Consumer Electronics (ISCE 2014), Jeju, Korea, 22–25 June 2014; pp. 1–2. [Google Scholar] [CrossRef]
- Qian, J.; Pei, L.; Zou, D.; Qian, K.; Liu, P. Optical flow based step length estimation for indoor pedestrian navigation on a smartphone. In Proceedings of the Record–IEEE PLANS, Position Location and Navigation Symposium, Monterey, CA, USA, 5–8 May 2014. [Google Scholar]
- Khedr, M.; El-Sheimy, N. A smartphone step counter using IMU and magnetometer for navigation and health monitoring applications. Sensors 2017, 17, 2573. [Google Scholar] [CrossRef] [PubMed] [Green Version]
- Khedr, M.E.; Radi, A.; El-Sheimy, N. Step-Based Attitude Update (SBUPT) Technique for Pedestrian Dead Reckoning (PDR) using Handheld Devices. In Proceedings of the ION 2019 Pacific PNT Meeting, Honolulu, HI, USA, 8–11 April 2019; pp. 582–593. [Google Scholar]
- Vezocnik, M.; Juric, M.B. Average Step Length Estimation Models’ Evaluation Using Inertial Sensors: A Review. IEEE Sens. J. 2019, 19, 396–403. [Google Scholar] [CrossRef]
- MTi 100-Series. Available online: https://www.xsens.com/products/mti-100-series (accessed on 4 December 2020).


| Notations | |
|---|---|
| Bold | Bold notations represent arrays and matrices |
| Acceleration window in LLF (east, north, and up column wise) | |
| Array of in-step headings | |
| First and second columns of respectively | |
| Sorted in-step headings | |
| Mean heading from histogram analysis | |
| Weight of histogram heading and PCA heading respectively | |
| Reduced acceleration window after outlier rejection | |
| Outlier threshold | |
| Principal components (3 vectors) | |
| 1st principal component vector (dominant component) | |
| 1st and 2nd candidates of PCA-based heading | |
| PCA-based heading | |
| Fusion heading | |
| Test # | Final Positional Error (m) | Average Position Error across Trajectory | ||
|---|---|---|---|---|
| S-PDR | Xsens MTi G-710 | S-PDR | Xsens MTi G-710 | |
| 1 | 11.51 | 27.9 | 5.79 | 17.53 |
| 2 | 10.52 | 31.58 | 4.61 | 21.97 |
| 3 | 6.30 | 34.8 | 3.4 | 20.13 |
| 4 | 5.91 | 39.31 | 4.52 | 23.82 |
| 5 | 10.14 | 25.93 | 6.32 | 16.37 |
| 6 | 7.52 | 15.62 | 3.91 | 8.79 |
| 7 | 5.93 | 20.74 | 2.88 | 13.51 |
| 8 | 6.22 | 33.94 | 3.75 | 18.98 |
| 9 | 7.83 | 45.38 | 4.09 | 30.47 |
| 10 | 5.78 | 17.52 | 4.10 | 9.8 |
| 11 | 6.91 | 36.73 | 3.81 | 21.75 |
| 12 | 8.34 | 41.55 | 4.29 | 25.05 |
| 13 | 4.63 | 38.73 | 2.26 | 25.19 |
| 14 | 7.17 | 39.57 | 5.59 | 27.83 |
| 15 | 6.73 | 31.72 | 3.38 | 19.08 |
| 16 | 11.28 | 37.69 | 7.61 | 22.36 |
| 17 | 10.59 | 32.2 | 7.59 | 18.73 |
| 18 | 6.36 | 28.17 | 2.96 | 15.01 |
| 19 | 9.59 | 19.63 | 4.51 | 8.94 |
| 20 | 8.27 | 43.88 | 3.94 | 29.05 |
| Avg Error | 7.88 | 32.13 | 4.47 | 19.72 |
| Min | 4.63 | 15.62 | 2.26 | 8.79 |
| Max | 11.51 | 45.38 | 7.61 | 30.47 |
| STD | 2.06 | 8.77 | 1.45 | 6.38 |
| Test # | Final Positional Error (m) | Average Position Error across Trajectory | ||
|---|---|---|---|---|
| S-PDR | Xsens MTi G-710 | S-PDR | Xsens MTi G-710 | |
| 1 | 1.59 | 37.12 | 0.87 | 20.32 |
| 2 | 4.31 | 45.94 | 2.95 | 14.49 |
| 3 | 2.50 | 38.32 | 1.42 | 27.91 |
| 4 | 2.91 | 29.73 | 1.53 | 19.38 |
| 5 | 3.25 | 39.13 | 1.98 | 15.27 |
| 6 | 3.03 | 32.26 | 1.42 | 23.51 |
| 7 | 2.72 | 28.17 | 1.37 | 18.78 |
| 8 | 4.58 | 37.84 | 3.01 | 17.09 |
| 9 | 2.08 | 36.58 | 1.35 | 27.93 |
| 10 | 2.49 | 40.93 | 1.09 | 24.30 |
| 11 | 3.28 | 35.07 | 1.73 | 20.19 |
| 12 | 2.90 | 36.95 | 1.17 | 18.54 |
| 13 | 4.08 | 48.39 | 2.19 | 21.61 |
| 14 | 2.25 | 41.71 | 1.06 | 27.93 |
| 15 | 3.19 | 35.80 | 2.15 | 21.95 |
| 16 | 1.93 | 33.94 | 0.82 | 19.06 |
| 17 | 2.14 | 41.23 | 1.29 | 29.71 |
| 18 | 3.69 | 32.83 | 2.71 | 16.55 |
| 19 | 1.72 | 29.49 | 0.49 | 15.99 |
| 20 | 4.05 | 47.61 | 2.36 | 29.17 |
| Avg Error | 2.93 | 37.45 | 1.65 | 21.48 |
| Min | 1.59 | 28.17 | 0.49 | 14.49 |
| Max | 4.58 | 48.39 | 3.01 | 29.71 |
| STD | 0.88 | 5.72 | 0.71 | 4.89 |
Publisher’s Note: MDPI stays neutral with regard to jurisdictional claims in published maps and institutional affiliations. |
© 2021 by the authors. Licensee MDPI, Basel, Switzerland. This article is an open access article distributed under the terms and conditions of the Creative Commons Attribution (CC BY) license (http://creativecommons.org/licenses/by/4.0/).
Share and Cite
Khedr, M.; El-Sheimy, N. S-PDR: SBAUPT-Based Pedestrian Dead Reckoning Algorithm for Free-Moving Handheld Devices. Geomatics 2021, 1, 148-176. https://doi.org/10.3390/geomatics1020010
Khedr M, El-Sheimy N. S-PDR: SBAUPT-Based Pedestrian Dead Reckoning Algorithm for Free-Moving Handheld Devices. Geomatics. 2021; 1(2):148-176. https://doi.org/10.3390/geomatics1020010
Chicago/Turabian StyleKhedr, Maan, and Naser El-Sheimy. 2021. "S-PDR: SBAUPT-Based Pedestrian Dead Reckoning Algorithm for Free-Moving Handheld Devices" Geomatics 1, no. 2: 148-176. https://doi.org/10.3390/geomatics1020010