Article

On the Study of Thermal Transitions in Selected n-Paraffins Using Differential Scanning Calorimetry

Department of Chemistry and Biochemistry, Berry College, Rome, GA 30149, USA
*
Author to whom correspondence should be addressed.
Thermo 2022, 2(3), 302-311; https://doi.org/10.3390/thermo2030021
Submission received: 9 June 2022 / Revised: 1 August 2022 / Accepted: 2 September 2022 / Published: 19 September 2022
(This article belongs to the Special Issue Feature Papers of Thermo in 2022)

Abstract

:
The results obtained from a study of the thermal transformations of polymorphic long-chain normal paraffins (n-C32H66 and n-C36H74) are presented here. The research was performed using a power-compensated Differential Scanning Calorimeter (DSC). Both heating and cooling experiments were performed in dynamic nitrogen atmosphere. Thermodynamic data for both polymorphic transitions, as well as the fusion endotherms, were determined from the DSC thermal curves. Using the heats of transition (∆H), in Joules/gram, obtained from the data in the DSC thermal curves, molar heats of transition (∆H), in kJ/mol, were calculated and compared to previously published values. The molar entropy of transition (∆S) was then calculated for each of the observed thermal events. Additional information is given by the author on obtaining the best results from the use of DSC for the thermal behavior of n-paraffins. This manuscript opens with a review of most of the early work and the results it provided dealing with polymorphism of n-paraffin solids. Some of this referenced work was performed prior to the advent of computerized analytical instrumentation.

1. Introduction

1.1. n-Paraffin Hydrocarbons

Normal paraffin hydrocarbons (usually referred to as n-paraffins) are important organic chemical compounds found in petroleum, coconuts, and to a lesser extent in several other sources. These compounds are alkanes, a family of organic compounds, which have the group formula of CnH2n+2, where n is the number of carbon atoms. The melting points and boiling points of these n-paraffins are known to elevate with the number of carbon atoms in the molecule. This is due to the increase in intermolecular (London dispersion) forces with the length of the carbon chain. Since the C-C and C-H bonds are strong covalent (sigma) bonds, the alkane molecules are quite stable relative to other types of organic compounds. Normal paraffins with twenty carbons (n-C20H42) or more are solid, waxy compounds at room temperature. It has been shown that there is a difference in the packing in the solid state of even-carbon-number n-paraffins from those with odd numbers of carbons in the molecular chains [1]. This is true for n-paraffins of at least ten carbon atoms. Polymorphism is present in most long-chain n-paraffins, and this will be the focus of the following DSC study.
The recent increase in the number of worldwide industrial applications for paraffins is a result of the reversible phase-change properties that we have discussed in this work. One of their largest uses [2] is in energy storage devices (solar energy storage in particular). Another industrial use of paraffins is as an additive to cements and concretes [3], as well as other materials. The role of the paraffin additive is that it absorbs heat from the material due to the latent heat of fusion and the endothermic polymorphic crystal changes. Such an increase in commercial use leads to extensive laboratory activity in the study of paraffins and paraffin-containing products. Differential Scanning Calorimetry (DSC) as well as Infrared Spectroscopy and X-Ray Diffraction (XRD) techniques will play an increasingly major role in the quality assurance and product performance measurements in these growing industrial settings.
Both n-dotriacontane (n-C32H66) and n-hexatriacontane (n-C36H74) were selected for this study with power-compensated DSC. Both of these compounds exhibit reversible polymorphic phase-change transitions, as described in Figure 1, on heating from room temperature up to their melting transition temperatures. Both of the compounds used in this study are even-carbon-number n-paraffins.

1.2. n-Paraffin Phase Behavior

The various crystal modifications of the n-paraffins have been extensively studied. Broadhurst [1] reviewed and discussed all of the early fundamental work on this subject thoroughly. The hexagonal form, in which the chains are arranged perpendicularly to the plane formed by the methyl end groups, was discussed by Muller [4]. This hexagonal form is stable just below the melting point in the odd number n-paraffins from C9 to C43 and in the even number n-paraffins from C22 to C44. An important feature of the hexagonal form is the high degree of rotational freedom of the molecules around their chain axes.
Structural details of the orthorhombic [5,6,7,8], triclinic [7], and monoclinic [8] phases have been reported for the n-paraffins, including the polymer limit of very long chain lengths [9]. The orthorhombic phase is the stable low-temperature phase of the odd n-paraffins above C9 and is the commonly occurring low-temperature phase of all n-paraffins above about C40. This form consists of vertical chains (i.e., chains perpendicular to the end group planes) and hence transforms quite easily to the hexagonal phase upon heating by chain rotation of two C-C units. The orthorhombic to hexagonal transition is a simple rotational order–disorder transition [10]. In the remaining two phases, triclinic and monoclinic, the chains are tilted with respect to the end group planes, and the transition from the liquid or hexagonal would seem to be a complex process. The triclinic phase is stable at low temperatures in the even n-paraffins below C24 and persists down to C8 and C6 [11,12,13]. Above C26, the monoclinic form is the stable low-temperature structure for the even-carbon-number n-paraffins.
The n-paraffins chosen for study in this work were even-carbon-number n-paraffins C32 and C36. The n-hexatriacontane (C36H74) is in a monoclinic low-temperature form that undergoes a transition to the orthorhombic form at (or near) 72 °C. The orthorhombic form then undergoes a rotational transition to the hexagonal form at (or near) 73 °C, which on further heating melts at (or near) 75 °C. These transitions are highly dependent upon the purity and thermal history of the n-paraffin sample. For example, Vand [8], who first studied the room-temperature form of n-hexatriacontane, reported the room-temperature crystal form as orthorhombic but later found that a more pure, more carefully prepared sample of n-hexatriacontane was actually monoclinic at room temperature.
The n-paraffin n-dotriacontane (C32H66) is monoclinic at room temperature and transforms to orthorhombic at about 64 °C and then from orthorhombic to hexagonal at ca. 65.5 °C. On further heating, the hexagonal form melts near 69.5 °C. All three of these endothermic phase transitions are observed by the use of the instrumental technique of Differential Scanning Calorimetry (DSC). Whereas the two solid–solid transitions for n-hexatriacontane are accepted by all who have studied this normal paraffin, the monoclinic to orthorhombic transition has sometimes not been observed by DSC for n-dotriacontane. The reason for less reported data for monoclinic to orthorhombic paraffin transition, according to Broadhurst [1], is probably the known stabilizing influence that even small quantities of impurities impose on the orthorhombic phase of the longer-chain n-paraffins. Kinetic difficulties, which would seem to be associated with the mutual tilting of a large number of long, densely packed chains, are also a factor. Since the methylene group (CH2) packing is much the same at long chain lengths, the difference in free energy between the orthorhombic and monoclinic phases should become quite small. Hence, the two phases would become thermodynamically indistinguishable. King, Camilli, and Findeis [14] observed the monoclinic to orthorhombic transition as a very weak shoulder of the orthorhombic to hexagonal differential thermal analysis endotherm while using Differential Thermal Analysis (DTA). Furthermore, it was found that the monoclinic to orthorhombic transition was observed on the first run of the sample and appeared in an annealed sample only after recrimping the DTA/DSC sample pan. Thus, the transition was thought to be pressure-induced.
As will be seen in this work, the orthorhombic to hexagonal transition is the major polymorphic transition observed by these DSC studies. It is described as a rotational transition in the molecular chain, which is accompanied by a large volume expansion of the paraffin solid lattice. This volume expansion of n-dotriacontane was experimentally studied using dilatometry measurements by Templin [15]. This volume expansion to the hexagonal form is the important phenomenon in a previous study, reported by Earnest [16], on the sorption of selected hydrocarbon vapors on these long-chain paraffinic coatings using a piezoelectric quartz crystal microbalance.
One of the objectives of this work using Differential Scanning Calorimetry (DSC) was to assist the reader in obtaining more meaningful data when studying these types of long-chain paraffin compounds. We have, therefore, focused on operator choices, etc., in obtaining the temperatures and calorimetric values for the heats of transition when using the analysis technique of DSC. Since the observed transitions are considered to be thermodynamically reversible, the change in entropy (∆S) was calculated for each of these thermal events, using the molar heat of transition (∆H) and the observed temperature of transition (To) expressed in degrees Kelvin.

2. Methods and Materials

2.1. Chemicals and Instrumentation

The n-dotriacontane (n-C32H66) and n-hexatriacontane (n-C36H74) were purchased from Sigma Chemical (D-4634) and (H-9504), respectively. Both of these specimens were listed as being of 99% purity. These purchased n-paraffin samples were recrystallized in our laboratory several times from solution using spectral-grade chloroform solvent. The resulting solid specimens were believed to contain less than 1.0% impurity after recrystallization. High-purity-grade nitrogen was employed for the purge gas in the DSC instrument measuring cell. The tank of nitrogen was purchased locally. We were recently able to obtain a second specimen of n-dotriacontane (n-C32H66), which had been analyzed chromatographically by Separation Systems, Inc. (Gulf Breeze, FL, USA), to be of 99.7% purity. This specimen and its use are described in the last paragraph of Section 3.2.
All Differential Scanning Calorimetric (DSC) results were obtained using a Perkin-Elmer (Shelton, CT, USA) Model DSC 7 power-compensated DSC. This instrument was used in conjunction with a Perkin-Elmer Model TAC 7/DX Thermal Analysis Controller and Perkin-Elmer Pyris 7 Thermal Analysis Software for all data presentation and calculations. In all experimental work, the DSC analyzer cell was thermostated with a heat sink employing a massive aluminum metal cylinder in an ice bath. This allows the use of the DSC from a starting temperature of ca. 20 °C. All analyte sample masses were determined by weighing using a Perkin-Elmer Model AD-6 Ultramicro Autobalance.
A schematic description of a power-compensated DSC measuring cell is shown in Figure 2. This instrument measures the power required to keep both the sample and reference at the same temperature as they are subjected to a programmed heating rate. Thus, an endothermic event will be observed as a positive (upward) response and an exothermic event will be observed as a negative (downward) response on the DSC thermal curve. The resulting DSC thermal curve describes these responses as “heat flow rate” in milliwatts (mW) on the ordinate axis and the sample temperature on the abscissa.

2.2. DSC Methodology Employed

In all studies presented here, the n-paraffin samples were encapsulated in aluminum DSC pans obtained from the instrument vendor. A mechanical crimper was used to seal the aluminum pan and lid as well as to compress the sample for better thermal contact with the platinum–iridium alloy sample holder. The sample mass employed for each specimen studied ranged from 1.120 mg to 3.560 mg depending on the objective of the study.
The DSC instrument was calibrated for temperature assignment using ASTM standard methodology established by ASTM committee E37 [17] as well as for calorimetric accuracy [18]. In the calibration procedure, a weighed specimen of high-purity (99.99%) indium was employed. In the power-compensated instrument, which employs both sample and reference heater sensors in a null-balance circuitry, a single temperature reference is sufficient in the temperature range of this study. The temperature-measuring transducers employed by this instrument are platinum resistance thermometers. The n-paraffin samples were heated at a selected heating rate, from a starting isothermal temperature of 50 °C, to obtain the heating DSC thermal curve. Once the upper sample temperature was reached, it was then held isothermally for one minute at 80 °C prior to cooling at a programmed temperature rate to obtain the cooling curve data. The heating rates, cooling rates, and analyte sample masses employed in each analytical DSC experiment are given in the caption of the corresponding figure displaying the DSC thermal curve.

3. Results and Discussion

3.1. DSC Thermal Curves Obtained from This Study

Some examples of the resulting DSC thermal curves obtained for both n-dotriacontane and n-hexatriacontane are given here in Figure 3, Figure 4 and 
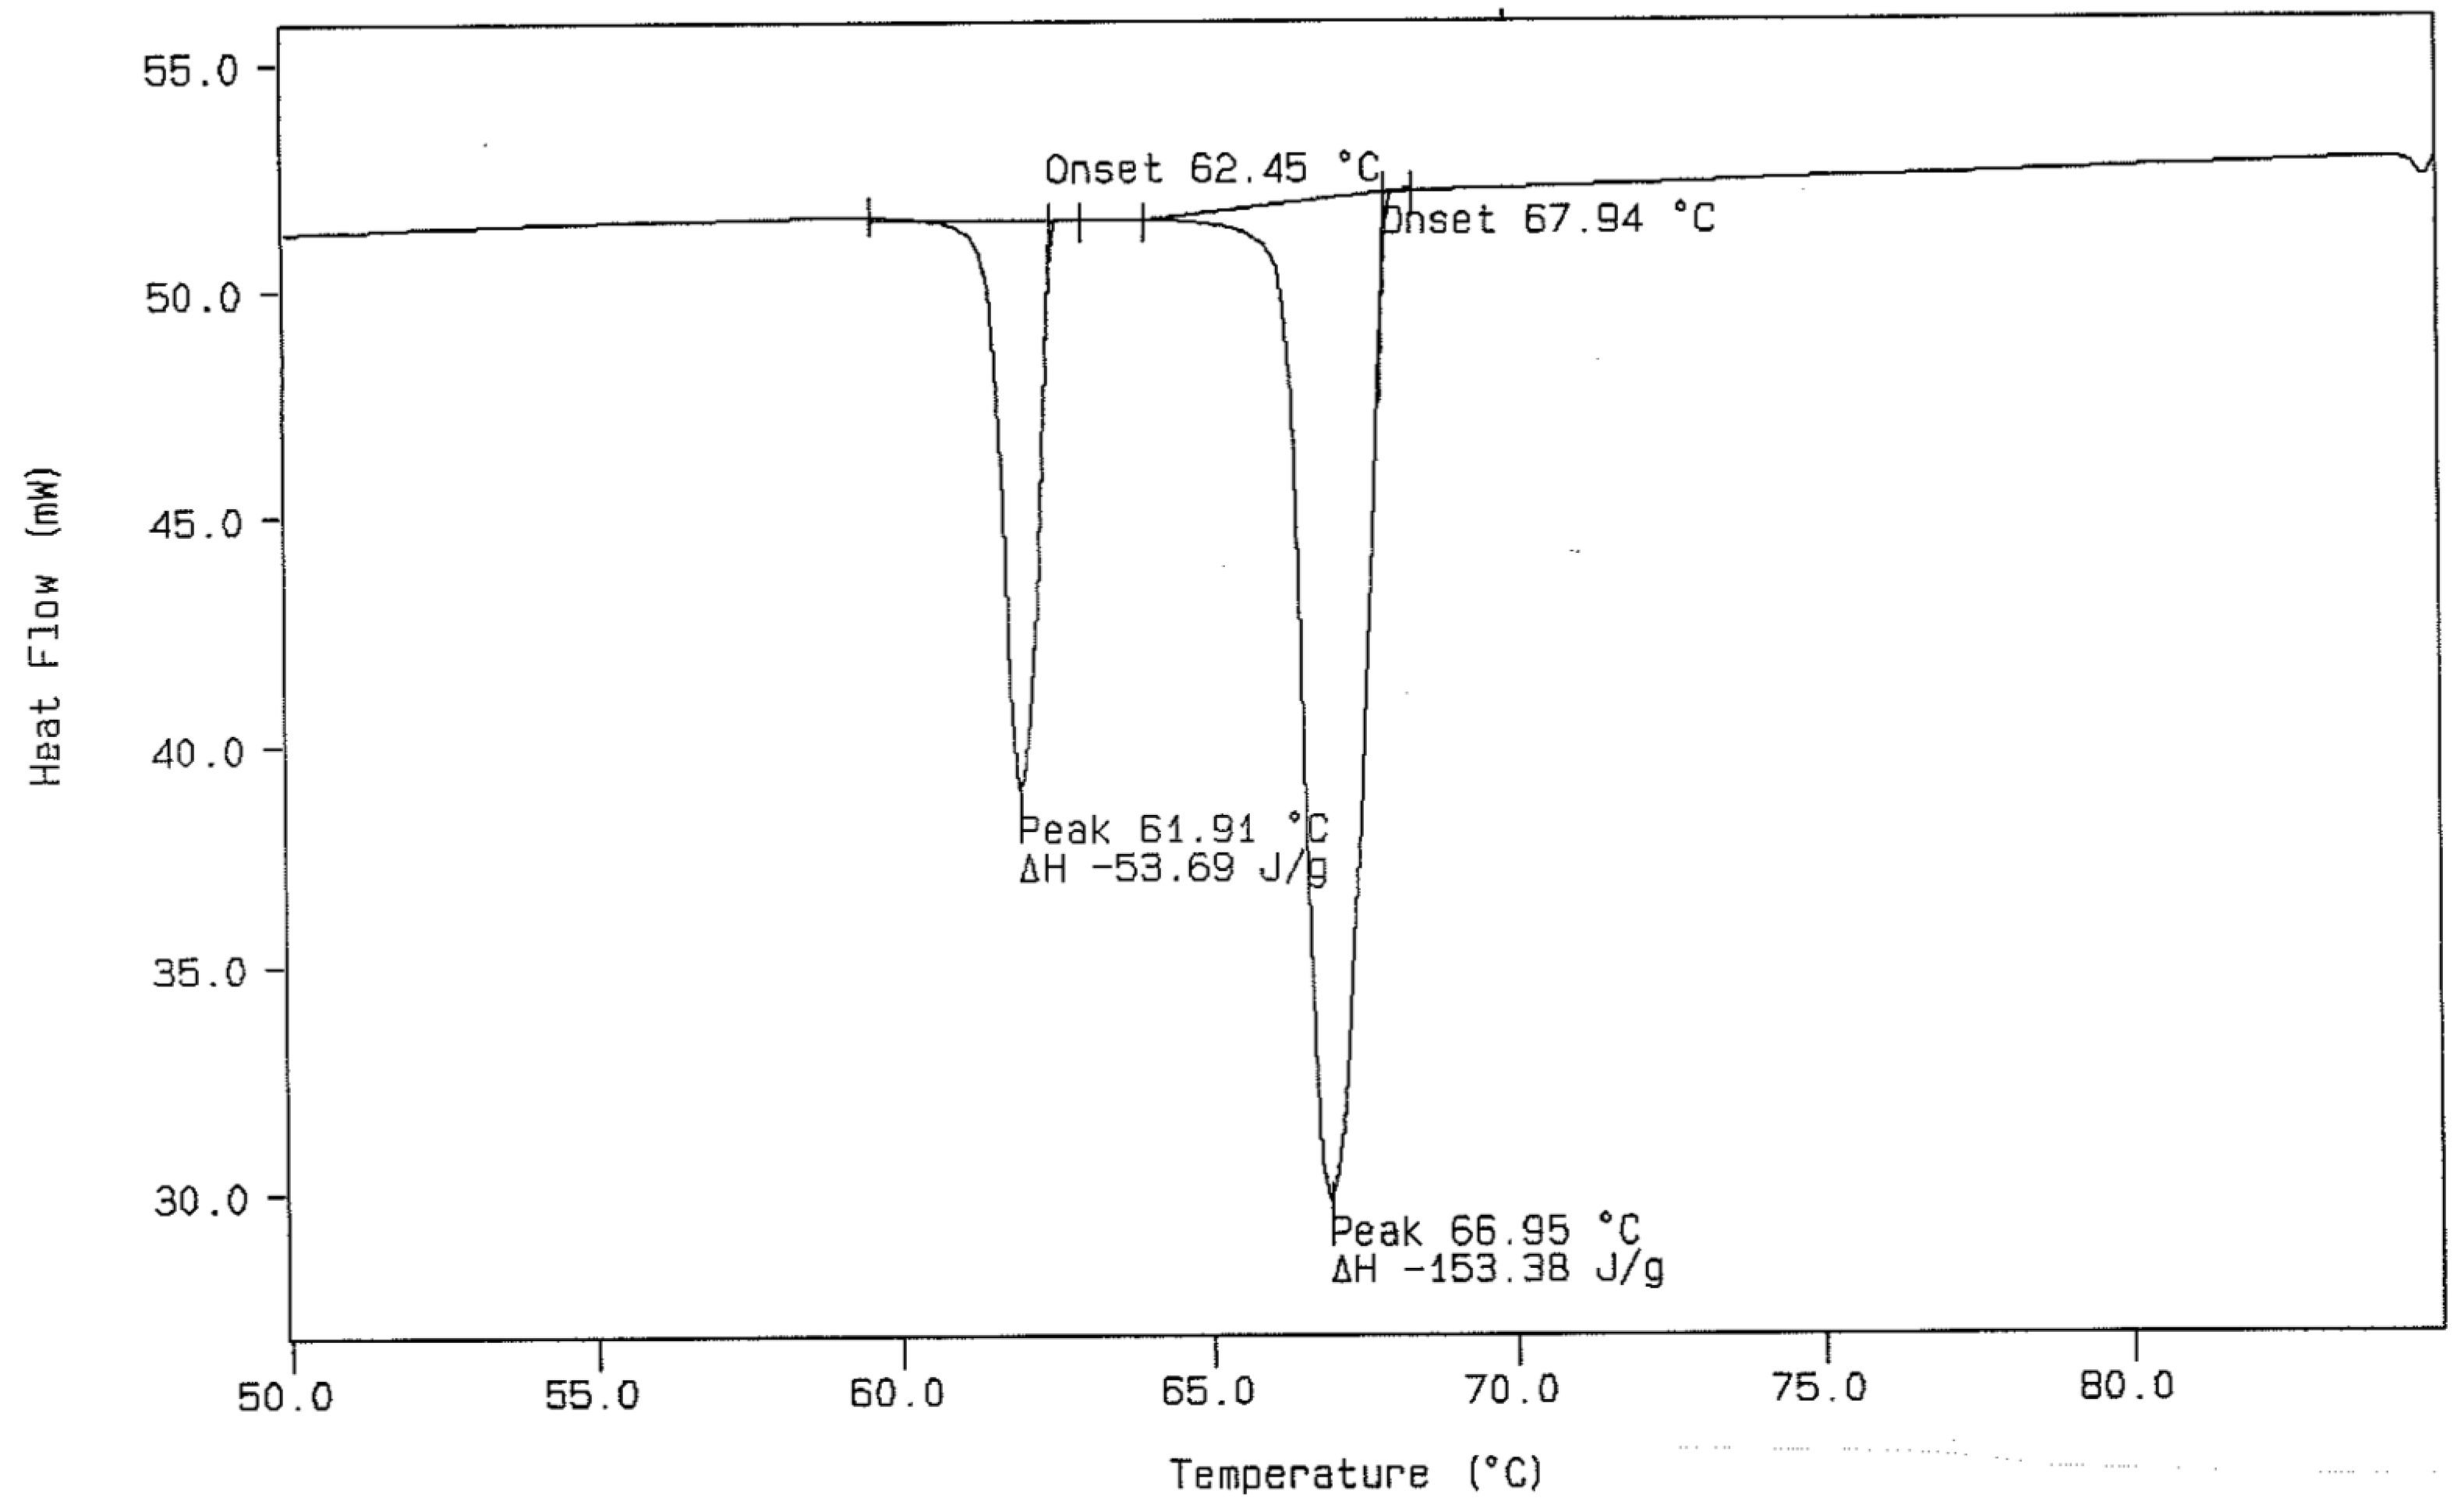
Figure 5. As was mentioned earlier, a major difficulty for these DSC studies is the weakly observed (low-energy) event for the monoclinic to orthorhombic form of n-dotriacontane. As a result, these analyses were performed at relatively low heating rates and small analyte sample mass in an effort to improve peak resolution in the resulting DSC thermal curves. The heating rate and sample mass for each study is given in the figure caption located above in each of the corresponding figures. Comparatively speaking, a large portion of DSC analyses performed throughout the world routinely employ sample masses ranging from 8 to 12 mg and heating rates of 10 or 20 °C/min.
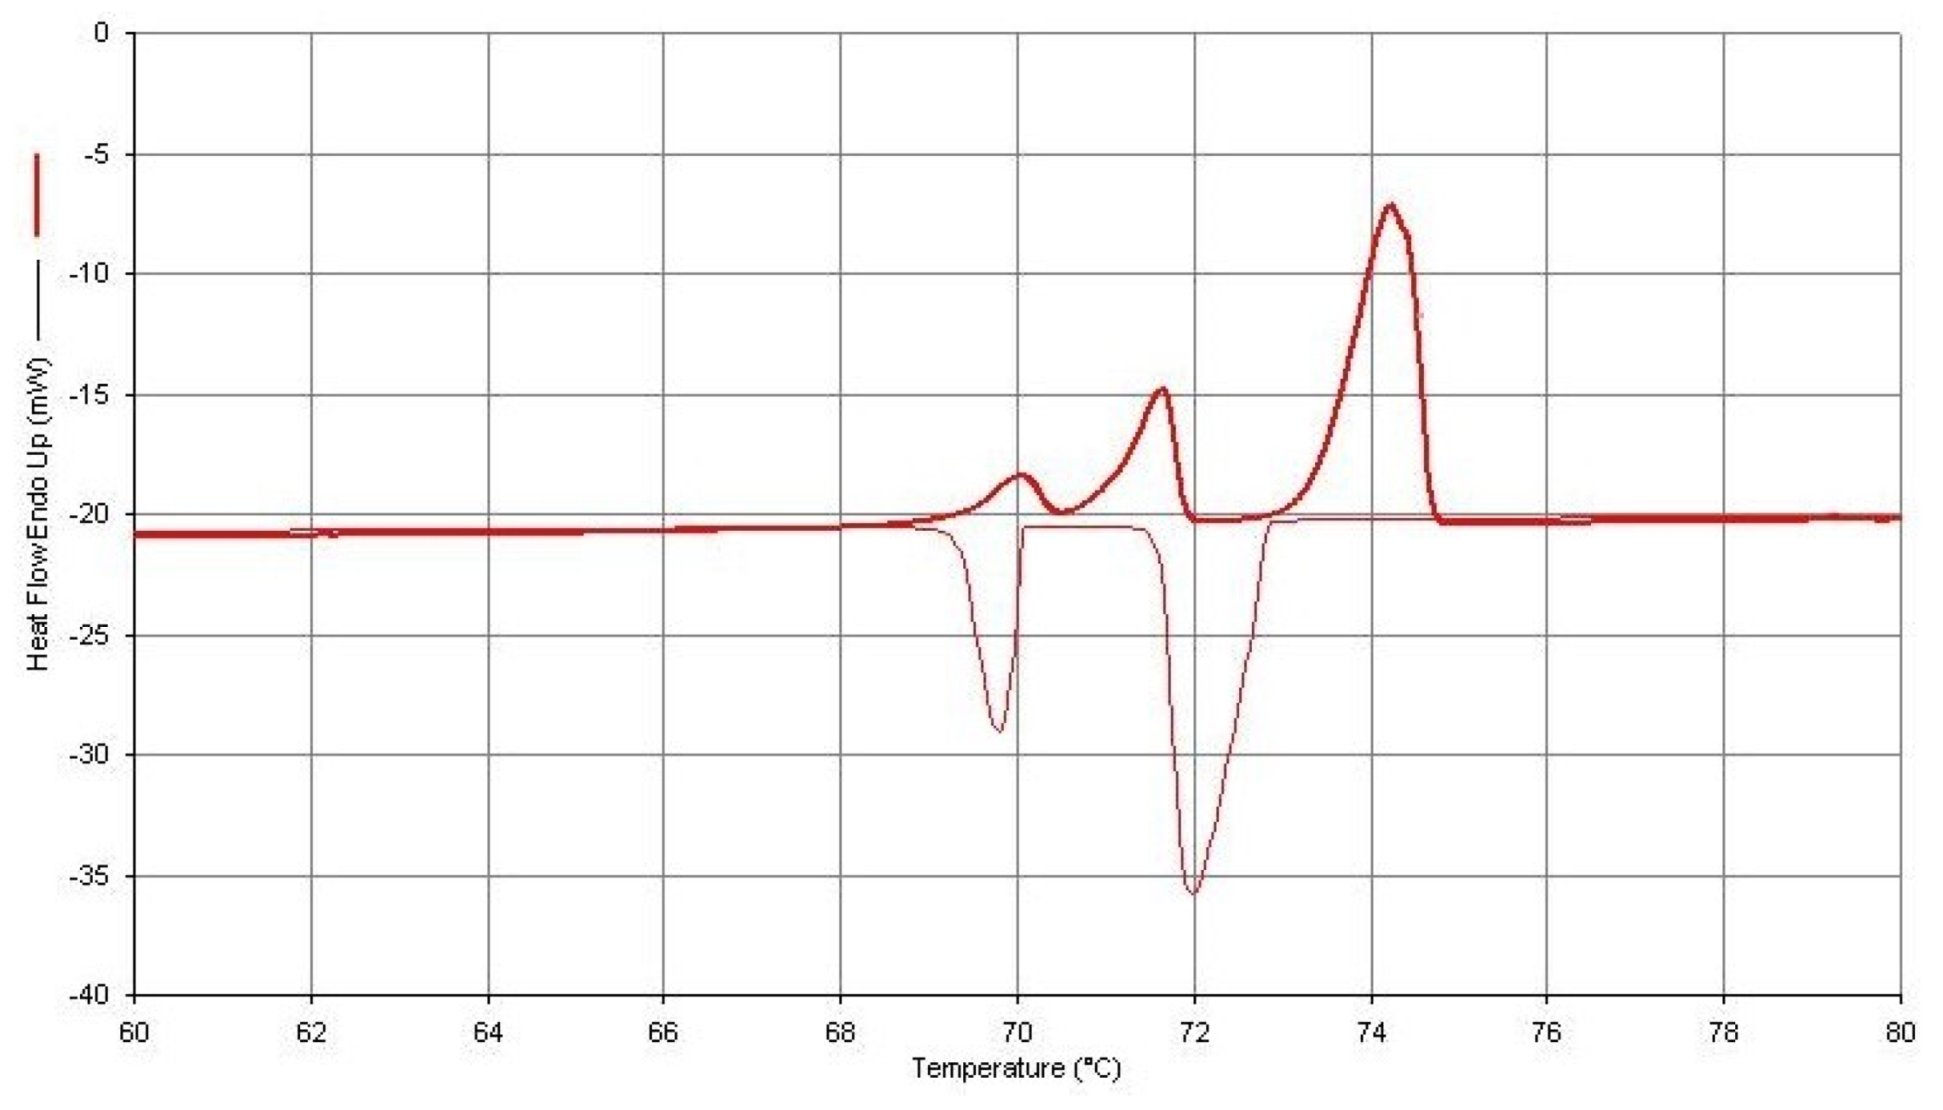
Figure 3 and Figure 4 were obtained from both heating and cooling experiments for the two n-paraffins of this study. One will observe that all three of the expected endothermic transitions are exhibited for each of the paraffins, but only two exothermic transitions are present in the cooling curves. This is not always the case for n-C36H74 but is the usual observation for the cooling curves obtained for the n-C32H66 specimen. The most probable reasons for the absence of this weak exothermic transition in n-dotriacontane are those given by Broadhurst [1], as mentioned earlier in this study. One will also note that when both heating and cooling curves for these particular sample specimens are compared, there is not a very large difference in the onset temperatures for these observed transitions.
The use of the earlier mentioned approach to achieving increased resolution of the two solid–solid transitions (by decreasing the heating rate of the DSC experiment) also leads to two important consequences. First, the peak height of the DSC thermal curve is decreased when the heating rate is decreased. Thus, there is a decrease in the ability of the instrument to observe this weak transition. Second, the temperature calibration of the instrument can also be affected by change in heating rates. A decrease in heating rate, most often, will lead to a lower value obtained for the temperatures of the measured transition. On the other hand, an increase in heating rate leads to a larger value of the onset temperatures for the transition being assigned. Therefore, to reduce this effect, the DSC instrument should be temperature-calibrated using the same heating rate as that used in this experimental DSC analytical procedure.
The assignment of temperature for transitions observed by DSC, for this type of compound, is based on the extrapolated onset temperature (To) obtained from the thermal curve. It is not assigned from the observed DSC peak maximum in the experimentally obtained DSC thermal curve. The To is assigned from the thermal curve, by the thermal analysis software, as the temperature of intersection of the extrapolated pre-transition baseline and a tangent line drawn from the point of maximum slope of the leading edge of the measured DSC peak.
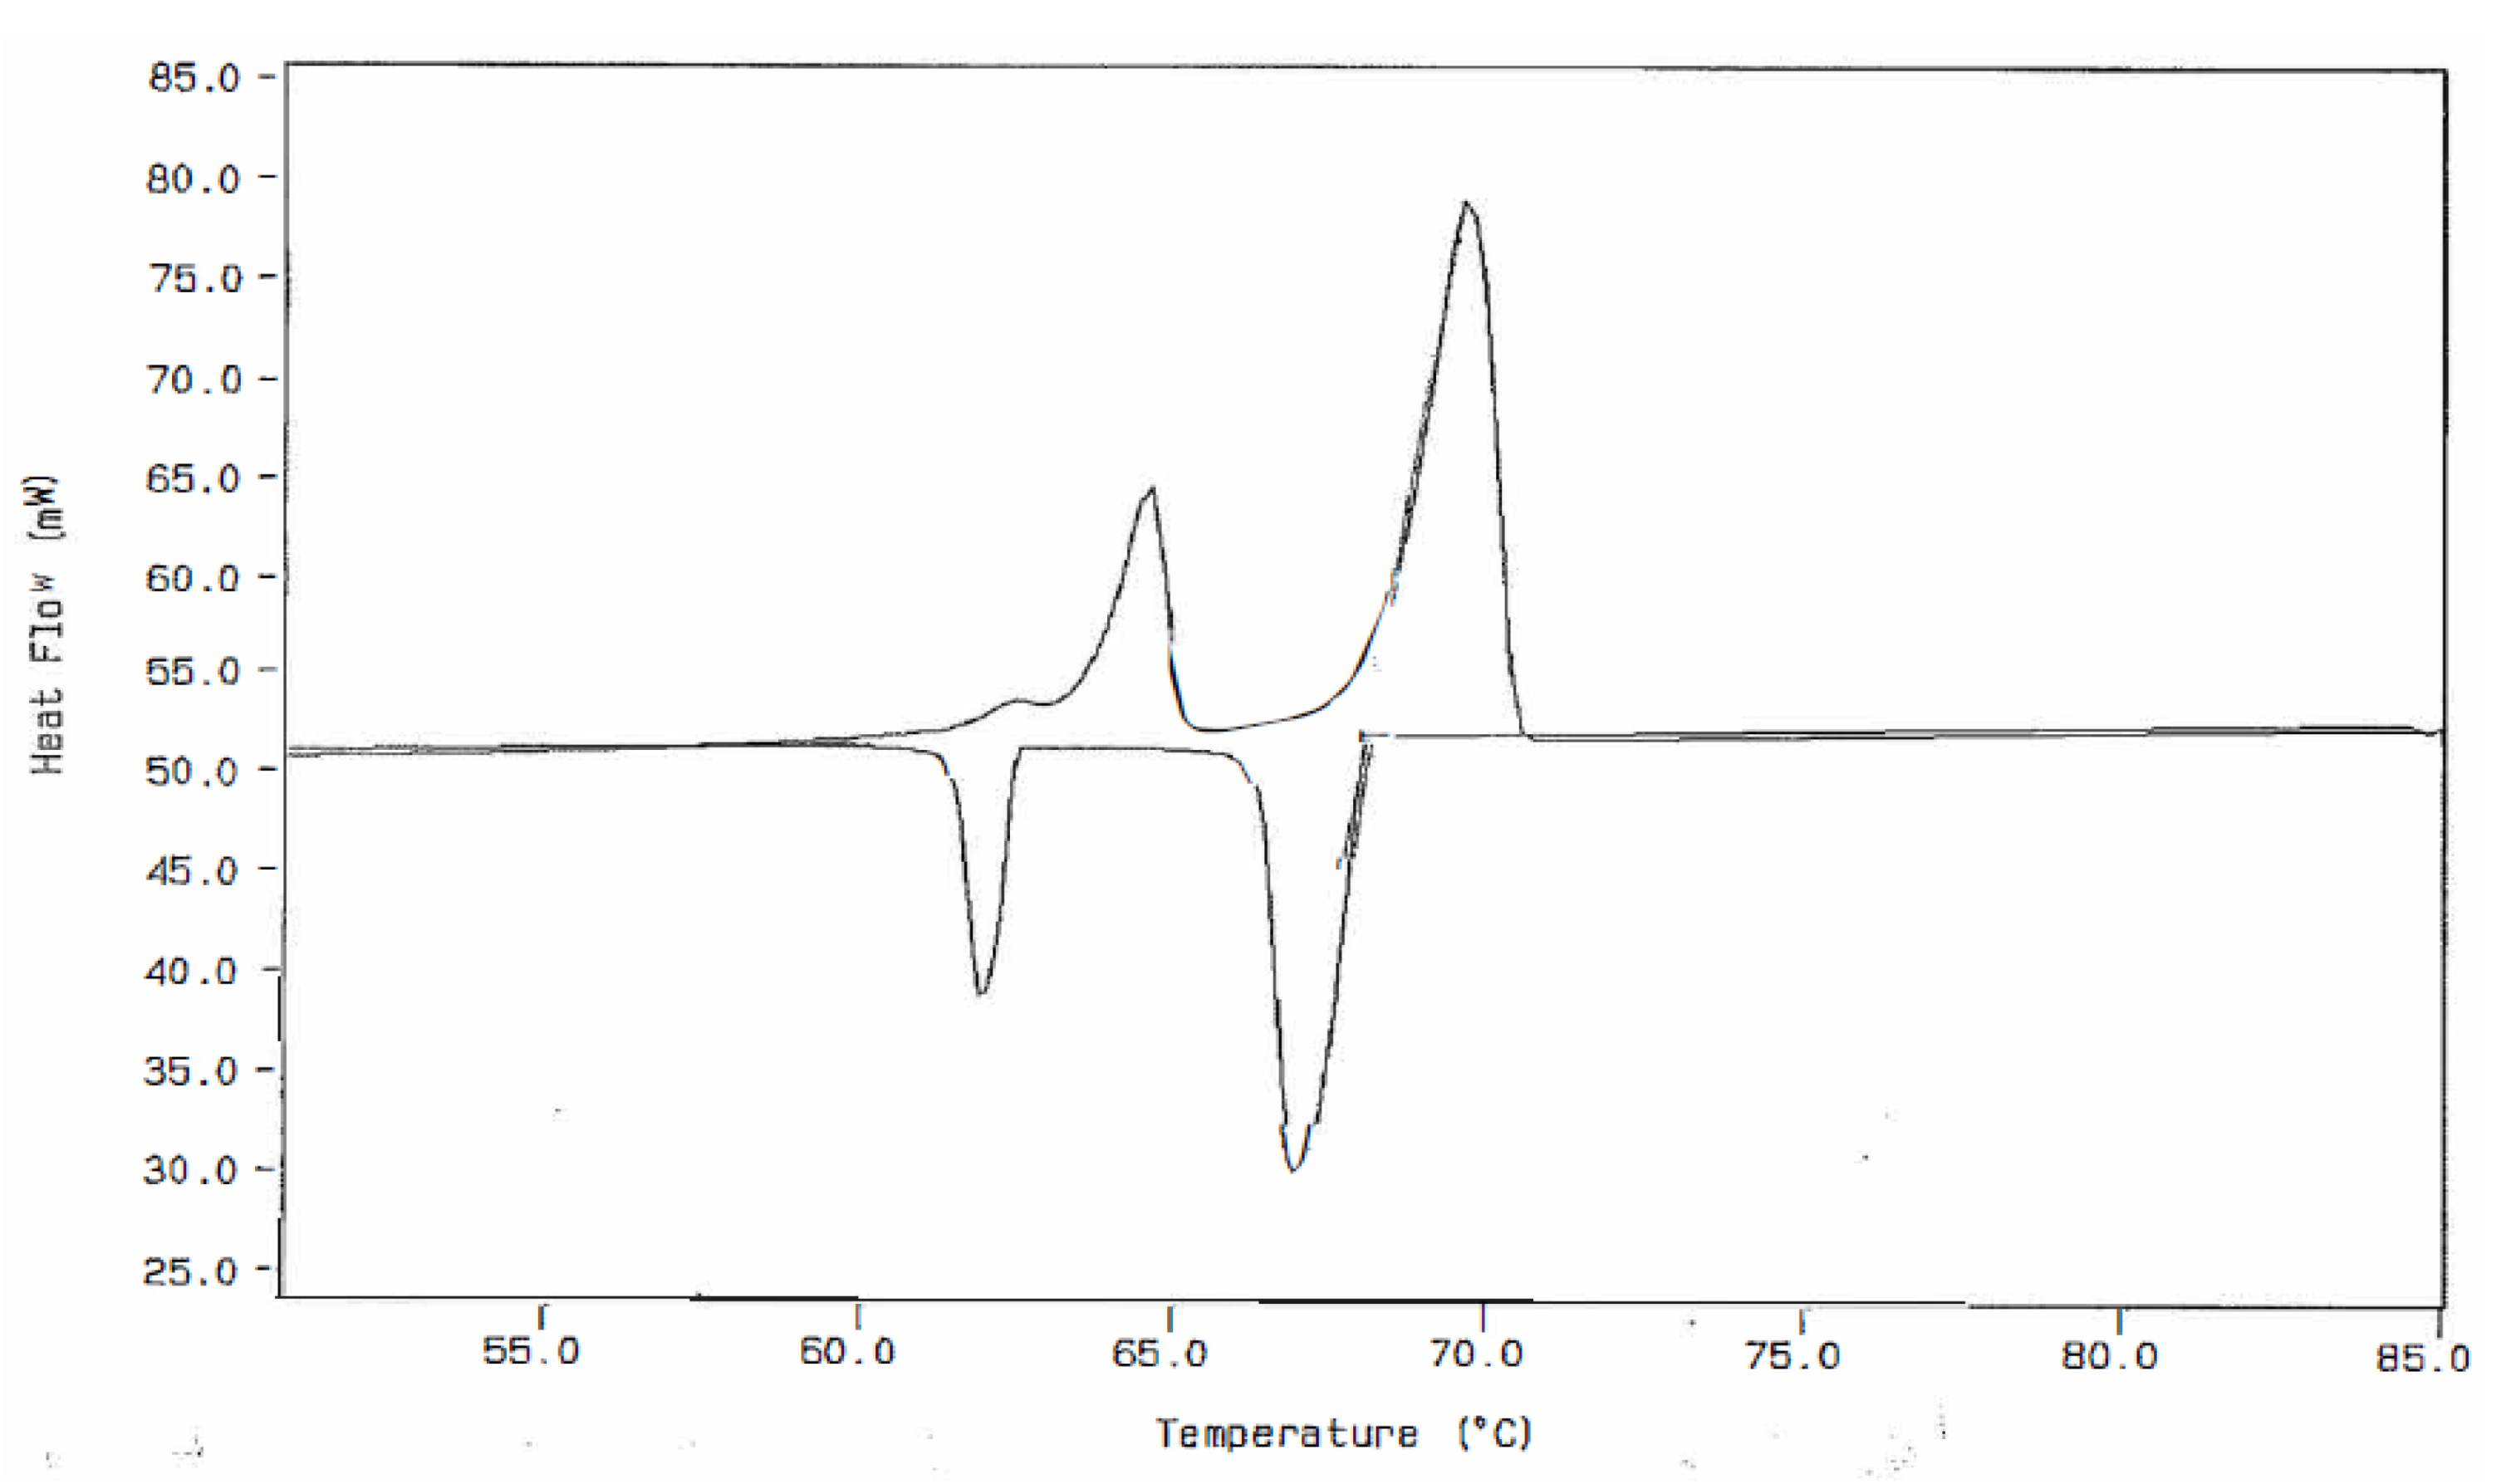
Figure 5 displays the cooling curve, which was given as a part of Figure 4. This figure also shows the data-handling procedure for obtaining the extrapolated onset temperature for the transitions in a DSC cooling curve. In this case, the extrapolated tangent line is made from the high-temperature side of the exothermic (downward) peaks. In the ideal case (complete thermal reversibility), the extrapolated onset temperatures obtained (from both heating and cooling experiments) should be exactly the same when the heating and cooling rates used are the same. This is seldom the case due to several reasons. Supercooling is one of the possible reasons, while another is that the instrument is usually temperature-calibrated using the heating mode of operation. For these reasons, the cooling curve generally gives a slightly lower onset temperature. When large differences between the onset temperatures in the first heating and cooling runs for the same sample specimen are observed, this is usually an indication of lack of purity of the sample specimen. For this reason, it is recommended by the authors of this paper that the first heating runs be used only when assigning temperatures of transitions for n-paraffins by DSC.

3.2. DSC Results for the n-Paraffins of This Study

The experimental DSC results obtained in our laboratory for the two n-paraffins of interest represent the work of several groups of two students each. The values for the experimentally observed thermal transitions, in the DSC thermal curves, were averaged and are reported in Table 1. The procedure for the experimental DSC work was described earlier in this paper. It was found that the best results for n-dotriacontane were obtained with heating rates as low as one or two degrees per minute in order to obtain better separation between the monoclinic to orthorhombic transition and the subsequent orthorhombic to hexagonal (rotational) transformation in the n-paraffin. One can see from the listed temperatures that the average temperature difference between these two thermal events, obtained by the participants in this study, is slightly more than 1 degree Celsius in n-C36H74 and is less than 1.5 degrees Celsius of separation in the DSC thermal curves for n-C32H66. As was reported earlier, sample masses for the analytical sample size were often as small as 1.120 mg when obtaining DSC data for the n-C32H66 sample. The desired DSC thermal curves for obtaining the temperature and calorimetric data would look very similar to that obtained for n-hexatriacontane shown in Figure 5.
In the study of the n-dotriacontane specimen, some of the participating analysts did not report a value for the monoclinic to orthorhombic transition temperature (T1) nor the enthalpy change for this endothermic event. This was primarily due to poor separation of this transition peak in the DSC thermal curves, which were obtained in their experimental efforts. Some examples of this type of overlap are shown in the heating curves of Figure 3, as well as in the lower thermal curve of Figure 4. However, in many of these cases, the onset temperature (To) for this transition can be approximated by the data-handling software using a tangent line drawn to the leading edge of the overlapped endothermic peak. When this was done here, the assigned To values were averaged, and a mean value of 63.71 °C was included in Table 1 for the endothermic transition temperature T1. This method of approximation of T1 from the overlapped peaks would seem to always give a slightly lower value depending on the degree of overlap of the two endothermic peaks.
The assignment of the enthalpy change (∆H1) for this overlapped (monoclinic to orthorhombic) peak in n-dotriacontane is more difficult. For this case of overlapped peaks, the best approximation of this value is obtained by using the following subtraction (or “difference”) method:
First, the ΔH2 value (for the orthorhombic to hexagonal transition) may be assigned from the absolute value of the exothermic transition observed in the DSC cooling curve (hexagonal to orthorhombic transition).
Mathematically, ΔH2 of the endothermic heating value is equal to −ΔH2 of the exothermic transition. That is, (ΔH2)heating = −(ΔH2)cooling.
Now, the total energy observed for the overlapped endothermic peaks, ΔHTotal, in the DSC thermal curve is the sum of ΔH1 and ΔH2. That is, ΔHTotal = ΔH1 + ΔH2.
Therefore, ΔH1 is obtained by the subtraction
ΔH1 = ΔHTotalΔH2
When this is carried out, the mean of the assigned values of ∆H2 (54.28 J/g) obtained from the cooling curves is subtracted from the average value obtained for the total change in enthalpy of the overlapped peaks in the heating thermal curves (71.66 J/g). The total change in enthalpy for the overlapped peaks is assigned by use of the data-handling software of the DSC, using the total area of the combination peak formed by the two endothermic polymorphic transitions. When this subtraction procedure was completed here, an enthalpy of transition value of 17.38 J/g was obtained for the monoclinic to orthorhombic transition of the n-C32H66. One will note that cooling curves for n-C32H66, such as that shown in Figure 5, which lead to the transition energy (∆H2) value, are needed in this case. The value obtained for ∆H1, using the subtraction method described here, was therefore not obtained by a direct assignment and is probably less accurate than other thermodynamic values listed in Table 1.
Table 2, given below, restates the results given in Table 1 in different units. The temperatures of transition were converted to degrees Kelvin, and the heats of transition were changed to molar quantities of kilojoules/mole (kJ/mol). These values were then used to calculate the molar entropy change (∆S) using the following equation:
∆S = ∆H/T
Use of Equation (2) gives the value for the change in entropy of the particular transition in units of Joules per mole per degree Kelvin (J mol−1 K−1). These units are often abbreviated as Entropy Units (eu), and they are employed as this manuscript continues. Unfortunately, there are no reference standards for physical properties of n-C32H66 or n-C36H74 available. The values given in the NIST WebBook SRD 69 [19] are published data found in the literature by various laboratories. When the DSC results given in Table 2, obtained by the student lab analysts, are compared to available sources of published data [19,20,21,22], one will see that reasonable agreement was observed for the average values for this study. In a few cases, the temperatures of transition were lower by as much as two degrees Kelvin. On the contrary, the student values matched the literature values for the transition temperature of the orthorhombic to hexagonal (rotational transition) by an exceptionally small 0.1 to 0.2 K margin in both of the n-paraffins studied. It will also be seen that the average value experimentally obtained for the ∆H value for the monoclinic to orthorhombic transition in the n-hexatriacontane (19.57 J/g or 9.92 kJ/mol) was exactly the same as that given by the data referenced by NIST [19].
The comparison of the molar quantities of both the ∆H and ∆S values for the solid to liquid (fusion) transition, in each of the two paraffins, is interesting. The experimental values obtained are smaller than the NIST WebBook [19] listing by very similar amounts (ca. 4–5%). The ∆S values in Table 2 are 211.6 eu for n-dotriacontane and 243.4 eu for n-hexatriacontane. When compared to the NIST WebBook values of 222.93 and 254.5 eu, respectively, an absolute difference of 11.3 eu (or a relative difference of 5.06%) is obtained for the n-dotriacontane specimen of this study. When the same is done for the n-hexatriacontane value, an absolute difference of 11.1 eu or a 4.36% relative difference is the result. These differences in ∆S values are primarily due to the fact that the heat of fusion (∆Hm) values, obtained for each of the paraffin specimens, were lower than the values listed by NIST WebBook by the amounts of 5.78% (n-dotriacontane) and 4.84% (n-hexatriacontane).
Comparisons of results for n-paraffins, such as those given above, are affected by both the purity and thermal history of the specimens being compared. Without detailed information, it is difficult to say that one set of data is better than another. It must be remembered that, in this case, the NIST values are not those of NIST reference standards. They are values previously published in the literature by different authors in separate laboratories with different n-paraffin obtained from many different sources. This issue could be overcome, to some degree, by the establishment of a reference standard for physical properties of these long-chain normal paraffins.
It should also be mentioned that a specimen of n-C32H66, commonly employed as a reference for retention time (or elution volume) assignments in gas chromatographic analyses, was recently obtained from Separation Systems, Inc., Gulf Breeze, Fl. It is a purified sample of Sigma Chemical D-223107, Lot # 05718JM. This sample was analyzed chromatographically at the Separation Systems Laboratory and assigned a purity value of 99.7%. When this specimen of n-C32H66 was analyzed by DSC in our laboratory, a melting temperature of 67.98 °C and a heat of fusion of 156.01 J/g was obtained. When these values are compared with those listed for the n-C32H66 of our study in Table 1, the heats of fusions are essentially identical, and the melting temperatures differ by only 0.25 °C. This strongly suggests that values reported in this study for the n-C32H66 specimen do not exhibit colligative property effects, such as melting point lowering [23], due to impurities.

4. Concluding Remarks

This study demonstrates that Differential Scanning Calorimetry (DSC) is a valuable tool for studying the phase behavior of n-paraffins. One does not have to employ a power- compensated DSC such as that used in this study. Several of the other commercial DSC instruments perform well enough to obtain DSC thermal curves suitable for the study of these n-paraffins. The main requirement of the DSC instrumental performance, in this case, is adequate sensitivity of the ordinate signal measurement. The instrument must have enough sensitivity to measure the ordinate response obtained for these n-paraffins when small sample sizes are heated at low heating rates. This small sample mass is necessary in order to obtain adequate resolution of the DSC peaks. This requirement also dictates the use of a microbalance for accurately weighing the small samples for analysis.
In the DSC results of this study, all three of the endothermic transitions were able to be observed, as well as in the DSC thermal curves for (small sample masses of 1.0 mg to 1.6 mg) n-hexatriacontane at heating rates of 2.0 °C/min or less. Thus, the temperatures of transitions, as well as the energy of transitions, were easily assigned by the thermal analysis software. Unfortunately, this was not the case for the n-dotriacontane specimen. Complete resolution of the two polymorphic transitions was not achieved when using heating rates as low as 1.00 °C/min and analyte samples as small as 1.10 mg in mass. Therefore, a method of indirect assignment for obtaining the ∆H of the monoclinic to orthorhombic transition from the two overlapping endothermic DSC peaks was presented. Furthermore, due to the degree of overlap, difficulty was also encountered in assigning the temperatures of onset (T1) for the monoclinic to orthorhombic transition of the n-dotriacontane specimen. A tangential line drawn to the leading edge of the overlapped peak (and extended to the intersection with the pretransition baseline of the DSC thermal curve) was employed to approximate the temperature of transition (T1). Therefore, both of the values (T1 and ∆H1) listed in Table 1 and Table 2 for n-C32H66 are to be considered “approximate values”.

Author Contributions

Conceptualization, C.M.E.; C.M.E.; data curation, J.J. and A.D.; writing—original draft preparation, C.M.E.; writing—review and editing, C.M.E.; visualization, J.J. and A.D.; supervision, C.M.E. All authors have read and agreed to the published version of the manuscript.

Funding

This research received no external funding.

Institutional Review Board Statement

Not applicable.

Informed Consent Statement

Not applicable.

Data Availability Statement

Not applicable.

Conflicts of Interest

The authors declare no conflict of interest.

References

  1. Broadhurst, M.G. An Analysis of the Solid Phase Behavior of the Normal Paraffins. J. Res. Nat. Bur. Stds. 1962, 66, 241. [Google Scholar] [CrossRef]
  2. Himran, S.; Suwono, A.; Mansoori, G.A. Characterization of Alkanes and Paraffin Waxes for Application as Phase Change Energy Storage Medium. J. Energy Sources 1994, 16, 117–128. [Google Scholar] [CrossRef]
  3. Ling, T.C.; Poon, C.S. Use of Phase Change Materials for Thermal Heat Storage in Concrete: An Overview. Constr. Build. Mater. 2013, 46, 55–62. [Google Scholar] [CrossRef]
  4. Muller, A. The Crystal Structure of the Normal Paraffins at Temperatures Ranging from that of Liquid Air to the Melting Points. Proc. R. Soc. 1930, 127, 417. [Google Scholar]
  5. Muller, A.A. Further X-ray Investigation of Long Chain Compounds (n-Hydrocarbon). Proc. R. Soc. 1928, 120, 437. [Google Scholar]
  6. Wyckoff, R.W.G. Crystal Structures; Interscience Publishers, Inc.: New York, NY, USA, 1960; Chapter 8. [Google Scholar]
  7. Smith, A.E. The Crystal Structure of the Normal Paraffin Hydrocarbons. J. Chem. Phys. 1953, 21, 229. [Google Scholar] [CrossRef]
  8. Vand, V. Density and unit cell of n-hexatriacontane. Acta Cryst. 1953, 6, 797. [Google Scholar] [CrossRef]
  9. Muller, A.; Lonsdale, K. The low-temperature form of C18H38. Acta Cryst. 1948, 1, 129. [Google Scholar] [CrossRef]
  10. Schaerer, H.M.; Vand, V. The crystal structure of the monoclinic form of n-hexatriacontant. Acta Cryst. 1956, 9, 379. [Google Scholar]
  11. Bunn, C.W. The crystal structure of long-chain normal paraffin hydrocarbons. The “shape” of the CH2 group. Trans. Faraday Soc. 1939, 35, 482. [Google Scholar] [CrossRef]
  12. Hoffman, J.D. Hindered Intermolecular Rotation in the Solid State: Thermal and Dielectric Phenomena in Long-Chain Compounds. J. Chem. Phys. 1952, 20, 541. [Google Scholar] [CrossRef]
  13. Norman, N.; Mathisen, H. The Crystal Structures of Normal-Pentane, Normal-Hexane, Normal-Heptane, and Normal-Octane. In Acta Crystallographica; Munksgaard Int Publisher Ltd.: Copenhagen, Denmark, 1960; Volume 13, p. 1043. [Google Scholar]
  14. King, W.H., Jr.; Camilli, C.T.; Findeis, A.F. Thin Film thermocouples for Differential Thermal Analysis. Anal. Chem. 1968, 40, 1330. [Google Scholar] [CrossRef]
  15. Templin, P.R. Coefficient of Volume Expansion for Petroleum Waxes and Pure n-Paraffins. Ind. Eng. Chem. 1956, 48, 154–161. [Google Scholar] [CrossRef]
  16. Earnest, C.M. A Study of the Gas Solid Interface Using a Quartz Crystal Microbalance. Ph.D. Dissertation, University of Alabama, Tuscaloosa, AL, USA, 1970. [Google Scholar]
  17. Method E967-08; Standard Practice for Temperature Calibration of DSC and DTA Analyzers. ASTM Book of Standards 14.02: 255; ASTM: Conshohocken, PA, USA, 2014.
  18. Method E967-02; Standard Practice for Heat Flow Calibration of Differential Scanning Calorimeters. ASTM Book of Standards 14.02: 257; ASTM: Conshohocken, PA, USA, 2014.
  19. NIST Chemistry WebBook, SRD69. Available online: https://doi.org/10.18434/T4D303 (accessed on 9 June 2022).
  20. Schaerer, A.A.; Busso, C.J.; Smith, A.E.; Skinner, L.B. Properties of Pure Normal Alkanes in the C17 to C36 range. J. Am. Chem. Soc. 1955, 77, 2017–2019. [Google Scholar] [CrossRef]
  21. Weast, R.C.; Grasselli, J.G. CRC Handbook of Data on Organic Compounds, 2nd ed.; Weast, R.C., Grasselli, J.G., Eds.; CRC Press Inc.: Boca Raton, FL, USA, 1980. [Google Scholar]
  22. Tozaki, K.; Inaba, H.; Hayashi, H.; Quan, C.; Nemoto, N.; Kimura, T. Phase transitions of n-C32H66 measured by means of high resolution and super-sensitive DSC. Thermochim. Acta 2003, 397, 155–161. [Google Scholar] [CrossRef]
  23. Beveridge, J.M.; Glasgow, A.R.; Rossini, F.D. Determination of freezing points and amounts of impurity in hydrocarbons from freezing and melting curves. J. Res. Nat. Bur. Stds. 1941, 26, 591–619. [Google Scholar]
Figure 1. Scheme for Solid-State Phase Transitions Exhibited by n-Paraffin Specimens of This Study (Monoclinic to Orthorhombic followed by Orthorhombic to Hexagonal Crystal Forms).
Thermo 02 00021 g001
Figure 2. Schematic of a Power-Compensated DSC Measuring Cell. Both Heaters and Sensors are Platinum Wires Configured in a Null-Balance Mode of Operation.
Thermo 02 00021 g002
Figure 3. DSC Thermal Curve (Upper) for a 1.460 mg Sample of n-Hexatriacontane Obtained at a Dynamic Heating Rate of 2 °C/min Followed by a Dynamic Cooling Rate of 2.0 °C/min (Lower).
Thermo 02 00021 g003
Figure 4. DSC Thermal Curve for a 3.050 Milligram Sample of n-Dotriacontane at a Heating Rate of 5.0 °C/min (Upper) Followed by a Dynamic Cooling Rate of 3.0 °C/min (Lower).
Thermo 02 00021 g004
Figure 5. DSC Cooling Curve from Figure 4 with Calculations of Onset Temperature (°C) and Heat of Transitions (Joules/gram).
Thermo 02 00021 g005
Table 1. Data Obtained from Resulting DSC Thermal Curves for n-Paraffins of this Study.
n-C32H66n-C36H74
T163.7170.83
T265.1671.92
Tm67.7374.01
∆H117.3819.57
∆H254.2857.06
∆Hm155.99166.51
Units for All Temperature Values are Degrees Celsius (°C). ∆H Values are Joules/gram (J/g).
Table 2. Restatement of Data of Table 1 in Units of Molar Quantities and Absolute Temperatures (Kelvin).
n-C32H66n-C36H74
T1336.9344.1
T2338.3345.1
Tm340.9347.2
∆H17.839.92
∆H224.4728.9
∆Hm72.1484.5
∆S123.2528.8
∆S272.3383.8
∆Sm211.6243.3
Units for the Above Values: Temperatures: Kelvin (K). Molar Heats of Transition: ∆H (kJ/mol). Entropy Change: ∆S (J/K mol). T1: Solid Transition (Monoclinic to Orthorhombic). T2: Solid-State Transition (Orthorhombic to Hexagonal). Tm: Melting Temperature (Solid to Liquid).
Publisher’s Note: MDPI stays neutral with regard to jurisdictional claims in published maps and institutional affiliations.

