
Ar-Matrix Studies of the Photochemical Reaction between CS2 and ClF: Prereactive Complexes and Bond Isomerism of the Photoproducts

Abstract
:1. Introduction
2. Materials and Methods
3. Results and Discussion
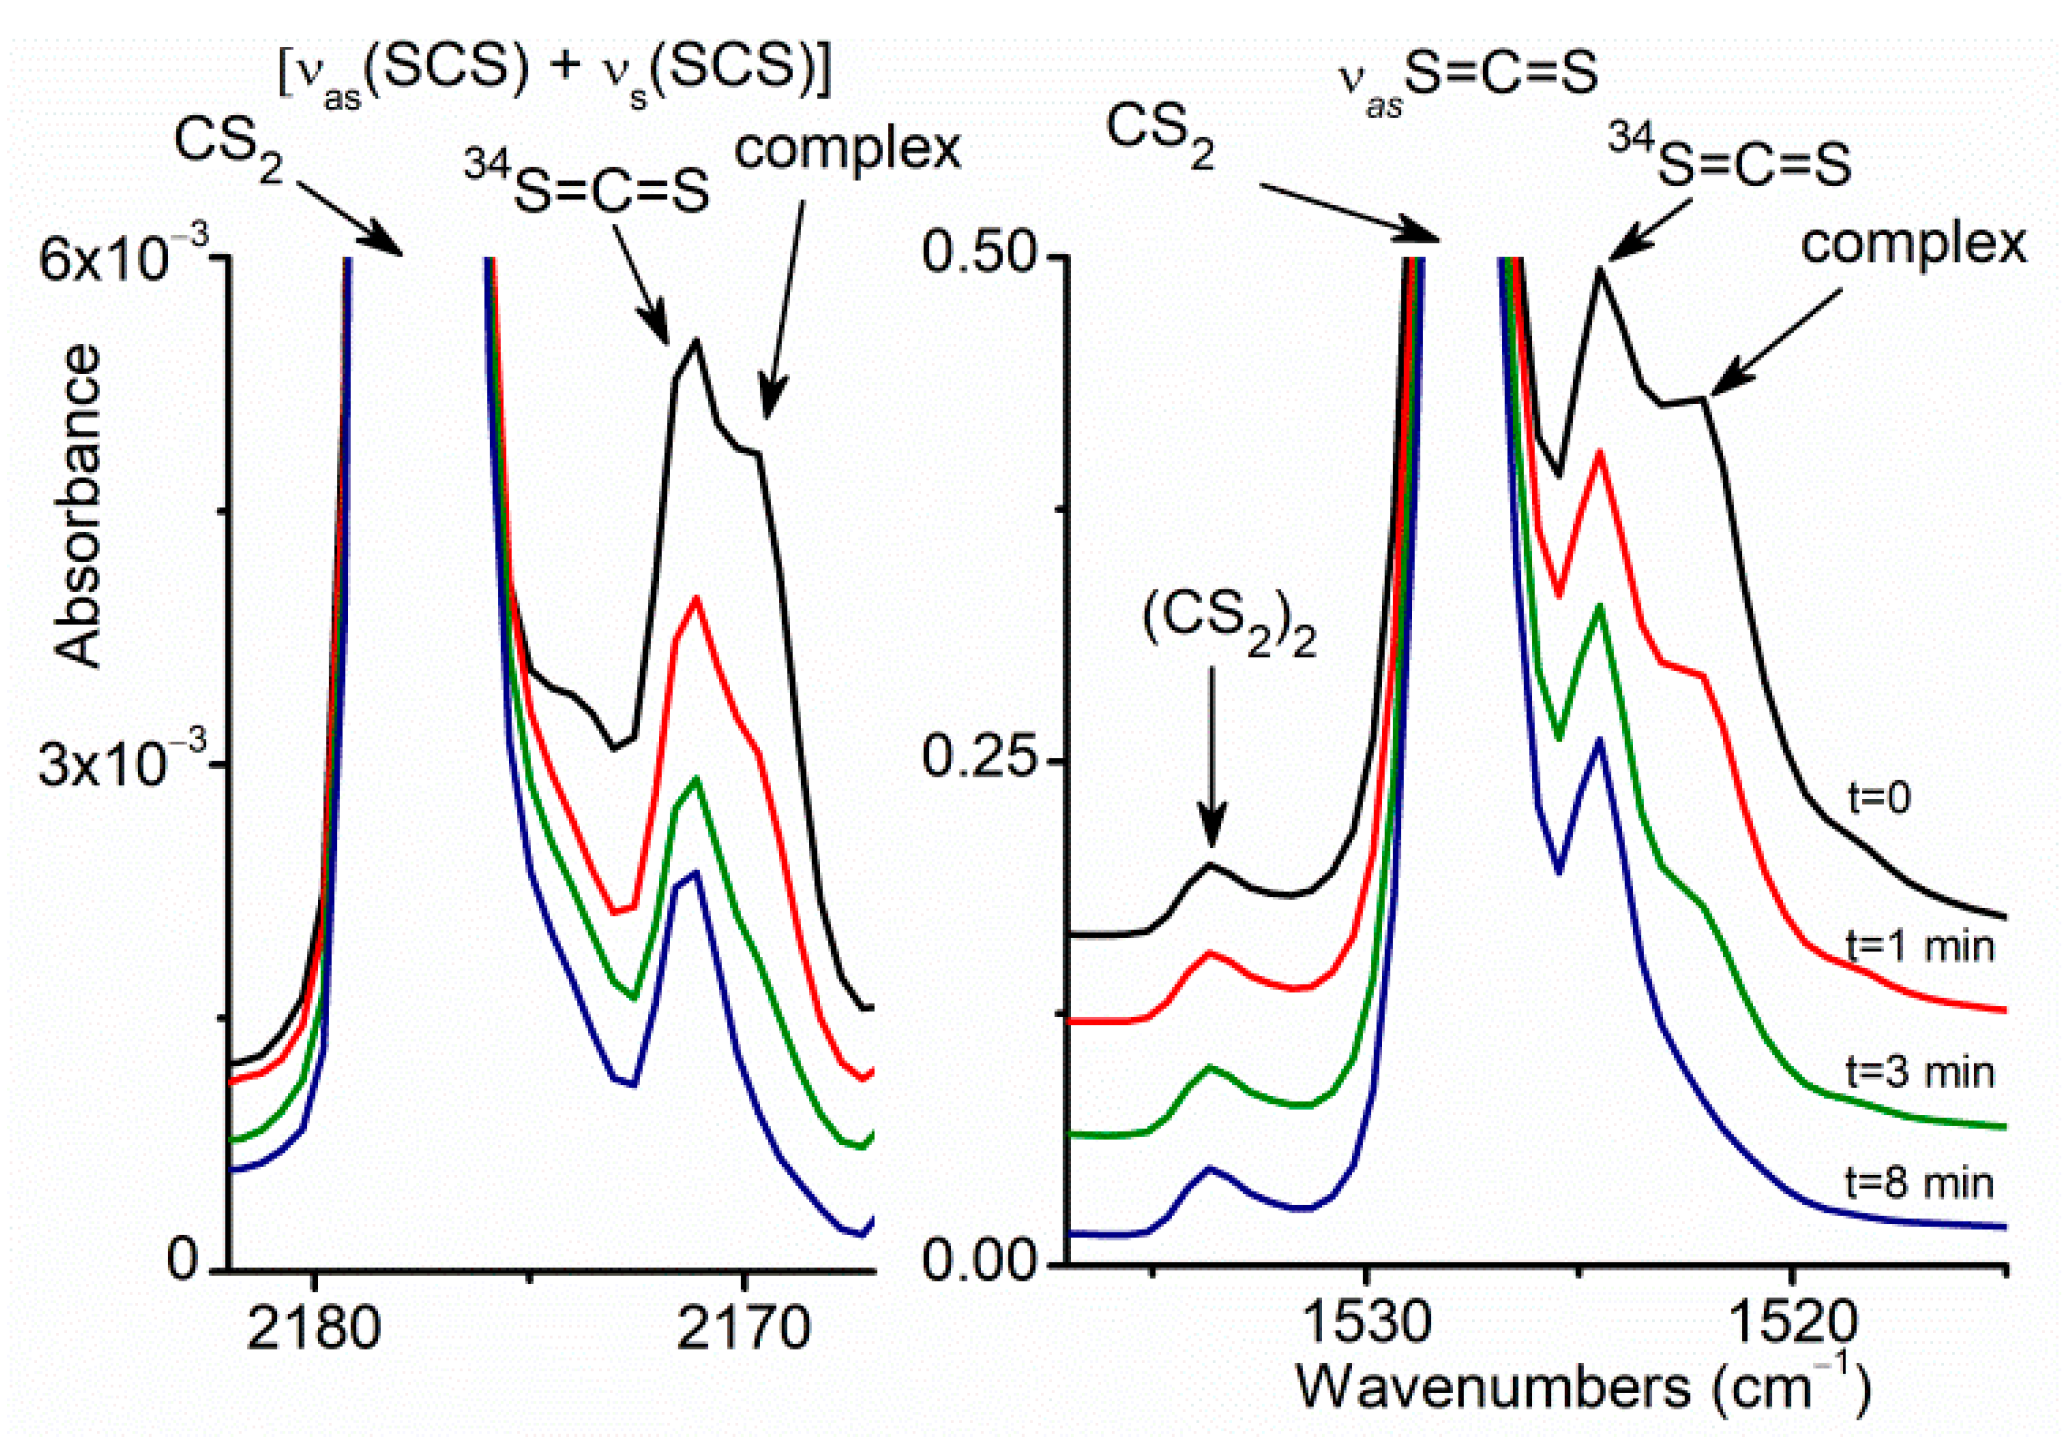
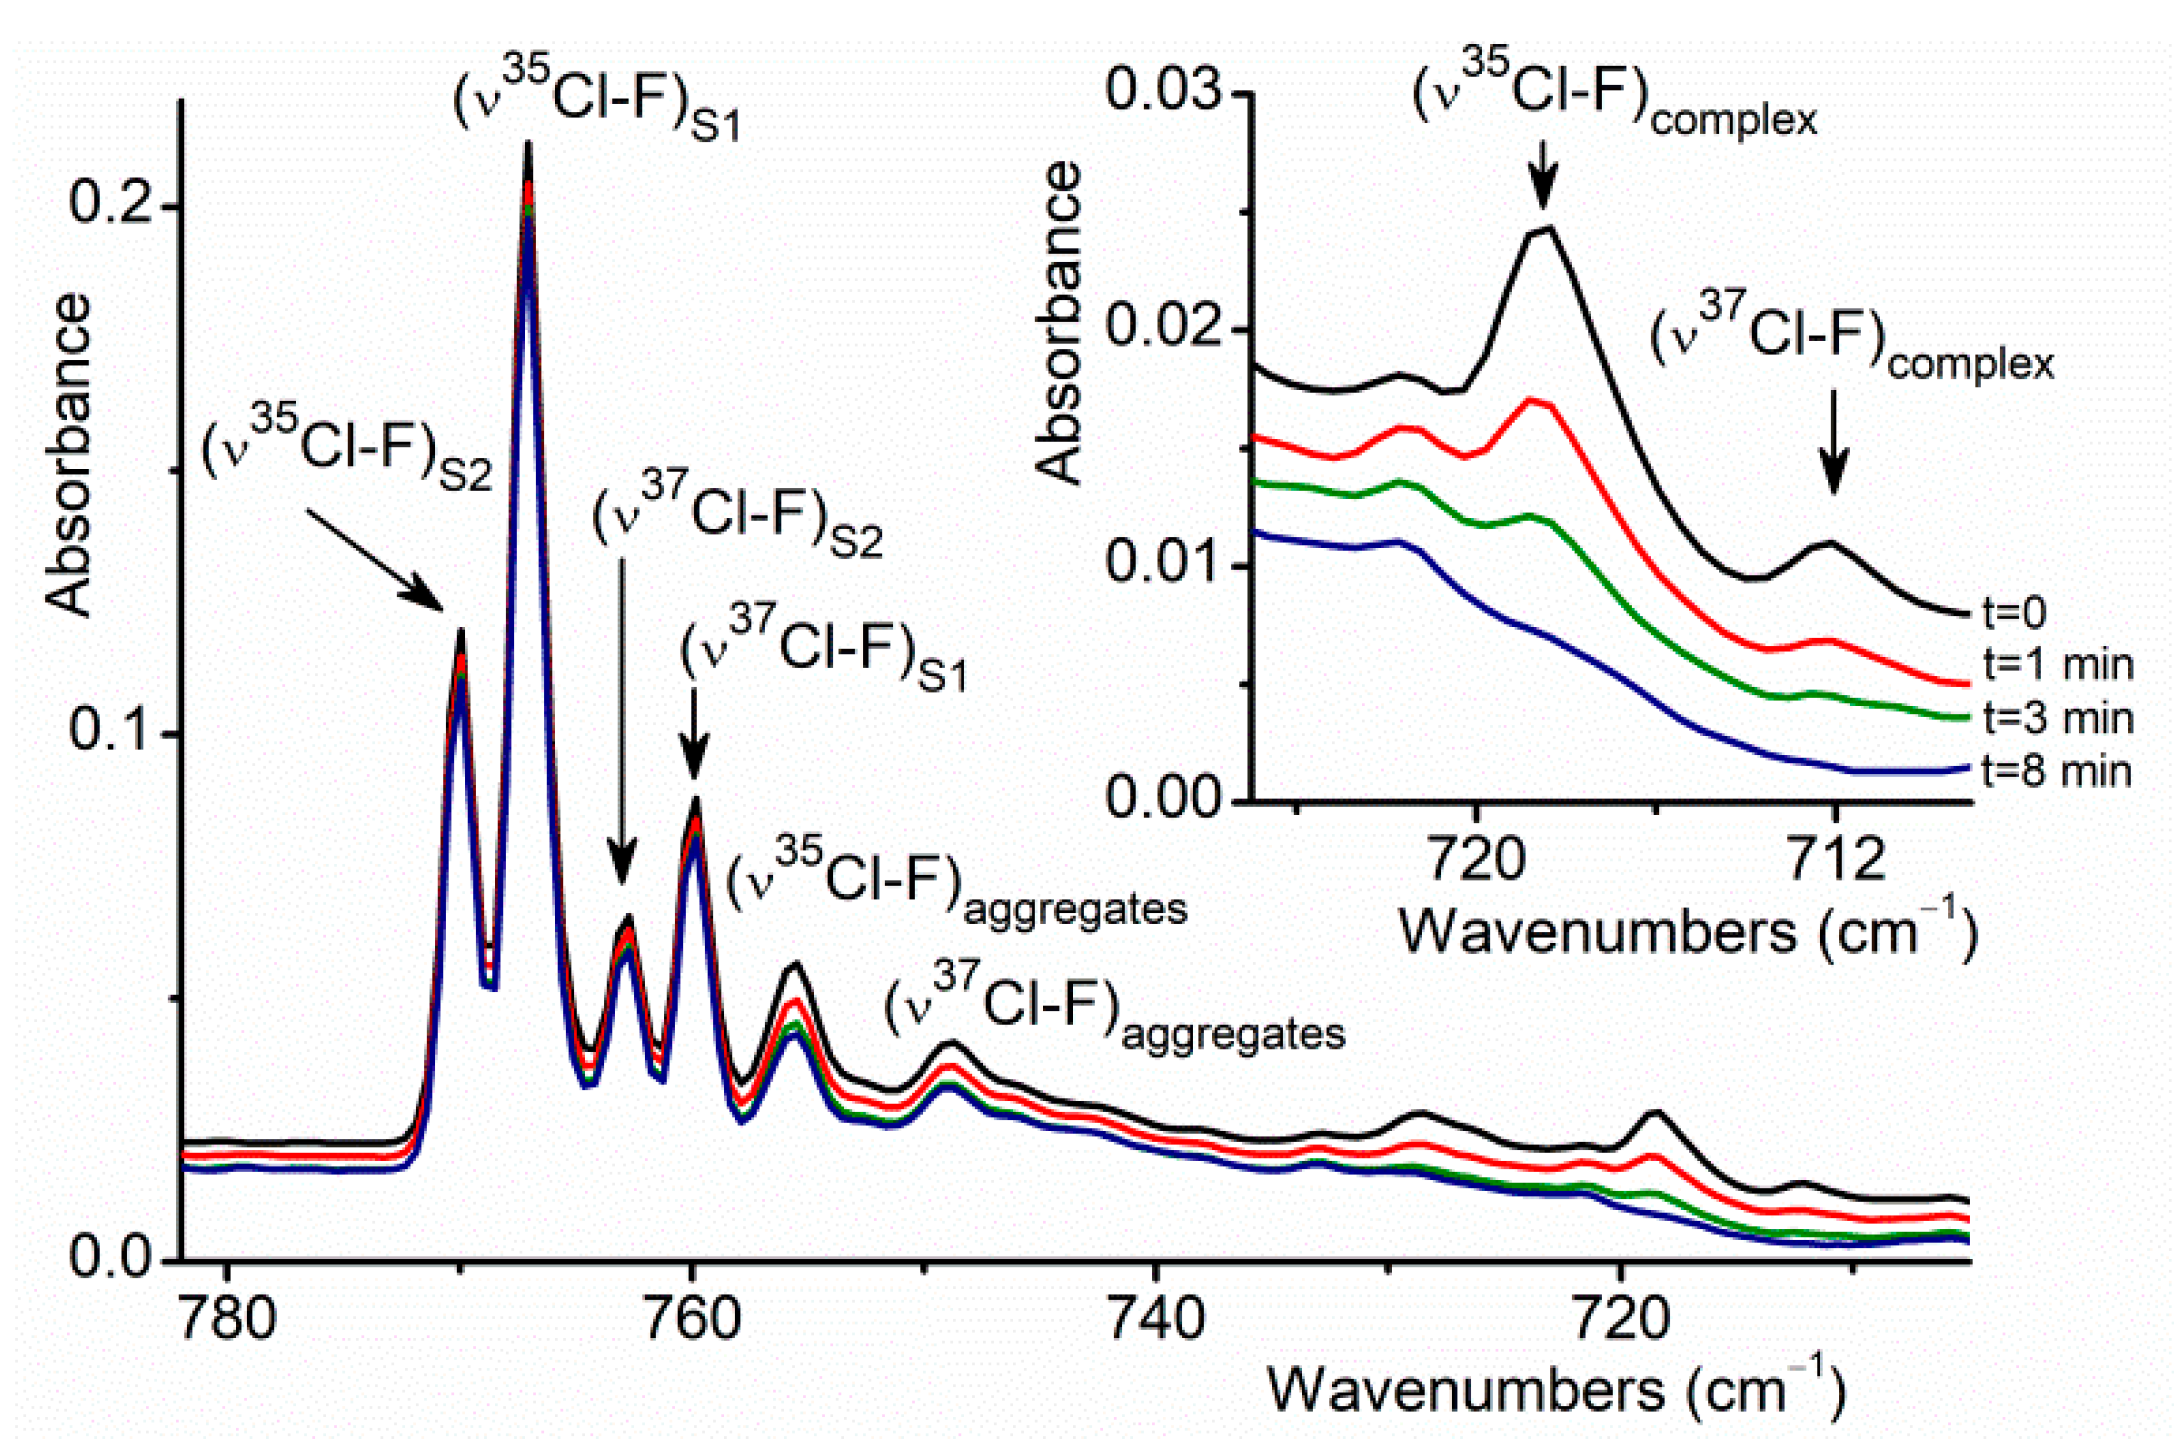
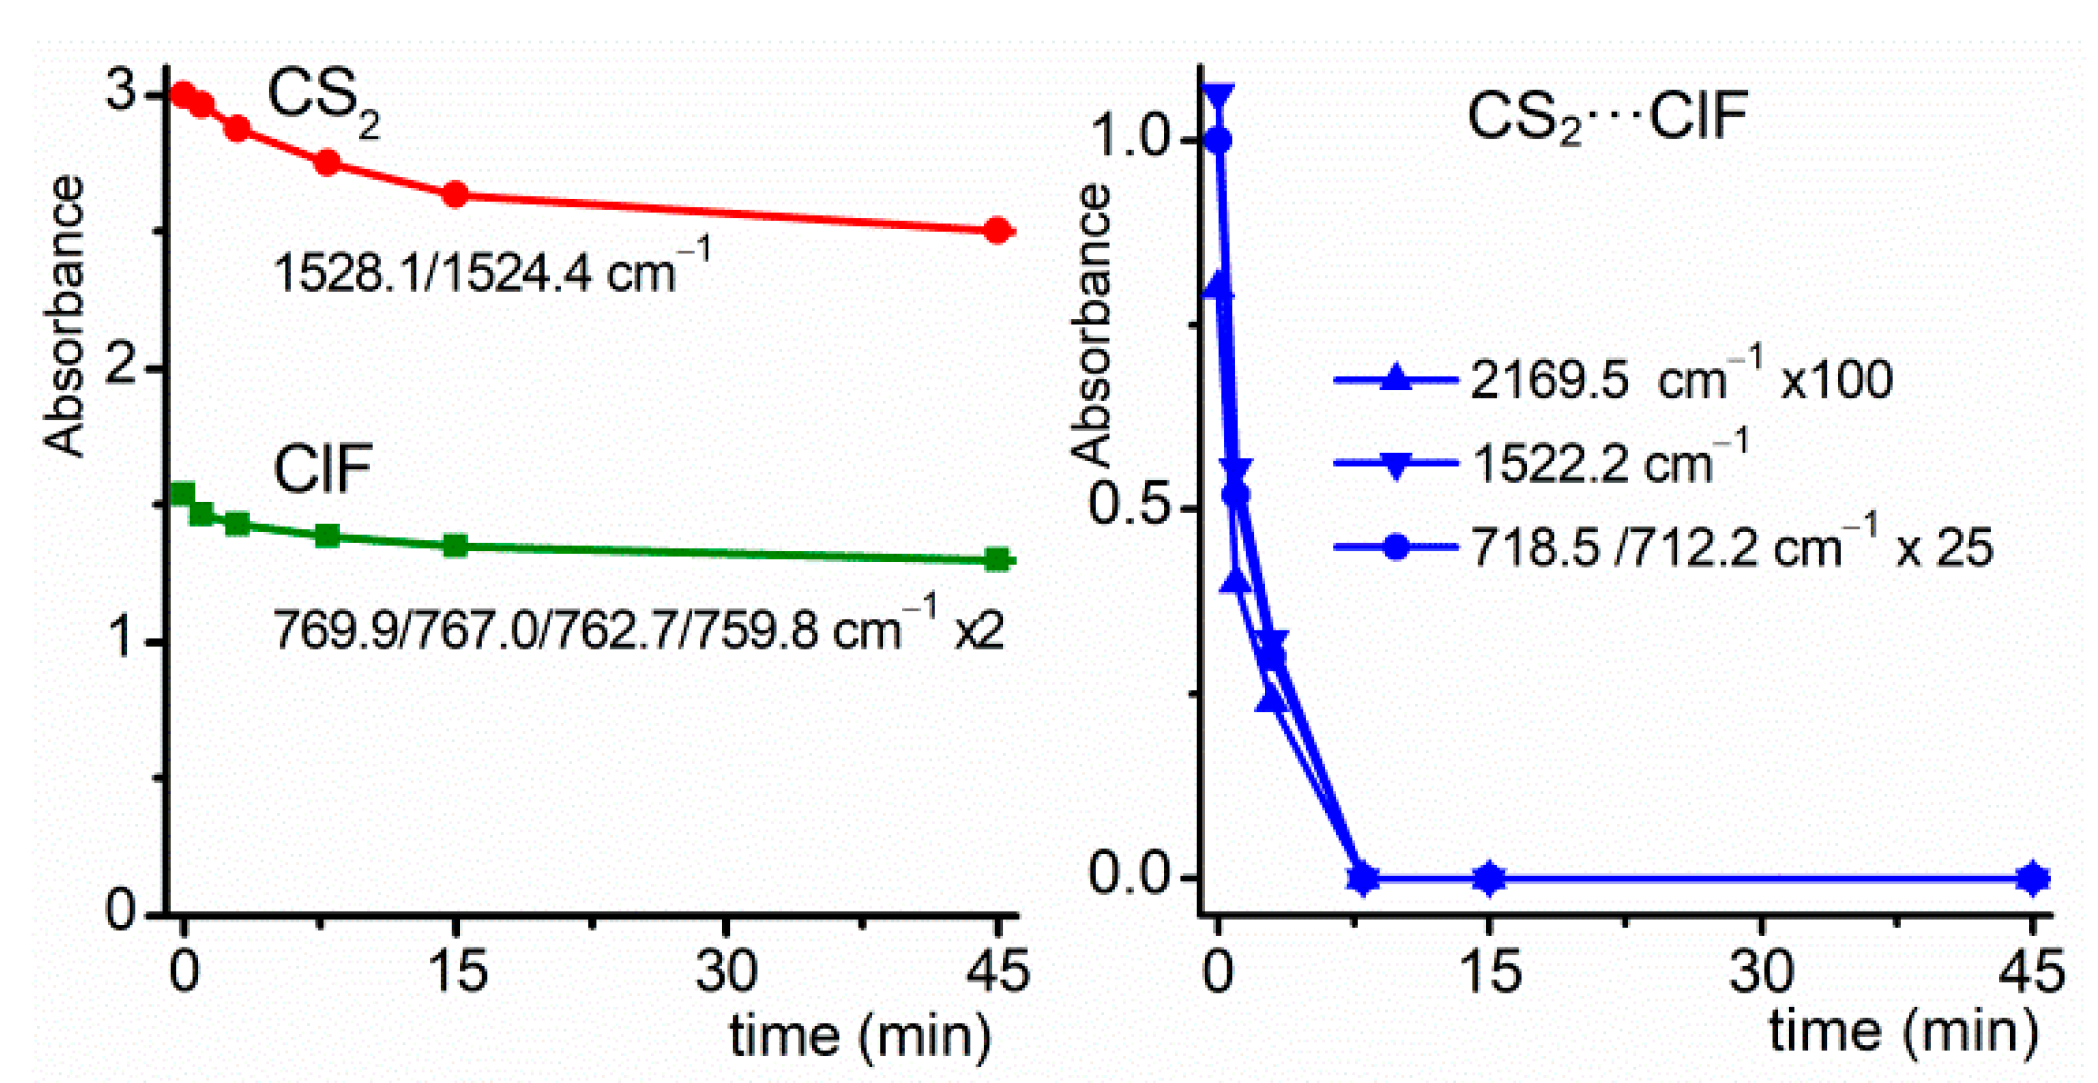
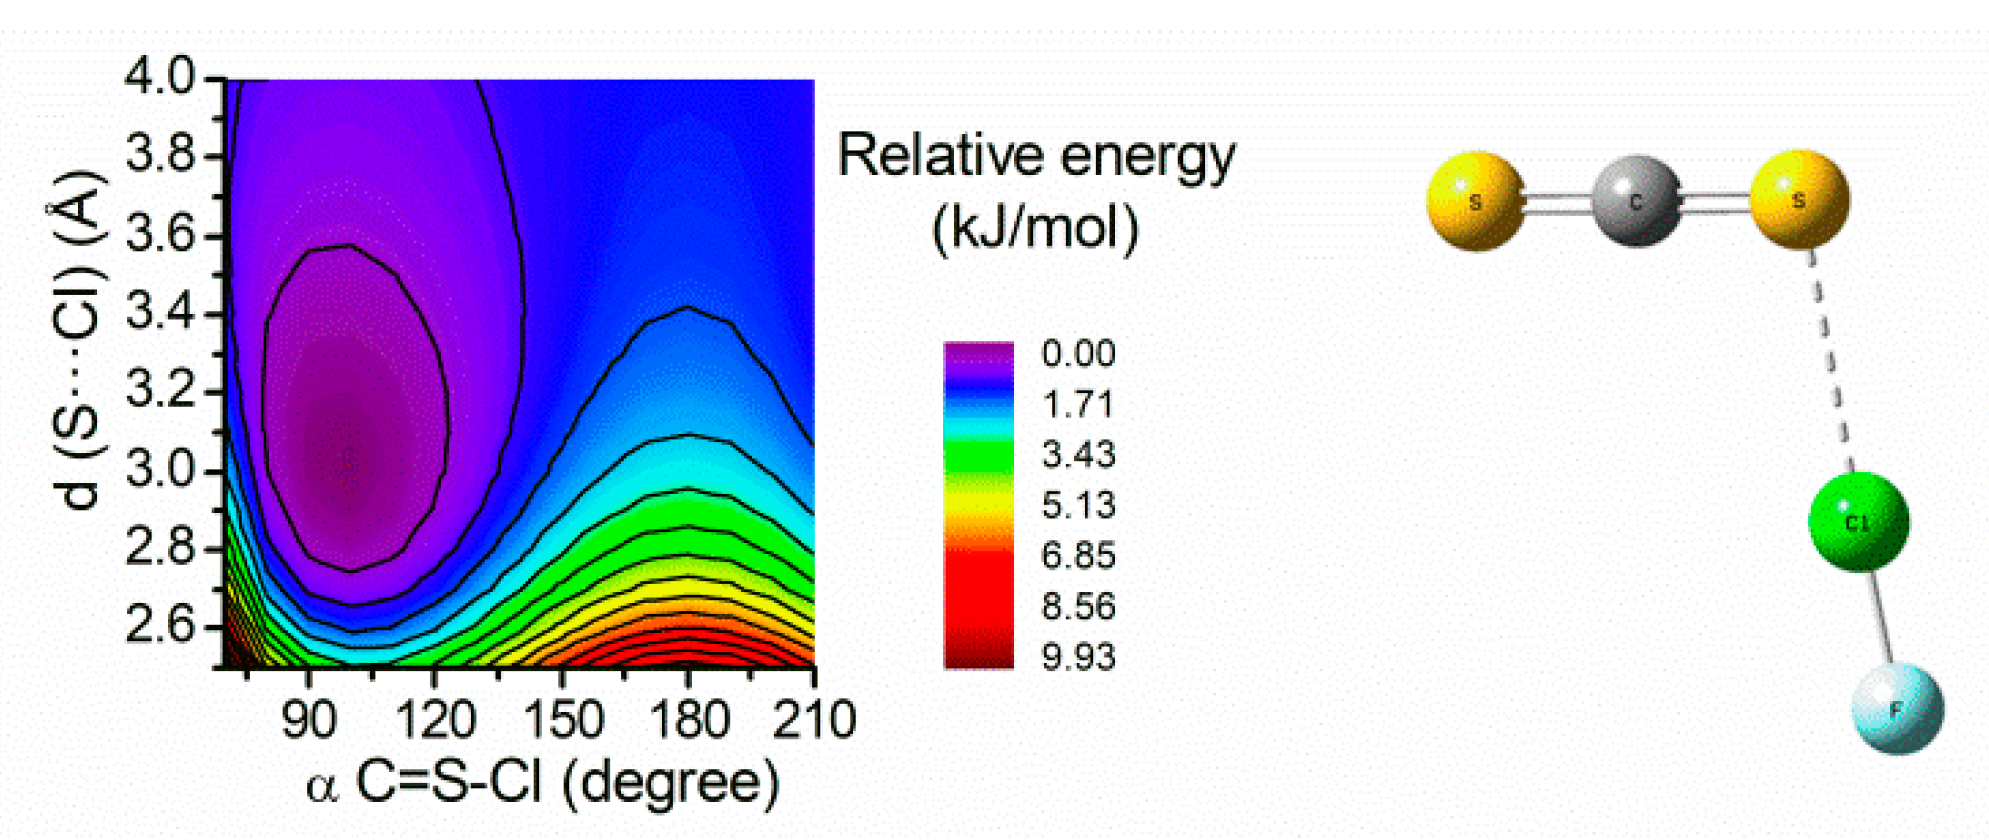
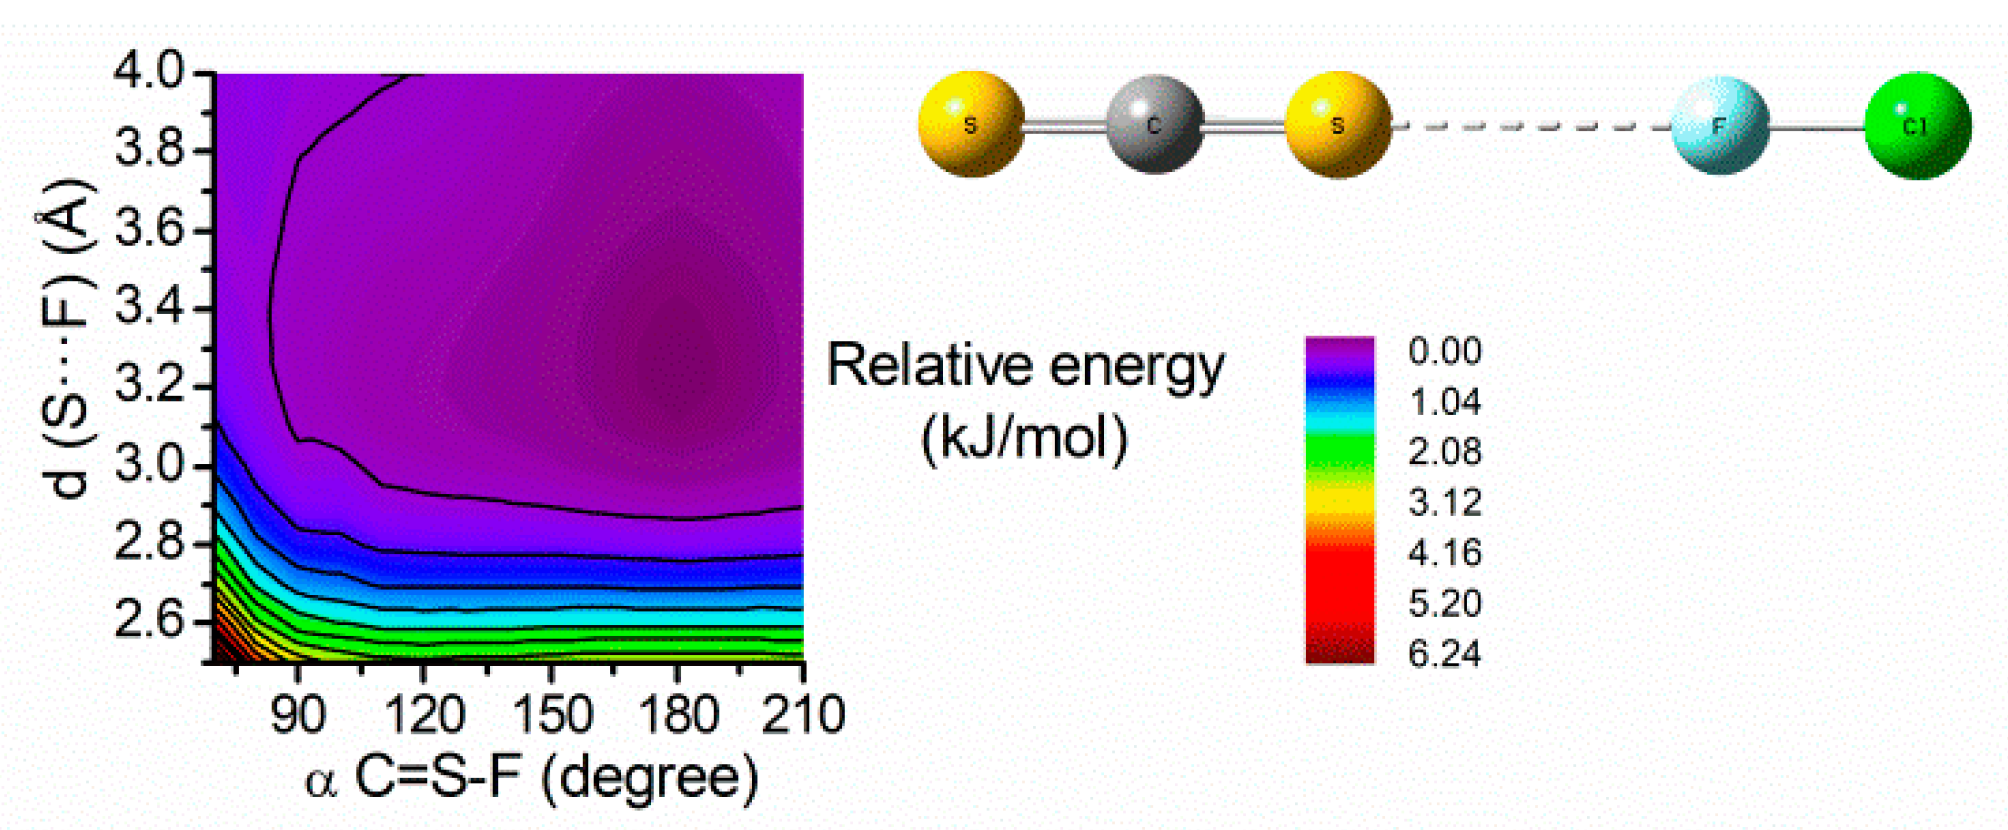
3.1. Codeposition of CS2 + ClF in Ar Matrix
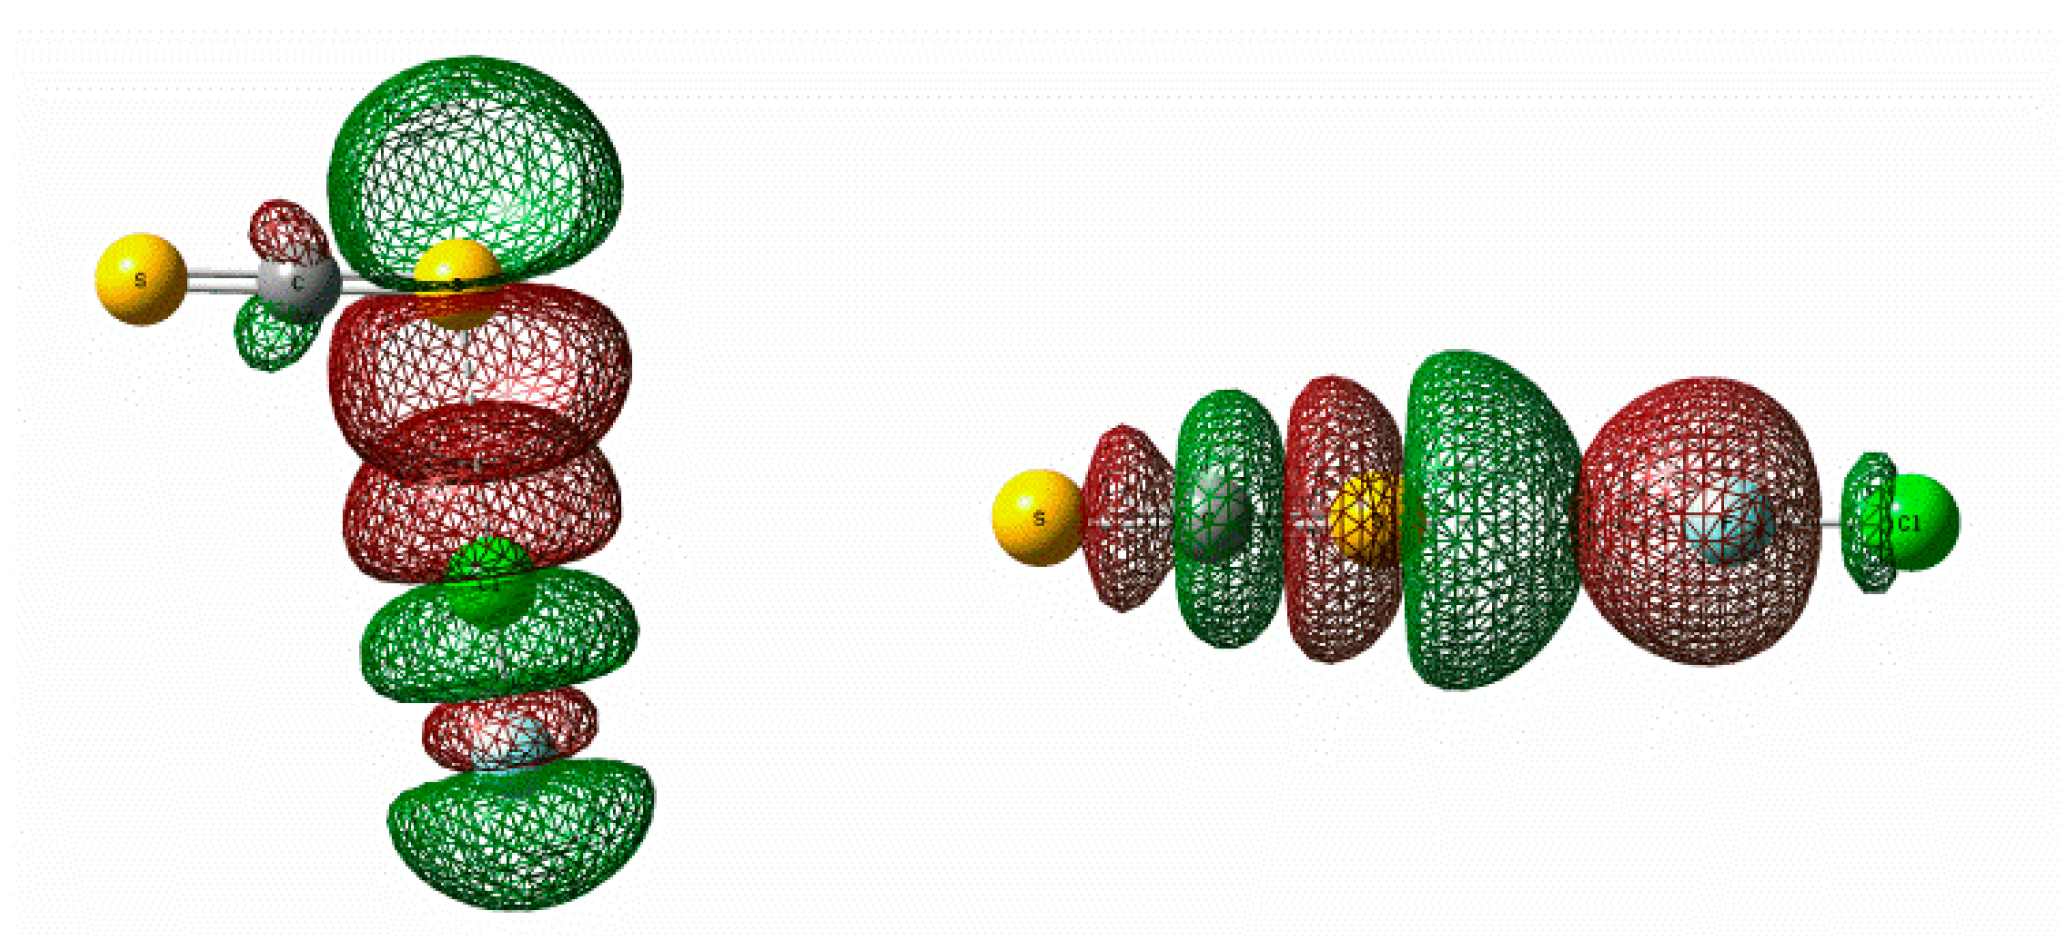
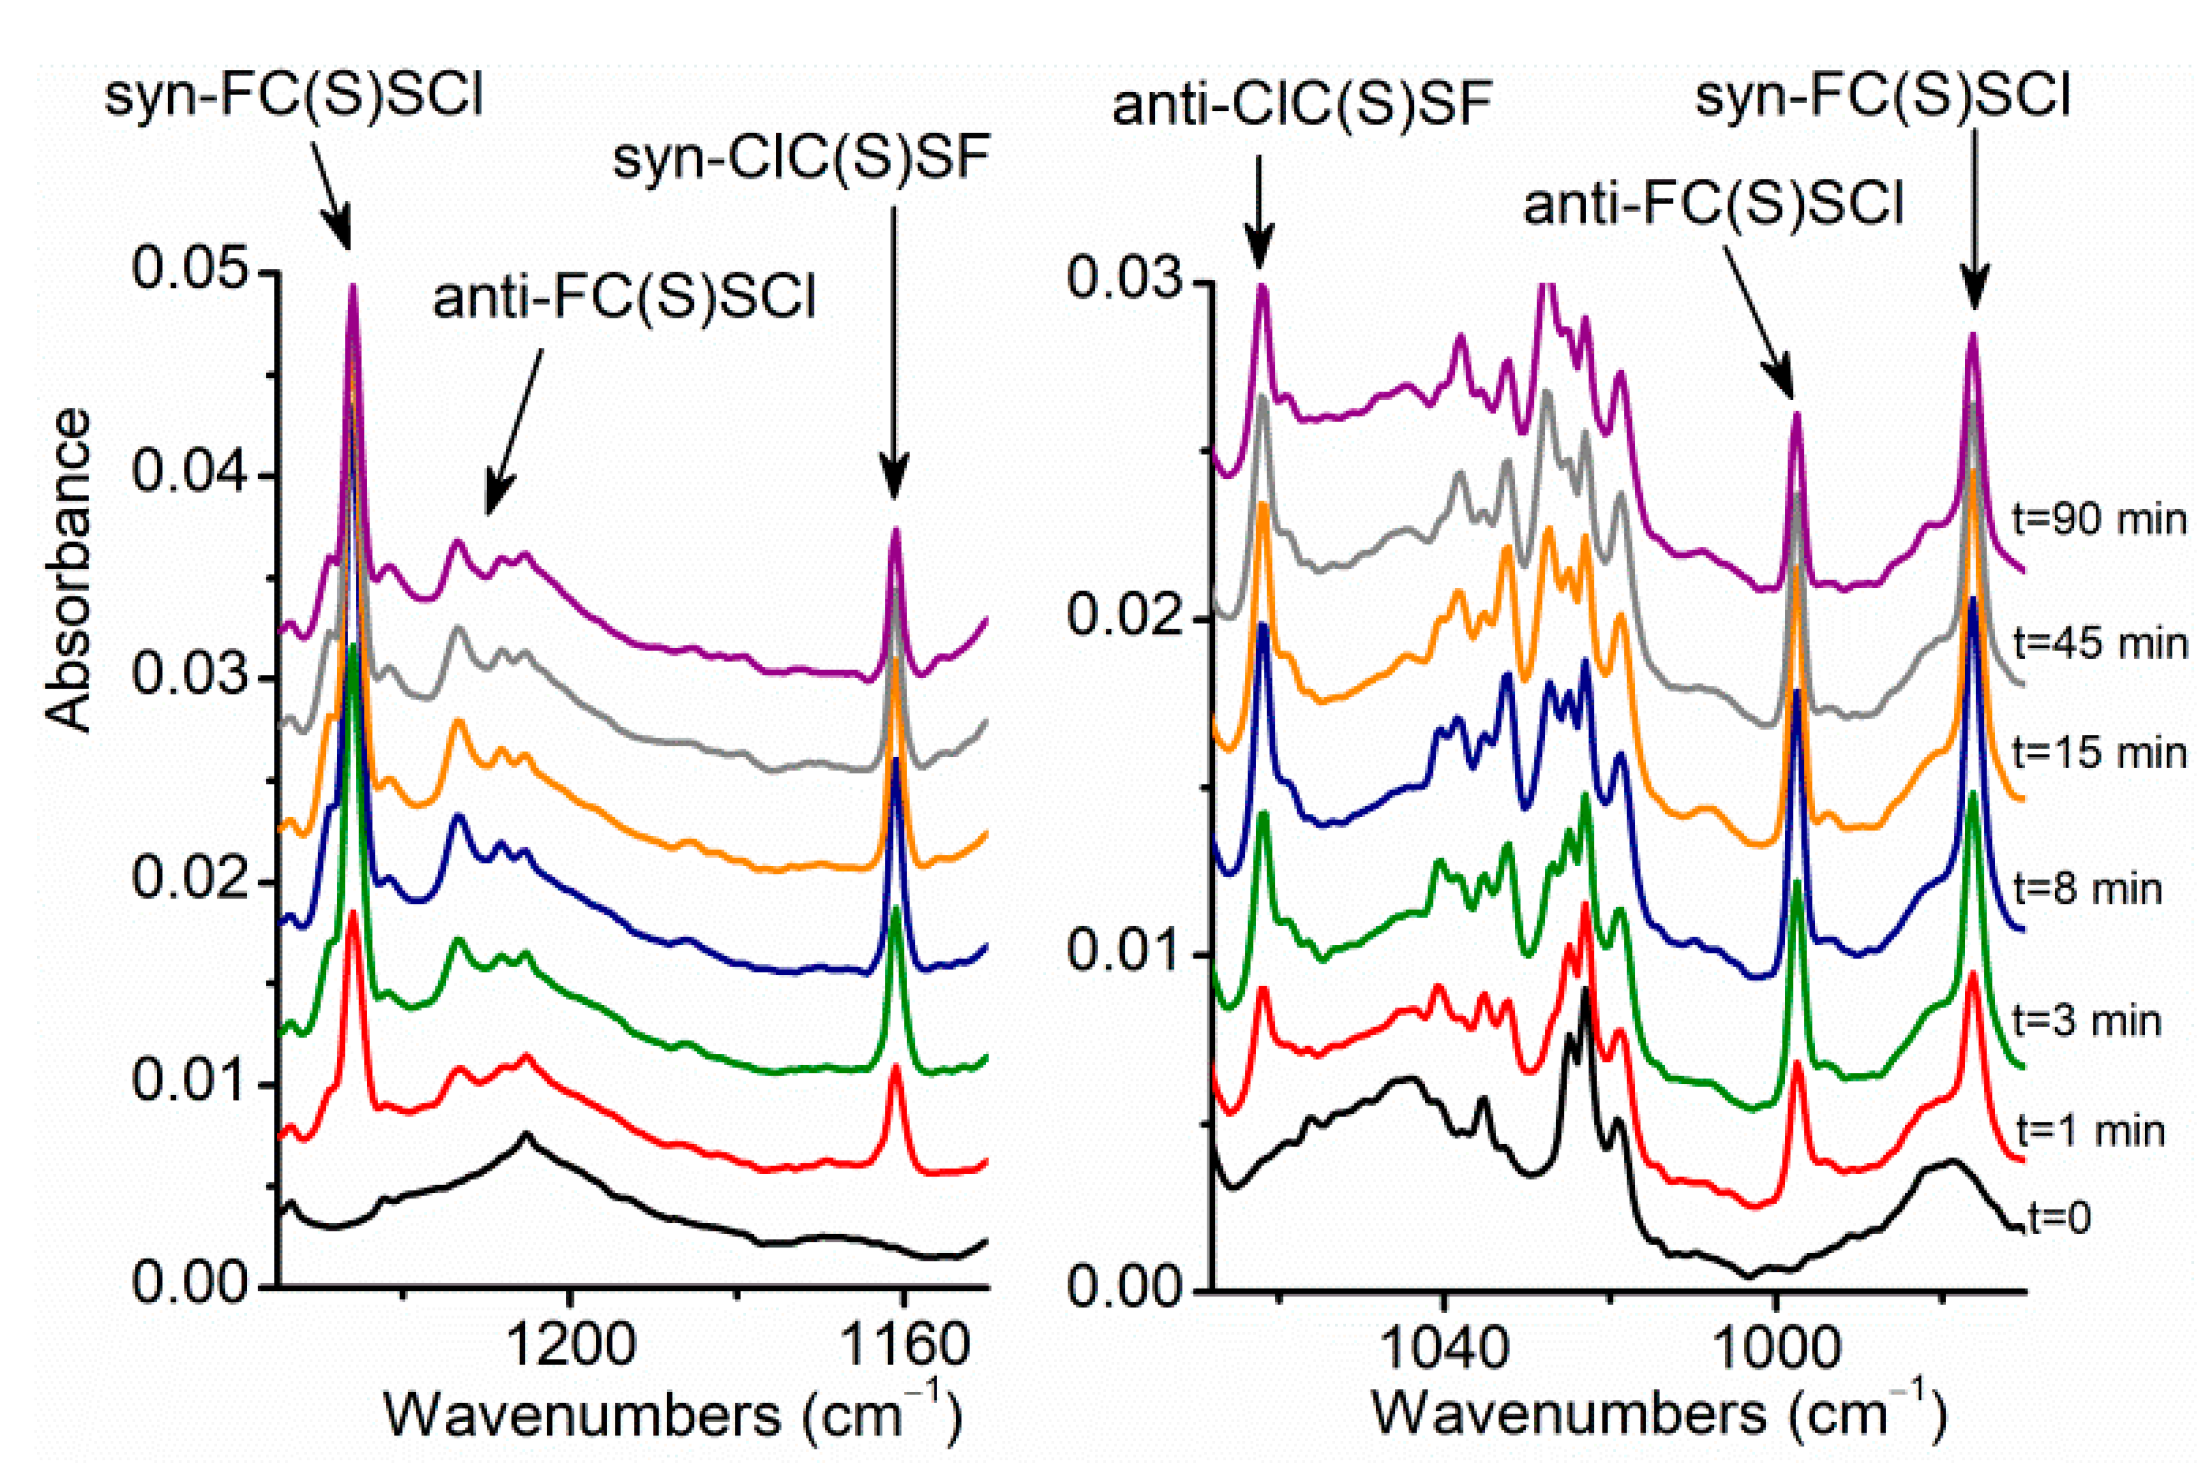
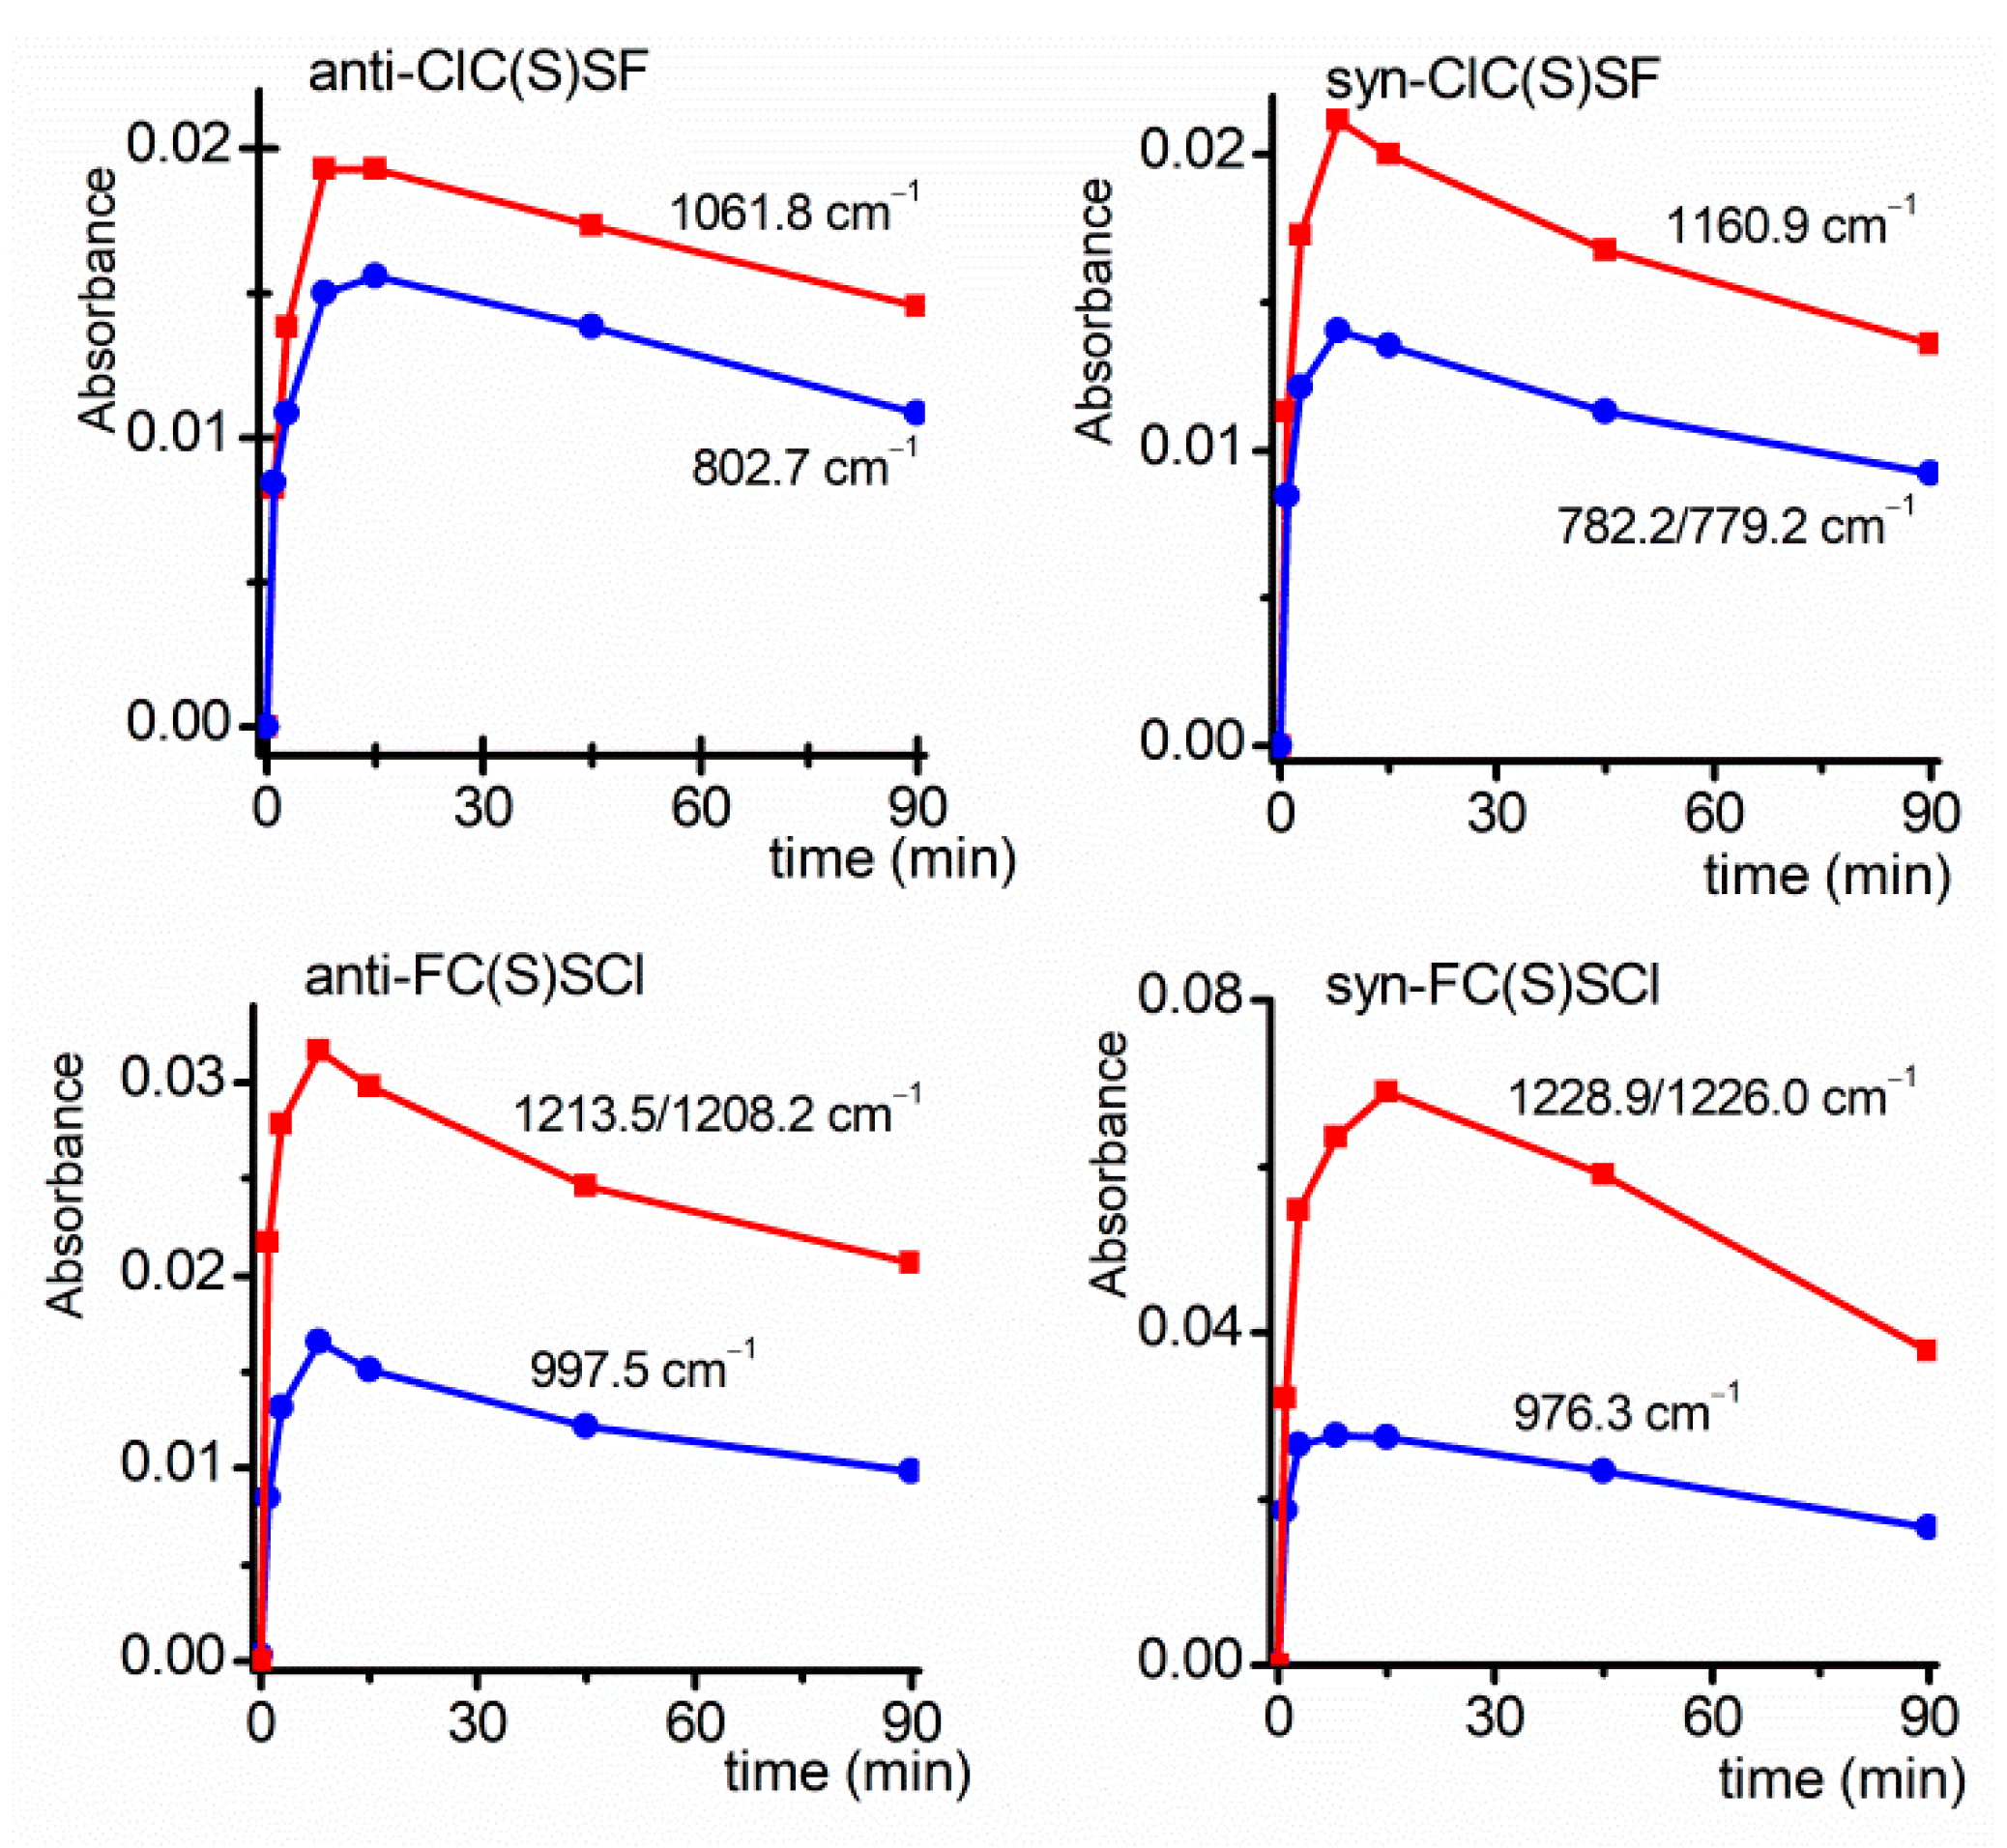
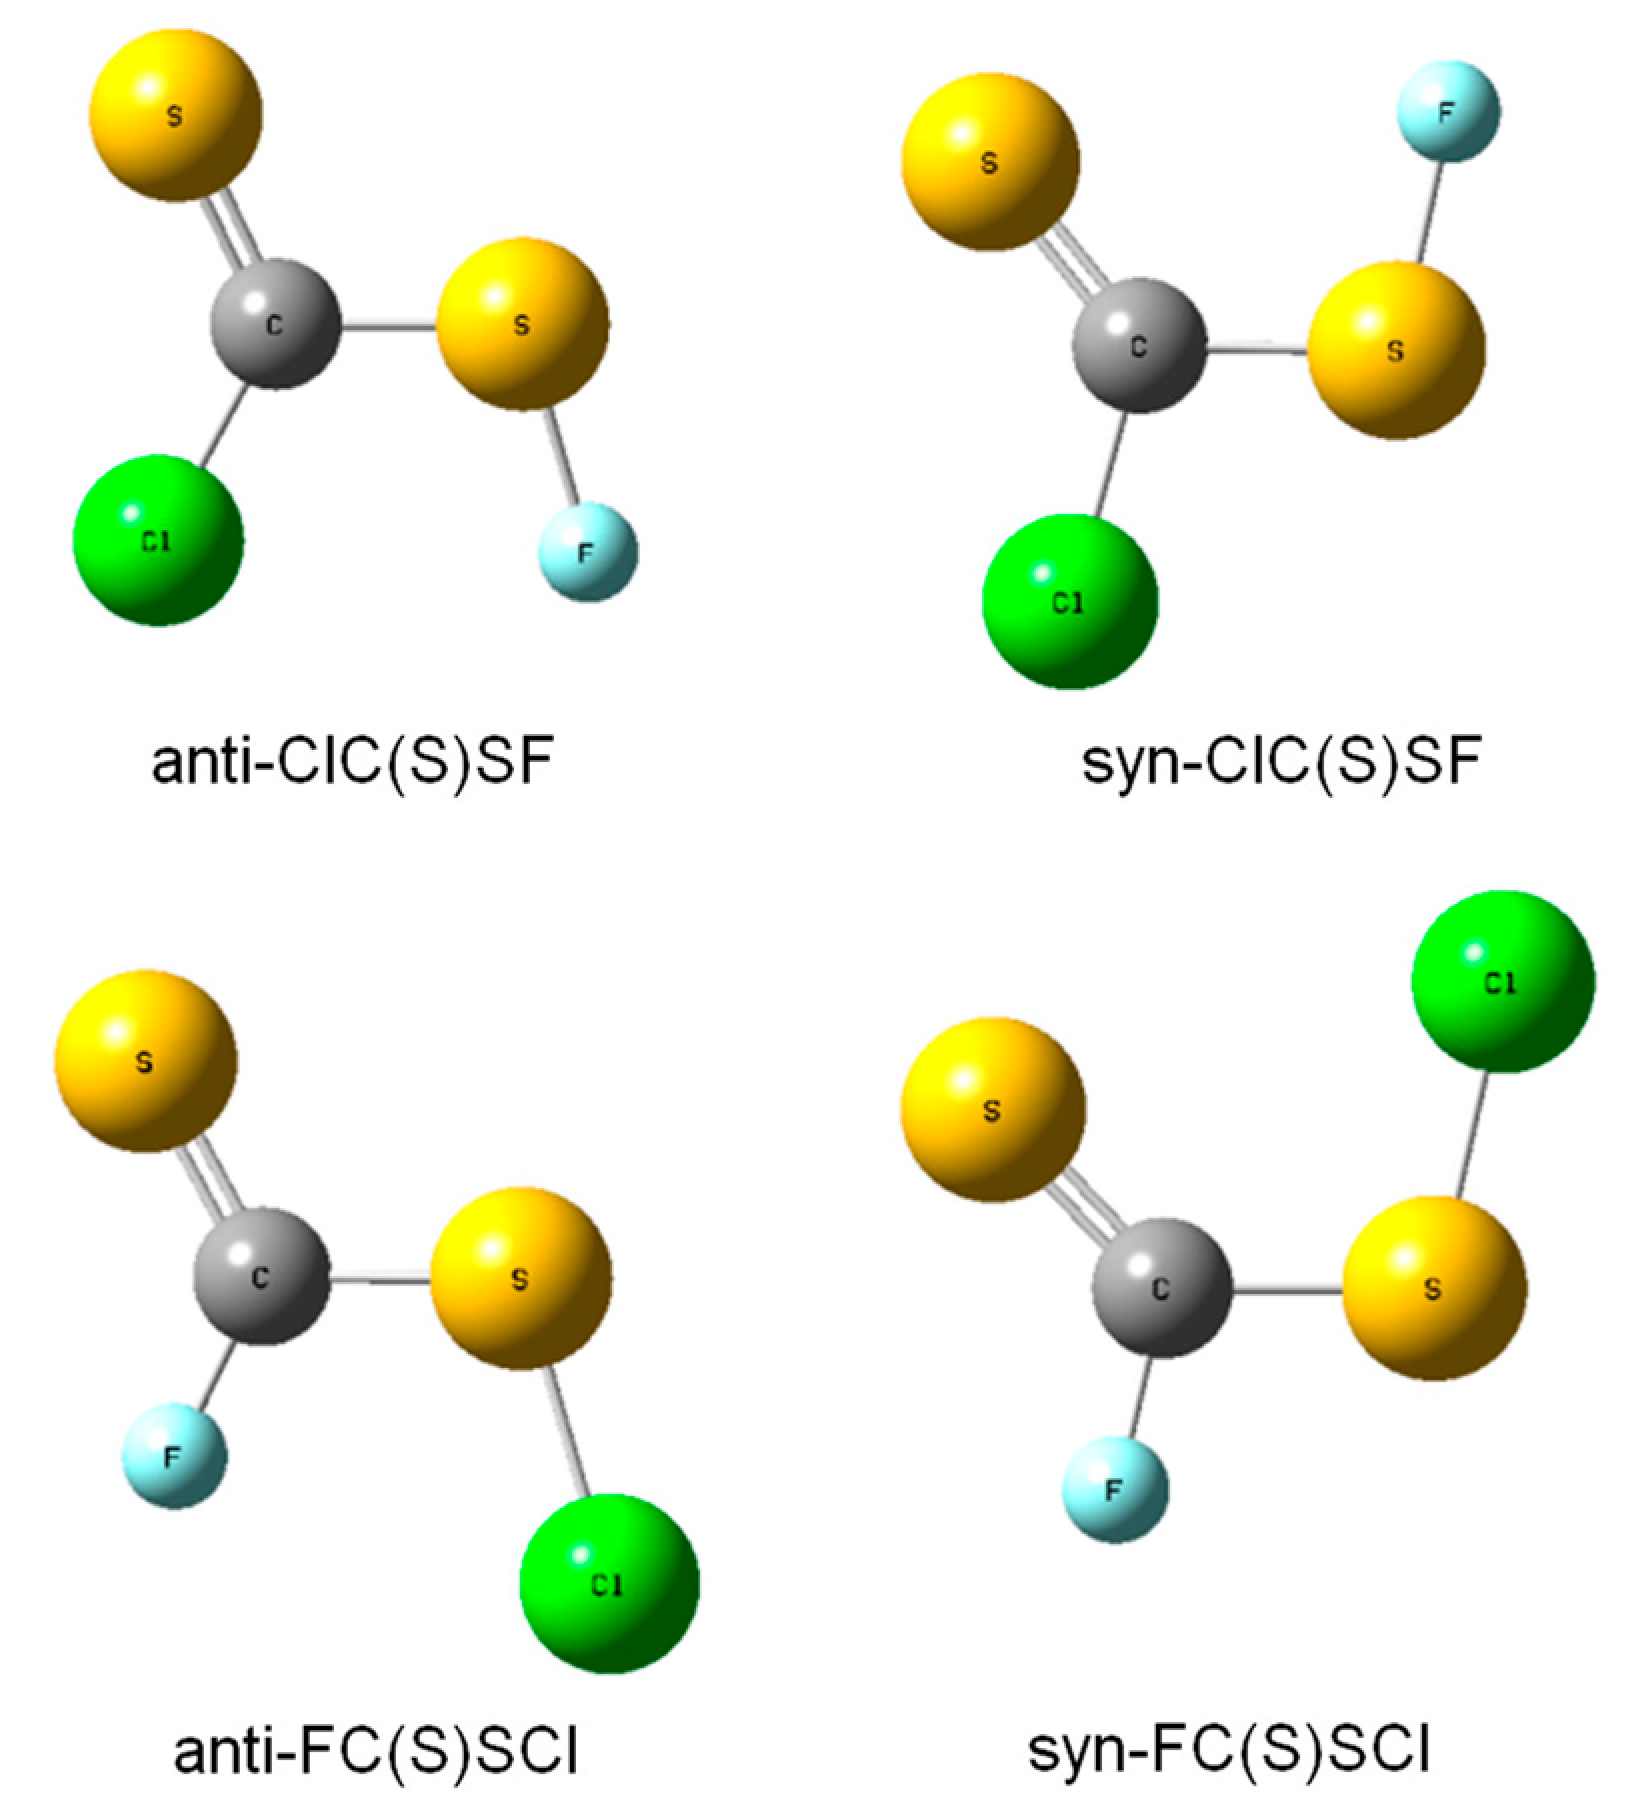
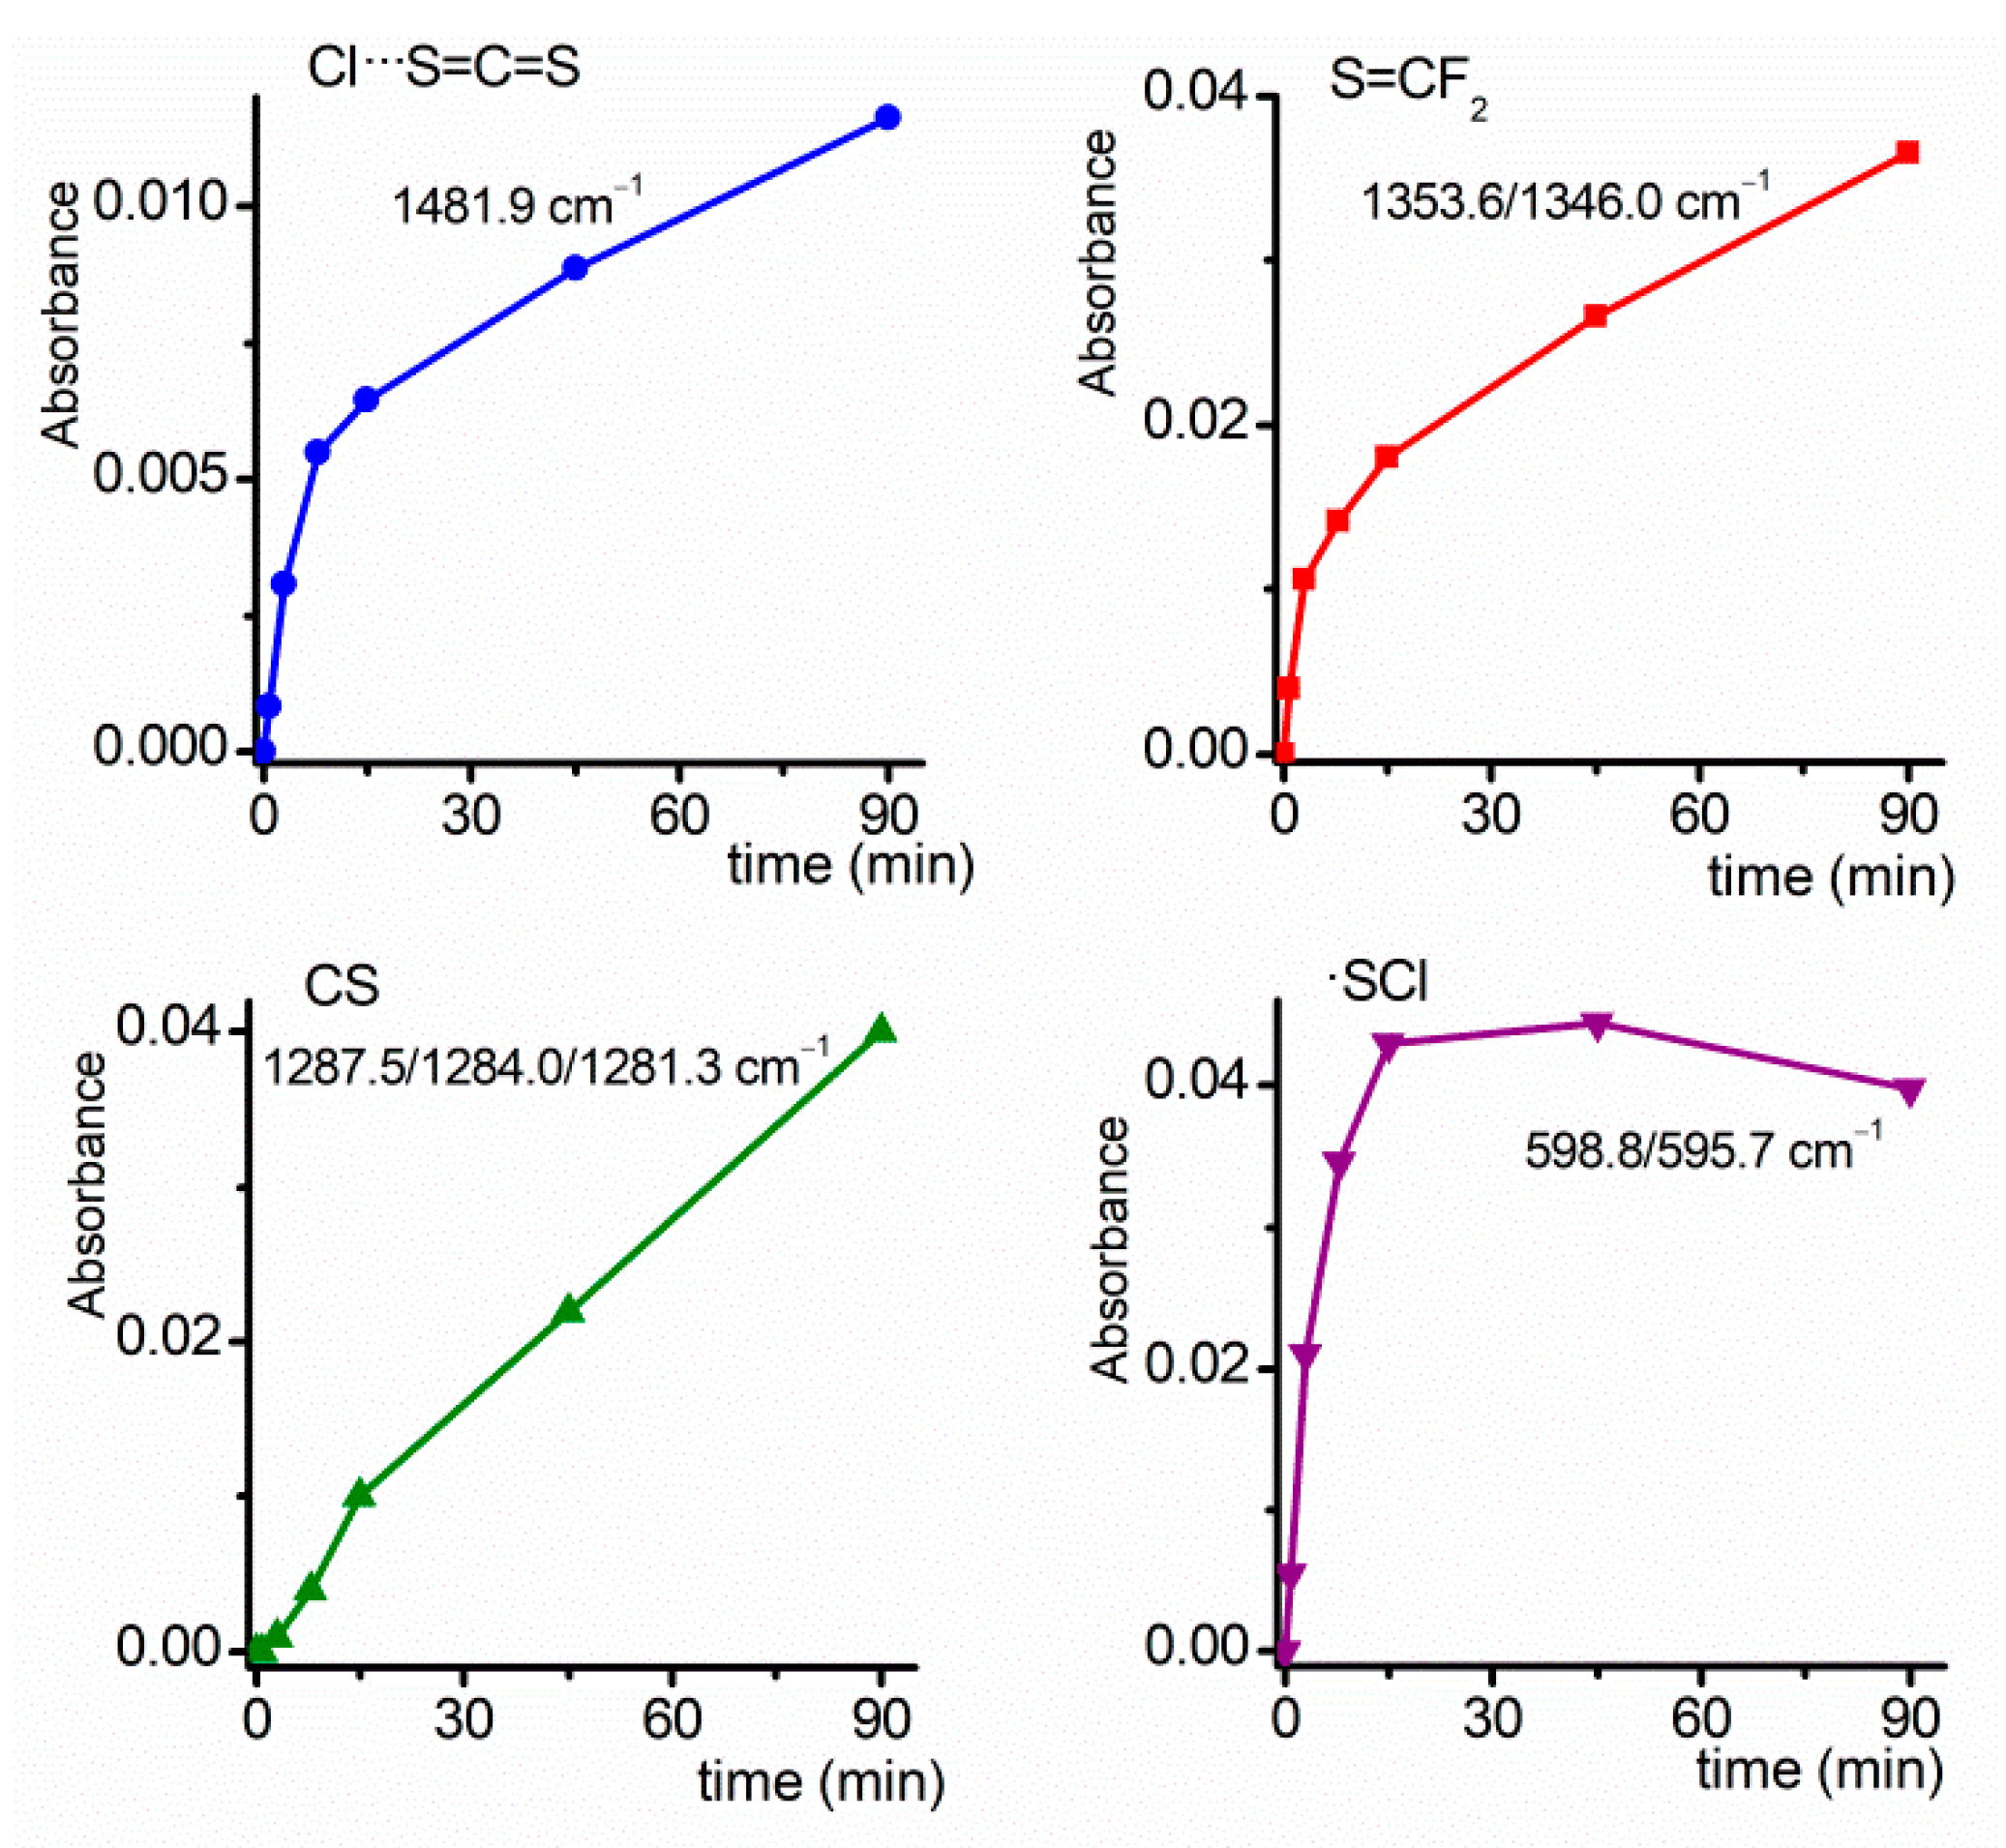
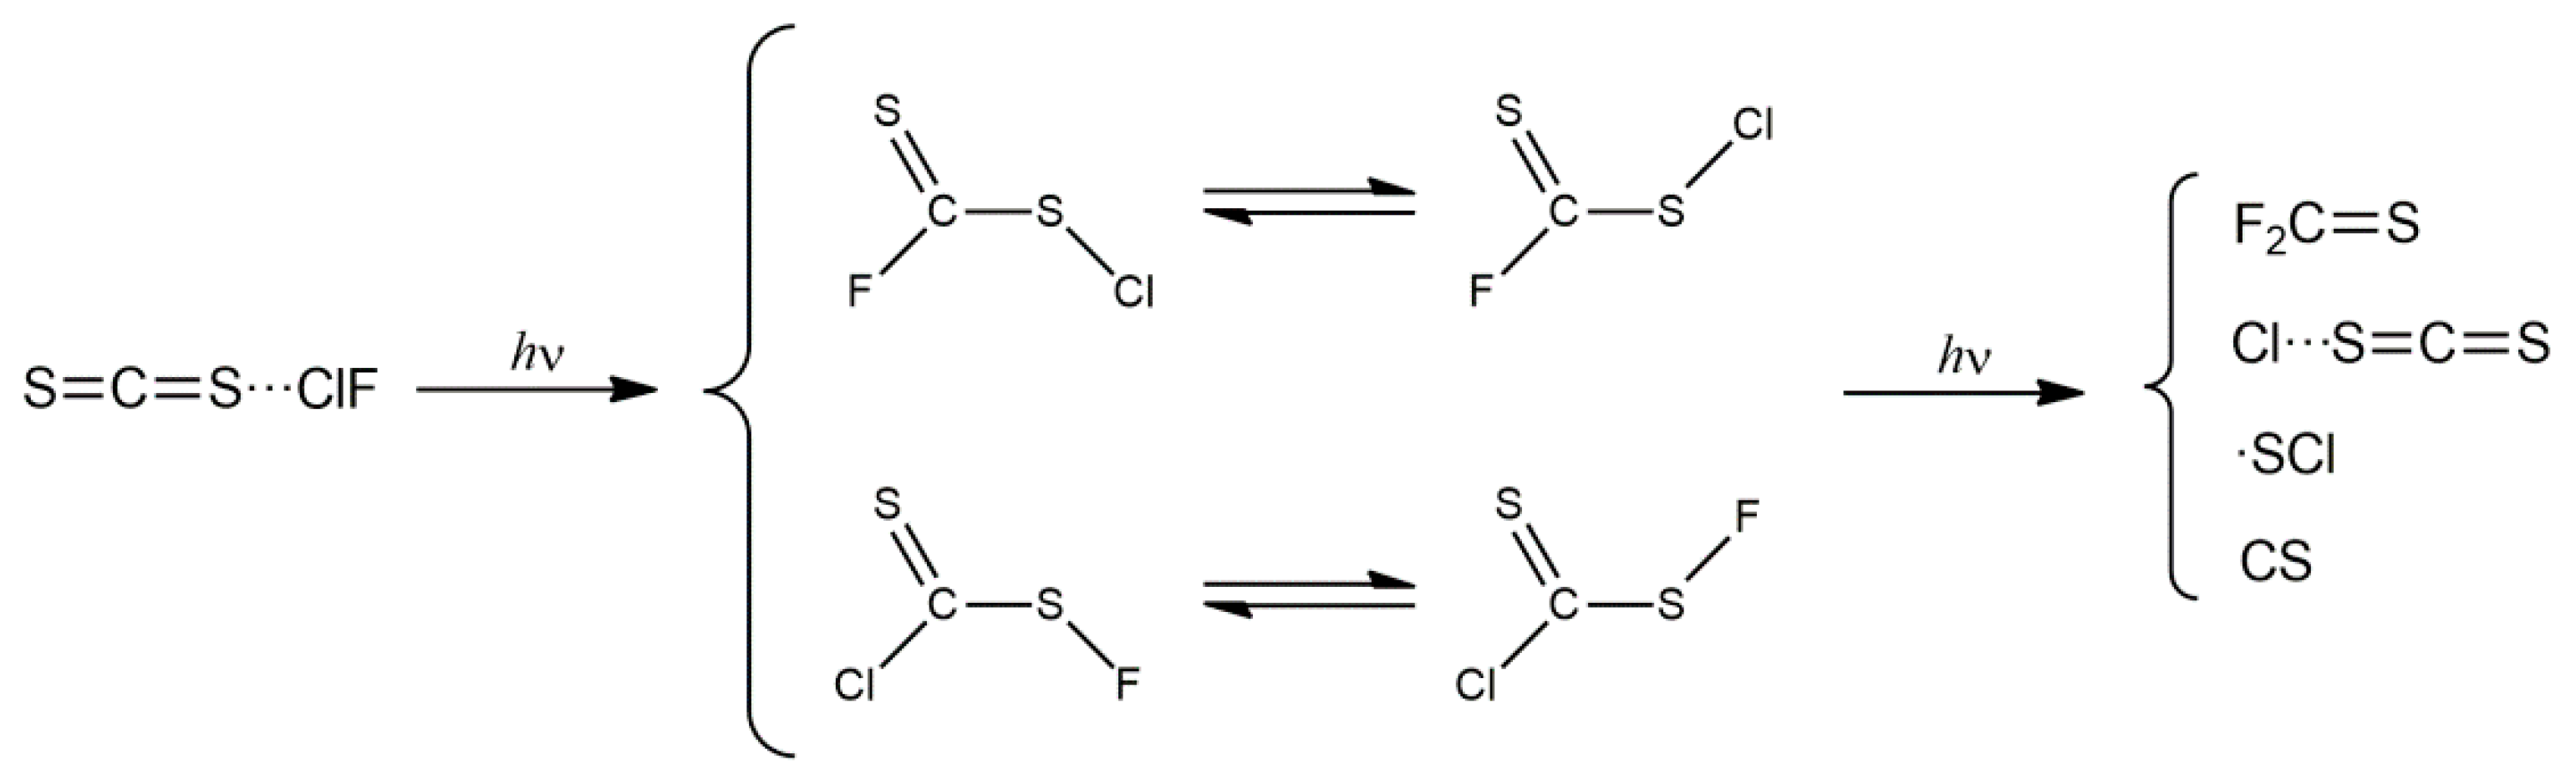
3.2. Photochemistry of CS2 + ClF in Ar Matrix
4. Conclusions
Supplementary Materials
Author Contributions
Funding
Institutional Review Board Statement
Informed Consent Statement
Data Availability Statement
Conflicts of Interest
References
- Ault, B.S. Matrix isolation spectroscopic studies: Thermal and soft photochemical bimolecular reactions. Front. Adv. Mol. Spectrosc. 2018, 20, 667–712. [Google Scholar]
- Wu, Z.; Shao, X.; Zhu, B.; Wang, L.; Lu, B.; Trabelsi, T.; Francisco, J.S.; Zeng, X. Spectroscopic characterization of two peroxyl radicals during the O2-oxidation of the methylthio radical. Commun. Chem. 2022, 5, 19. [Google Scholar] [CrossRef]
- Young, N.A. Main group coordination chemistry at low temperatures: A review of matrix isolated Group 12 to Group 18 complexes. Coord. Chem. Rev. 2013, 257, 956–1010. [Google Scholar] [CrossRef]
- Bava, Y.B.; Cozzarín, M.V.; Della Védova, C.O.; Willner, H.; Romano, R.M. Preparation of FC(S)SF, FC(S)SeF and FC(Se)SeF through matrix photochemical reactions of F2 with CS2, SCSe, and CSe2. Phys. Chem. Chem. Phys. 2021, 23, 20892–20900. [Google Scholar] [CrossRef]
- Tobón, Y.A.; Romano, R.M.; Della Védova, C.O.; Downs, A.J. Formation of new halogenotiocarbonylsulfenyl halides, XC(S)SY, through photochemical matrix reactions starting from CS2 and dihalogen molecule XY (XY = Cl2, Br2, or BrCl). Inorg. Chem. 2007, 46, 4692–4703. [Google Scholar] [CrossRef]
- Gomez Castaño, J.A.; Romano, R.M.; Della Védova, C.O.; Willner, H. Photochemical reaction of OCSe with ClF in argon matrix: A light-driven formation of XC(O)SeY (X, Y = F or Cl) species. J. Phys. Chem. A 2017, 121, 2878–2887. [Google Scholar] [CrossRef]
- Gómez Castaño, J.A.; Picone, A.L.; Romano, R.M.; Willner, H.; Della Védova, C.O. Early barriers in the matrix photochemical formation of syn–anti randomized FC(O)SeF from the OCSe:F2 complex. Chem. Eur. J. 2007, 13, 9355–9361. [Google Scholar] [CrossRef]
- Ault, B.S. Matrix isolation investigation of the interaction of CIF and Cl2 with carbon-carbon multiple bonds. J. Phys. Chem. 1987, 91, 4723–4727. [Google Scholar] [CrossRef]
- Machara, N.P.; Ault, B.S. Infrared spectroscopy studies of the interactions of CIF and Cl2 with H2Se, (CH3)2Se and AsH3 in argon matrices. Inorg. Chem. 1988, 27, 2383–2385. [Google Scholar] [CrossRef]
- Bai, H.; Ault, B.S. Infrared spectroscopy investigation of complexes of CIF and Cl2 with crown ethers and related cyclic polyethers in argon matrices. J. Mol. Struct. 1989, 196, 47–56. [Google Scholar] [CrossRef]
- Bai, H.; Ault, B.S. Infrared matrix isolation of the 1 1 complexes of HCl and CIF with sulfur and nitrogen-containing macrocycles. J. Mol. Struct. 1990, 238, 223–230. [Google Scholar] [CrossRef]
- Bai, H.; Ault, B.S. Infrared matrix isolation investigation of the molecular complexes of CIF with benzene and its derivatives. J. Phys. Chem. 1990, 94, 199–203. [Google Scholar] [CrossRef]
- Bai, H.; Ault, B.S. Matrix isolation study of complexation and with terf-butyl halides. J. Phys. Chem. 1991, 95, 3080–3084. [Google Scholar] [CrossRef]
- Bloemink, H.I.; Hinds, K.; Holloway, J.H.; Legon, A.C. Isolation of H2S...C1F in a pre-reactive mixture of H2S and C1F expanded in a coaxial jet and characterisation by rotational spectroscopy. Chem. Phys. Lett. 1995, 242, 113–120. [Google Scholar] [CrossRef]
- Cooke, S.A.; Cotti, G.; Evans, C.M.; Holloway, J.H.; Kisiel, Z.; Legon, A.C.; Thumwood, J.M.A. Pre-reactive complexes in mixtures of water vapour with halogens: Characterisation of H2O···ClF and H2O···F2 by a combination of rotational spectroscopy and ab initio calculations. Chem. Eur. J. 2001, 7, 2295–2305. [Google Scholar] [CrossRef]
- Picone, A.L.; Della Védova, C.O.; Willner, H.; Downs, A.J.; Romano, R.M. Experimental and theoretical characterization of molecular complexes formed between OCS and XY molecules (X, Y = F, Cl and Br) and their role in photochemical matrix reactions. Phys. Chem. Chem. Phys. 2010, 12, 563–571. [Google Scholar] [CrossRef]
- Schnöckel, H.; Willner, H. Matrix-isolated molecules. In Infrared and Raman Spectroscopy, Methods and Applications; Schrader, B., Ed.; VCH: Weinheim, Germany, 1995; pp. 297–313. [Google Scholar]
- Frisch, M.J.; Trucks, G.W.; Schlegel, H.B.; Scuseria, G.E.; Robb, M.A.; Cheeseman, J.R.; Montgomery, J.A., Jr.; Vreven, T.; Kudin, K.N.; Burant, J.C.; et al. Gaussian 03, Rev. B.04; Gaussian, Inc.: Pittsburgh, PA, USA, 2003. [Google Scholar]
- Frisch, M.J.; Trucks, G.W.; Schlegel, H.B.; Scuseria, G.E.; Robb, M.A.; Cheeseman, J.R.; Scalmani, G.; Barone, V.; Mennucci, B.; Petersson, G.A.; et al. Gaussian 09, Rev. D.01; Gaussian, Inc.: Wallingford, CT, USA, 2013. [Google Scholar]
- Nagy, P.I.; Smith, D.A.; Alagona, G.; Ghio, C. Ab initio studies of free and monohydrated carboxylic acids in the gas phase. J. Phys. Chem. 1994, 98, 486–493. [Google Scholar] [CrossRef]
- Boys, S.F.; Bernardi, F. The calculation of small molecular interactions by the differences of separate total energies. Some procedures with reduced errors. Mol. Phys. 1970, 19, 553–566. [Google Scholar] [CrossRef]
- Bauernschmitt, R.; Ahlrichs, R. Treatment of electronic excitations within the adiabatic approximation of time dependent density functional theory. Chem. Phys. Lett. 1996, 256, 454–464. [Google Scholar] [CrossRef]
- Stratmann, R.E.; Scuseria, G.E.; Frisch, M.J. An efficient implementation of time-dependent density-functional theory for the calculation of excitation energies of large molecules. J. Chem. Phys. 1998, 109, 8218–8224. [Google Scholar] [CrossRef]
- Willner, H. Das Infrarotspektrum von matrixisoliertem SFCl. Z. Für Nat. B 1984, 39, 314–316. [Google Scholar] [CrossRef] [Green Version]
- Haas, A.; Willner, H.; Bürger, H.; Pawelke, G. Matrix-infrarot-Spektren und Kraftkonstanten von SCF2 und SeCF2. Spectrochim. Acta 1977, 33, 937–945. [Google Scholar] [CrossRef]
- Alimi, R.; Gerber, R.B.; Apkarian, V.A. Dynamics of molecular reactions in solids: Photodissociation of F2 in crystalline Ar. J. Chem. Phys. 1990, 92, 3551–3558. [Google Scholar] [CrossRef]
- Feld, J.; Kunttu, H.; Apkarian, V.A. Photodissociation of F2 and mobility of F atoms in crystalline argon. J. Chem. Phys. 1990, 93, 1009–1020. [Google Scholar] [CrossRef]
- Hamm, R. Schwingungsspektrum von CSFCl. Z. Naturforsch. 1979, 34 A, 325–332. [Google Scholar] [CrossRef]
- Jacox, M.E.; Milligan, D.E. Matrix isolation study of the infrared spectrum of thioformaldehyde. J. Mol. Spectrosc. 1975, 58, 142–157. [Google Scholar] [CrossRef]
- Willner, H. Die Infrarotabsorption des matrixisolierten SCl-Radikal. Spectrochim. Acta 1981, 37, 405–406. [Google Scholar] [CrossRef]
- Johnsson, K.; Engdahl, A.; Nelander, B. The UV and IR Spectra of the ClClO Molecule. J. Phys. Chem. 1995, 99, 3965–3968. [Google Scholar] [CrossRef]
- Ruff, O.; Ascher, E.; Lass, F. Das Chlorfluorid. Z. Anorg. Allg. Chem. 1928, 176, 258–270. [Google Scholar] [CrossRef]
- Andrews, L.; Raymond, J.I. Argon matrix infrared spectrum of the ClO radical. J. Chem. Phys. 1971, 55, 3087–3094. [Google Scholar] [CrossRef]
- Townsend, D.; Lahankar, S.A.; Lee, S.K.; Chambreau, S.D.; Suits, A.G.; Zhang, X.; Rheinecker, J.; Harding, L.B.; Bowman, J.M. The roaming atom: Straying from the reaction path in formaldehyde decomposition. Science 2004, 306, 1158–1161. [Google Scholar] [CrossRef] [PubMed] [Green Version]
- Bondi, A. van derWaals Volumes and Radii. J. Phys. Chem. 1964, 68, 441–451. [Google Scholar]


| Ar Matrix | B3LYP/6-311+G(d,p) | Tentative Assignment | ||||
|---|---|---|---|---|---|---|
| S=C=S···Cl−F | S=C=S···F−Cl | |||||
| ν (cm−1) | ∆ν (cm−1) a | ν (cm−1) b | ∆ν (cm−1) a | ν (cm−1) b | ∆ν (cm−1) a | |
| 2169.5 | −8.3 | νas(SCS) + νs(SCS) | ||||
| 1522.2 | −5.7 | 1547.1 (100) | −6.2 | 1552.2 (100) | −1.9 | νas(SCS) |
| 671.8 (<1) | −2.1 | 673.3 (<1) | −0.6 | νs(SCS) | ||
| 718.5 | −48.6 | 646.5 (31.8) | −93.3 | 740.3 (3.8) | +0.7 | ν(35Cl–F) |
| 712.2 | −47.7 | 640.8 (10.2) | −92.2 | 733.2 (1.2) | +0.5 | ν(37Cl–F) |
| λ (nm) | Oscillator Strength | Transition | Tentative Approximate Assignment b |
|---|---|---|---|
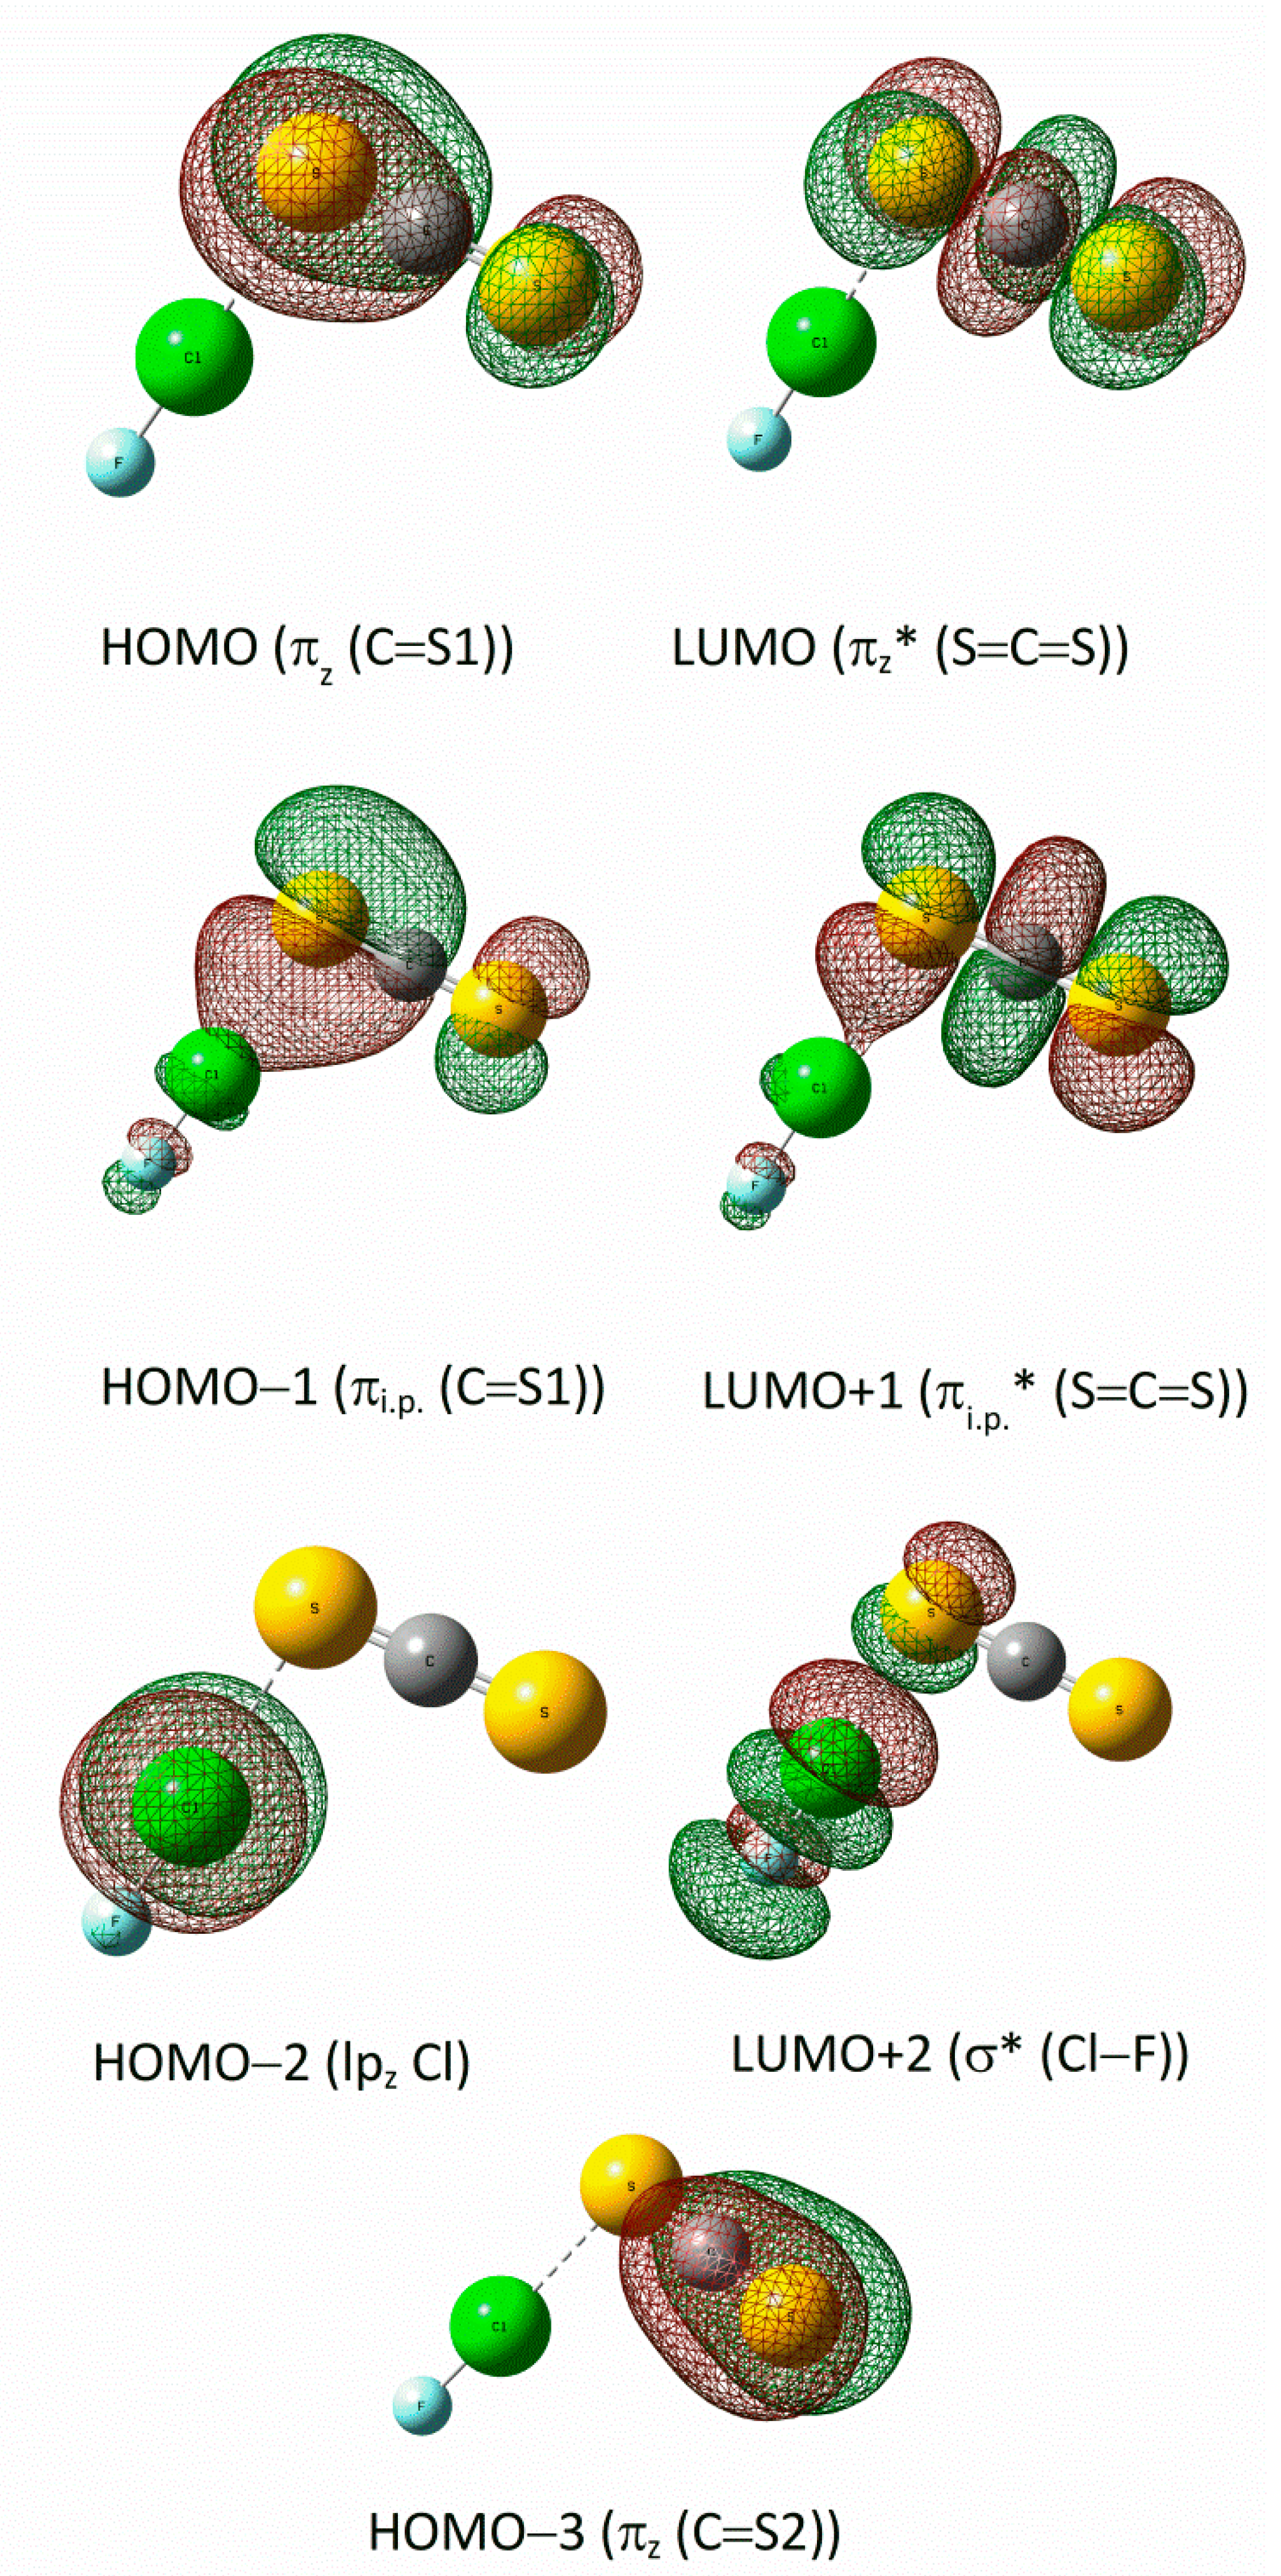
| 374.6 | 0.0002 | HOMO → LUMO | πz (C=S1) → πz* (S=C=S) |
| 340.1 | 0.0010 | (HOMO–2) → LUMO | lpz Cl → πz* (S=C=S) |
| 333.9 | 0.0003 | (HOMO–3) → LUMO | πz (C=S2) → πz* (S=C=S) |
| 311.7 | 0.1381 | (HOMO–1) → LUMO | πi.p. (C=S1) → πz* (S=C=S) |
| 271.7 | 0.0002 | HOMO → (LUM0+2) | πz (C=S1) → σ* (Cl–F) |
| 263.7 | 0.2342 | (HOMO–1) → (LUM0+2) | πi.p. (C=S1) → σ* (Cl–F) |
| 220.7 | 0.0138 | (HOMO–3) → (LUM0+1) | πz (C=S2) → πi.p.* (S=C=S) |
| 215.2 | 0.0236 | (HOMO–2) → (LUM0+2) | lpz Cl → σ*(Cl–F) |
| syn-FC(S)SCl | anti-FC(S)SCl | syn-ClC(S)SF | anti-ClC(S)SF | Tentative Assignment | ||||
|---|---|---|---|---|---|---|---|---|
| Ar Matrix | Calculated | Ar Matrix | Calculated | Ar Matrix | Calculated | Ar Matrix | Calculated | |
| (100) | 1220.9 (100) | (100) | 1214.0 (100) | 1160.9 (100) | 1159.5 (100) | 1061.8 (100) | 1084.3 (100) | ν (C=S) |
| 976.3 (40) | 965.5 (66) | 997.5 (50) | 1040.6 (78) | - | 743.1 (4) | 802.7 (78) | 893.6 (56) | ν (C–X) a |
| 718.5 | 589.6 (3) | - | 628.9 (2) | - | 514.4 (8) | - | 481.4 (12) | ν (C–S) b |
| 712.2 | 526.4 (7) | - | 464.2 (63) | (70) | 728.3 (93) | 668.8 (50) | 671.4 (63) | ν (S–Y) |
Publisher’s Note: MDPI stays neutral with regard to jurisdictional claims in published maps and institutional affiliations. |
© 2022 by the authors. Licensee MDPI, Basel, Switzerland. This article is an open access article distributed under the terms and conditions of the Creative Commons Attribution (CC BY) license (https://creativecommons.org/licenses/by/4.0/).
Share and Cite
Custodio Castro, M.T.; Della Védova, C.O.; Willner, H.; Romano, R.M. Ar-Matrix Studies of the Photochemical Reaction between CS2 and ClF: Prereactive Complexes and Bond Isomerism of the Photoproducts. Photochem 2022, 2, 765-778. https://doi.org/10.3390/photochem2030049
Custodio Castro MT, Della Védova CO, Willner H, Romano RM. Ar-Matrix Studies of the Photochemical Reaction between CS2 and ClF: Prereactive Complexes and Bond Isomerism of the Photoproducts. Photochem. 2022; 2(3):765-778. https://doi.org/10.3390/photochem2030049
Chicago/Turabian StyleCustodio Castro, Michelle T., Carlos O. Della Védova, Helge Willner, and Rosana M. Romano. 2022. "Ar-Matrix Studies of the Photochemical Reaction between CS2 and ClF: Prereactive Complexes and Bond Isomerism of the Photoproducts" Photochem 2, no. 3: 765-778. https://doi.org/10.3390/photochem2030049