Article

Pharmaceutical Micropollutant Treatment with UV–LED/TiO2 Photocatalysis under Various Lighting and Matrix Conditions

1
Centre for Advanced Materials Joining, Department of Mechanical and Mechatronics Engineering, University of Waterloo, Waterloo, ON N2L 3G1, Canada
2
Waterloo Institute of Nanotechnology, University of Waterloo, Waterloo, ON N2L 3G1, Canada
3
Department of Biology, University of Waterloo, Waterloo, ON N2L 3G1, Canada
4
Faculty of Arts and Sciences, Harvard University, Cambridge, MA 02138, USA
*
Authors to whom correspondence should be addressed.
Photochem 2022, 2(3), 503-514; https://doi.org/10.3390/photochem2030035
Submission received: 30 April 2022 / Revised: 25 June 2022 / Accepted: 25 June 2022 / Published: 1 July 2022
(This article belongs to the Topic New Materials and Advanced Applications in Photocatalysis)

Abstract

:
The persistence of pharmaceuticals and personal care products (PPCPs) in water has been a cause for concern for several years. Many studies have successfully used TiO2/UV photocatalysis to remove these compounds from water. In order to optimize these systems for large-scale water treatment, the effects of the reaction matrix, methods to improve energy efficiency, and methods for easy catalyst separation must be considered. The following study examines the photocatalytic degradation of a cocktail of 18 PPCPs using a porous titanium–titanium dioxide membrane and the effect of solution pH on kinetic rate constants. The addition of methanol to the reaction—commonly used as a carrier solvent—had a significant effect on kinetic rate constants even at low concentrations. Solution pH was also found to influence kinetic rate constants. Compounds had higher kinetic rate constants when they were oppositely charged to the membrane at experimental pH as opposed to similarly charged, suggesting that electrostatic forces have a significant effect. The controlled periodic illumination of UV–LEDs was also investigated to increase photonic efficiency. The dual-frequency light cycle used did not cause a decrease in degradation for many compounds, successfully increasing the photonic efficiency without sacrificing performance.

1. Introduction

Pharmaceuticals and personal care products (PPCPs) are a group of micropollutants that are of great concern for aquatic environments. Long-term exposure to PPCPs, even at low levels, can have a negative impact on aquatic life and human health [1]. PPCPs typically enter aquatic environments as wastewater effluent, as many of the current wastewater filtration systems are inadequate for their removal [2,3].
Recent studies suggest that when paired with UV light, titanium dioxide (TiO2) is an effective photocatalyst for the degradation of organic compounds such as PPCPs [4,5,6]. The irradiation of TiO2 by UV light forms electron-hole pairs by promoting an electron from the valence band to the conduction band. The electron-hole pairs can then undergo redox reactions with water and oxygen to form reactive oxygen species (ROS). These ROS participate in redox reactions with organic compounds, causing decomposition [7,8,9,10,11,12,13]. The electron-hole pairs can also undergo redox reactions with organic compounds, decomposing them directly [14]. In addition, recent work has shown the use of TiO2 nanomaterials for the formation of C–C bonds through their photocatalytic properties [15], which has been shown to be useful for the synthesis of polysubstituted imidazolidines [16]. Other forms of photocatalysis have been used to remove endocrine disruptors in water [17] as well as in laser-powder bed fusion for the adsorption of nitrogen [18].
One practical concern with the use of TiO2 as a photocatalyst for water treatment plants is the removal of powdered TiO2 after treatment. On a small scale, TiO2 is often removed by centrifugation, but this is impractical for large-scale water treatment. In this study, the TiO2 has been immobilized on a porous membrane to eliminate the need for filtration, following a method from similar studies [10,11].
In this paper, the effect was considered of methanol in solution on the membrane. Methanol is commonly used as a carrier solvent for PPCPs in similar papers [5,6,10,11,19,20,21,22,23,24,25]. Methanol has been demonstrated to scavenge hydroxyl radicals and holes produced in the photocatalysis cycle by TiO2, which may influence the photocatalytic degradation of PPCPs [10,22,23,24,25,26,27]. To investigate the influence of methanol on the photocatalytic degradation of PPCPs, a range of methanol concentrations was considered. An intermediate concentration of methanol was used in conjunction with all other experimental conditions to reproduce typical experimental conditions. The study is comparable with work on powdered samples, in which methanol is typically the solvent of choice [28]. Ethanol [29] and acetonitrile [30] have also been used, but the adaptation of these solvents is not as wide-spread because many more PPCPs are soluble in methanol compared with other solvents, and the boiling point of methanol is lower than those of ethanol and acetonitrile, making it easier to extract and concentrate samples for LC-MS/MS analysis. It is also important to note that the tested mixtures contain compounds that may undergo reductive degradation. The addition of methanol can promote this process by scavenging hydroxyl radicals.
Another experimental factor investigated in this paper is the influence of the UV–LED pulse frequency on photocatalytic activity. This study examines the effect of alternating between pulse frequencies of 50 Hz and 0.1 Hz (both with a duty cycle of 50%) for equal intervals. Several studies suggest that though light exposure is decreased relative to continuous light, the kinetic rate constants may remain unchanged or even increase in some cases [12,31,32,33,34,35,36]. This increased photonic efficiency decreases energy consumption, which has a significant impact on the costs of using photocatalysis in a water treatment plant.
The influence of solution pH on photocatalysis by TiO2 was also investigated. At the experimental pH of 5, the surface charge of the PTT membrane is positive [10,11]. The effect of pH on photocatalysis was investigated under both continuous and dual frequency (25 Hz and 0.05 Hz) UV–LED conditions, from pH 3 to pH 10. Compared with previous work [37], we discuss the influence of pH, the amount of methanol carrier solvent, and UV light irradiation parameter.

2. Materials and Methods

2.1. Reagents and Chemicals

All reagents for membrane synthesis were purchased from Sigma-Aldrich at >99% purity. Ultrapure water was obtained from a MilliQ water purification system (MilliQ, EMD Millipore, Mississauga, ON, Canada). The 18 compounds included in this study were purchased from Sigma-Aldrich. More information about the compounds and their deuterated standards is available in Table 1 and Table 2. Standards (regular and deuterated) were prepared at 1 g/L in methanol and stored in amber vials at −20 °C. LC-MS/UHPLC grade methanol was obtained from VWR Analytical. LC-MS grade ammonium acetate was obtained from Fluka Analytical. Deuterated samples used to decrease chromatography time because they increase the throughput and lower the rejection rate.

2.2. Titanium Dioxide-Coated Membrane Synthesis

The porous titanium–titanium dioxide (PTT) membrane synthesis was conducted similar to previous work [10,11]. To summarize, 50 mm diameter discs were cut from porous titanium (PTi) sheets (0.254 mm thick, Accumet Materials, Ossining, NY, USA) and cleaned with ethanol and water. The discs were then oxidized by immersing them in 50 mL of 30% H2O2 at 80 °C for 2 h, then washed in water. After washing, they were dried at 80 °C for 8 h and calcined at 600 °C for another 2 h. The resulting membranes are porous titanium with an oxidized surface of TiO2.

2.2.1. Nanomaterial Characterization

The crystal structure of PTT membranes was determined using micro-Raman spectroscopy (Renishaw, England, United Kingdom, He–Ne laser λ = 632.8 nm) and X-ray diffraction (XPERT-PRO). The morphology was characterized by scanning electron microscopy (FE-SEM LEO 1550, Carl Zeiss Microscopy, Jena, Germany).

2.2.2. Experimental Setup

For each experiment, 200 µL of 10 mg/L pharmaceutical stock solution was spiked in an amber vial and evaporated under nitrogen gas. The samples were then reconstituted in 1 L of ultrapure water and stirred for 5 min for a 2 µg/L solution. A total of 300 mL aliquots of the solution were then transferred to beakers containing a PTT membrane on a stand, which was suspended in the solution. The beakers were then stirred at 600 rpm under a UV–LED light source designed in-house. The UV–LED (λ = 365 nm) provided 1.7 × 10 3   W of power, with an irradiance of 0.13   mW · cm 2 . The UV–LEDs were 10.5 cm above the starting solution level, and the membranes were 1.5 cm under the surface.
For experiments investigating varying methanol concentrations, each beaker was spiked with 0, 6, 60, or 600 µL of methanol for 0%, 0.002%, 0.02%, or 0.2% solutions, respectively, before being placed under the light source. The beakers were first equilibrated for 1 h in the dark before the exposure to UV–LED light. After the light exposure began, 5 mL samples were taken at 0, 60, 90, 120, 150, 180, and 210 min.
For experiments investigating varying UV–LED pulse frequencies and solution pH, the beakers were first spiked with 60 µL of methanol for a 0.02% solution, and then the pH was adjusted from an initial value of 5 to 3 and 10 with hydrochloric acid and sodium hydroxide, respectively. One beaker was kept at the original pH. One set of beakers was exposed to dual-frequency UV–LED light alternating between 25 Hz for 500 cycles and 0.05 Hz for 1 cycle (equal time spent at each frequency); the other set was exposed to continuous light. The pulse frequency was controlled using a pulse width modulation (PWM) script programmed into an Arduino microcontroller connected to an LED current driver. More details are available in the Supplementary Material. The beakers were first equilibrated for 1 h in the dark before exposure to UV–LED light. After light exposure began 5 mL samples were taken at 0, 60, 120, 180, 240, and 300 min.

2.3. Sample Preparation and Analysis

Samples were spiked with deuterated standards to a concentration of 20 µg/L and then underwent solid phase extraction (SPE) following the method of Arlos et al. [10]. Sample PPCPs were quantified using an Agilent 1200 HPLC (Agilent Technologies) coupled to a mass spectrometer (3200 QTRAP, ABSciex, Concord, ON, Canada). The optimized LCMS parameters are detailed in Tables S1–S4 of the Supplementary Material.
Linear regression and correlation analysis were performed using Origin Lab (version 8.0) to determine the kinetic rates of degradation and significant changes in those rates. The kinetic rate constants were modeled with Langmuir–Hinshelwood kinetics. At low analyte concentrations, the following simplified pseudo first-order equation can be used:
r = d C d t = k a p p C
where C   ( g · mol 1 ) is the analyte concentration, k a p p   ( min 1 ) is the apparent reaction rate, t   ( min ) is the reaction time, and r   ( g · mol 1 · min 1 ) is the rate of degradation. The integrated form of the rate equation is:
ln ( C C o ) = k a p p t .
where C o   ( g · mol 1 ) is the initial analyte concentration before photocatalysis. The apparent kinetic rate in Equation (2) is the slope of the plot of ln ( C C o ) vs. t . Tukey’s means comparison test was performed using 1-way ANOVA in Origin to determine which apparent reaction rates were different within each set of variable experimental conditions. A significance level of 0.05 was used for the means comparison. Kinetic rates and means comparisons were calculated for each individual compound and for all 18 PPCPs cumulatively.
Correlation analysis was used to relate compound kinetic rate constants to various physical properties. Pearson’s r, Spearman’s ρ , and Kendall’s τ were used to determine if relationships were linear or nonlinear. Spearman and Kendall’s coefficient measure nonlinear monotonic correlation so they are not strongly affected by outliers, but Pearson’s coefficient measures linear monotonic relationships so it is affected by outliers [37].

3. Results

3.1. Nanomaterial Characterization

The uncoated PTi membrane has an average pore size of 10 µm (determined using a thermal sintering process) and a porosity of 50% (determined by the manufacturer). Increasing porosity increases the surface area of the material and increases the number of adsorption sites, but it decreases the mechanical strength of the material. Materials with a porosity below 50% are significantly more brittle, so the porosity of these membranes is as high as possible while still maintaining adequate strength [38,39].
The coated membranes weigh 1.33 ± 0.08 g with a surface roughness of 5–10 µm [11]. The Raman spectra show that the PTT surface has anatase phase TiO2, and uncoated PTi has no peaks indicative of crystalline TiO2 [37]. XRD shows the PTT also has rutile and titanium TiO2 crystal structures [37]. The bandgap energy, derived from a Tauc plot, is 3.0 eV [10]. This bandgap corresponds to crystalline TiO2. The isoelectric point of PTT is 6.0 [10]. The immobilization of a photocatalyst adds a photonic penalty to a photocatalysis reaction. In contrast, the use of a slurry reactor provides a homogeneous distribution of catalyst so mass transfer influences are negligible. Based on these data, we were able to utilize the anatase structure to improve the photocatalytic activity in the degradation of PPCPs.

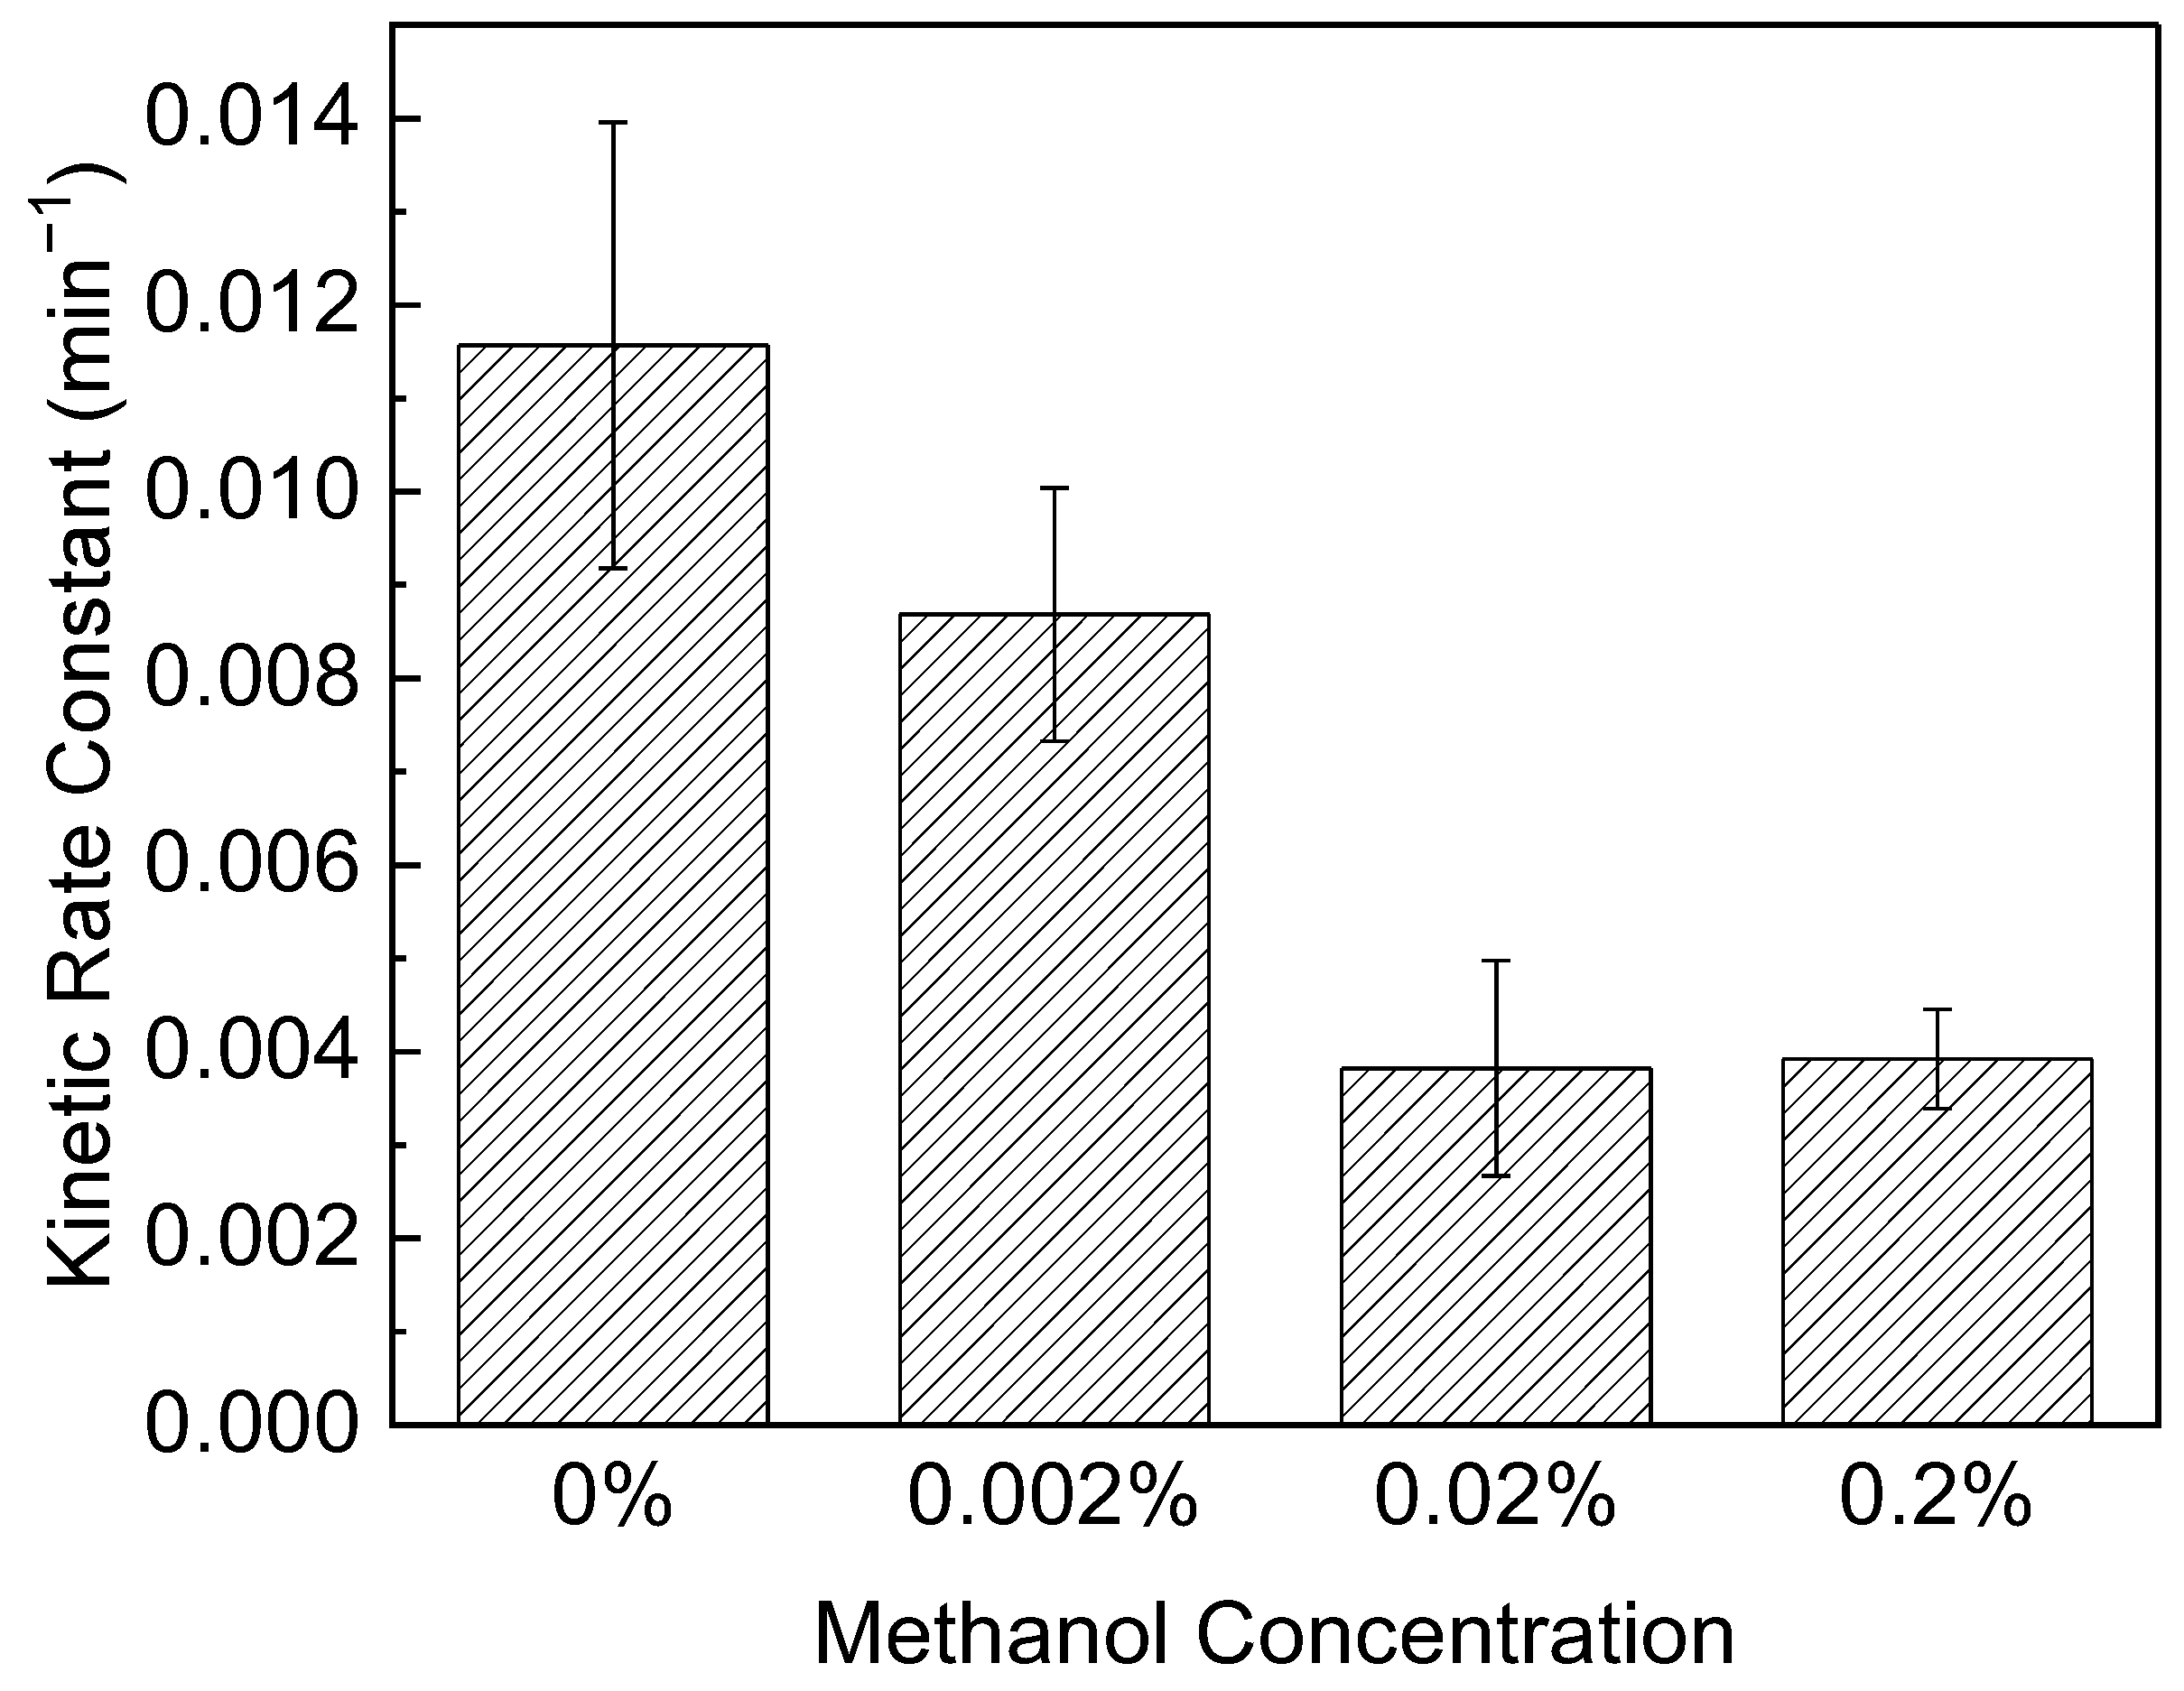
3.2. The Effect of Methanol on PPCP Photocatalysis

The photocatalytic activity of the PTT membrane was tested under varying methanol concentrations to examine its effect on photocatalysis when used as a carrier solvent for PPCPs. Methanol was spiked into aqueous PPCP solutions to concentrations of 0%, 0.002%, 0.02%, and 0.2% v/v with a PTT membrane suspended in each. Cumulative rates are compared in Figure 1. The observed kinetic rate constants for each compound and cumulative rates are available in Table S6. Cumulative kinetic rate constant is the kinetic rate constant that was calculated from the average of all compound concentrations to get the total parent compound concentration at each time point. The normalized total concentration of the parent compound is then used to obtain the cumulative kinetic rate constant from the slope of the ln(C/Co) vs. t plot.
Tukey’s means comparison test was calculated to compare the kinetic rate constants at different concentrations of methanol (Table S7). The cumulative kinetic rate constant showed a significant decrease in decomposition at methanol concentrations above 0.002%. The following compounds showed no statistical difference in kinetic rate constant between all methanol concentrations studied: NPX, TCS, FLX, and NFLX. The majority of compounds (GFZ, TCCB, ATRZ, CBZ, SULF, ATEN, VEN, TRIM, and e-CBZ) showed significantly decreased decomposition rates, above 0.002% methanol. IBU and DCF have significantly higher decomposition rates, above 0.002% and 0.02% methanol, respectively. ATOR has a significantly lower decomposition rate, above 0.02% methanol. Both p-ATOR and o-ATOR show a significant decrease in decomposition rate at 0.02% methanol, then a significant increase in decomposition rate at 0.2%. In general, the use of methanol as a carrier solvent above concentrations of 0.002% had a significant impact on the experimental results for photocatalytic decomposition. This impact was generally unfavourable, decreasing rates significantly. To take into consideration the effects of methanol, the following experiments will all be conducted in a solution of 0.02% methanol, which was the lowest concentration that demonstrated an effect on all PPCPs tested (except the compounds that showed no significant change at any concentration).

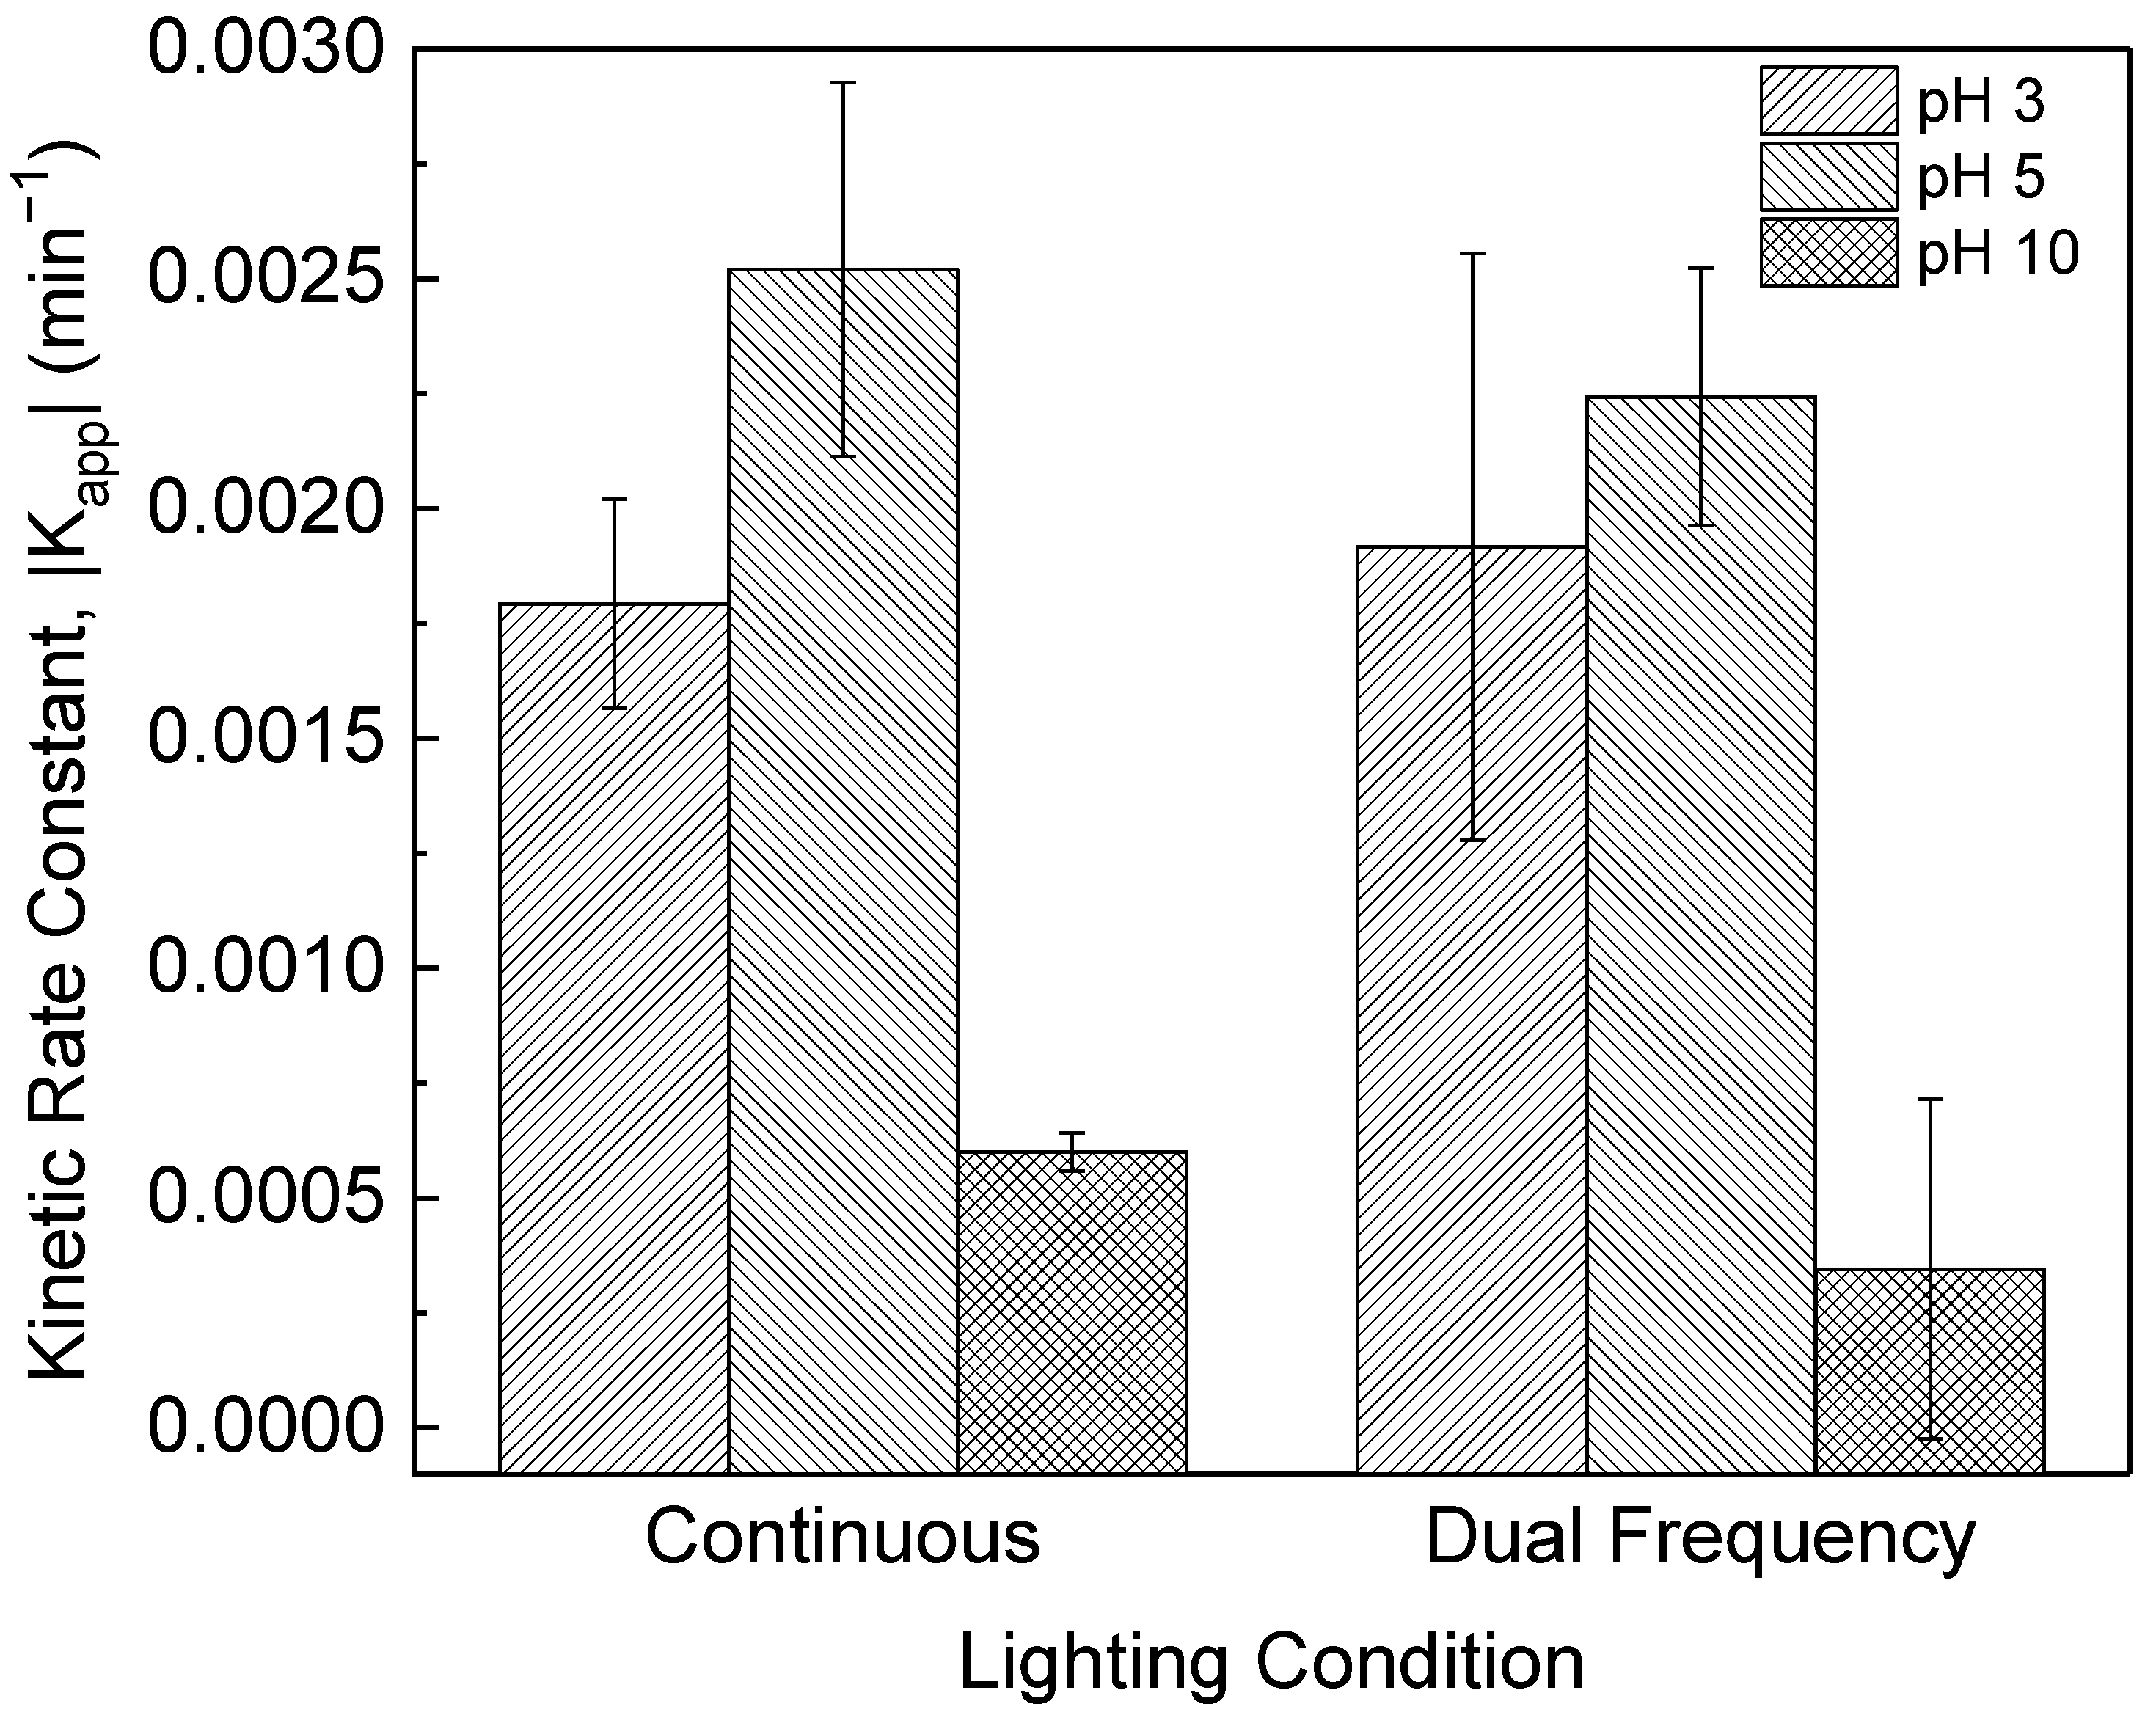
3.3. The Effect of Dual Pulse Frequencies on PPCP Photocatalysis

To study the effects of controlled periodic illumination (CPI) on the photocatalytic degradation of PPCPs, experiments were run under both continuous and dual-frequency light (equal intervals of 50 Hz and 0.1 Hz). The reaction mixtures were spiked to 0.02% methanol according to the previous section. The individual and cumulative kinetic rates at experimental pH were compared using Tukey’s means comparison test. The majority of compounds showed no change in the kinetic rate constant between the continuous and dual lighting conditions (except TCS, TCCB, and ATOR). The cumulative kinetic rate also showed no change between lighting conditions (see Table S8). Although UV light exposure decreases with the use of dual-frequency CPI, the kinetic rate constants remain unaffected. These results suggest that CPI can be used to increase the photonic efficiency of UV-TiO2 reactors without sacrificing performance.

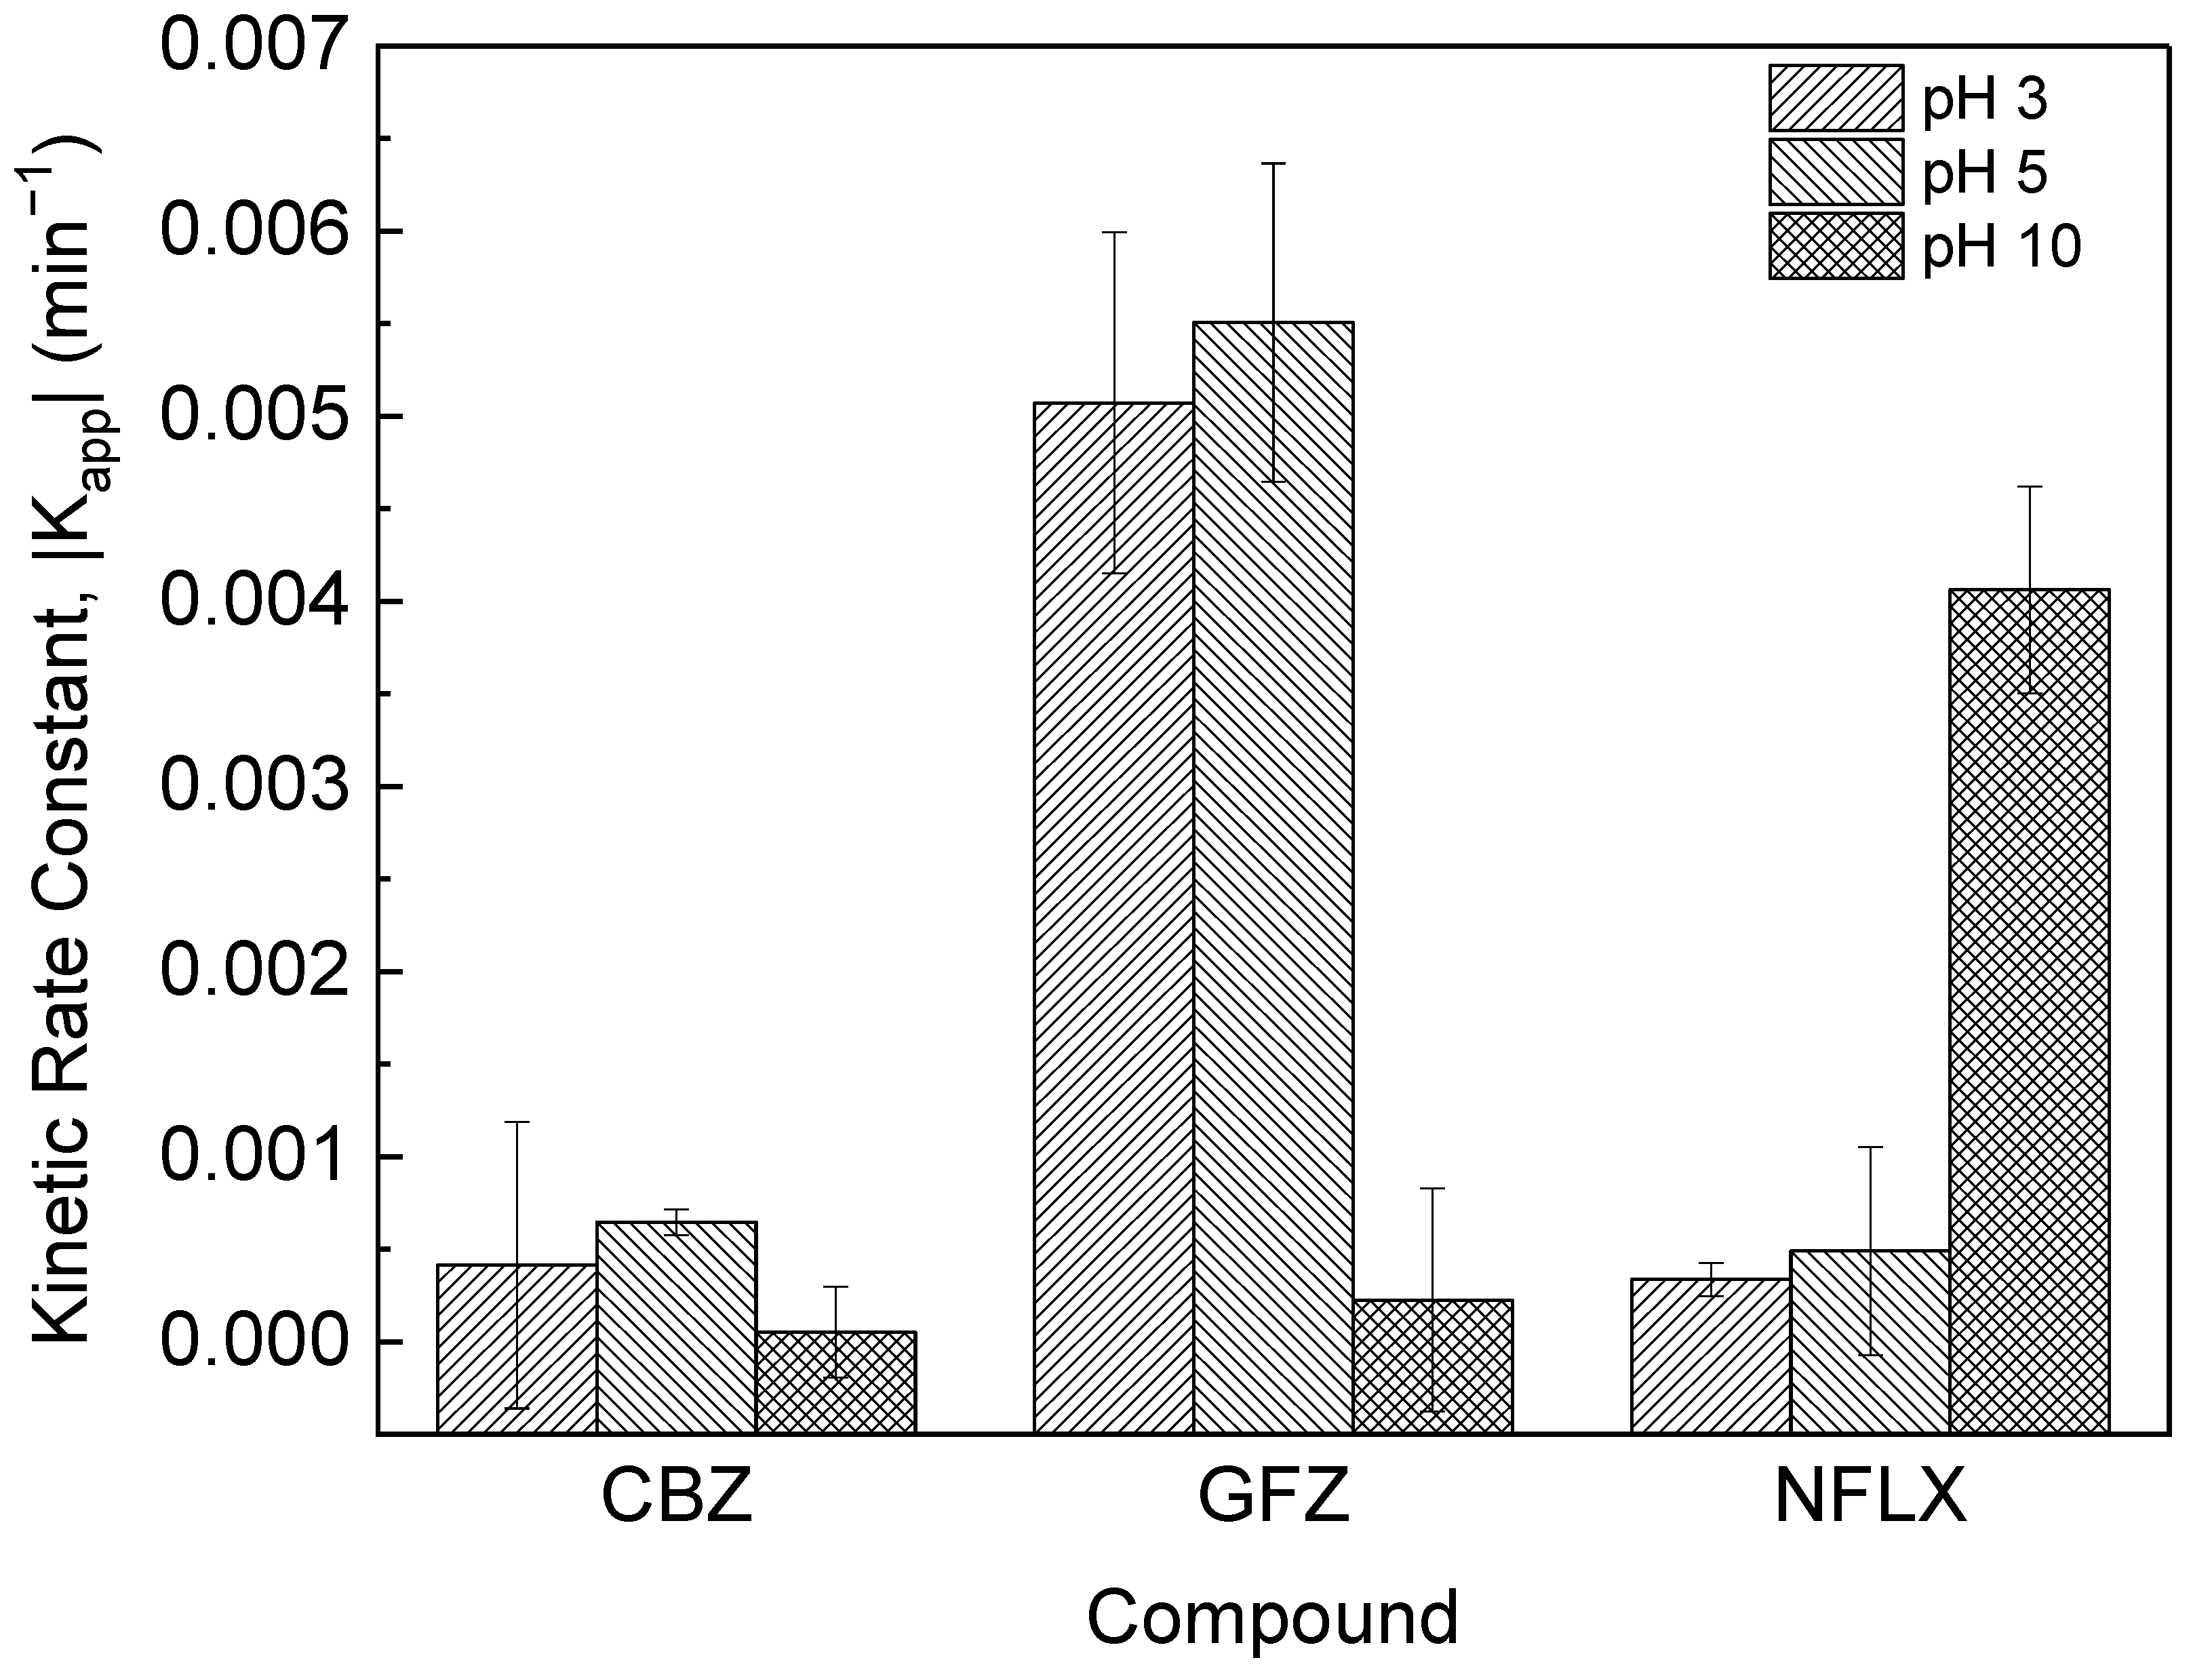
3.4. The Effect of pH on PPCP Photocatalysis

To study the effect of pH on the photocatalytic degradation of PPCPs in UV light solutions of PPCPs were adjusted to pH 3, 5, and 10 before photocatalysis began. The reactions were run under continuous and dual frequency UV light and spiked to 0.02% methanol to take into consideration the effects seen in Section 3.2. Overall, the cumulative kinetic rate was greatest at pH 5 and showed significant decreases at pH 3 and 10 (see Figure 2). A summary of kinetic rate constants for all compounds at each pH is in Tables S8 and S9.
The PTT membranes used for photocatalysis have an isoelectric point of 6. At pH 3 and 5, the membrane is positively charged, and at pH 10, the membrane is negatively charged. The charge of the compounds also changes across the pH range. Compound charges at each tested pH were calculated from pKa values using the Henderson–Hasselbach equation rearranged as shown below:
α = 1 10 pKa pH + 1
where α is the fraction of molecules that have been deprotonated. These fractional charges of the different functional groups of each compound were added to give the overall charge of the compound. Compound charges are summarized in Table 2.
Overall, the net kinetic rate constant is highest at pH 5, where the compound net charge is neutral and the PTT membrane charge is positive. At pH 3, both the compound net charge and the membrane are positive, and at pH 10, they’re both negative. This suggests that the compounds may experience an electrostatic repulsion or attraction to the membrane based on charge, which influences the rate of degradation. It is important to note that calculating the net charge of a mixture is difficult as each component in a mixture will interact differently with the membrane surface. Depending on the pH of the solution, the tested compounds appear in the reaction mixture in various forms (conjugate acid or base, neutral form). Similarly, the membrane surface has a different charge depending on the pH of the reaction mixture. This results in the presence or absence of membrane surface–organic compound interactions, which can significantly affect the efficiency and rate of degradation of the organic compound. This change in charges can then result in lower R2 values for the kinetic rate as we have observed. In this study, we observed the negatively charged compounds to be pH dependent.
Tukey’s means comparison test was used to compare the kinetic rate constants at different pH (Table S10). Of the 18 compounds tested, ATRZ, CBZ, TRIM, and e-CBZ showed no change in kinetic rate constant across the pH range in continuous UV light. Nearly all compounds show increasing kinetic rate constants with decreasing electrostatic repulsion. Compounds that are negatively charged at pH 3 and 5 experience electrostatic attraction to the positively charged PTT membrane. This electrostatic attraction results in increased kinetic rate constants. Compounds that are positively charged at pH 3 and 5 experience electrostatic repulsion and a decrease in kinetic rate constant. The inverse is true at pH 10 as the PTT membrane is negatively charged. For example, the kinetic rate constant is higher at pH 10 than at pH 3 or 5 because the PTT membrane is negatively charged and NFLX is positively charged. In contrast, at the lower observed pHs the membrane and NFLX are both positively charged. The only compound that does not follow this trend is TCCB, which degrades best when it is neutral at pH 5 and slightly negative at pH 10. The kinetic rate constants of several differently charged compounds are compared in Figure 3 as an example of typical trends. It was observed that compounds that are oppositely charged to the membrane follow a first-order model, while compounds that have similar charge to the membrane or are neutral tend to deviate from a first-order model. The compounds that do not have opposite charges to the membrane will generally not follow first-order models, which we have observed in these data.
The trend seen in continuous UV light is also seen in dual-frequency light. IBU, TCCB, ATRZ, CBZ, TRIM, and e-CBZ show no changes in kinetic rate constant across the pH range investigated, but all other compounds show increased kinetic rate constants with decreased electrostatic repulsion. Rates for dual frequency lighting are summarized in Table S11.
To quantify the relationships we saw between charge and kinetic rate constant in both continuous and dual lighting, a multivariable linear regression model was used (Table S12). The apparent kinetic rate constant and compound charge at pH 5 have a weak correlation ( R 2 0.62 ). The addition of molecular mass as a variable greatly increases the correlation ( R 2 0.81 ). The addition of solubility further increases the correlation ( R 2 0.89 ). Kinetic rate constants at pH 10 and 3 showed no linear relationship with charge, molecular mass, or solubility ( R 2 0.41 and R 2 0.58 , respectively).
Correlation analysis was also performed using several linear and nonlinear models (Pearson, Spearman, and Kendall) (Table S13). At pH 3 and 5, charge showed a significant positive nonlinear relationship with rate ( ρ 0.82 ,   p 0.00003 ). At pH 10, charge showed a significant negative linear relationship with rate ( | r | 0.5 , p 0.03 ). These relationships support the explanation that kinetic rate is influenced by electrostatic forces. At pH 5 and 3, molecular mass has a strong negative relationship with rate, and solubility has a strong positive relationship with rate ( p 0.02 ). At pH 10, molecular mass and solubility have weak to moderate and insignificant relationships with rate ( p 0.6 and 0.1 ρ 0.7 ). These results suggest that smaller, more soluble PPCPs may have a higher rate of degradation because of their increased adsorption on the PTT membrane.

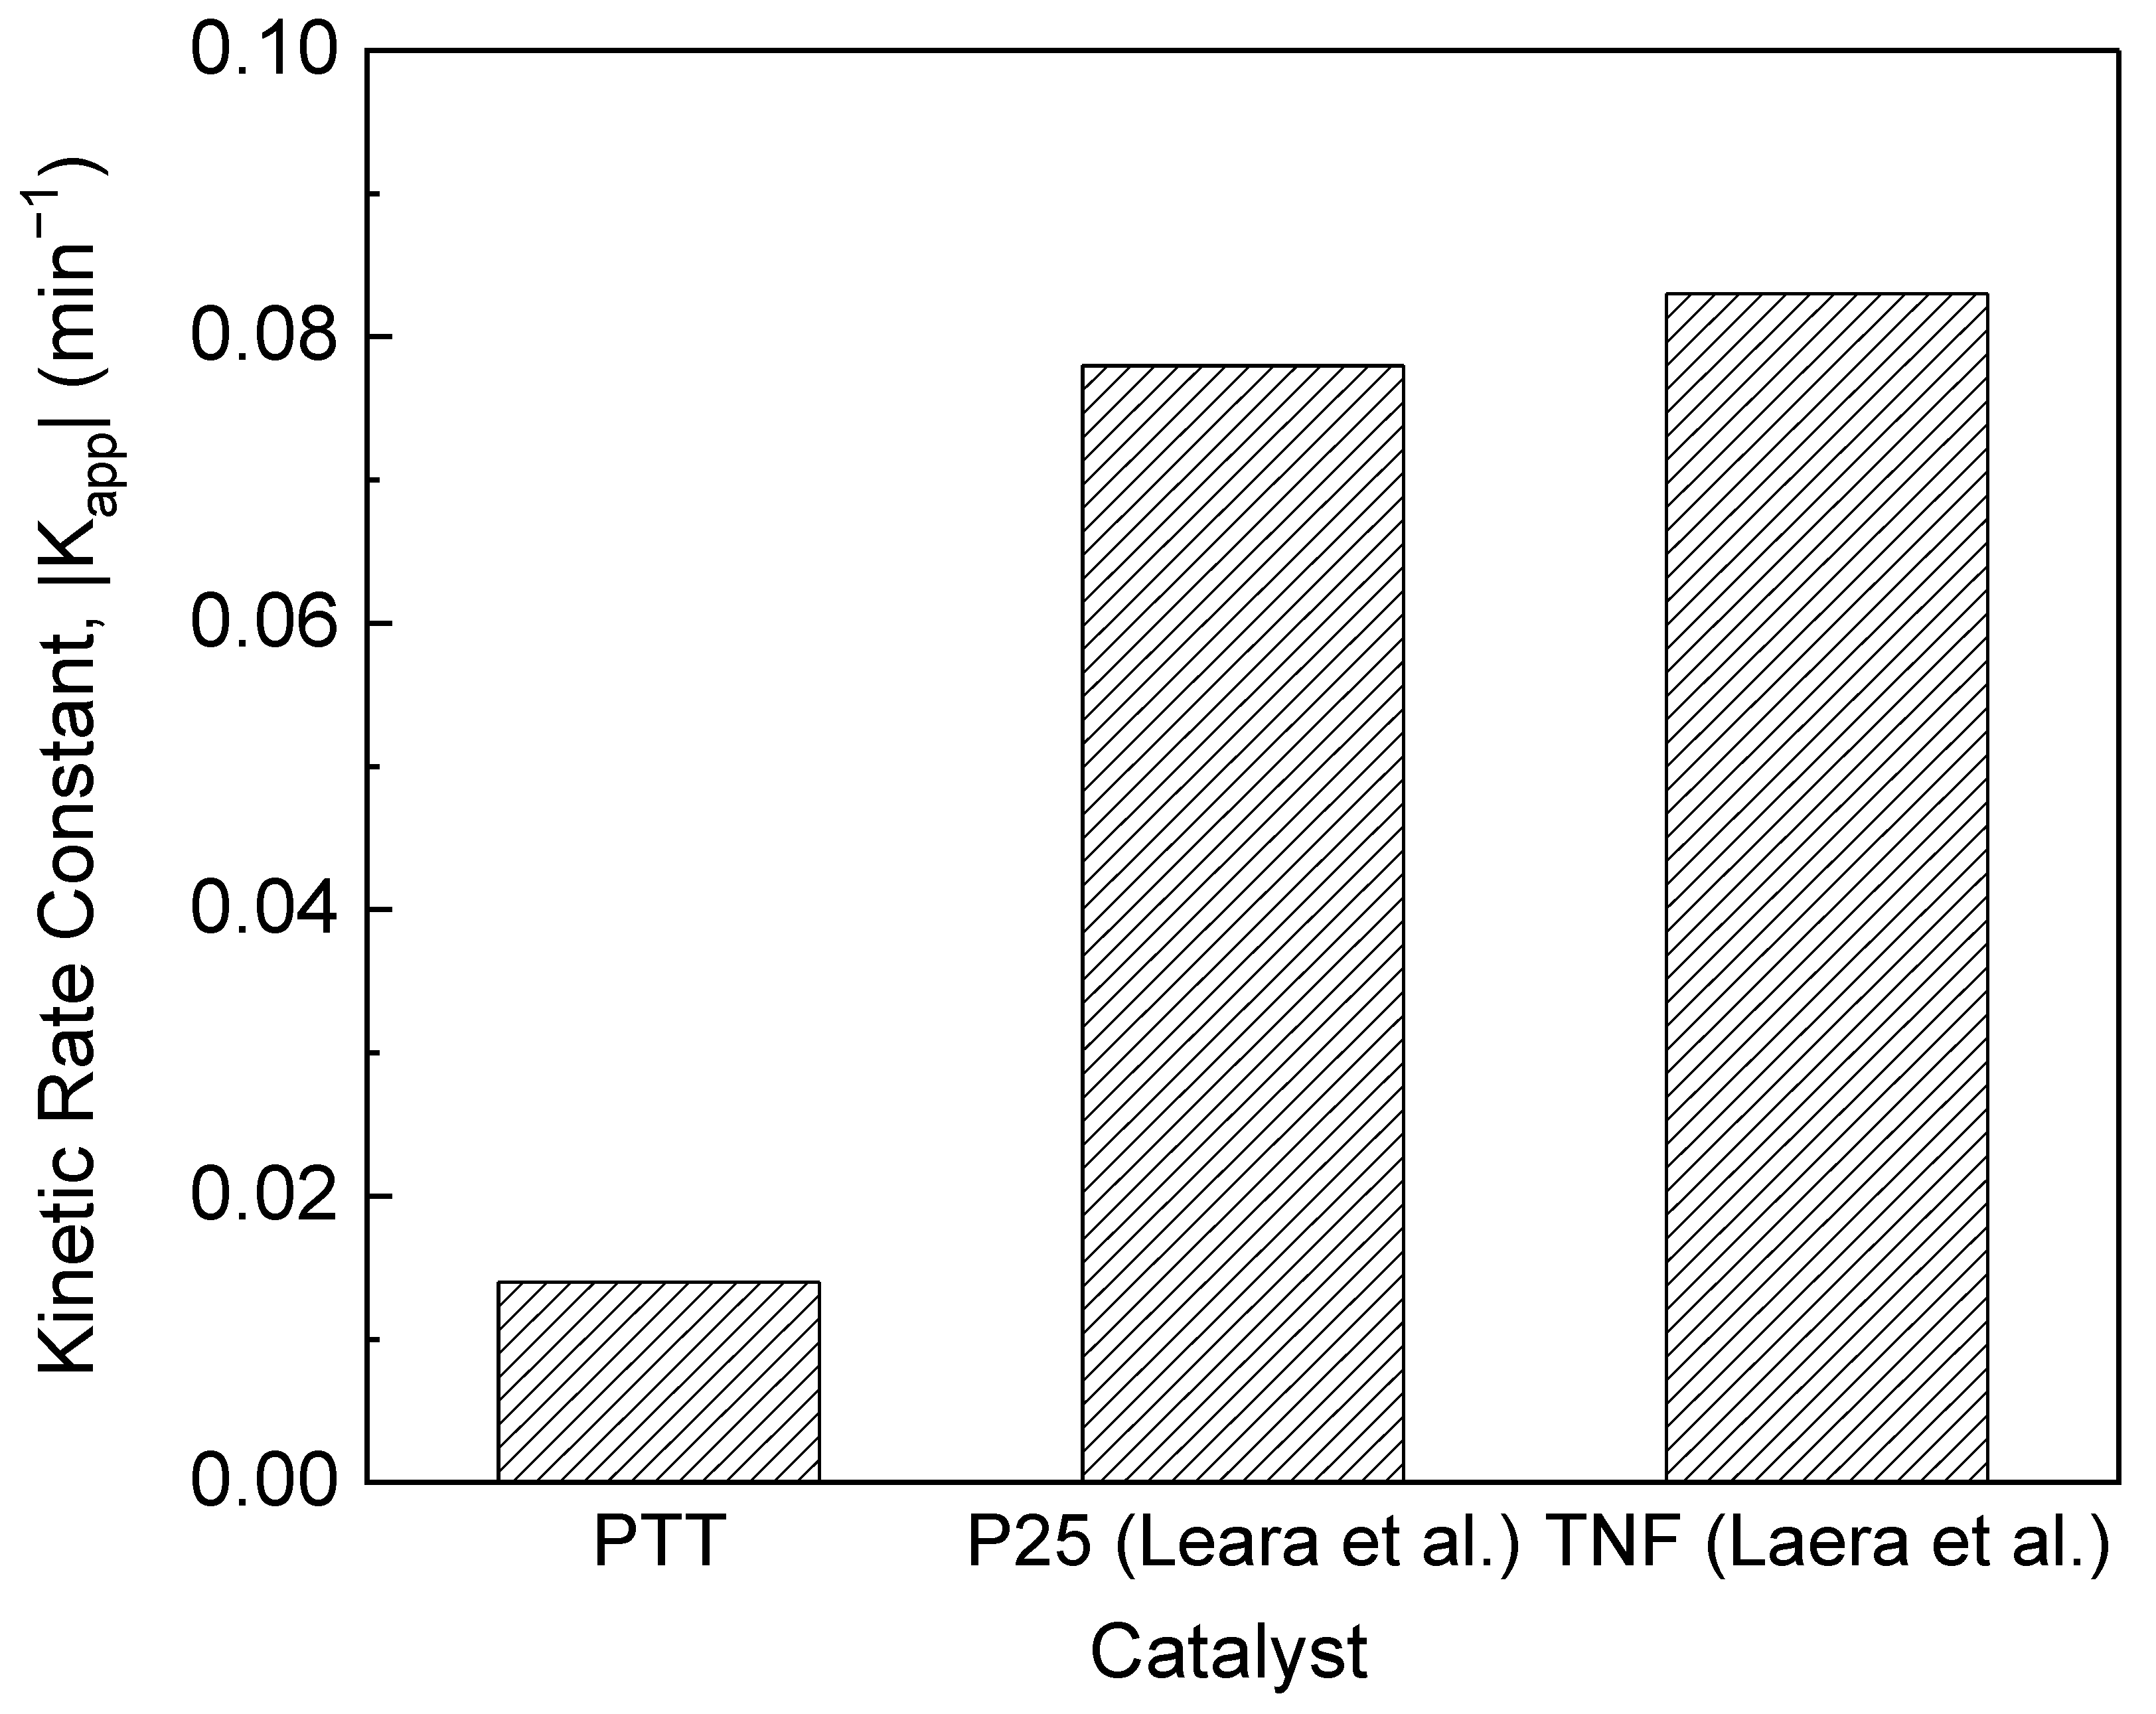
3.5. Literature Comparison

In a similar study by Laera et al., CBZ was treated with powder TiO2 (P25) and titanate nanofibers (TNF) instead of PTT membranes. The photocatalysis took place using 8 W 360 nm UV lamps with 0.1 mg/L of catalyst and a starting CBZ concentration of 10 mM in saline solution [39]. Kinetic rates were calculated using the same Langmuir–Hinshelwood model used in this work. As shown in Figure 4, the experiments by Laera et al. resulted in much larger kinetic rates. These results are expected with powder catalysts such as P25 because they have greater surface area than their membrane counterparts. TNFs also have a surface area comparable with that of powder P25, which explains their similar kinetic rates [39]. A lower rate may also be because of the more complex 18 pharmaceutical matrix considered in this work, as opposed to the 2 compounds treated in the previous study. With more compounds competing for catalytic sites, the catalyst loading of CBZ is decreased. The authors of the same study repeated their experiment with TNF in wastewater effluent, which is a complex matrix more like the pharmaceutical cocktail used in this paper. Under the same reaction conditions as in the clean matrix, the kinetic rate was over 30 times smaller, and over 5 times smaller than the rate reported in this work. These results suggest that the reaction matrix plays a significant role in the rate of compound degradation, which will have to be taken into consideration when comparing studies as well as when treating wastewater. Based on work in [37] there are mass transfer limitations. These observations indicate that powdered samples have more of a surface area for pharmaceutical reactivity, whereas the membranes, such as those presented in this work, have limited surface sites for reaction. The light irradiation must pass through the water to hit the membrane instead of stirring with powder, which tends to remain on the water surface level where the light reacts the most, thereby increasing the reaction rate. In addition, previous work on powdered samples in the presence of methanol showed a comparable trend [30].

4. Conclusions

Carrier solvents such as methanol are commonly used to add compounds such as PPCPs to aqueous solutions. This study concludes that the use of methanol as a carrier solvent has a significant and irregular effect on the photocatalytic kinetic rate constants of these compounds. The majority of compounds show a decrease in rate above 0.002% methanol, though others show no change or an increase in rate. Further experiments in this study were spiked to 0.02% methanol to replicate the conditions common in other work and to take the effects of methanol into account. Intermediate products in the processes were not detected in this iteration of the work.
To increase the photonic efficiency of the UV/TiO2 membrane reactor, CPI was investigated. Two sets of reactions, one with continuous UV exposure and one with dual-frequency UV exposure (equal lengths of 50 Hz and 0.1 Hz light), were compared. Statistical analysis showed that there was no difference in cumulative kinetic rate constants and no difference in the large majority of individual PPCP kinetic rate constants. Based on these results, decreasing UV light exposure in UV/TiO2 membrane reactors for PPCPs has little to no effect on kinetic rate constants and could greatly increase photonic efficiency. Further work should determine optimal illumination profiles.
Factors such as the charge, solubility, and size of PPCPs and their influence on the adsorption and subsequent degradation in UV/TiO2 reactions were investigated. Electrostatic forces were found to have a strong correlation to kinetic rate constants, as well as to solubility and size. Compounds that were oppositely charged to the PTT membrane at the experimental pH had significantly higher kinetic rate constants than compounds that were similarly charged. These results were consistent across a pH range from 3 to 10. Compounds that were smaller and more soluble also had higher kinetic rate constants. The consideration of all three factors together showed a strong linear relationship with kinetic rate constant. In future work, the pH of reaction solutions and the isoelectric point of TiOf catalysts can be modified to maximize the compound kinetic rate constants.

Supplementary Materials

The following supporting information can be downloaded at: https://www.mdpi.com/article/10.3390/photochem2030035/s1, Table S1: Optimized MS/MS parameters and detection limits for target compounds. Table S2: Optimized MS/MS parameters for deuterated standards. Table S3: Ionization parameters for LC-MS/MS. Table S4: Chromatographic parameters for LC-MS/MS. Table S5: Mobile phase gradient for LC-MS/MS. Table S6: Individual and cumulative kinetic rates for reactions spiked with methanol. Table S7: Tukey’s means comparison test at the α = 0.05 significance level for PPCPs treated under UV light at varying methanol concentrations. Table S8: Tukey’s means comparison test at the α = 0.05 significance level for PPCPs treated under continuous and dual frequency lighting. Table S9: Individual and cumulative kinetic rates for reactions under continuous UV at varying pH. Table S10: Individual and cumulative kinetic rates for PPCPs under dual frequency (50 Hz and 0.1 Hz) UV light at varying pH. Table S11: Tukey’s means comparison test for kinetic rate constants of PPCPs at different pH under continuous UV light. Table S12: Tukey’s means comparison test for kinetic rate constants of PPCPs at different pH under dual frequency UV light. Table S13: Linear regression analysis of the kinetic rate constants of PPCPs under continuous and dual frequency light using charge, mass, and solubility. Table S14: Correlation analysis of PPCP kinetic rate constants under continuous and dual frequency lighting with charge, mass, and solubility. Figure S1. Zeta potential readings for PTT. pIEP is the point with a zero-zeta potential (approximately at pH 6). Figure S2. High-resolution SEM of the morphology of the membranes at different magnifications. Figure S3. Raman characterization at 488 nm of the PTi and PTT samples. Figure S4. X-ray diffraction for the PTT membrane sample. Figure S5. Tauc plots for the P25 and PTT samples. Linear Fit at different light exposures and pHs. Figure S6. pH 3 Dual light linear fit. Figure S7. pH 3 Continuous light linear fit. Figure S8. pH 5 Dual light linear fit. Figure S9. pH 5 Continuous light linear fit. Figure S10. pH 10 Dual light linear fit. Figure S11. pH 10 Continuous light linear fit. Figure S12. pH 3 Continuous light for CBZ sample linear fit. Figure S13. pH 3 Continuous light for NFLX sample linear fit. Figure S14. pH 3 Continuous light for GFZ sample linear fit. Figure S15. pH 5 Continuous light for GFZ sample linear fit. Figure S16. pH 5 Continuous light for CBZ sample linear fit. Figure S17. pH 5 Continuous light for NFLX sample linear fit. Figure S18. pH 10 Continuous light for GFZ sample linear fit. Figure S19. pH 10 Continuous light for CBZ sample linear fit. Figure S20. pH 10 Continuous light for NFLX sample linear fit.

Author Contributions

Conceptualization, M.S. and R.L.; Data curation, J.C.V.L., O.S., A.K. and L.C.M.L.C.F.; Formal analysis, M.S., J.C.V.L., O.S., A.K. and L.C.M.L.C.F.; Funding acquisition, R.L.; Investigation, M.S. and J.C.V.L.; Methodology, M.S. and R.L.; Project administration, R.L.; Resources, M.S., N.Y.Z. and M.R.S.; Software, R.L.; Supervision, R.L., N.Y.Z. and M.R.S.; Validation, J.C.V.L., O.S. and A.K.; Writing—original draft, M.S., R.L. and J.C.V.L.; Writing—review & editing, M.S. and R.L. All authors have read and agreed to the published version of the manuscript.

Funding

This work was funded through the Natural Sciences and Engineering Research Council (NSERC) of Canada—Strategic Project Grant (STPGP 430654-12). We would also like to acknowledge the help and assistance provided by the Schwartz–Resiman Foundation under the WaterlooTechnion Research Co-operation Program.

Data Availability Statement

The datasets generated during and/or analysed during the current study are available from the corresponding author on reasonable request.

Acknowledgments

The authors would like to thank the full-time staff and members of the Servos lab, in particular Leslie M. Bragg, and the Centre of Advanced Materials joining for their insight and assistance on the project.

Conflicts of Interest

The authors declare no conflict of interest.

References

  1. Daughton, C.G.; Ternes, T.A. Pharmaceuticals and personal care products in the environment: Agents of subtle change? Environ. Health Perspect. 1999, 107, 907–938. [Google Scholar] [CrossRef] [PubMed]
  2. Kasprzyk-Hordern, B.; Dinsdale, R.M.; Guwy, A.J. The removal of pharmaceuticals, personal care products, endocrine disruptors and illicit drugs during wastewater treatment and its impact on the quality of receiving waters. Water Res. 2009, 43, 363–380. [Google Scholar] [CrossRef] [PubMed]
  3. Nikolaou, A.; Meric, S.; Fatta, D. Occurrence patterns of pharmaceuticals in water and wastewater environments. Anal. Bioanal. Chem. 2007, 387, 1225–1234. [Google Scholar] [CrossRef] [PubMed]
  4. Tong, A.; Braund, R.; Warren, D.; Peake, B. TiO2-assisted photodegradation of pharmaceuticals—A review. Open Chem. 2012, 10, 989–1027. [Google Scholar] [CrossRef]
  5. Miranda-García, N.; Maldonado, M.I.; Coronado, J.; Malato, S. Degradation study of 15 emerging contaminants at low concentration by immobilized TiO2 in a pilot plant. Catal. Today 2010, 151, 107–113. [Google Scholar] [CrossRef]
  6. Miranda-García, N.; Suárez, S.; Sanchez, B.; Coronado, J.; Malato, S.; Maldonado, M.I. Photocatalytic degradation of emerging contaminants in municipal wastewater treatment plant effluents using immobilized TiO2 in a solar pilot plant. Appl. Catal. B Environ. 2011, 103, 294–301. [Google Scholar] [CrossRef]
  7. Rizzo, L.; Meric, S.; Guida, M.; Fatta-Kassinos, D.; Belgiorno, V. Heterogenous photocatalytic degradation kinetics and detoxification of an urban wastewater treatment plant effluent contaminated with pharmaceuticals. Water Res. 2009, 43, 4070–4078. [Google Scholar] [CrossRef]
  8. Liang, R.; Hu, A.; Li, W.; Zhou, Y.N. Enhanced degradation of persistent pharmaceuticals found in wastewater treatment effluents using TiO2 nanobelt photocatalysts. J. Nanopart. Res. 2013, 15, 1990. [Google Scholar] [CrossRef]
  9. Martínez, C.; Fernández, M.; Santaballa, J.; Faria, J. Aqueous degradation of diclofenac by heterogeneous photocatalysis using nanostructured materials. Appl. Catal. B Environ. 2011, 107, 110–118. [Google Scholar] [CrossRef]
  10. Arlos, M.J.; Hatat-Fraile, M.M.; Liang, R.; Bragg, L.M.; Zhou, N.Y.; Andrews, S.A.; Servos, M.R. Photocatalytic decomposition of organic micropollutants using immobilized TiO2 having different isoelectric points. Water Res. 2016, 101, 351–361. [Google Scholar] [CrossRef]
  11. Arlos, M.J.; Liang, R.; Hatat-Fraile, M.M.; Bragg, L.M.; Zhou, N.Y.; Servos, M.R.; Andrews, S.A. Photocatalytic decomposition of selected estrogens and their estrogenic activity by UV-LED irradiated TiO2 immobilized on porous titanium sheets via thermal-chemical oxidation. J. Hazard. Mater. 2016, 318, 541–550. [Google Scholar] [CrossRef] [PubMed]
  12. Ku, Y.; Shiu, S.-J.; Wu, H.-C. Decomposition of dimethyl phthalate in aqueous solution by UV–LED/TiO2 process under periodic illumination. J. Photochem. Photobiol. A Chem. 2017, 332, 299–305. [Google Scholar] [CrossRef]
  13. Buechler, K.J.; Nam, C.H.; Zawistowski, T.M.; Noble, R.D.; Koval, C.A. Design and Evaluation of a Novel-Controlled Periodic Illumination Reactor To Study Photocatalysis. Indust. Eng. Chem. Res. 1999, 38, 1258–1263. [Google Scholar] [CrossRef]
  14. Schneider, J.; Matsuoka, M.; Takeuchi, M.; Zhang, J.; Horiuchi, Y.; Anpo, M.; Bahnemann, D.W. Understanding TiO2 Photocatalysis: Mechanisms and Materials. Chem. Rev. 2014, 114, 9919–9986. [Google Scholar] [CrossRef]
  15. Ma, D.; Liu, A.; Li, S.; Lu, C.; Chen, C. TiO2 photocatalysis for C–C bond formation. Catal. Sci. Technol. 2018, 8, 2030–2045. [Google Scholar] [CrossRef]
  16. Liu, A.; Ma, D.; Qian, Y.; Li, J.; Zhai, S.; Wang, Y.; Chen, C. A powerful azomethine ylide route mediated by TiO2 photocatalysis for the preparation of polysubstituted imidazolidines. Org. Biomol. Chem. 2021, 19, 2192–2197. [Google Scholar] [CrossRef]
  17. Ma, D.; Li, J.; Liu, A.; Chen, C. Carbon Gels-Modified TiO2: Promising Materials for Photocatalysis Applications. Materials 2020, 13, 1734. [Google Scholar] [CrossRef] [Green Version]
  18. Brown, B.; Newkirk, J.; Liou, F. Absorption of Nitrogen during Pulsed Wave L-PBF of 17-4 PH Steel. Materials 2021, 14, 560. [Google Scholar] [CrossRef]
  19. Miranda-García, N.; Suárez, S.; Maldonado, M.I.; Malato, S.; Sánchez, B. Regeneration approaches for TiO2 immobilized photocatalyst used in the elimination of emerging contaminants in water. Catal. Today 2014, 230, 27–34. [Google Scholar] [CrossRef]
  20. Sun, W.; Li, S.; Mai, J.; Ni, J. Initial photocatalytic degradation intermediates/pathways of 17α-ethynylestradiol: Effect of pH and methanol. Chemosphere 2010, 81, 92–99. [Google Scholar] [CrossRef]
  21. Nasuhoglu, D.; Berk, D.; Yargeau, V. Photocatalytic removal of 17α-ethinylestradiol (EE2) and levonorgestrel (LNG) from contraceptive pill manufacturing plant wastewater under UVC radiation. Chem. Eng. J. 2012, 185–186, 52–60. [Google Scholar] [CrossRef]
  22. Kralchevska, R.; Milanova, M.; Bistan, M.; Pintar, A.; Todorovsky, D. The photocatalytic degradation of 17α-ethynylestradiol by pure and carbon nanotubes modified TiO2 under UVC illumination. Open Chem. 2012, 10, 1137–1148. [Google Scholar] [CrossRef]
  23. Marinho, B.A.; de Liz, M.V.; Lopes Tiburtius, E.R.; Nagata, N.; Peralta-Zamora, P. TiO2 and ZnO mediated photocatalytic degradation of E2 and EE2 estrogens. Photochem. Photobiol. Sci. 2013, 12, 678–683. [Google Scholar] [CrossRef] [PubMed]
  24. Fernández, R.L.; McDonald, J.; Khan, S.; Le-Clech, P. Removal of pharmaceuticals and endocrine disrupting chemicals by a submerged membrane photocatalysis reactor (MPR). Sep. Purif. Technol. 2014, 127, 131–139. [Google Scholar] [CrossRef]
  25. Yang, Y.; Luo, L.; Xiao, M.; Li, H.; Pan, X.; Jiang, F. One-step hydrothermal synthesis of surface fluorinated TiO2/reduced graphene oxide nanocomposites for photocatalytic degradation of estrogens. Mater. Sci. Semicond. Process. 2015, 40, 183–193. [Google Scholar] [CrossRef]
  26. Nosaka, Y.; Nosaka, A.Y. Identification and Roles of the Active Species Generated on Various Photocatalysts. In Photocatalysis and Water Purification; Pichat, P., Ed.; Wiley-VCH Verlag GmbH: Weinheim, Germany, 2013; pp. 3–24. [Google Scholar] [CrossRef]
  27. Paul, T.; Miller, P.L.; Strathmann, T.J. Visible-Light-Mediated TiO2 Photocatalysis of Fluoroquinolone Antibacterial Agents. Environ. Sci. Technol. 2007, 41, 4720–4727. [Google Scholar] [CrossRef] [PubMed]
  28. Arlos, M.J.; Liang, R.; Fong, L.C.L.C.; Zhou, N.Y.; Ptacek, C.J.; Andrews, S.A.; Servos, M.R. Influence of methanol when used as a water-miscible carrier of pharmaceuticals in TiO2 photocatalytic degradation experiments. J. Environ. Chem. Eng. 2017, 5, 4497–4504. [Google Scholar] [CrossRef]
  29. Colina-Márquez, J.; Machuca-Martínez, F.; Li Puma, G. Modeling the photocatalytic mineralization in water of commercial formulation of estrogens 17-β estradiol (E2) and nomegestrol acetate in contraceptive pills in a solar powered compound arabolic collector. Molecules 2015, 20, 13354–13373. [Google Scholar] [CrossRef] [Green Version]
  30. Li Puma, G.; Puddu, V.; Tsang, H.K.; Gora, A.; Toepfer, B. Photocatalytic oxidation of multicomponent mixtures of estrogens (estrone (E1), 17β-estradiol (E2), 17α- ethynylestradiol (EE2) and estriol (E3)) under UVA and UVC radiation: Photonabsorption, quantum yields and rate constants independent of photon absorption. Appl. Catal. B Environ. 2010, 99, 388–397. [Google Scholar]
  31. Tada, H.; Suzuki, F.; Ito, S.; Akita, T.; Tanaka, K.; Kawahara, T.; Kobayashi, H. Au-Core/Pt-Shell Bimetallic Cluster-Loaded TiO2. 1. Adsorption of Organosulfur Compound. J. Phys. Chem. B 2002, 106, 8714–8720. [Google Scholar] [CrossRef]
  32. Xiong, P.; Hu, J. Decomposition of acetaminophen (Ace) using TiO2/UVA/LED system. Catal. Today 2017, 282, 48–56. [Google Scholar] [CrossRef]
  33. Korovin, E.; Selishchev, D.; Besov, A.; Kozlov, D. UV-LED TiO2 photocatalytic oxidation of acetone vapor: Effect of high frequency controlled periodic illumination. Appl. Catal. B Environ. 2015, 163, 143–149. [Google Scholar] [CrossRef]
  34. Sczechowski, J.G.; Koval, C.A.; Noble, R.D. Evidence of critical illumination and dark recovery times for increasing the photoefficiency of aqueous heterogeneous photocatalysis. J. Photochem. Photobiol. A Chem. 1993, 74, 273–278. [Google Scholar] [CrossRef]
  35. Tokode, O.; Prabhu, R.; Lawton, L.; Robertson, P. Controlled periodic illumination in semiconductor photocatalysis. J. Photochem. Photobiol. A Chem. 2016, 319–320, 96–106. [Google Scholar] [CrossRef] [Green Version]
  36. Helsel, D.R.; Hirsch, R.M. Statistical Methods in Water Resources; Elsevier: Amsterdam, The Netherlands, 1992. [Google Scholar]
  37. Liang, R.; Van Leeuwen, J.C.; Bragg, L.M.; Arlos, M.J.; Fong, L.C.L.C.; Schneider, O.M.; Jaciw-Zurakowsky, I.; Fattahi, A.; Rathod, S.; Peng, P.; et al. Utilizing UV-LED pulse width modulation on TiO2 advanced oxidation processes to enhance the decomposition efficiency of pharmaceutical micropollutants. Chem. Eng. J. 2019, 361, 439–449. [Google Scholar] [CrossRef]
  38. Crittenden, J.C.; Trussell, R.R.; Hand, D.W.; Howe, K.J.; Tchobanoglous, G. Adsorption. In MWH’s Water Treatment; John Wiley & Sons, Inc.: Hoboken, NJ, USA, 2012; pp. 1117–1262. [Google Scholar]
  39. Laera, G.; Jin, B.; Zhu, H.; Lopez, A. Photocatalytic activity of TiO2 nanofibers in simulated and real municipal effluents. Catal. Today 2011, 161, 147–152. [Google Scholar] [CrossRef]
Figure 1. Cumulative kinetic rates of PPCPs treated in various concentrations of methanol to study the effects of methanol as a carrier solvent.
Photochem 02 00035 g001
Figure 2. The cumulative kinetic rates of PPCPs treated under dual-frequency and continuous light at different pH.
Photochem 02 00035 g002
Figure 3. The kinetic rates of typical neutral (CBZ), negative (GFZ), and positive (NFLX) compounds under continuous UV light at various pH.
Photochem 02 00035 g003
Figure 4. Comparison of the kinetic rate constants for CBZ treated with various catalysts.
Photochem 02 00035 g004
Table 1. Summary of the compounds and standards studied.
CompoundAbbreviationUseDeuterated Standard
AtenololATENBeta-blockerAtenolol-d7 a
AtorvastatinATORLipid lowering Atorvastatin-d5 b
AtrazineATRZHerbicideAtrazine-d5 a
CarbamazepineCBZAnti-epilepticCarbamazepine-d5 a
Carbamazepine-10,11-epoxidee-CBZCarbamazepineCarbamazepine-10,11-epoxide-d10 a
DiclofenacDCFAnti-inflammatoryDiclofenac-d4 a
FluoxetineFLXAntidepressantFluoxetine-d5 a
GemfibrozilGFZLipid loweringGemfibrozil-d6 a
IbuprofenIBUAnti-inflammatoryIbuprofen-d3 a
NaproxenNPXAnti-inflammatoryNaproxen-d3 a
NorfluoxetineNFLXFluoxetineNorfluoxetine-d5 a
o-Hydroxy atorvastatino-ATORAtorvastatino-Hydroxyatorvastatin-d5 b
p-Hydroxy atorvastatinp-ATORAtorvastatinp-Hydroxyatorvastatin-d5 b
SulfamethoxazoleSULFAntibioticSulfamethoxazole-d4 a
TriclosanTCSAntimicrobialTriclosan-d3 a
TriclocarbanTCCBAntimicrobialTriclocarban-d4 a
TrimethoprimTRIMAntibioticTrimethoprim-d3 a
VenlafaxineVENAntidepressantVenlafaxine-d6 a
Note: a obtained from CDN Isotopes Inc. (Pointe-Claire, QC, Canada), b obtained from Toronto Research Chemicals (Toronto, ON, Canada).
Table 2. Physical properties of the compounds studied.
CompoundMolecular Weight (g/mol)Charge at pH 3 aCharge at pH 5 aCharge at pH 10 alogS at pH 3 alogS at pH 5 alogS at pH 10 a
ATEN266.341.001.000.320.430.43−1.41
ATOR558.64−0.05−0.83−1.00−7.03−6.28−1.36
ATRZ215.680.510.010.00−3.39−3.8−3.8
CBZ236.270.000.000.00−3.79−3.79−3.79
e-CBZ252.70.990.460.00−2.62−3.110
DCF296.15−0.09−0.91−1.00−4.26−3.250
FLX309.331.001.000.3900−3.86
GFZ250.33−0.04−0.79−1.00−3.29−2.630
IBU206.28−0.01−0.58−1.00−3.54−3.160
NPX230.60−0.06−0.87−1.00−3.42−2.580
NFLX295.301.001.000.3700−4.05
o-ATOR573.65−0.05−0.83−1.95−7.43−6.68−1.09
p-ATOR573.65−0.05−0.83−1.79−7.43−6.68−1.09
SULF253.280.08−0.06−1−2.16−2.170
TCS289.540.000.00−1.00−5.28−5.27−2.95
TCCB315.580.000.00−0.04−5.67−5.67−5.66
TRIM290.321.000.990.000−0.64−2.8
VEN277.401.001.000.0700−2.55
Note: a data obtained from chemicalize.org.
Publisher’s Note: MDPI stays neutral with regard to jurisdictional claims in published maps and institutional affiliations.

