Article

Local and Remote Conformational Switching in 2-Fluoro-4-Hydroxy Benzoic Acid

1
MTA-ELTE Lendület Laboratory Astrochemistry Research Group, Institute of Chemistry, ELTE Eötvös Loránd University, H-1518 Budapest, Hungary
2
Laboratory of Molecular Spectroscopy, Institute of Chemistry, ELTE Eötvös Loránd University, H-1518 Budapest, Hungary
*
Authors to whom correspondence should be addressed.
Photochem 2022, 2(1), 102-121; https://doi.org/10.3390/photochem2010009
Submission received: 23 December 2021 / Revised: 12 January 2022 / Accepted: 23 January 2022 / Published: 28 January 2022

Abstract

:
In this work, 2-F-4-OH benzoic acid was isolated in Ar matrices and conformational changes were induced by near-IR irradiating the sample. Upon deposition, three conformers could be observed in the matrix, denoted as A1, A2, and D1, respectively. A1 and A2 are trans carboxylic acids, i.e., there is an intramolecular H bond between the H and the carbonyl O atoms in the COOH group, whereas D1 is a cis carboxylic acid with an intramolecular H bond between the F atom and the H atom in the COOH group, which otherwise has the same structure as A1. The difference between A1 and A2 is in the orientation of the carbonyl O atom with regard to the F atom, i.e., whether they are on the opposite or on the same side of the molecule, respectively. All three conformers have their H atom in their 4-OH group, facing the opposite direction with regard to the F atom. The stretching overtones of the 4-OH and the carboxylic OH groups were selectively excited in the case of each conformer. Unlike A2, which did not show any response to irradiation, A1 could be converted to the higher energy form D1. The D1 conformer spontaneously converts back to A1 via tunneling; however, the conversion rate could be significantly increased by selectively exciting the OH vibrational overtones of D1. Quantum efficiencies have been determined for the ‘local’ or ‘remote’ excitations, i.e., when the carboxylic OH or the 4-OH group is excited in order to induce the rotamerization of the carboxylic OH group. Both ‘local’ and ‘remote’ conformational switching are induced by the same type of vibration, which allows for a direct comparison of how much energy is lost by energy dissipation during the two processes. The experimental findings indicate that the ‘local’ excitation is only marginally more efficient than the ‘remote’ one.

1. Introduction

To fully understand chemical reactions occurring in the environment, an investigation of the excited states of molecules and their relaxation is of the utmost importance. A vibrationally excited molecule may emit its excess energy via intra- or intermolecular processes. One example of the latter is when an excited molecule collides with a nearby one, transferring its excess energy in forms of vibrational, rotational, or translational energy. In contrast to this, during intramolecular vibrational energy transfer or intramolecular vibrational energy relaxation (IVR), the energy flows from one excited vibrational mode to another while the energy difference dissipates into the surroundings. This also means that in certain cases the excitation of a vibrational mode on one side of the molecule may result in a change in the geometry of a functional group on another, remote side of the molecule, called remote conformational switching.
The matrix isolation (MI) technique has been successfully used to study the conformational switching of molecules isolated in inert, nearly interaction-free matrices using mostly solidified noble or other inert gases (such as Ne, Ar, Kr, Xe, N2, etc.) as matrix material. The intermolecular relaxation of matrix-isolated molecules is greatly limited, thereby allowing for the examination of the IVR processes. Furthermore, another primary advantage of the technique is that the resulting IR spectrum contains sharp absorption peaks, meaning that they do not overlap; thus, the different conformers can be distinguished from each other, and the induced changes in their population can be monitored. It is important to note, however, that in order to achieve this vibrationally induced conformational change, selective excitation of the vibrational modes is required, which necessitates the use of monochromatic laser irradiation sources.
The MI technique combined with near-IR laser is routinely performed to excite the vibrational overtones of hydroxyl (–OH) functional groups, thus efficiently inducing their rotation or even the conformational change of the whole carboxylic (–C(O)OH) group. This has been successfully done in the case of many different carboxylic acid monomers in Ar matrices, such as formic, [1,2,3] acetic, [4,5,6] trifluoroacetic, [7] tribromoacetic, [8] propionic, [9] 2-chloropropionic, [10] glycolic, [11] pyruvic, [12], oxamic, [13] and various dicarboxylic acids [14,15,16] as well as amino acids [17,18,19,20,21,22]. Furthermore, the OH rotamerization induced by selectively exciting the OH vibrational stretching overtone of cyclic or heterocyclic organic acid conformers has also been studied in Ar matrices for squaric, [23] 2-furoic, [24] and 2-fluorobenzoic acid [25]. It should be noted that the works above studied short-range IVR, where the rotamerization of a functional group is achieved by the excitation of the vibrational overtone of that particular group.
Of greater interest are those cases when the excitation and the rotamerization occurs in different parts of the molecule. Compared to its short-range counterpart, far fewer matrix-isolation studies have been devoted to these long-range IVR processes. The first one was cysteine, which showed the rotamerization of the thiol (–SH) group upon exciting the νOH stretching overtone (νOH), although it occurred along with other conformational changes in the molecule, thus rendering it not a selective method [21]. Nevertheless, this work pointed to the feasibility of remote switching using molecular antennas. The next step was to find a molecular system representing the first example for selective conformational control. Accordingly, the rotamerization of the thiol group in 2-thiocytosine was found to be reversibly carried out by pumping the amino (–NH2) group [26]. The first remote switching using an NH group as a molecular antenna was done in the case of 6-methoxyindole, where the methoxy group could be selectively induced to rotate around the C–O bond [27]. Another molecule that greatly exemplifies this phenomenon is kojic acid, whose hydroxymethyl (–CH2OH) moiety goes through rotamerization upon exciting the –OH group on the other side of the ring of the molecule [28]. The OH or NH2 groups of 3-hydroxy-2-formyl-2H-azirine and 3-amino-2-formyl-2H-azirine, respectively, also serve as molecular antennas that facilitate conformational control over the heavy aldehyde moiety three bonds away [29]. The current ‘record holder’ system, investigated by matrix-isolation IR spectroscopy, is E-glutaconic acid, in which long-range IVR could act over eight covalent bonds to successfully induce the conformational change of an OH group [30].
In this work, we aimed to investigate the selective conformational switching of a matrix-isolated 2-fluoro-4-hydroxy derivative of benzoic acid (2-F-4-OH benzoic acid in short) achieved by narrowband near-IR laser irradiation. This molecule serves as a great example, in which both ‘local’ and ‘remote’ switching can be done by exciting the same type of vibration (i.e., OH overtone) selectively, and their efficiencies can be directly compared with each other. Preliminary experiments showed that upon the excitation of the 2νOH stretching vibrational overtone in a hydroxy carboxylic acid, change in the geometry of the COOH group in another part of the molecule can be efficiently induced [31]. In other words, higher energy cis carboxylic acid can be generated from the more stable trans form by remote switching (using the notation of Pettersson et al. for the two types of carboxylic acids) [1]. Moreover, the cis isomer is assumed to slowly convert back to trans over time via tunneling, which can also be monitored by IR spectrometry. The experiments were supplemented by quantum-chemical computations, which made the spectral analysis easier by allowing for simple comparison between the simulated spectra and the experimental ones. It is important to emphasize that effective remote switching that acts over multiple bonds has been observed in only a handful of molecular systems. As such, in order to fully understand its mechanism, it is necessary to find more examples of this phenomenon and study its overall efficiency.

2. Experimental Methods

2.1. MI-IR Experiments

A commercial 2-F-4-OH benzoic acid (≤100%) sample obtained from Sigma-Aldrich was used without further purification. The compound was inserted into a Knudsen cell with a heatable cartridge in a small quartz sample holder directly connected to the vacuum chamber. The adsorbed water and other volatiles had been removed the day before the experiments by slightly heating the sample compartment to 355 K and keeping it at that temperature for a couple of hours. A closed-cycle helium refrigeration system (Janis CCS-350R cold head cooled by a CTI Cryogenics 22 refrigerator) was used to cool down the CsI optical window to 13 K, which serves as the deposition temperature. The temperature of the cold window was measured by a silicon diode sensor connected to a LakeShore 321 digital temperature controller; the base pressure in the cooled chamber is usually found in the high 10−9 mbar region. A sample sublimation temperature of 375 ± 2 K was used during the experiment whereupon the vapors were mixed and co-deposited in a 1:1000 ratio with Ar (Messer, 99.9999%) on the window. The orientation of the window (at a relative angle of 45° with regard to the sample oven and the spectrometer beam) allows for a simultaneous deposition and spectral collection. For the latter, a Bruker IFS 55 FT-IR spectrometer equipped with an MCT detector cooled with liquid nitrogen was used. The transmission mid-IR spectra were taken during and after the deposition by averaging 16 and 128 scans, respectively, in the 2000–600 cm−1 region with 1 cm−1 resolution using KBr as a beam splitter and a low-pass filter with a cutoff wavenumber of 1830 cm−1. In order to define the 2ν(OH) stretching overtones of each conformer necessary for the laser irradiation experiments, preliminary near-IR spectra were collected with the same instrument, without the cutoff filter, utilizing a W lamp and a CaF2 beam splitter in the spectral region of the 8000–2500 cm−1 region at a resolution of 1 cm−1.

2.2. Near-IR Laser Irradiation

The deposited matrices were in situ irradiated through the outer KBr window of the cryostat, applying a tunable narrowband laser light provided by the idler beam of an Optical Parametric Oscillator (OPO; GWU/Spectra-Physics VersaScan MB 240, fwhm ≈ 5 cm−1). The OPO was pumped by a pulsed Nd:YAG laser (Spectra-Physics Quanta Ray Lab 150, p ≈ 2.1–2.2 W, λ = 355 nm, f = 10 Hz, duration = 2–3 ns). The laser coming from the OPO device is perpendicular to the beam of the IR spectrometer, whereas the CsI cold window has a relative angle of 45° to both of them, allowing for an online spectral collection during laser irradiation. The wavelength of the laser beam was selected so that the 2νOH modes of the conformers of the matrix-isolated molecule were selectively excited. Accordingly, the sample was irradiated at 6952.0 cm−1, 6994.9 cm−1, 7077.1 cm−1, and at 7093.2 cm−1 for approximately 60 min in each case; the photon fluxes were measured to be (3.1 ± 0.6) × 1017 cm−2 s−1 (6952.0 cm−1), (3.2 ± 0.1) × 1017 cm−2 s−1 (6994.9 cm−1), (3.3 ± 0.1) × 1017 cm−2 s−1 (7077.1 cm−1), and (3.6 ± 0.1) × 1017 cm−2 s−1 (7093.2 cm−1), respectively. Mid-IR spectra were collected online in the meantime, averaging 16 scans (during the 6952.0 cm−1 irradiation) and 12 scans (during the rest of the irradiations), respectively; 128 scans were taken before and after irradiation. After the irradiation experiments, the sample was left in the dark overnight while continuously collecting mid-IR spectra, averaging 128 scans every 15 min.

2.3. Theoretical Computations

The quantum chemical geometry optimizations, as well as the harmonic and anharmonic frequency computations, were carried out in Gaussian 09 (Rev. D01) with Becke’s three-parameter hybrid functional B3LYP, using the non-local and local exchange correlation functionals as described by Lee–Yang–Parr and Vosko–Wilk–Nusair III, respectively [32,33,34,35]. Dunning’s correlation-consistent cc-pVTZ basis set was used [36]. The anharmonic frequencies were used to simulate the vibrational spectra by convoluting them with Lorentzian functions with an FWHM of 0.5 cm−1 in the Synspec software [37]. The isomerization barriers were estimated from the optimized transition states (TSs) using the Berny algorithm, as implemented in Gaussian [38]. This was followed by the computation of intrinsic reaction paths (IRPs) in the Cartesian coordinates [39]. The tunneling rates were estimated using the Wentzel–Kramers–Brillouin (WKB) model described in detail elsewhere [40].

3. Results and Discussion

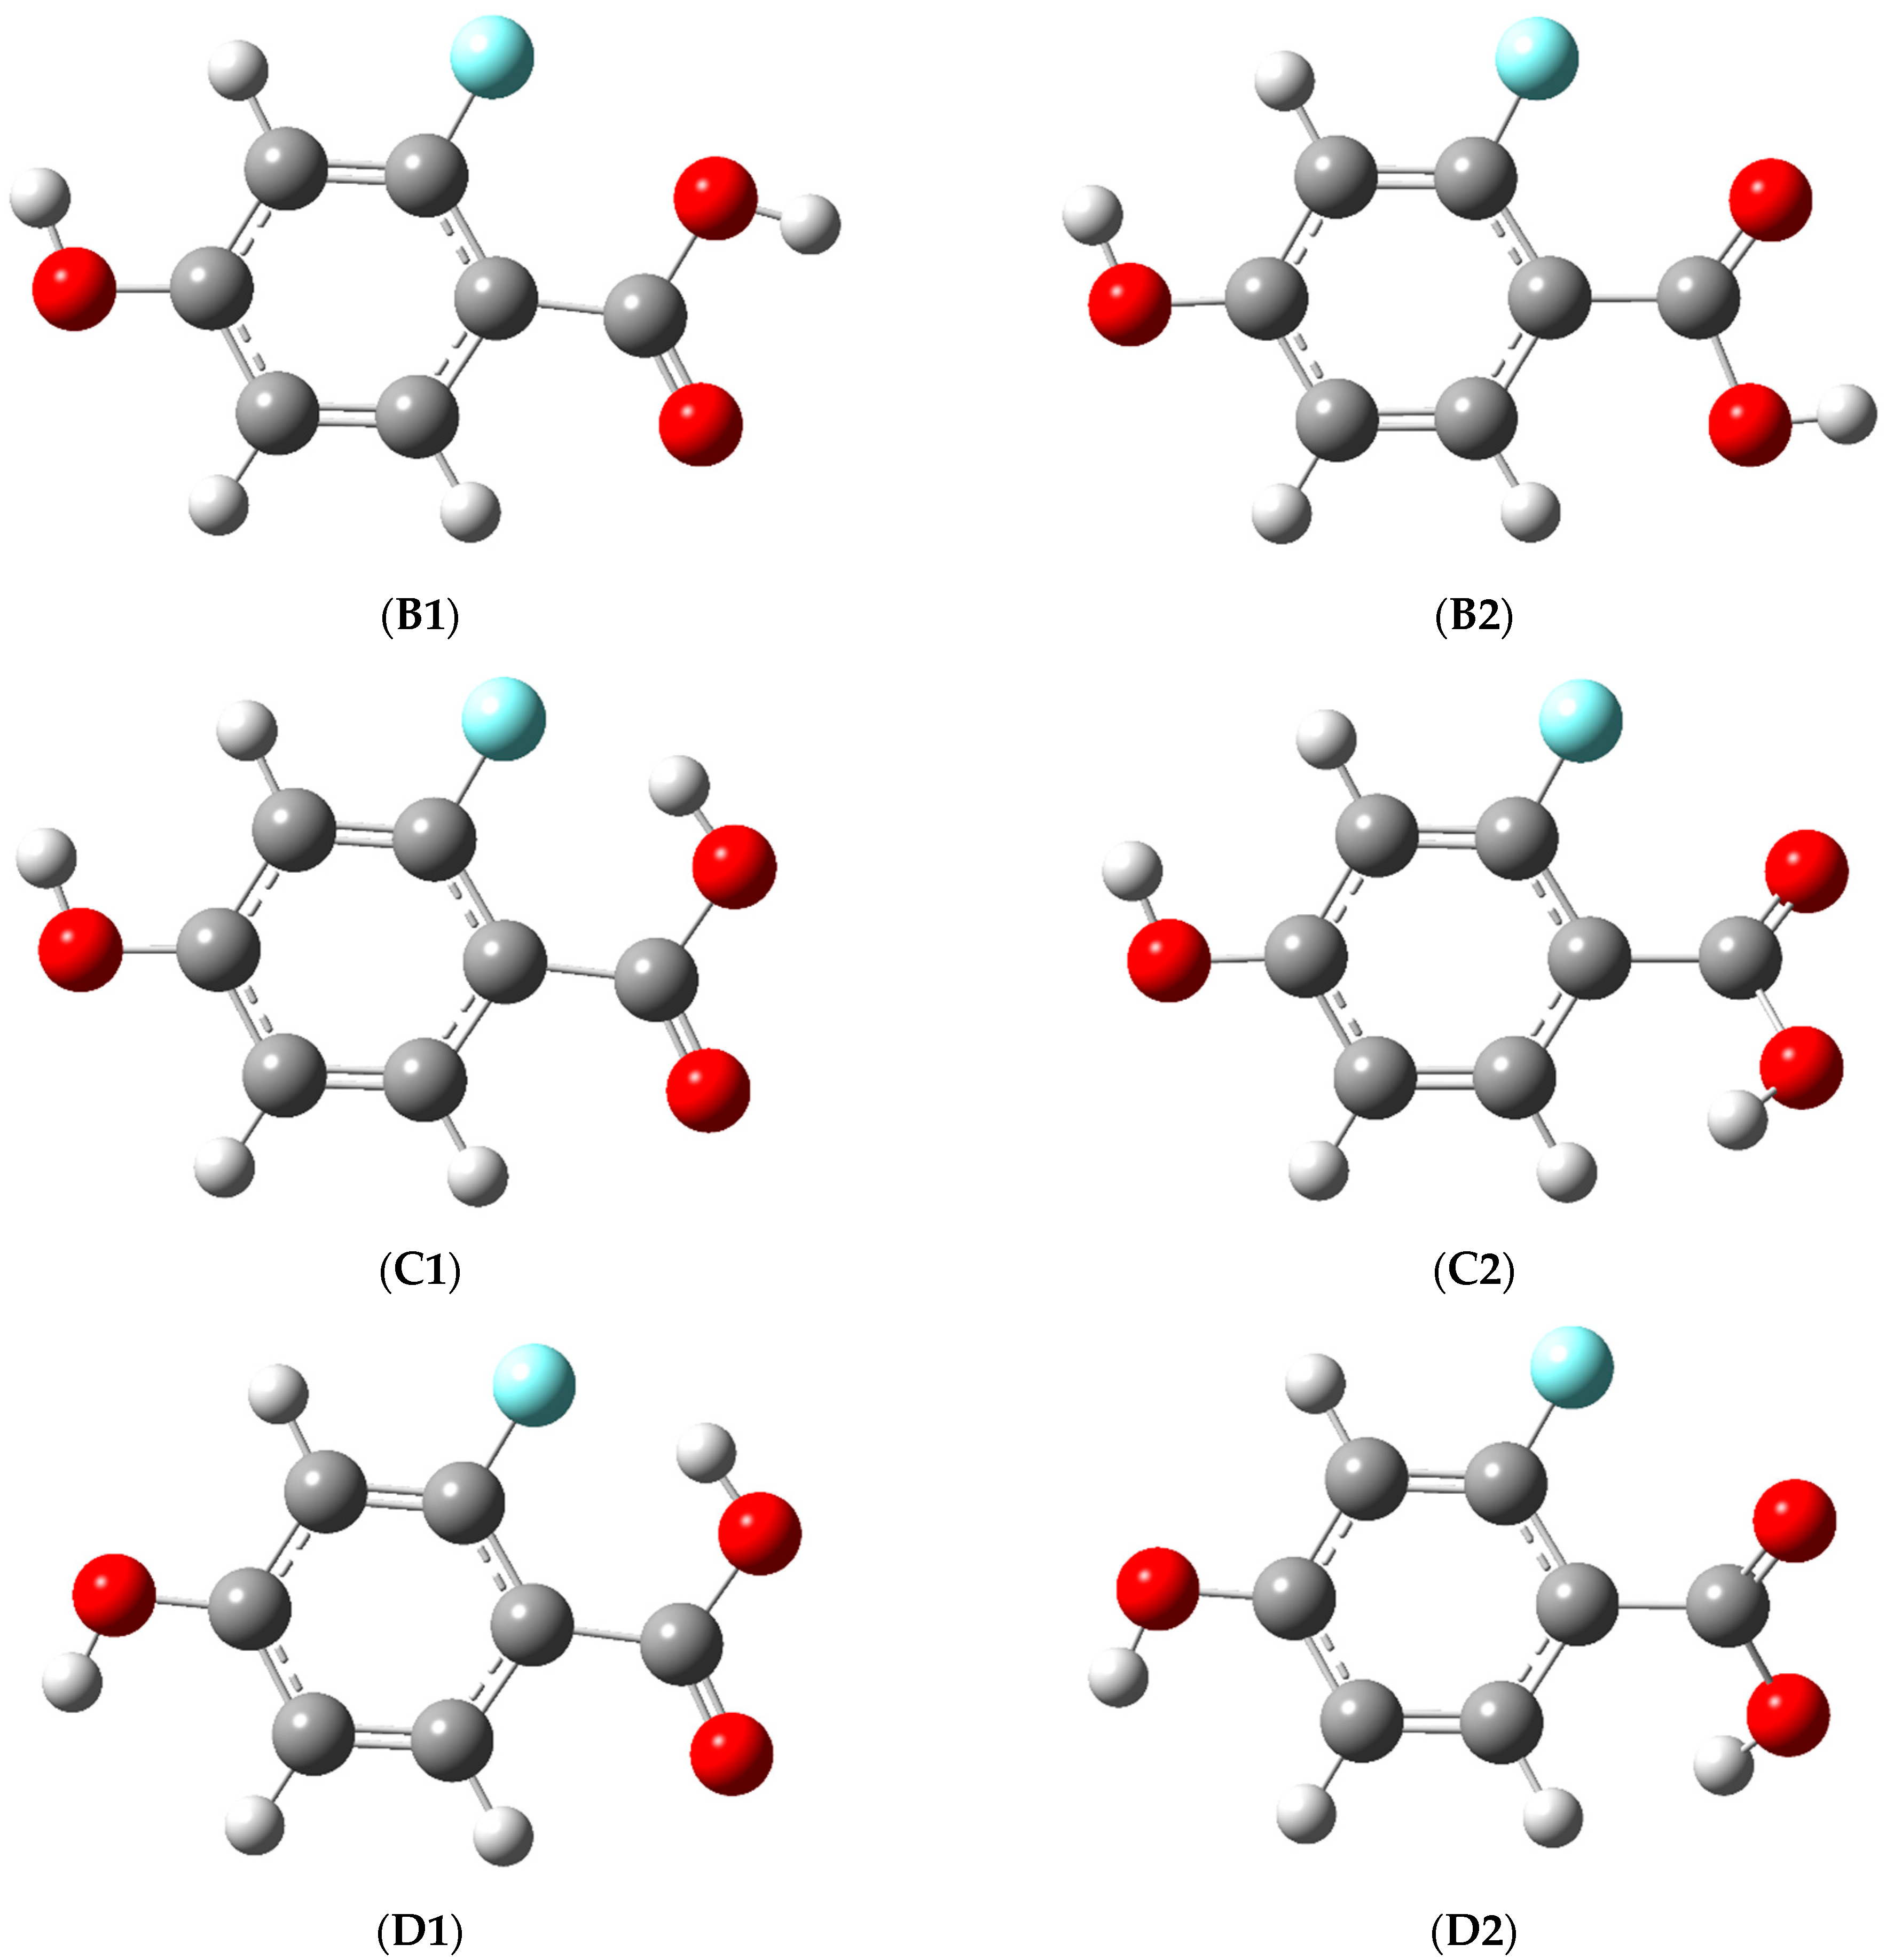
3.1. Structure and Energy of the Conformers

The conformational structure of the molecule is primarily defined by its two functional groups, the 4-hydroxyl (–OH) and the carboxylic group (–COOH). The H atom on both moieties may have two orientations (the respective torsional angles are denoted by φ1 and φ3), whereas –COOH has two forms based on the alignment of its carbonyl (C=O) group (φ2). This means 23 = 8 different conformers, which are depicted in Scheme 1, in which the torsional angles most important to the molecular structure are also marked. The conformers with φ3 close to 180° are named A (φ1 ≈ 180°) or B (φ1 ≈ 0°), respectively. The same applies to structures C and D, which can have a φ3 value of 0° with φ1 ≈ 0° or 180°, respectively, whereas the labels 1 or 2 after them differentiate the ones with φ2 ≈ 180° and 0°, respectively. This means that the following notations for the eight conformers are used throughout the manuscript: A1, A2, B1, B2, C1, C2, D1 and D2; their optimized geometries are listed Tables S1–S20 in the Supplementary Material.
According to the orientation of the groups discussed above, the conformers have different stabilities. The most stable conformer is A1, which is closely followed by B1; the only difference between them is the alignment of the 4-OH group. Apart from this, they both have a trans-COOH carboxylic group (i.e., there is a weak intramolecular H bond between the H atom of the OH group with the C=O oxygen atom), whereas the O atom in the C=O group is on the opposite side with regard to the F atom. It should be noted that the energy difference is predicted to be 0.8 kJ mol−1, which is within the accuracy of the computational level. The next pair of conformers have slightly higher relative energies (by ca. 3 kJ mol−1) denoted with A2 and B2. They, similarly to A1 and B1, only differ from each other in the orientation of the 4-OH hydrogen atom as well, but, unlike A1 and B1, their C=O oxygen atoms are on the same side as the F atom. The next four conformers have cis-COOH groups, meaning inherently higher relative energies due to breakage of the abovementioned intramolecular H bond, which is counterbalanced to some extent in the case of the C1 and D1 by the formation of a less energetic H bond with the F atom. Their relative energy (with regard to the A1 form) is approximately 8 kJ mol−1; this value should more or less reflect on the difference of the H atom bond strength between the cases when the H atom creates the bond with the C=O oxygen and when it bonds with the F atom. Nevertheless, C1 and D1 only differ in the orientation of the 4-OH hydrogen atom, whereas their C=O oxygen atoms (similarly to A1 and B1) are on the opposite side of the molecule with regard to the F atom, thus allowing for H bonding between the carboxylic H atom and the F atom. Lastly, C2 and D2 are unique in the sense that, due to steric effects, their –COOH group is not in the same plane as the aromatic ring, which means that the φ2 torsional angle is closer to 30° instead of 0° and can be both positive and negative (i.e., the C=O oxygen atom and the carboxylic OH group are slightly above or below the plane of the aromatic ring). This results in the fact that both C2 and D2 are actually chiral and have two enantiomeric forms differentiated by an asterisk in Table 1 (i.e., C2, C2*, D2, D2*), and the only difference between C2 and D2 is the orientation of the 4-OH group. Apart from this, their C=O oxygen atoms, similarly to A2 and B2, is on the same side of the molecule with regard to the F atom and have cis-COOH groups (similarly to C1 and D1). As a matter of fact, this causes distortion of the molecule as the COOH hydrogen atom becomes relatively close to the H atom on the C atom in position six of the ring. Due to the unfavorable effects listed above, there is no intramolecular H bond in them, and therefore, they are much less stable than the other conformers; their relative energy lies more than 30 kJ mol−1 above the most stable A1 form. This also implies that their Boltzmann population at the sample inlet temperature (375 ± 2 K) is expected to be significantly less than 1%, which prohibits their IR detection in the deposited matrix.
The relative energies of the TSs, along with their optimized geometries, are summarized in Tables S21–S49 in the Supplementary Material. Based on the values listed there, the rotation of the 4-OH group along the φ1 torsional angle has a barrier of approximately 20 kJ mol−1 (A1↔B1, A2↔B2, C1↔D1, C2↔D2), and the same holds true for the rotation along φ2 in the case of A1↔A2 and B1↔B2, but not for C1↔C2 and D1↔D2 where the barriers of the ‘rightward’ direction (C1C2 and D1D2, ≈30 kJ mol−1) are much higher than those in the reverse one (C1C2, D1D2, <10 kJ mol−1) due to the energy difference of the minima A1, B1 and A2, B2, respectively. Unsurprisingly, the barrier of the rotation around φ3 is the highest one with values lying between 40–50 kJ mol−1 (A1↔D1, B1↔C1), except if one of the conformers is much more stable than the other one. In these cases (A2↔D2, B2↔C2), the barrier heights are about 50 and 20 kJ mol−1, respectively, depending on the direction of the transition. It should be noted that all the rotations around the three torsional angles may go either clockwise or counterclockwise, but the TSs produced by the two different rotational directions are mirror images of each other and, therefore, have identical energy and vibrational spectra. It is also worth mentioning that the TSs between the enantiomers C2↔C2* and D2↔D2* have a planar structure, and their energy is only slightly above the minima (≈5 kJ mol−1, approximately 400 in cm−1), which allows for their rapid interconversion upon exposure to the spectrometer beam source.

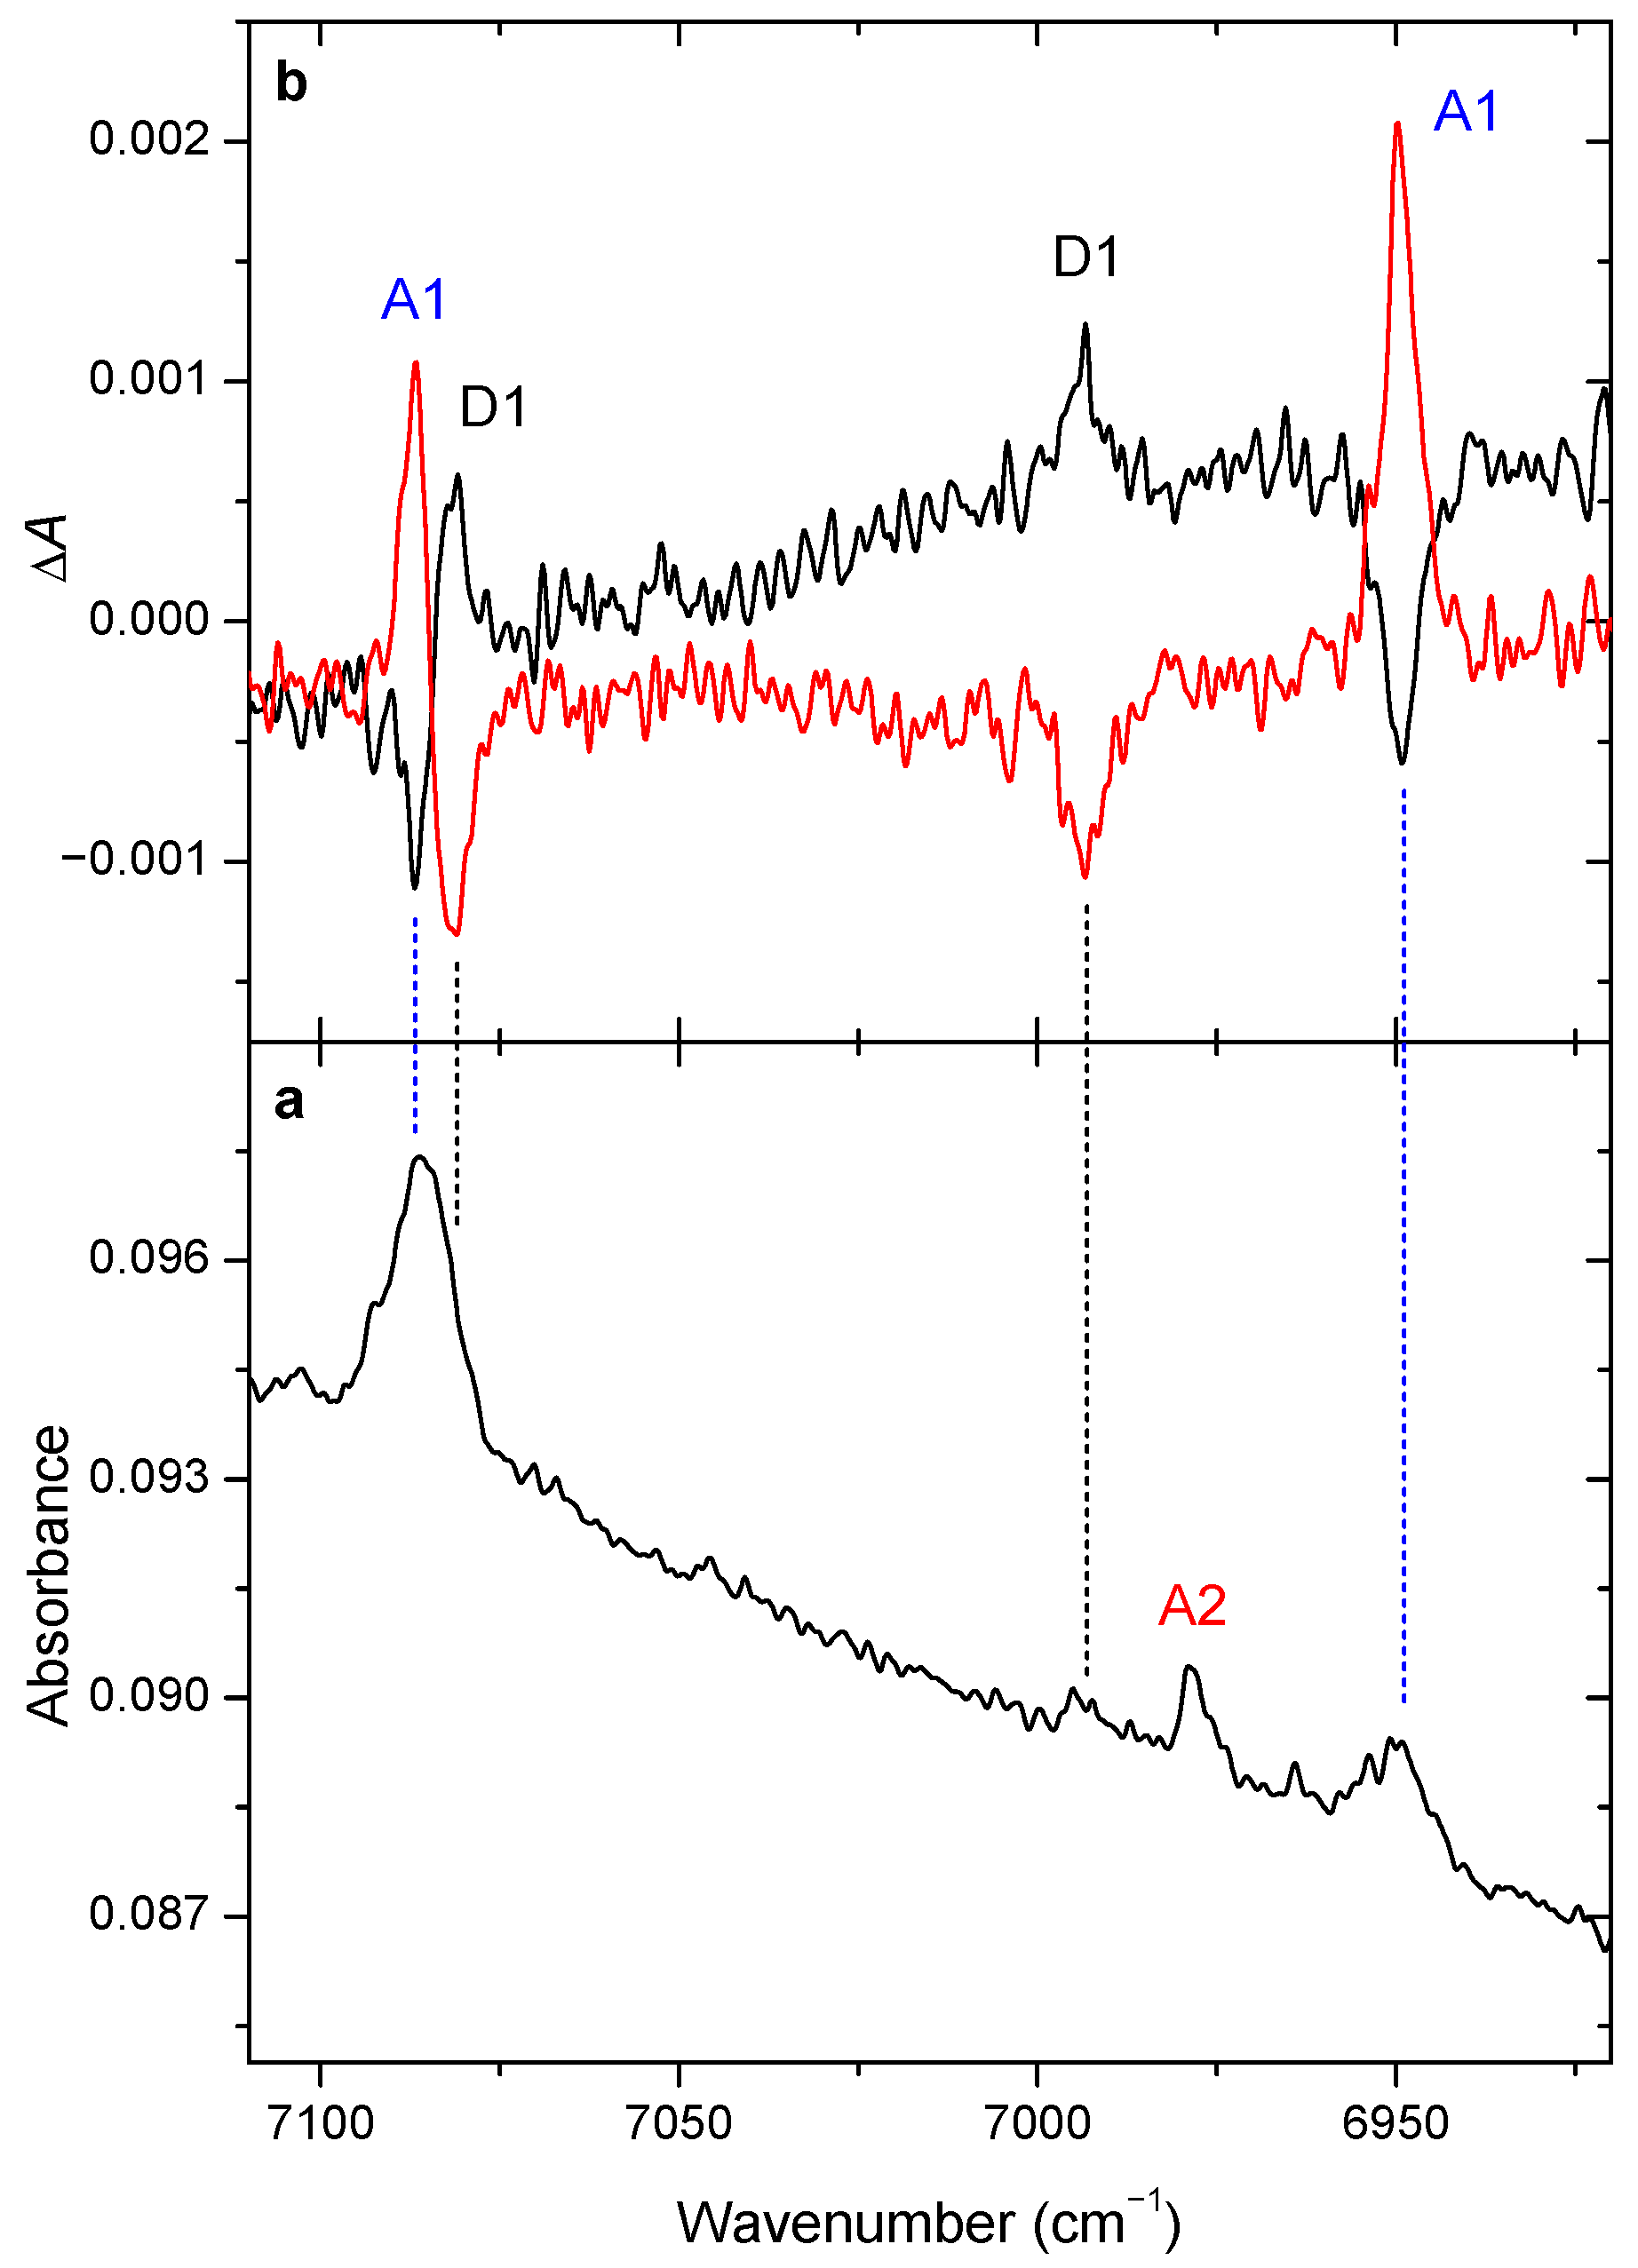
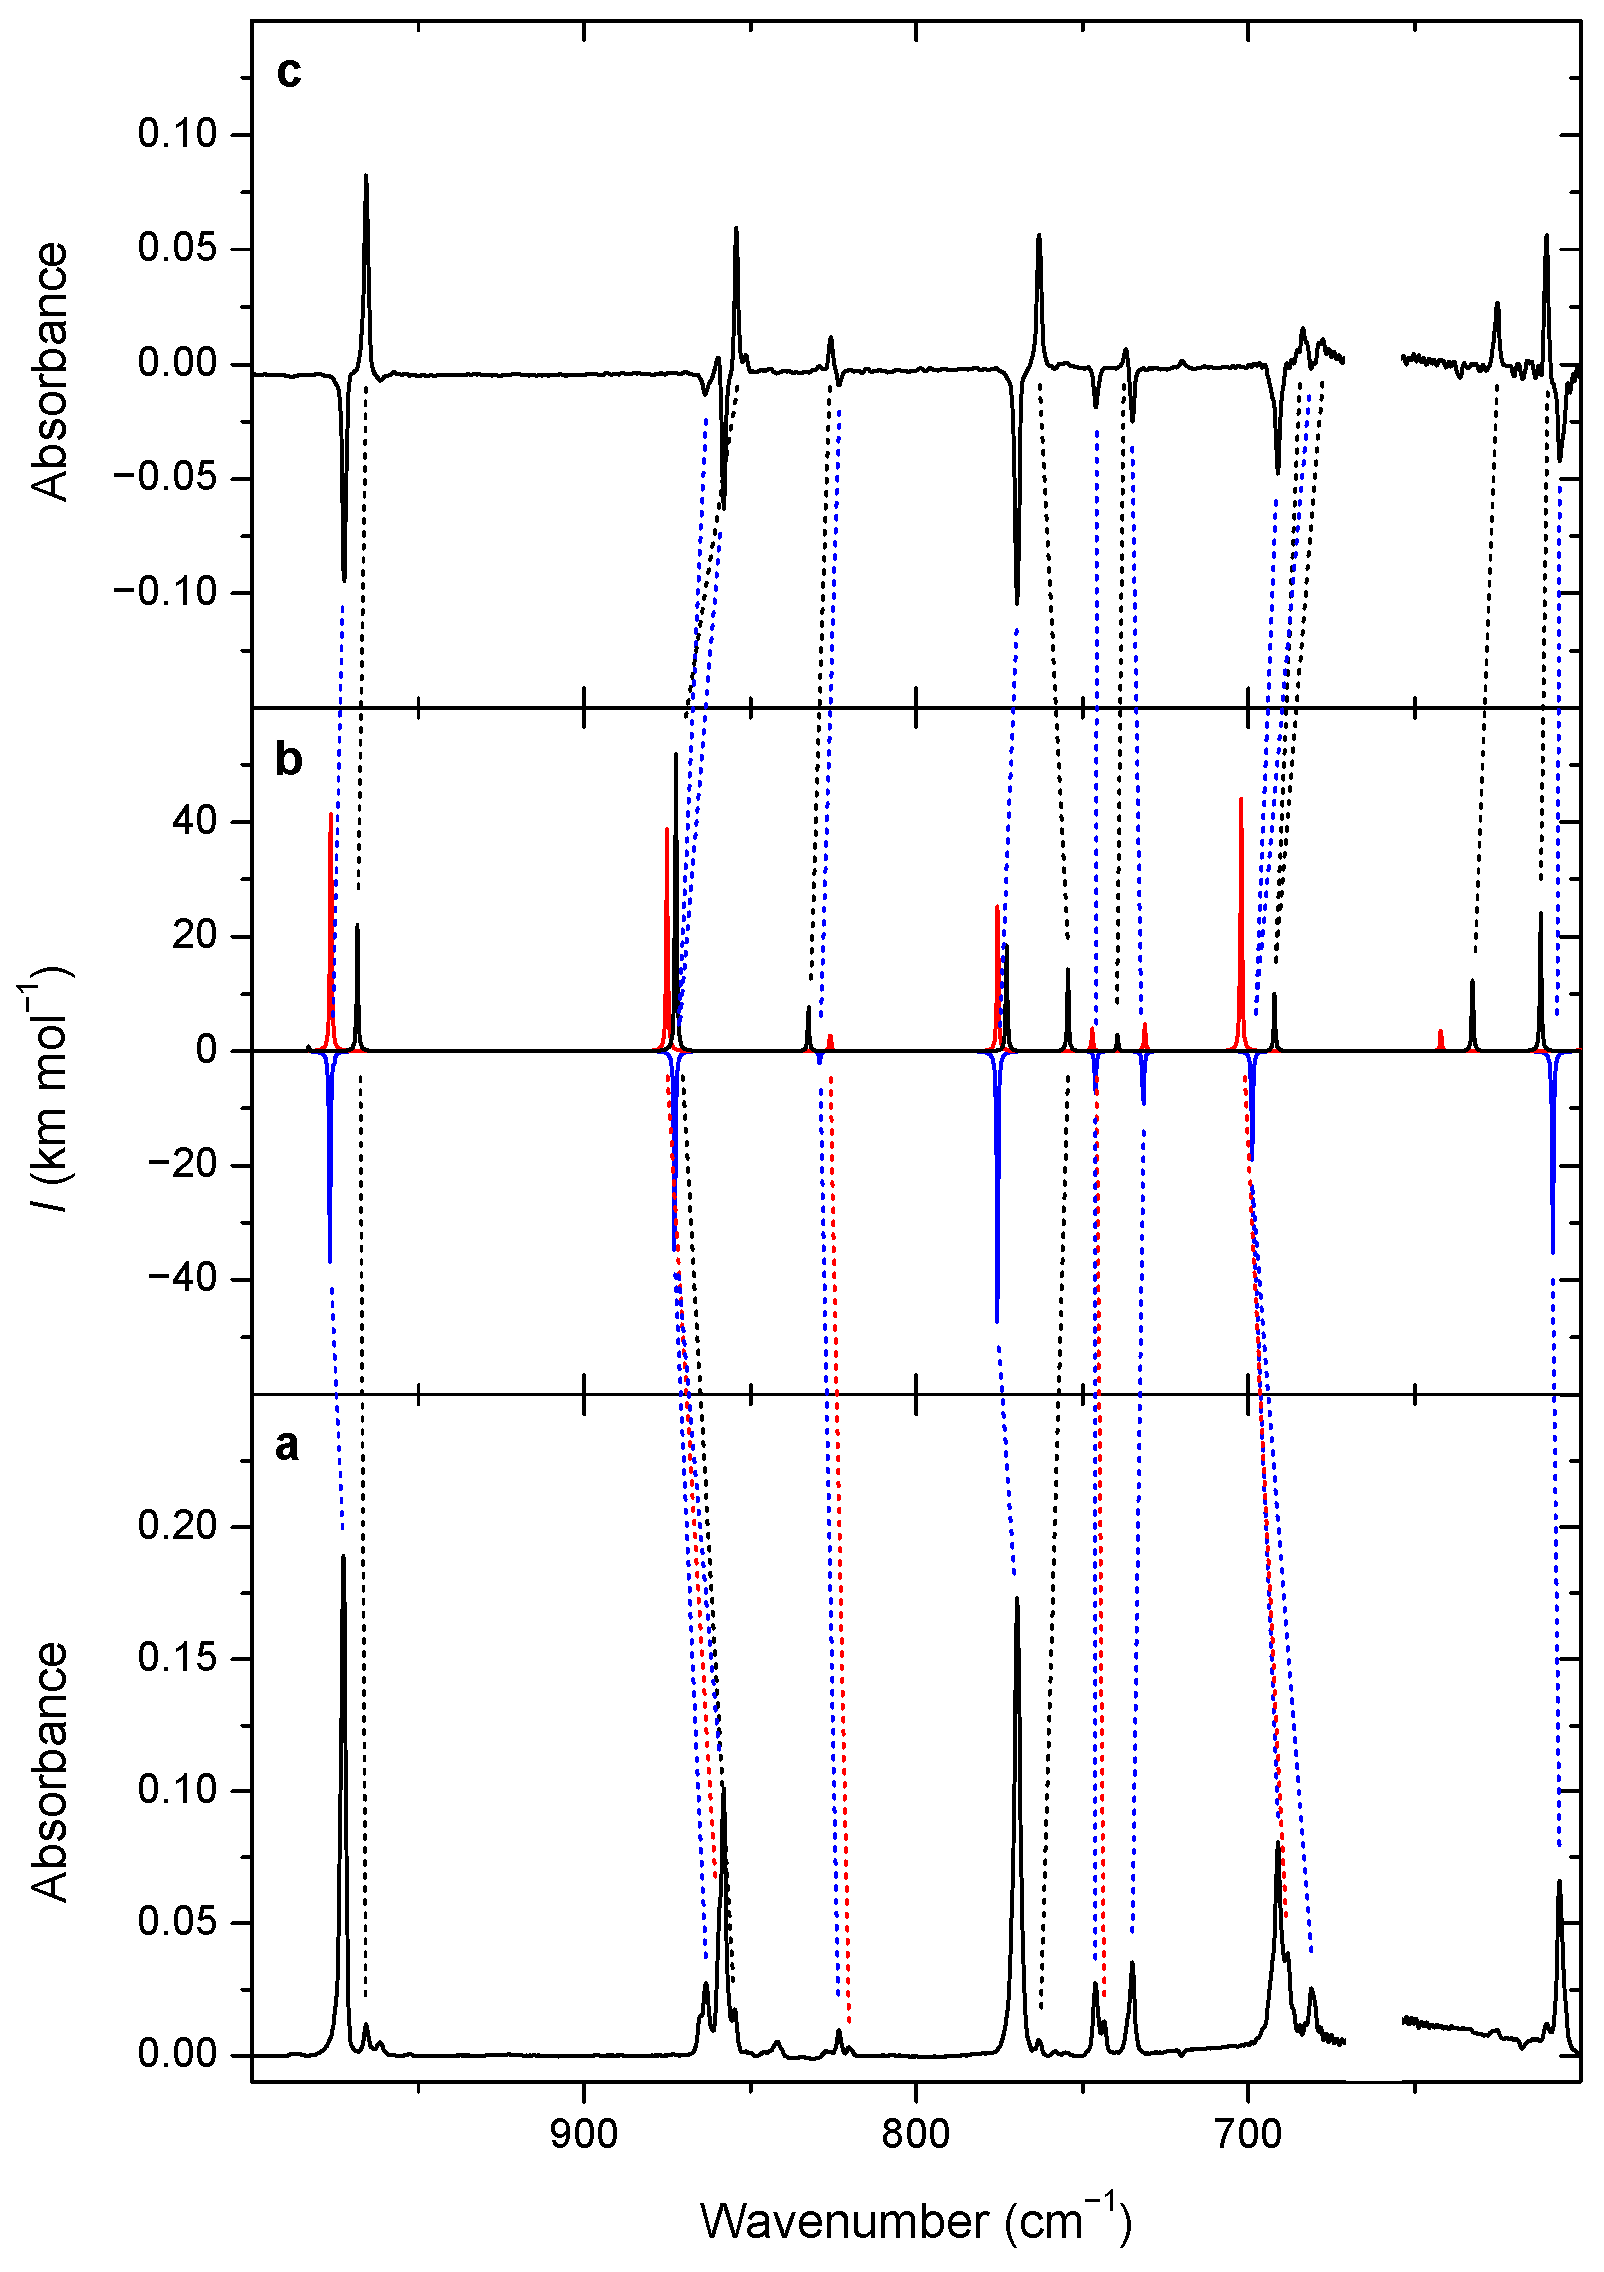
3.2. Changes upon Near-IR Irradiation, Vibrational Analysis

Some selected regions of the near- and mid-IR spectra of the sample molecule deposited in an Ar matrix are visualized in Figure 1a, Figure 2a, Figure 3a and Figure 4a. Furthermore, by having a look at the mid-IR spectra in Figure 1b, Figure 2c, Figure 3c and Figure 4c, one can see that irradiating some 2νOH stretching overtone bands results in a selective conformational switch. The spectral features can be divided into three different groups based on their general behavior upon irradiation: (a) the ones that increase, (b) the ones that decrease, and (c) the ones that do not change, which should belong to three different conformers or groups of conformers. One should also bear in mind that the enantiomers C2, C2* and D2, D2* cannot be differentiated by their IR spectrum. Furthermore, based on theoretical results, the conformers that differ only in the orientation of their 4-OH groups have almost identical vibrational frequencies; thus, they cannot be distinguished either (Tables S11–S20). This leads us to the conclusion that only four band groups should be detected in the matrix belonging to the conformer pairs (1) A1/B1, (2) A2/B2, (3) C1/D1, and (4) C2/D2 (or C2*/D2*). However, as mentioned above, only three groups of bands could be distinguished based on their response to laser irradiation. As such, the conformer pairs with the highest energy (i.e., group (4)) could be excluded based on the following considerations: First, they are 30 kJ mol−1 above the most stable members of group (1), meaning that their Boltzmann population at the deposition temperature is expected to be 0.003%. For comparison, the values for the other groups are 72% for group (1), 23% for group (2), and 5% for group (3). It is important to note that the abundance of conformer groups in the freshly deposited matrix is very similar to these theoretically obtained ones and can be determined to be 61% for group (1), 33% for group (2), and 6% for group (3). Consequently, group (4) is not expected in the freshly deposited matrix. Secondly, no new bands arise during any of the near-IR excitation (only the relative intensities of the bands that are already present change), suggesting that members of this group are not generated upon irradiation. Furthermore, it can be assumed that only the most stable members of each of the three groups (i.e., A1, A2, and D1) are expected to be present in the matrix, since the higher energy members can be converted to them via tunneling. This hypothesis will be justified in Section 3.5 where an estimate on the tunneling rates are given.
The bands belonging to A1 all decrease when its 2ν(OH) stretching overtone bands, found at 6952.0 cm−1 and 7077.1 cm−1, are excited. This occurs with the simultaneous increase in the bands belonging to D1, i.e., the A1→D1 conversion is induced. Similarly, when the matrix is irradiated at 6994.9 cm−1 and at 7093.2 cm−1, the opposite can be observed, i.e., the D1→A1 conversion; therefore these bands must belong to the 2ν(OH) stretching overtones of the former conformer. It is important to note the findings described above show that no matter which OH group is actually excited (i.e., the 4-OH or the carboxylic one), all near-IR irradiation results in the same rotamerization process, which is the cistrans rotamerization of the carboxylic moiety. As a consequence, the irradiation of the carboxylic OH group (6952.0 cm−1 for A1 and 6994.9 cm−1 for D1) will be called ‘local’ excitation, whereas that of the 4-OH group (7077.1 cm−1 for A1 and 7093.2 cm−1 for D1) will be called ‘remote’ excitation hereafter.
In contrast to the results discussed above, the bands of A2 are not affected by any of the irradiations, even if an excitation wavelength of 6978.8 cm−1 is used, which is the frequency of its local carboxylic 2ν(OH) stretching overtone. Accordingly, Table 2 sums up the general response of these three conformers to the excitation of various O–H stretching overtone bands. The different response to near-IR laser irradiation, accompanied by a comparison of the experimental and theoretical spectra, allows for assignment of the vibrational bands; Table 3, Table 4 and Table 5 lists their spectral assignment for part of the mid-IR spectral range.

3.3. Kinetics of the Near-IR Induced Rotamerization, Quantum Efficiencies

The temporal evolution of the spectrum can be monitored throughout the near-IR irradiation, which provides us with a quantitative means of obtaining the conversion rate. The kinetic curves are plotted in Figure 5 for the 1742.5 and 1628.2 cm−1 bands for conformers A1 and D1, respectively. A single exponential function was used to fit the decay profiles:
At(X, ) = At=0(X, )ekt + At=∞(X, )
where At(X, ) is the integrated area (in cm−1) of the band of conformer X with a vibrational frequency of (X = A1 or D1; = 1742.5 cm−1 if X = A1 and = 1628.2 cm−1 if X = D1), t is time passed since the beginning of the irradiation (in sec), and k is the pseudo-first order rate constant (in s−1).
The following equation could be used to fit the growth profiles:
At(X, ) = At=∞(X, )(1–ekt)
Moreover, the quantum efficiencies can be estimated using the formula given below [3,6,41]
Φ(i) = k()/σi()I()
where Φ(i) is the quantum yield of the process when exciting the ith vibrational mode at the overtone wavenumber ; k() is the rotamerization rate in s−1, whereas σi() is the absorption cross-section of that particular vibrational mode in cm2; and I() is the average photon intensity of the laser beam at that wavelength in cm2 s−1. We can obtain σi() in cm2 when the absorbance of the excited overtone band (A, dimensionless value) is divided by the calculated column density of the decaying conformer at the beginning of irradiation (N, in cm−2). Furthermore, the latter can be deduced from the integrated peak area of one absorption band of the conformer (Aint, in cm) and by knowing the absorption coefficient (α, in cm) and the area of irradiation (S = 1 cm2), respectively:
N = ln(10) AintS
Even though α is not known for our system, a rough estimate can be given based on the computed anharmonic IR intensities (Table 3 and Table 4). In order to determine N, the strong and well-resolved ν(C=O) stretching vibrational modes were used. Moreover, I() can be obtained if the output power of the produced near-IR laser light (P, in W) is divided by the photon energy (Ephoton, in J) times the surface area S. It should be noted that P was measured without the KBr window in the beam path; thus, P and I() both represent an upper estimate, which also means that the quantum efficiencies deduced here are lower estimates. Table 6 lists all the derived values.
As an alternative approach, Φ(i) can also be estimated as follows:
Φ(i) = Niso/Nabs
where Niso denotes the number of molecules converted, and Nabs is equal to the number of photons absorbed per time unit (both in s−1).
Niso = k()NS
Nabs = (1 – 10 − A)I()S
The averaged value Φ(i)average varies between 1.4 × 10⁻¹ and 7 × 10⁻² (Table 6), which agree well with, for instance, those of the formic acid (1.7 × 10⁻¹, 7 × 10⁻²) [3], acetic acid (2.2 × 10⁻²) [6], and propionic acid (1.4 × 10⁻²) [41], respectively, but they are significantly higher than those of amino acids, such as glycine (8 × 10⁻⁴) [18] and alanine (5 × 10⁻⁴ and 1 × 10⁻³), respectively [19]. It is also worth noting that the relative uncertainty of Φ(i)average is found to be around 30–40%, which is also in agreement with previous findings [6,41]. By having a look at the Φ(i)average values belonging to the different excitation frequencies, it can be deduced that those of the ‘local’ processes do not differ significantly from each other. Furthermore, the Φ(i)average values of the ‘remote’ processes are comparable to the ‘local’ ones, which is somewhat unexpected, since it would be straightforward to think that energy dissipation is not negligible when exciting a distant functional group that results in lower efficiencies for the ‘remote’ excitations. Nevertheless, this does not necessarily hold true because, for instance, thioacetamide, which also shows a remote molecular switching property upon near-IR irradiation, has Φ(i)average values of 3.7 × 10⁻² to 7.2 × 10⁻² [42]; these are not significantly lower than the quantum efficiencies listed above. It has to be kept in mind, however, that the IVR process in thioacetamide acts through only four bonds instead of the eight in 2-F-4-OH benzoic acid, thus the current findings might still be surprising. A possible explanation for the minor difference between the quantum efficiencies of the ‘local’ and ‘remote’ excitations might be the rapid redistribution of the vibrational energy within the molecule, which has a much higher rate than that of the energy dissipation into the surrounding matrix. In this case, the latter would be the one that determines the overall efficiency, i.e., it would matter less which vibrational mode of the molecule is actually excited.

3.4. Tunneling Decay Kinetics

After the irradiation experiments, the matrix was irradiated once more with the 6952.0 cm−1 laser light to bleach conformer A1 and generate as much D1 as possible. Then, the sample was left in the dark overnight while continuously collecting the mid-IR spectra. Furthermore, it is important to recall that a low-pass filter with a cutoff wavelength of 1830 cm−1 was installed between the spectrometer and the sample during the experiment. This was done in order to prevent the processes induced by the broadband IR light originating from the spectrometer beam source, which is known to facilitate unwanted rotamerization processes [43,44,45]. It should be noted that the photon energy at the filter cutoff wavelength is 21.9 kJ mol−1, which is significantly below the A1←D1 rotamerization barrier (36.7 kJ mol−1, Table S49). However, this cutoff energy is comparable to, or even higher than, the barrier of processes involving the change of other torsional angles. For instance, the 4-OH group almost rotates freely around, and the rotation of the carboxylic group should also be made possible upon exposure to the IR beam. It is also important to note that the 36.7 kJ mol−1 barrier (which equals 3068 cm−1) should be easily overcome without the presence of the filter by exciting the vibrational modes above this threshold, such as the O–H stretching vibrations; this finding justifies the use of the filter.
Figure 6 shows the kinetic growth/decay of conformers A1 and D1, respectively, when the already irradiated matrix was left in the dark overnight. To fit the experimental data, the same single exponential functions defined by equations E1 and E2 were used as in Section 3.3. The k values, as expected, are significantly (by roughly 2 orders of magnitude) lower than those obtained for the vibrationally induced processes and have a fair agreement with each other. The half-life of D1 was found to be around 115,000 ± 4000 s, which is some 32 h. It is interesting to note, however, that the second-order exponentials could also be fitted on these data providing a somewhat improved fit. The same holds true for the irradiation-induced processes, in most cases. This finding implies that there may be matrix sites with different vibrationally induced rotamerization and tunneling rates; thus, they can be classified as ‘slow’ and ‘fast’, which is a phenomenon that has been previously described [10,23,46].

3.5. Estimating the Tunneling Half-Life

The tunneling rates of the various feasible pathways can be estimated based on computational considerations, which can be used to interpret the experimental findings. The intrinsic reaction paths can be obtained after running IRC computations in Gaussian, which allows for estimation of the width and the height of the barriers that fundamentally determine the tunneling half-lives of the processes. Figures S1–S4 show the computed IRC profiles between the isomers, which also contain the barrier heights and widths used in the calculations. The WKB method mentioned in Section 2.3 was used to predict the tunneling rates using the equation below:
P ( E ) = e π 2 w 2 m ( V 0 E ) / h
where P(E) is the probability of the tunneling process, m stands for the particle mass (1.68 × 10⁻²⁷ kg for H), V0 is the barrier height, E is the particle energy (both in J), h is Planck’s constant, and w is the barrier width (in m). The tunneling rate k (in s–1) can be obtained by multiplying P(E) by the frequency of attempts (n, in s–1), which in the latter can be estimated using the anharmonic frequency of the vibrational mode that takes place in the process (, in m–1) by means of the formula ν = ṽc, where c is the speed of light (299,792,458 m s–1). The half-life t1/2 (in s–1) can be derived from k using the equation t1/2 = ln2/k. It is important to note that, due to the inherent uncertainty of the computational results, it is not extraordinary to have a difference of orders of magnitude between the computational and experimental values. What really matters is how the calculated values compare to each other, and this is why the theoretically obtained values can be scaled up with a uniform factor, so that they will be equal to their experimental counterparts [47]. Here, only the D1A1 process that can be observed, so the theoretical value was multiplied by a scaling factor of 10,500, and the same was done for all of the other processes as well. Scheme 2 visualizes the tunneling rates of all possible processes, including the rotation of the 4-OH group, the OH group in the COOH moiety, and that of the whole COOH group.
What can be deduced from Scheme 2 is that all of the higher energy conformers (C1, C2, D1, D2), even if they are in the sample in detectable amounts, quickly convert to lower energy ones, such as A2, B2, or D1. For instance, if there is any C1 in the matrix at the beginning, most of it should be converted to D1 by the end of the deposition, and the other processes are even faster than that one. B2 converts to A2 in less than a minute, whereas D1 is shown to slowly transform into A1. It is important to note that neither A2 nor B2 may convert to their counterparts A1 or B1 via tunneling over a reasonable timescale and that the conversion rate of D2→A2 is some seven orders of magnitude faster than that of D1→A1, which may explain why the former process cannot be observed experimentally. Most importantly, the scheme also nicely shows why only three forms may be expected to be present in the matrix after deposition, namely A1, A2, and D1, which is in accordance with the experimental results.

4. Conclusions

In this study, 2-F-4-OH benzoic acid was isolated in Ar matrices at low temperatures while collecting its mid-IR spectra. The molecule has eight different conformers based on the position of three fundamental torsional angles, which are the orientation of the H atom in the 4-OH group and that of the O and H atoms in the –COOH group at the other end of the aromatic ring. The spectral assignment can be made by comparing the experimental spectrum with the theoretically predicted spectra of the conformers. Based on the vibrational analysis, only the three most stable conformers (A1, A2, and D1) are expected to be present in the matrix after deposition, which are supported by their calculated Boltzmann populations at the deposition temperature. When exciting the 2ν(OH) stretching overtones of the conformers, it can be deduced that A1 converts to D1 and vice versa, meaning that rotation of the H atom on the COOH group is induced. In contrast to this, no similar effect could be observed for conformer A2. The response of A1 or D1 depends only marginally on whether the irradiation occurred ‘locally’ (i.e., by the excitation of the OH of the COOH group) or ‘remotely’ (by the excitation of the 4-OH moiety). The behavior of the bands upon excitation further confirms the vibrational assignment. The kinetic rates of the rotamerization, as well as the quantum efficiencies of the ‘local’ and ‘remote’ excitations, were also determined. According to this, the efficiency is similar in all cases independently on the excitation wavelength. The spontaneous conversion of the higher energy conformer D1 to the more stable A1 via tunneling was also examined, and, as such, its rate was determined and found to be roughly two orders of magnitude slower than that of the vibrationally induced one.
This molecule represents a great example, where both the local and remote switching could be studied simultaneously, thus allowing for their direct comparison. Therefore, the molecular system presented here further extends our understanding of intramolecular vibrational energy transfer processes.

Supplementary Materials

The following supporting information can be downloaded at: https://www.mdpi.com/article/10.3390/photochem2010009/s1, Tables S1–S20: the optimized geometries as well as harmonic and anharmonic vibrational frequencies and their intensities of A1, A2, B1, B2, C1, C2, D1, and D2 are listed. Tables S21–S48: the optimized geometries of transition states A1A2, (A1A2)*, A1B1, (A1B1)*, A1D1, (A1D1)*, A2B2, (A2B2)*, A2D2, (A2D2)*, B1B2, (B1B2)*, B1C1, (B1C1)*, B2C2, (B2C2)*, C1C2, (C1C2)*, C1D1, (C1D1)*, C2C2*, (C2D2)1, (C2D2)2, (C2*D2*)1, (C2*D2*)2, D1D2, (D1D2)*, and D2D2*. Table S49: torsional angles and harmonic zero-point energy corrected relative energy values of the transition states. Figures S1–S4: IRC profiles of the different rotamerization processes.

Author Contributions

Conceptualization, G.T.; methodology, G.T. and S.G.; formal analysis, S.G. and M.B.; investigation, S.G. and M.B.; resources, G.T.; writing–original draft, S.G. and M.B.; writing–review and editing, G.T. and S.G.; visualization, S.G.; supervision, G.T.; project administration, G.T.; funding acquisition, G.T. All authors have read and agreed to the published version of the manuscript.

Funding

This reseach was funded by the Lendület program of the Hungarian Academy of Sciences and by the ELTE Institutional Excellence Program, grant number TKP2020-IKA-05, financed by the Hungarian Ministry of Human Capacities.

Institutional Review Board Statement

Not applicable.

Informed Consent Statement

Not applicable.

Data Availability Statement

The data are available from the authors upon request.

Acknowledgments

The support of the Lendület program of the Hungarian Academy of Sciences is acknowledged. This work was completed in the ELTE Institutional Excellence Program (TKP2020-IKA-05), financed by the Hungarian Ministry of Human Capacities.

Conflicts of Interest

The authors declare no conflict of interest.

References

  1. Pettersson, M.; Lundell, J.; Khriachtchev, L.; Räsänen, M. IR Spectrum of the Other Rotamer of Formic Acid, cis-HCOOH. J. Am. Chem. Soc. 1997, 119, 11715–11716. [Google Scholar] [CrossRef]
  2. Pettersson, M.; Maçôas, E.M.S.; Khriachtchev, L.; Lundell, J.; Fausto, R.; Räsänen, M. Cis → trans conversion of formic acid by dissipative tunneling in solid rare gases: Influence of environment on the tunneling rate. J. Chem. Phys. 2002, 117, 9095–9098. [Google Scholar] [CrossRef] [Green Version]
  3. Maçôas, E.M.S.S.; Khriachtchev, L.; Pettersson, M.; Juselius, J.; Fausto, R.; Räsänen, M. Reactive vibrational excitation spectroscopy of formic acid in solid argon: Quantum yield for infrared induced trans → cis isomerization and solid state effects on the vibrational spectrum. J. Chem. Phys. 2003, 119, 11765–11772. [Google Scholar] [CrossRef]
  4. Maçôas, E.M.S.S.; Khriachtchev, L.; Pettersson, M.; Fausto, R.; Räsänen, M. Rotational Isomerism in Acetic Acid: The First Experimental Observation of the High-Energy Conformer. J. Am. Chem. Soc. 2003, 125, 16188–16189. [Google Scholar] [CrossRef] [PubMed] [Green Version]
  5. Maçôas, E.M.S.S.; Khriachtchev, L.; Fausto, R.; Räsänen, M. Photochemistry and Vibrational Spectroscopy of the Trans and Cis Conformers of Acetic Acid in Solid Ar. J. Phys. Chem. A 2004, 108, 3380–3389. [Google Scholar] [CrossRef] [Green Version]
  6. Maçôas, E.M.S.S.; Khriachtchev, L.; Pettersson, M.; Fausto, R.; Räsänen, M. Rotational isomerism of acetic acid isolated in rare-gas matrices: Effect of medium and isotopic substitution on IR-induced isomerization quantum yield and cis → trans tunneling rate. J. Chem. Phys. 2004, 121, 1331–1338. [Google Scholar] [CrossRef] [Green Version]
  7. Apóstolo, R.F.G.F.G.; Bazsó, G.; Bento, R.R.F.R.F.; Tarczay, G.; Fausto, R. The first experimental observation of the higher-energy trans conformer of trifluoroacetic acid. J. Mol. Struct. 2016, 1125, 288–295. [Google Scholar] [CrossRef]
  8. Apóstolo, R.F.G.G.; Bazsó, G.; Ogruc-Ildiz, G.; Tarczay, G.; Fausto, R. Near-infrared in situ generation of the higher-energy trans conformer of tribromoacetic acid: Observation of a large-scale matrix-site changing mediated by conformational conversion. J. Chem. Phys. 2018, 148, 044303. [Google Scholar] [CrossRef]
  9. Maçôas, E.M.S.; Khriachtchev, L.; Pettersson, M.; Fausto, R.; Räsänen, M.; Maças, E.M.S.; Khriachtchev, L.; Pettersson, M.; Fausto, R.; Räsänen, M. Internal rotation in propionic acid: Near-infrared-induced isomerization in solid Argon. J. Phys. Chem. A 2005, 109, 3617–3625. [Google Scholar] [CrossRef] [Green Version]
  10. Bazsó, G.; Góbi, S.; Tarczay, G. Near-Infrared Radiation Induced Conformational Change and Hydrogen Atom Tunneling of 2-Chloropropionic Acid in Low-Temperature Ar Matrix. J. Phys. Chem. A 2012, 116, 4823–4832. [Google Scholar] [CrossRef]
  11. Halasa, A.; Lapinski, L.; Reva, I.; Rostkowska, H.; Fausto, R.; Nowak, M.J. Near-Infrared Laser-Induced Generation of Three Rare Conformers of Glycolic Acid. J. Phys. Chem. A 2014, 118, 5626–5635. [Google Scholar] [CrossRef] [PubMed]
  12. Reva, I.; Nunes, C.M.; Biczysko, M.; Fausto, R. Conformational switching in pyruvic acid isolated in Ar and N2 matrixes: Spectroscopic analysis, anharmonic simulation, and tunneling. J. Phys. Chem. A 2015, 119, 2614–2627. [Google Scholar] [CrossRef] [PubMed]
  13. Halasa, A.; Lapinski, L.; Rostkowska, H.; Reva, I.; Nowak, M.J. Tunable Diode Lasers as a Tool for Conformational Control: The Case of Matrix-Isolated Oxamic Acid. J. Phys. Chem. A 2015, 119, 2203–2210. [Google Scholar] [CrossRef] [PubMed]
  14. Maçôas, E.M.S.S.; Fausto, R.; Pettersson, M.; Khriachtchev, L.; Räsänen, M. Infrared-induced rotamerization of oxalic acid monomer in argon matrix. J. Phys. Chem. A 2000, 104, 6956–6961. [Google Scholar] [CrossRef] [Green Version]
  15. Maçôas, E.M.S.S.; Fausto, R.; Lundell, J.; Pettersson, M.; Khriachtchev, L.; Räsänen, M. Conformational Analysis and Near-Infrared-Induced Rotamerization of Malonic Acid in an Argon Matrix. J. Phys. Chem. A 2000, 104, 11725–11732. [Google Scholar] [CrossRef] [Green Version]
  16. Maçôas, E.M.S.S.; Fausto, R.; Lundell, J.; Pettersson, M.; Khriachtchev, L.; Räsänen, M. A matrix isolation spectroscopic and quantum chemical study of fumaric and maleic acid. J. Phys. Chem. A 2001, 105, 3922–3933. [Google Scholar] [CrossRef] [Green Version]
  17. Bazsó, G.; Magyarfalvi, G.; Tarczay, G. Near-infrared laser induced conformational change and UV laser photolysis of glycine in low-temperature matrices: Observation of a short-lived conformer. J. Mol. Struct. 2012, 1025, 33–42. [Google Scholar] [CrossRef]
  18. Bazsó, G.; Magyarfalvi, G.; Tarczay, G. Tunneling Lifetime of the ttc /VIp Conformer of Glycine in Low-Temperature Matrices. J. Phys. Chem. A 2012, 116, 10539–10547. [Google Scholar] [CrossRef]
  19. Bazsó, G.; Najbauer, E.E.; Magyarfalvi, G.; Tarczay, G. Near-Infrared Laser Induced Conformational Change of Alanine in Low-Temperature Matrixes and the Tunneling Lifetime of Its Conformer VI. J. Phys. Chem. A 2013, 117, 1952–1962. [Google Scholar] [CrossRef]
  20. Nunes, C.M.; Lapinski, L.; Fausto, R.; Reva, I. Near-IR laser generation of a high-energy conformer of L-alanine and the mechanism of its decay in a low-temperature nitrogen matrix. J. Chem. Phys. 2013, 138, 125101. [Google Scholar] [CrossRef]
  21. Najbauer, E.E.; Bazsó, G.; Góbi, S.; Magyarfalvi, G.; Tarczay, G. Exploring the Conformational Space of Cysteine by Matrix Isolation Spectroscopy Combined with Near-Infrared Laser Induced Conformational Change. J. Phys. Chem. B 2014, 118, 2093–2103. [Google Scholar] [CrossRef] [PubMed]
  22. Najbauer, E.E.; Bazsó, G.; Apóstolo, R.; Fausto, R.; Biczysko, M.; Barone, V.; Tarczay, G. Identification of Serine Conformers by Matrix-Isolation IR Spectroscopy Aided by Near-Infrared Laser-Induced Conformational Change, 2D Correlation Analysis, and Quantum Mechanical Anharmonic Computations. J. Phys. Chem. B 2015, 119, 10496–10510. [Google Scholar] [CrossRef] [PubMed] [Green Version]
  23. Lapinski, L.; Reva, I.; Rostkowska, H.; Halasa, A.; Fausto, R.; Nowak, M.J. Conformational transformation in squaric acid induced by near-IR laser light. J. Phys. Chem. A 2013, 117, 5251–5259. [Google Scholar] [CrossRef] [PubMed]
  24. Halasa, A.; Lapinski, L.; Reva, I.; Rostkowska, H.; Fausto, R.; Nowak, M.J. Three Conformers of 2-Furoic Acid: Structure Changes Induced with Near-IR Laser Light. J. Phys. Chem. A 2015, 119, 1037–1047. [Google Scholar] [CrossRef]
  25. Kuş, N.; Fausto, R. Effects of the matrix and intramolecular interactions on the stability of the higher-energy conformers of 2-fluorobenzoic acid. J. Chem. Phys. 2017, 146, 124305. [Google Scholar] [CrossRef]
  26. Halasa, A.; Lapinski, L.; Rostkowska, H.; Nowak, M.J. Intramolecular Vibrational Energy Redistribution in 2-Thiocytosine: SH Rotamerization Induced by Near-IR Selective Excitation of NH 2 Stretching Overtone. J. Phys. Chem. A 2015, 119, 9262–9271. [Google Scholar] [CrossRef]
  27. Lopes Jesus, A.J.; Reva, I.; Araujo-Andrade, C.; Fausto, R. Conformational Switching by Vibrational Excitation of a Remote NH Bond. J. Am. Chem. Soc. 2015, 137, 14240–14243. [Google Scholar] [CrossRef]
  28. Halasa, A.; Reva, I.; Lapinski, L.; Rostkowska, H.; Fausto, R.; Nowak, M.J. Conformers of Kojic Acid and Their Near-IR-Induced Conversions: Long-Range Intramolecular Vibrational Energy Transfer. J. Phys. Chem. A 2016, 120, 2647–2656. [Google Scholar] [CrossRef]
  29. Lopes Jesus, A.J.; Nunes, C.; Fausto, R.; Reva, I.; Nunes, M.C.; Fausto, R.; Reva, I.; Nunes, C.; Fausto, R.; Reva, I. Conformational control over an aldehyde fragment by selective vibrational excitation of interchangeable remote antennas. Chem. Commun. 2018, 54, 4778–4781. [Google Scholar] [CrossRef]
  30. Kovács, B.; Kuş, N.; Tarczay, G.; Fausto, R. Experimental Evidence of Long-Range Intramolecular Vibrational Energy Redistribution through Eight Covalent Bonds: NIR Irradiation Induced Conformational Transformation of E-Glutaconic Acid. J. Phys. Chem. A 2017, 121, 3392–3400. [Google Scholar] [CrossRef]
  31. Ogruc Ildiz, G.; Fausto, R. Structural Aspects of the Ortho Chloro- and Fluoro-Substituted Benzoic Acids: Implications on Chemical Properties. Molecules 2020, 25, 4908. [Google Scholar] [CrossRef] [PubMed]
  32. Frisch, M.J.; Trucks, G.W.; Schlegel, H.B.; Scuseria, G.E.; Robb, M.A.; Cheeseman, J.R.; Scalmani, G.; Barone, V.; Mennucci, B.; Petersson, G.A.; et al. Gaussian 09; revision D.01; Gaussian, Inc.: Wallingford, CT, USA, 2013. [Google Scholar]
  33. Becke, A.D. Density-functional thermochemistry. III. The role of exact exchange. J. Chem. Phys. 1993, 98, 5648–5652. [Google Scholar] [CrossRef] [Green Version]
  34. Lee, C.; Yang, W.; Parr, R.G. Development of the Colle-Salvetti correlation-energy formula into a functional of the electron density. Phys. Rev. B 1988, 37, 785–789. [Google Scholar] [CrossRef] [PubMed] [Green Version]
  35. Vosko, S.H.; Wilk, L.; Nusair, M. Accurate spin-dependent electron liquid correlation energies for local spin density calculations: A critical analysis. Can. J. Phys. 1980, 58, 1200–1211. [Google Scholar] [CrossRef] [Green Version]
  36. Dunning, T.H. Gaussian basis sets for use in correlated molecular calculations. I. The atoms boron through neon and hydrogen. J. Chem. Phys. 1989, 90, 1007–1023. [Google Scholar] [CrossRef]
  37. Irikura, K.K. SYNSPEC; National Institute of Standards and Technology: Gaithersburg, MD, USA, 1995. [Google Scholar]
  38. Peng, C.; Ayala, P.Y.; Schlegel, H.B.; Frisch, M.J. Using redundant internal coordinates to optimize equilibrium geometries and transition states. J. Comput. Chem. 1996, 17, 49–56. [Google Scholar] [CrossRef]
  39. Fukui, K. The Path of Chemical Reactions—The IRC Approach. Acc. Chem. Res. 1981, 14, 363–368. [Google Scholar] [CrossRef]
  40. Borden, W.T. Reactions that involve tunneling by carbon and the role that calculations have played in their study. Wiley Interdiscip. Rev. Comput. Mol. Sci. 2016, 6, 20–46. [Google Scholar] [CrossRef]
  41. Maçôas, E.M.S.S.; Khriachtchev, L.; Pettersson, M.; Fausto, R.; Räsänen, M.M. Rotational isomerization of small carboxylic acids isolated in argon matrices: Tunnelling and quantum yields for the photoinduced processes. Phys. Chem. Chem. Phys. 2005, 7, 743–749. [Google Scholar] [CrossRef] [Green Version]
  42. Góbi, S.; Reva, I.; Tarczay, G.; Fausto, R. Amorphous and crystalline thioacetamide ice: Infrared spectra as a probe for temperature and structure. J. Mol. Struct. 2020, 1220, 128719. [Google Scholar] [CrossRef]
  43. Reva, I.; Nowak, M.J.; Lapinski, L.; Fausto, R. Spontaneous tunneling and near-infrared-induced interconversion between the amino-hydroxy conformers of cytosine. J. Chem. Phys. 2012, 136, 064511. [Google Scholar] [CrossRef] [PubMed] [Green Version]
  44. Lapinski, L.; Reva, I.; Rostkowska, H.; Fausto, R.; Nowak, M.J. Near-IR-Induced, UV-Induced, and Spontaneous Isomerizations in 5-Methylcytosine and 5-Fluorocytosine. J. Phys. Chem. B 2014, 118, 2831–2841. [Google Scholar] [CrossRef] [PubMed]
  45. Lopes Jesus, A.J.; Nunes, C.M.; Reva, I.; Pinto, S.M.V.V.; Fausto, R. Effects of Entangled IR Radiation and Tunneling on the Conformational Interconversion of 2-Cyanophenol. J. Phys. Chem. A 2019, 123, 4396–4405. [Google Scholar] [CrossRef] [PubMed]
  46. Schreiner, P.R.; Wagner, J.P.; Reisenauer, H.P.; Gerbig, D.; Ley, D.; Sarka, J.; Császár, A.G.; Vaughn, A.; Allen, W.D. Domino Tunneling. J. Am. Chem. Soc. 2015, 137, 7828–7834. [Google Scholar] [CrossRef] [PubMed]
  47. Góbi, S.; Nunes, C.M.; Reva, I.; Tarczay, G.; Fausto, R. S–H rotamerization via tunneling in a thiol form of thioacetamide. Phys. Chem. Chem. Phys. 2019, 21, 17063–17071. [Google Scholar] [CrossRef]
Scheme 1. Structures of the eight conformers of 2-F-4-OH benzoic acid, namely A1, A2, B1, B2, C1, C2, D1, and D2 as denoted by the labels in bold and in parentheses below the structures. The three torsional angles φ1, φ2 and φ3 are defined in structure A1. In case of C2 and D2, only one of the two enantiomeric forms are depicted.
Photochem 02 00009 sch001aPhotochem 02 00009 sch001b
Figure 1. (a) Near-IR spectrum of the 2-F-4-OH benzoic acid in the 7110–6920 cm−1 range after deposition; (b) difference spectrum after laser irradiating the matrix at 6952.0 cm−1 (black trace) and at 6994.9 cm−1 (red), respectively.
Photochem 02 00009 g001
Figure 2. (a) Mid-IR spectrum of the 2-F-4-OH benzoic acid in the 1800–1400 cm−1 range after deposition; (b) simulated spectrum of conformers A1 (blue negative trace), A2 (red), and D1 (black) based on the anharmonic computations; (c) difference spectrum obtained by subtracting the spectrum taken after deposition from the one collected after ‘locally’ exciting A1 at 6952.0 cm−1.
Photochem 02 00009 g002
Figure 3. (a) Mid-IR spectrum of the 2-F-4-OH benzoic acid in the 1400–1000 cm−1 range after deposition; (b) simulated spectrum of conformers A1 (blue negative trace), A2 (red), and D1 (black) based on the anharmonic computations; (c) difference spectrum obtained by subtracting the spectrum taken after deposition from the one collected after ‘locally’ exciting A1 at 6952.0 cm−1.
Photochem 02 00009 g003
Figure 4. (a) Mid-IR spectrum of the 2-F-4-OH benzoic acid in the 1000–600 cm−1 range after deposition; (b) simulated spectrum of conformers A1 (blue negative trace), A2 (red), and D1 (black) based on the anharmonic computations; (c) difference spectrum obtained by subtracting the spectrum taken after deposition from the one collected after ‘locally’ exciting A1 at 6952.0 cm−1. The atmospheric CO2 band is masked in the spectrum.
Photochem 02 00009 g004
Figure 5. Kinetic curves of the 1742.5 cm−1 (ad) and 1628.2 cm−1 (eh) bands upon near-IR irradiations of 6952.0 cm−1 (a,e), 6994.9 cm−1 (b,f), 7093.2 cm−1 (c,g), and 7077.1 cm−1 (d,h).
Photochem 02 00009 g005
Figure 6. Kinetic curves of the (a) 1742.5 cm−1 (A1) and (b) 1772.0 cm−1 (D1) bands after the 6952.0 cm−1 near-IR irradiations when the matrix is left in the dark overnight.
Photochem 02 00009 g006
Scheme 2. Calculated tunneling half-lives for all conformers. The values are scaled with a uniform factor of 10,500, so that the half-life of the D1A1 process is identical to that of the experimentally obtained one. The fastest processes for each conformer are highlighted in bold, whereas the labels of the conformers that can be experimentally observed are outlined.
Photochem 02 00009 sch002
Table 1. Torsional angles (in degrees) and anharmonic zero-point energy-corrected relative energy values (kJ mol–1) of the 2-F-4-OH-benzoic acid conformers.
Torsional Angles a/°EZPE,anharm b
Φ1Φ2Φ3
A1180.0−180.0180.00.0
A2−180.00.0−180.03.4
B10.0180.0180.00.8
B20.00.0180.03.5
C10.0180.00.09.1
C20.8−33.6−11.230.0
C2*−0.833.611.230.0
D1180.0180.00.07.4
D2179.8−34.6−11.730.2
D2*−179.834.611.730.4
a The torsional angles are defined in Scheme 1; b with regard to the minimum energy of −595.396627 hartree particle−1.
Table 2. General behavior of the bands of conformers A1, A2, and D1 upon near-IR laser excitation of their O–H stretching overtone peaks.
Excitation Wavelength (cm−1) a
6952.0 (‘Local’)6994.9 (‘Local’)7093.2 (‘Remote’)7077.1 (‘Remote’)
A1++
A20000
D1++
+: increasing signal, −: decreasing signal, 0: no change; a ‘local’: excitation of the carboxylic OH, ‘remote’: excitation of the 4-OH group.
Table 3. Spectral assignment of conformer A1 for the mid-IR region of 1800–600 cm−1.
ExperimentalTheoreticalModeDescription b
ν (cm−1)Irel.aν (cm−1)I (km mol−1)
1742.52881746.2329ν6ν(C=O)
1625.1801618.4170ν7ν(CC)arom.
1600.3581586.952ν8ν(CC)arom.
1517.3, 1510.56.61498.211ν9ν(CC)arom., β(CCH)
1466.5, 1461.81191459.6113ν10ν(CC)arom., β(CCH)
1376.9, 1373.3111369.249ν11ν(C–C), β(COH)COOH
1333.1251335.446ν12ν(CC)arom.
1301.01481298.8121ν13ν(C–O)4-OH, β(CCH)
1263.0291246.511ν14β(CCH)
1243.91.9 ??
1219.95.61217.721292δ(ring)
1204.7361206.422ν15β(COH)4-OH
1184.91281180.198ν16β(COH)COOH, β(CCH)
1151.84.4 ??
1144.2441146.338ν17β(CCH)
1117.4, 1114.32241115.6212ν18β(CCH)
1094.69.71084.726ν19ν(C–O)COOH, ν(CF)
972.565976.629ν21β(CCC)arom.
863.5, 858.044872.829ν22γ(CCH)
823.52.8829.11.8ν23γ(CCH)
769.772775.637ν24τ(COOH), τ(ring)
746.17.7746.16.2ν25δ(ring)
735.09.5731.77.8ν26β(O=C–O)
691.1, 680.933698.917ν27τ(COOH), τ(ring)
606.522608.428ν29δ(ring)
a Normalized experimental band areas obtained by multiplying each integrated band area by the sum of the theoretical infrared intensities divided by the sum of the experimental band areas; b ν: stretching, β: in-plane bending, γ: out-of-plane bending, δ: in-plane deformation, τ: out-of-plane deformation, ?: unassigned peak.
Table 4. Spectral assignment of conformer D1 for the mid-IR region of 1800–600 cm−1.
ExperimentalTheoreticalModeDescription b
ν (cm−1)Irel.aν (cm−1)I (km mol−1)
1772.04091778.2257ν6ν(C=O)
1628.2sh1351619.1140ν7ν(CC)arom.
1601.2sh,b151590.527ν8ν(CC)arom.
1508.7, 1484.2201499.616ν9β(CCH), ν(CC)arom.
1458.7, 1452.1, 1449.1, 1444.1951451.681ν10ν(CC)arom., β(CCH)
1347.8, 1340.14651307.8790ν12β(COH)COOH
1331.8441333.134ν11ν(CC)arom., β(COH)
1308.143 ?
1297.82191298.8247ν13β(CCH), ν(C–O)4-OH
1251.0281248.826ν14β(CCH)
1226.98.3 ?
1215.910 ?
1196.1311213.29.5ν15β(CCH), β(COH)COOH
1179.8151182.485ν16β(COH)4-OH
1136.2641122.197ν18β(CCH)
1126.2361139.610ν17β(CCH)
1085.0, 1081.9151060.90.012ν19ν(C–O)COOH, ν(CF)
1048.314 ??
965.670968.318ν21β(CCC)arom.
854.4, 851.545872.441ν22γ(CCH)
825.910832.56.3ν23γ(CCH)
763.251754.411ν25β(O=C–O)
736.85.5739.42.3ν26δ(ring)
683.5, 678.125692.18.6ν27τ(COOH), τ(ring)
625.124632.510ν28τ(COOH), τ(ring)
610.536612.120ν29δ(ring)
a Normalized experimental band areas obtained by multiplying each integrated band area by the sum of the theoretical infrared intensities divided by the sum of the experimental band areas; b ν: stretching, β: in-plane bending, γ: out-of-plane bending, δ: in-plane deformation, τ: out-of-plane deformation, ?: unassigned peak.
Table 5. Spectral assignment of conformer A2 for the mid-IR region of 1800–600 cm−1.
ExperimentalTheoreticalModeDescription b
ν (cm−1)Irel.aν (cm−1)I (km mol−1)
1763.8, 1757.33781769.2196ν6ν(C=O)
1607.94.81616.989ν7ν(CC)arom.
1572.72.21587.098ν8ν(CC)arom.
1515.1131498.027ν9β(CCH), ν(CC)arom.
1468.4sh111455.318ν10ν(CC)arom., β(CCH)
1357.5161351.226ν11ν(CC)arom., β(COH)COOH
1301.2sh531298.8162ν13ν(C–O)4-OH, β(COH)COOH
1239.08.31245.557ν27 + ν31τ(ring, COOH) + γ(CCH)COOH
1177.0311173.097ν16β(COH)COOH, ν(C–C)
1154.51.91157.020ν17β(CCH)
1128.6, 1122.01231125.1327ν18β(CCH)
1097.22.8 ??
1063.0, 1059.6, 1057.7581048.896ν19ν(C–O)COOH
859.4sh14875.133ν22γ(CCH), τ(ring)
820.31.1825.92.5ν23γ(CCH), τ(COOH)
770.8sh26775.522ν24τ(COOH), γ(CCH)
743.53.0747.13.2ν25δ(ring)
689.110702.235ν27τ(ring), τ(COOH)
a Normalized experimental band areas obtained by multiplying each integrated band area by the sum of the theoretical infrared intensities divided by the sum of the experimental band areas; b ν: stretching, β: in-plane bending, γ: out-of-plane bending, δ: in-plane deformation, τ: out-of-plane deformation, ?: unassigned peak.
Table 6. Rotamerization rates (kX, in sec−1, where X = A1 or D1, respectively) of the conformers upon near-IR irradiation. Positive values show growth, whereas negative ones indicate decay. Computed quantum yields for the rotamerization of the carboxylic OH group when exciting the OH stretching overtones.
Near-IR Irradiation (cm−1) a
6952.0 (Local)6994.9 (Local)7093.2 (Remote)7077.1 (Remote)
kA1−(9.9 ± 0.2) × 10−4(8.6 ± 0.2) × 10−4−(5.0 ± 0.1) × 10−4(3.2 ± 0.1) × 10−4
kD1(9.3 ± 0.3) × 10−4−(8.1 ± 0.1) × 10−4(5.2 ± 0.5) × 10−4−(3.8 ± 0.5) × 10−4
Aint (cm)1.8961.0391.7821.126
α (cm)5.5 × 10−174.3 × 10−175.5 × 10−174.3 × 10⁻¹⁷
N (cm−2)8.0 × 10165.6 × 10167.5 × 10166.0 × 1016
A0.00200.00080.00120.0006
σi() (cm2)2.5 × 10−201.4 × 10−201.6 × 10−201.0 × 10⁻²⁰
P (W)0.044 ± 0.0080.045 ± 0.0010.046 ± 0.0010.050 ± 0.001
Ephoton (J)1.4 × 10−191.4 × 10−191.4 × 10−191.4 × 10⁻¹⁹
I() (cm−2 s−1)(3.1 ± 0.6) × 1017(3.2 ± 0.1) × 1017(3.3 ± 0.1) × 1017(3.6 ± 0.1) × 1017
Φ(i) (E3)1.2 × 10−11.9 × 10−19.7 × 10−29.7 × 10−2
Niso (s−1)7.7 × 10134.7 × 10133.8 × 10132.1 × 1013
Nabs (s−1)1.4 × 10155.9 × 10149.1 × 10145.0 × 1014
Φ(i) (E5)5.5 × 10−28.0 × 10−24.2 × 10−14.2 × 10−2
Φ(i)average(9 ± 3) × 10−2(1.4 ± 0.5) × 10−1(7 ± 3) × 10−2(7 ± 3) × 10−2
a ‘local’: excitation of the carboxylic OH, ‘remote’: excitation of the 4-OH group.
Publisher’s Note: MDPI stays neutral with regard to jurisdictional claims in published maps and institutional affiliations.

