All articles published by MDPI are made immediately available worldwide under an open access license. No special
permission is required to reuse all or part of the article published by MDPI, including figures and tables. For
articles published under an open access Creative Common CC BY license, any part of the article may be reused without
permission provided that the original article is clearly cited. For more information, please refer to
https://www.mdpi.com/openaccess.
Feature papers represent the most advanced research with significant potential for high impact in the field. A Feature
Paper should be a substantial original Article that involves several techniques or approaches, provides an outlook for
future research directions and describes possible research applications.
Feature papers are submitted upon individual invitation or recommendation by the scientific editors and must receive
positive feedback from the reviewers.
Editor’s Choice articles are based on recommendations by the scientific editors of MDPI journals from around the world.
Editors select a small number of articles recently published in the journal that they believe will be particularly
interesting to readers, or important in the respective research area. The aim is to provide a snapshot of some of the
most exciting work published in the various research areas of the journal.
Investigation of Japanese Onomatopoeia Tsuru-Tsuru as a Suitable Sensory Attribute for Perception of Surface Properties of Textiles by Non-Trained Individuals
Department of Advanced Fibro Science, Graduate School of Science and Technology, Kyoto Institute of Technology, Matsugasaki, Sakyo-ku, Kyoto 606-8585, Japan
*
Author to whom correspondence should be addressed.
In recent years, using non-trained individuals in sensory science for analytical tasks has gained traction. Identifying attributes enabling non-experts to express perceptions is crucial for accurate fabric assessments and effective communication of product properties to consumers. This study explored the potential utility of the Japanese onomatopoeia tsuru-tsuru as a sensory attribute for evaluating fabric surface properties. Two experiments were conducted. The first ranked 16 samples to identify those eliciting the tsuru-tsuru sensation, exploring its relationship with attributes like smoothness and coolness. The second involved a detailed descriptive sensory evaluation of selected samples, examining the relationship between tsuru-tsuru, coolness, slipperiness, and hardness. Fabric preferences assessment and cluster analysis were also employed to understand individual differences in perception. Sensory assessments revealed tsuru-tsuru’s comparable performance with attributes like smoothness and slipperiness, facilitating effective sample distinction. Participants showed high agreement, indicating shared perceptions. Preferences favored fabrics with tsuru-tsuru qualities. The clustering analysis revealed participants had slightly different interpretations of tsuru-tsuru. Overall, results indicated the positive potential value of tsuru-tsuru in describing textile surfaces for non-trained individuals.
In sensory analysis, identifying relevant sensory attributes is crucial for effectively describing the sensory characteristics of textile fabrics, especially in the context of descriptive sensory analysis conducted by non-trained individuals. Recently, there has been increasing interest in utilizing non-trained individuals for analytical tasks in sensory science [1]. The identification of sensory attributes that allow non-experts to articulate their perceptions is essential for obtaining accurate descriptive assessments of fabrics. Moreover, it enables textile manufacturers to communicate the properties of their products to consumers in a purposeful, efficient, and understandable manner.
Sensory attributes can be categorized into three layers in increasing order of abstraction [2]. These layers consist of attributes within the perceptual psychophysical layer, those within the affective layer, and finally, those within the preference layer. Attributes within the perceptual layer are typically encountered in classical descriptive sensory assessments and include features closely related to the physical properties of fabrics measured in the laboratory. Examples of such attributes include smoothness, coolness, hardness, and more. On the other hand, the affective and preference layers are more closely related to consumer-oriented features, reflecting daily consumer experiences. These include attributes like richness, cleanliness, elegance, comfort, and various others.
The abstraction gap in these layers presents significant challenges not only in communicating fabric qualities to consumers but also in incorporating consumers into analytical sensory applications. Consequently, there is a need for sensory attributes that exist in the middle ground, possessing semantics at both lower and higher levels of abstraction. An example of such attributes is those related to onomatopoeia. Onomatopoeia is frequently employed to express feelings or convey a sense of atmosphere [3], but they are also known for their ability to convey texture-related cognition [4,5].
This study explored the utility of onomatopoeia as a sensory attribute, using the Japanese onomatopoeic term tsuru-tsuru as an example. In Japan, onomatopoeia holds significant importance in daily communication and has garnered substantial attention from researchers in the field of natural language processing [3,6]. Tsuru-tsuru is a widely used onomatopoeia in Japan, typically associated with sensations of smoothness, slipperiness, and shininess [7]. Tsuru-tsuru can describe differences in texture sensation at a fine resolution [8] and is commonly used to describe the surfaces of various materials, including textile fabrics.
We hypothesized that tsuru-tsuru could serve as an effective attribute for describing the surface of textile fabrics in comparison to attributes traditionally employed in classical descriptive sensory analysis. Furthermore, tsuru-tsuru may be interpreted through the lens of classical attributes in the context of sensory assessment. For instance, it might be comprehended as a combination of smoothness and hardness, offering a more nuanced understanding of the sensory characteristics of textile surfaces.
It could be reasonably argued that for an attribute to be valuable in sensory assessments, two crucial requirements must be met: (1) the attribute should enable participants to distinguish between samples, and (2) there must be a reasonable level of agreement among participants regarding the attribute. This implies that participants should share similar perceptions and understanding of what the attribute means.
As a result, the study prioritized individual differences among participants, giving emphasis to their unique preferences and perceptions. Samples were used to interpret the participants’ tsuru-tsuru perception, assessing the given attribute’s ability to differentiate samples in their sensory space. Samples were carefully chosen to replicate a sensory environment familiar to consumers.
The study’s scope was confined to the surface properties of the fabrics, aligning with the association of tsuru-tsuru with texture sensations. Data analysis reflected the emphasis on individuals, omitting mean calculations for attributes. This approach allowed for a more general interpretation, respecting the unique preferences and perceptions of each participant. Gender analysis was not pursued due to the small number of participants and inherent sensory variability among non-trained individuals, ensuring that the results represent commonalities irrespective of gender. It is worth noting that the samples used here are commonly used by both men and women.
To investigate the suitability of tsuru-tsuru as a sensory attribute, two experiments were conducted. First, a preliminary ranking sensory experiment (Experiment I) aimed to address the practical question of which types of samples evoke the tsuru-tsuru sensation. This experiment involved assessing 16 samples with diverse physical properties to identify those that conveyed the sensations of tsuru-tsuru. Additionally, the experiment explored the relationship between tsuru-tsuru and two other closely related attributes, smoothness, and coolness. Six samples were selected based on their ranking for tsuru-tsuru for further investigation.
In the second phase (Experiment II), the 6 previously selected samples underwent a comprehensive descriptive sensory evaluation, encompassing five attributes: tsuru-tsuru, smoothness, slipperiness, coolness, and hardness. The investigation delved into the relationship between tsuru-tsuru and the other attributes, relying on participant agreement and sample scores. Participants’ fabric preferences were also evaluated to understand liking drivers based on the fabric’s physical properties. Finally, clustering analysis was employed to assess individual differences in perception of tsuru-tsuru by the participants.
For specific data analysis methods employed here, please refer to the corresponding sections in the methods section. Information on the software used here is highlighted in Appendix A.2.
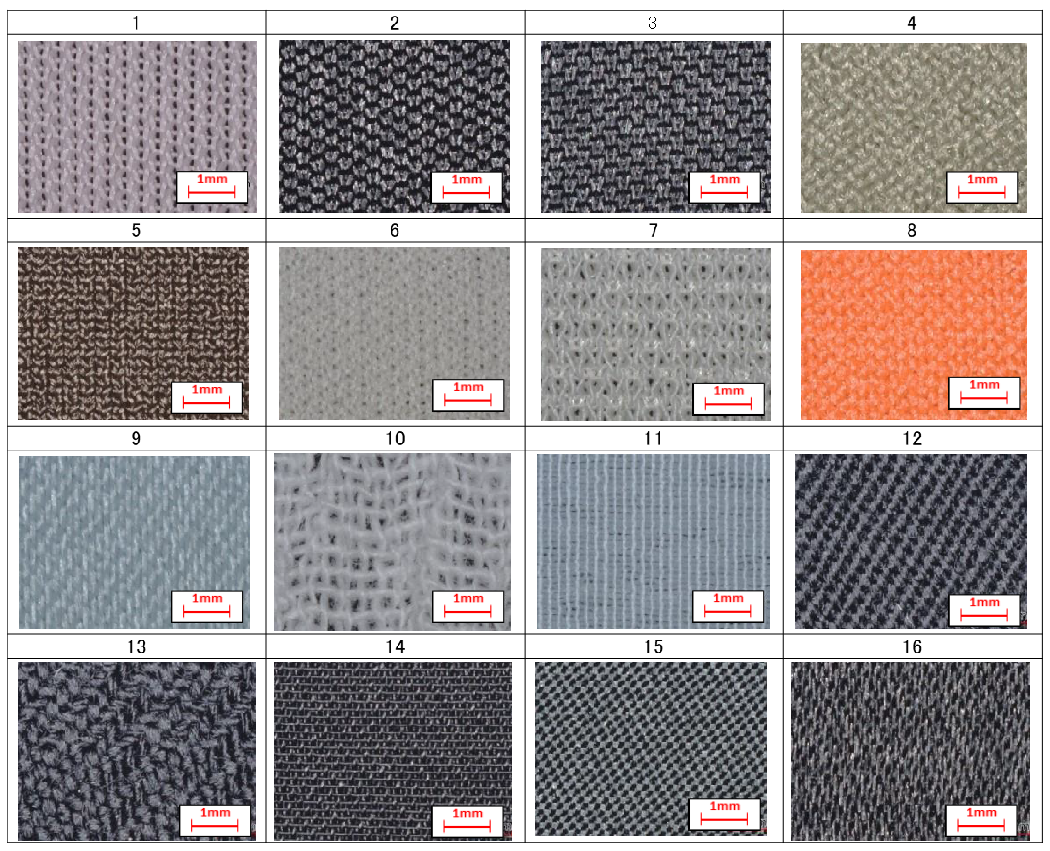
In the ranking experiment, sixteen samples were utilized. When selecting these samples, particular attention was paid to creating a diverse set, representing a sample sensory space that consumers would encounter in real-life scenarios, such as when shopping for apparel. The samples featured varying surface properties, including distinct fiber compositions and tactile qualities. Half of the samples were woven, while the other half were knitted. Samples No. 2 and No. 3 were composed of polyester fibers commonly used in summer underwear, often associated with the sensation of tsuru-tsuru in Japan. Photographs of the samples are displayed in Figure 1, and basic specifications are provided in Table 1.
The physical properties related to the surface characteristics of the samples were measured using the Kawabata Evaluation System for Fabrics (KES-F) [9]. Since our emphasis was on the participants, the sample sensory space considered in this study was limited by the space spanned by the physical properties of the fabrics.
Surface properties of the fabrics were measured along the warp and weft directions using KES-SE-SR and KES-SE surface testers (Kato Tech Co., Ltd., Kyoto, Japan). The compression properties were measured using KES-G5 (Kato Tech Co., Ltd., Kyoto, Japan). Tensile properties were measured along the warp and weft directions using the KES-FB1-AUTO-A tensile and shear tester (Kato Tech Co., Ltd., Kyoto, Japan). The maximum value of the heat flow (qmax, W/cm), related to the warm/cool feeling, was also measured using the KES Thermo Labo II (Kato Tech Co., Ltd., Kyoto, Japan) following the JIS L1927 standard. All measurements were conducted under standard measurement conditions. In Appendix A, the total list of parameters used in the study can be seen in Table A1 together with the measurement conditions. Moreover, parameter values are listed in Table A2, and finally, plots of the parameters are available in Figure A1.
The sample dimensions were 20 cm × 20 cm, typical dimensions for measuring the physical properties of samples using the KES-F system. These dimensions strike a good balance between machine measurement convenience and textile handle during sensory evaluation.
2.2. Participants
Twenty-five university students (14 men and 11 women) took part in the ranking experiment. All participants were in their 20s with normal color vision and normal or corrected-to-normal visual acuity.
2.3. Ranking Sensory Evaluation
The fabric samples were simultaneously presented to each participant, who was then instructed to rank them in descending order of intensity based on the following sensory attributes: (1) tsuru-tsuru, (2) smoothness, and (3) coolness. The samples were randomized and placed on a well-lit, flat table. Each ranking assessment took place separately for each attribute. No specific instructions were provided on how to touch or handle the fabrics, allowing participants to evaluate the samples freely. Importantly, no two samples received the same ranking from any participant. The experiment was carried out in one day, in the afternoon, with room temperature ranging from 21 °C to 24 °C.
2.4. Data Analysis: Ranking Sensory Evaluation
2.4.1. Data Set
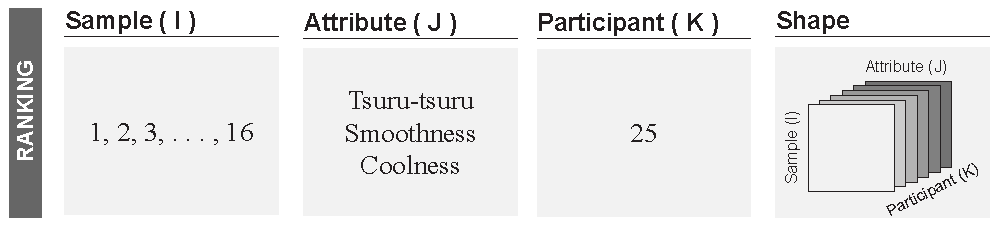
The shape of the 3-way matrix containing the ranking results was structured with samples as rows, attributes as columns, and participants as slices, Figure 2. The matrix was unfolded based on the Tucker-1 method [10] along the columns. The transformation was represented as
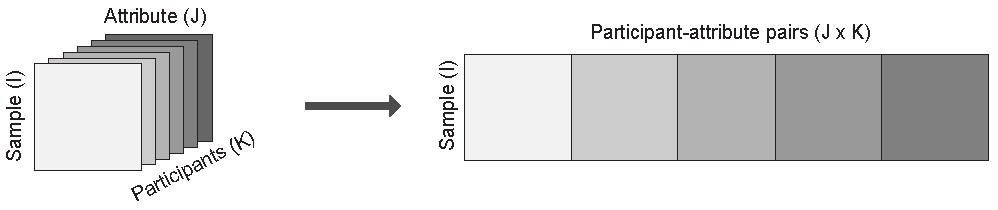
In the ranking experiment, a decision was made to analyze each attribute j separately, where . This approach enabled the assessment of the relationship among the samples for each attribute in isolation. This process yielded 3 matrices, each with samples as rows and participant-attribute pairs as columns. The new columns represented each attribute as perceived by each participant separately. The Tucker-1 method keeps all the sensory information in the data set without resorting to averages, thus preserving individuality.
2.4.2. Principal Component Analysis (PCA)
Principal Component Analysis was individually applied to each of the 3 unfolded matrices to assess the relationships among samples and the agreement (consensus) among participants, represented by the scores and loadings, respectively. More specifically, correlation loadings were used to represent the agreements. Correlation loadings involve a simple normalization procedure that facilitates the comparison of different PCAs. They measure the correlation between the original variables and the principal components generated by the PCA. To aid in visualizing these correlations, an outer ellipse corresponding to 100% correlation and an inner ellipse corresponding to 50% correlation were also plotted. The data was not normalized.
The PCA model was given by:
where was one of the 3 sensory matrices, the score matrix, the loadings matrix and the residuals matrix. The index n was the number of principal components. The correlations loadings, defined by the correlation between the columns of and (respectively, and ) was given by:
2.4.3. Selection of Samples for Descriptive Sensory Analysis
Six samples were selected from the ranking experiment based on their ranking in tsuru-tsuru, while to a lesser extent, consideration was given to the ranking on the remaining attributes. The fiber material and structure were also considered.
3. Methods: Experiment II—Descriptive Sensory and Preference Evaluations
3.1. Samples
Six samples were selected from the ranking experiment, considering variations in both warp and weft weaves, resulting in a total of 12 specimens. Participants were then instructed to run their fingers along the samples. The motivation behind this was to reduce the influence of other touch-related factors and emphasize the examination of the fabric’s surface properties. To accommodate this change in the experimental design, the surface area of the samples was increased, and their dimensions were adjusted to 10 cm × 60 cm. Each sample was affixed to cardboard (approximately 3 mm thick) to prevent movement. This measure was also motivated by the aim to minimize the influence of other touch-related factors.
3.2. Participants
Thirty-two participants (24 men and 8 women) in their 20s, with normal color vision and normal or corrected-to-normal visual acuity, took part in the experiment.
3.3. Descriptive Sensory Evaluation
Participants slid their fingertips across the length of the 12 specimens and were asked to rate each fabric according to 5 sensory attributes on a 6-point scale from 0 to 5. In the scale, the zero point indicated the absence of the given attribute. The attributes included: (1) tsuru-tsuru, (2) smoothness, (3) slipperiness, (4) coolness, and (5) hardness. The manner in which each participant touched the samples was not specified, except that they should slide their finger along the length of the sample from left to right five times. The order of presentation of the samples was randomized. The experiment was carried out over various weeks at different times of the day, with room temperature ranging from 21 °C to 24 °C.
3.4. Preference Evaluation
To assess preferences and drivers of liking during the descriptive evaluation, participants were asked to score the samples for their liking on the same scale, ranging from 0 through 5, for each of the 12 specimens.
3.5. Data Analysis: Descriptive Sensory Evaluation
3.5.1. Data Set
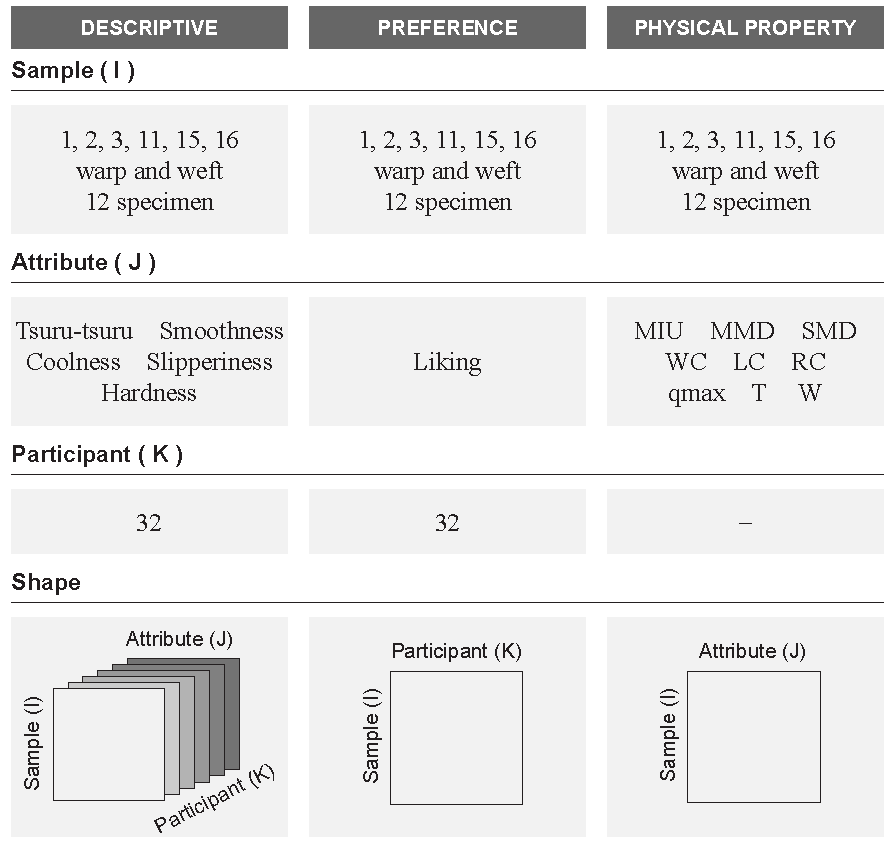
The structure of the data set was similar to the ranking experiment, except that now the J sensory attributes corresponded to the 5 descriptive attributes (see Figure 4). The 3-way matrix was unfolded, considering all the attributes at once, resulting in one wide matrix with rows corresponding to samples and columns corresponding to J × K participant-attribute pairs. Two-way ANOVA, with samples and participants as effects, was performed on each sensory attribute individually to test its significance. All attributes were significant, and results were not reported.
3.5.2. Principal Component Analysis (PCA)
Principal component analysis was applied to the unfolded sensory matrix to assess the relationship among the samples and the agreement among the participants. Due to the large number columns in the matrix, the correlation loadings plot was repeatedly plotted each time with one of the the attributes highlighted. The data was not normalized. Similarly to Section 2.4.2, the model was given by:
and
where and are single matrices.
3.6. Data Analysis: Preference Evaluation
3.6.1. Data Set
The liking data were structured as a two-way matrix, with rows representing samples and columns representing the liking scores assigned by each participant. The physical properties used to evaluate the drivers of liking were organized as a two-way matrix, with rows representing samples and columns representing the physical properties. Both data sets were standardized due to differing units. The data sets are depicted in Figure 4.
3.6.2. Internal Preference Mapping
Internal preference mapping [11] involved applying PCA to the liking data and subsequently regressing the physical properties onto the principal components. This approach follows the standard application of Principal Component Regression (PCR) [12]. It’s important to note that the regression model did not include an intercept term because both data sets were centered during the process. The regression was applied using the first five principal components, with the goal of achieving a total explained variance equal to or greater than 80%. The PCR model was given by (1) PCA of the preference data set
and (2) the physical properties regressed onto the Score
where is the vector representing the jth physical parameter, is the vector of regression coefficients, is the vector of regression residuals, and n is the number of principal components. is also referred to as regression loadings, as it assumes the same role as in Equation (6).
3.7. Data Analysis: Clustering
Here, we investigated the fact that the interpretation of tsuru-tsuru may vary among individual participants. Hierarchical clustering was applied to the correlation loadings matrix as calculated in Section 3.5. The correlation loadings matrix, which describes the relationship among original attributes in terms of the principal components, was used to calculate the cosine distance (Equation (8)) between tsuru-tsuru and the remaining attributes for each participant individually (see Figure 5). The calculations were based on the first five principal components (). The resulting matrix consisted of participants as rows and the cosine distances from tsuru-tsuru to the four attributes as columns. Hierarchical clustering was applied to this matrix using ward linkage and Euclidean distance as a metric, resulting in the formation of four distinct clusters.
where represent the correlation loadings for tsuru-tsuru and for the remaining attributes.
4. Results and Discussion
4.1. Experiment I
4.1.1. Ranking Sensory Evaluation
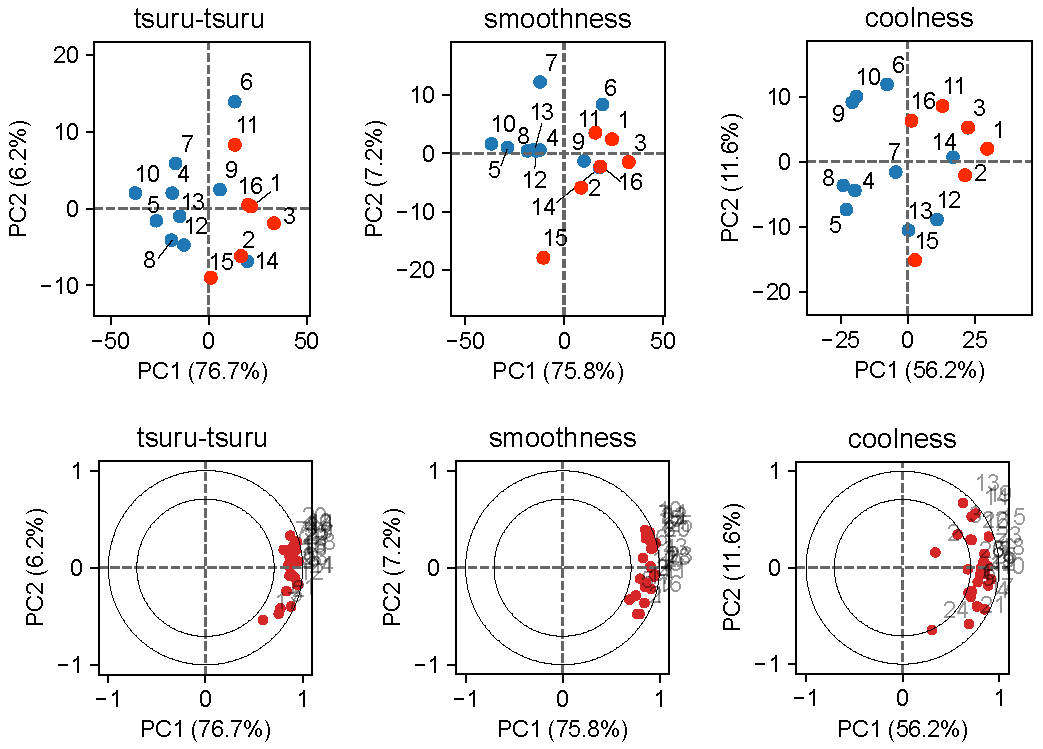
The scores show that participants ranked the samples similarly in all attributes (see Figure 6, top row). Moreover, the high level of agreement displayed in the correlation loadings plots (see Figure 6, bottom row), together with the high explained variance for the first two principal components, strongly suggests a similar perception of the samples and a shared understanding of the attributes. There is somewhat weaker agreement for the attribute coolness. A noticeable polarization in agreement (top-bottom) is observed in the loadings plots regarding the second principal component. Overall, it could be argued that the diversity in physical properties of the samples might have made the ranking task less challenging for the participants.
4.1.2. Sample Selection
Samples 1, 2, 3, 11, 15, and 16 were chosen based on the overall ranking in tsuru-tsuru, but also considering the other two attributes. Samples No. 2 and No. 3 were given precedence, given they are commonly used in summer underwear, often associated with the sensation of tsuru-tsuru in Japan.
4.2. Experiment II
4.2.1. Descriptive Sensory Analysis
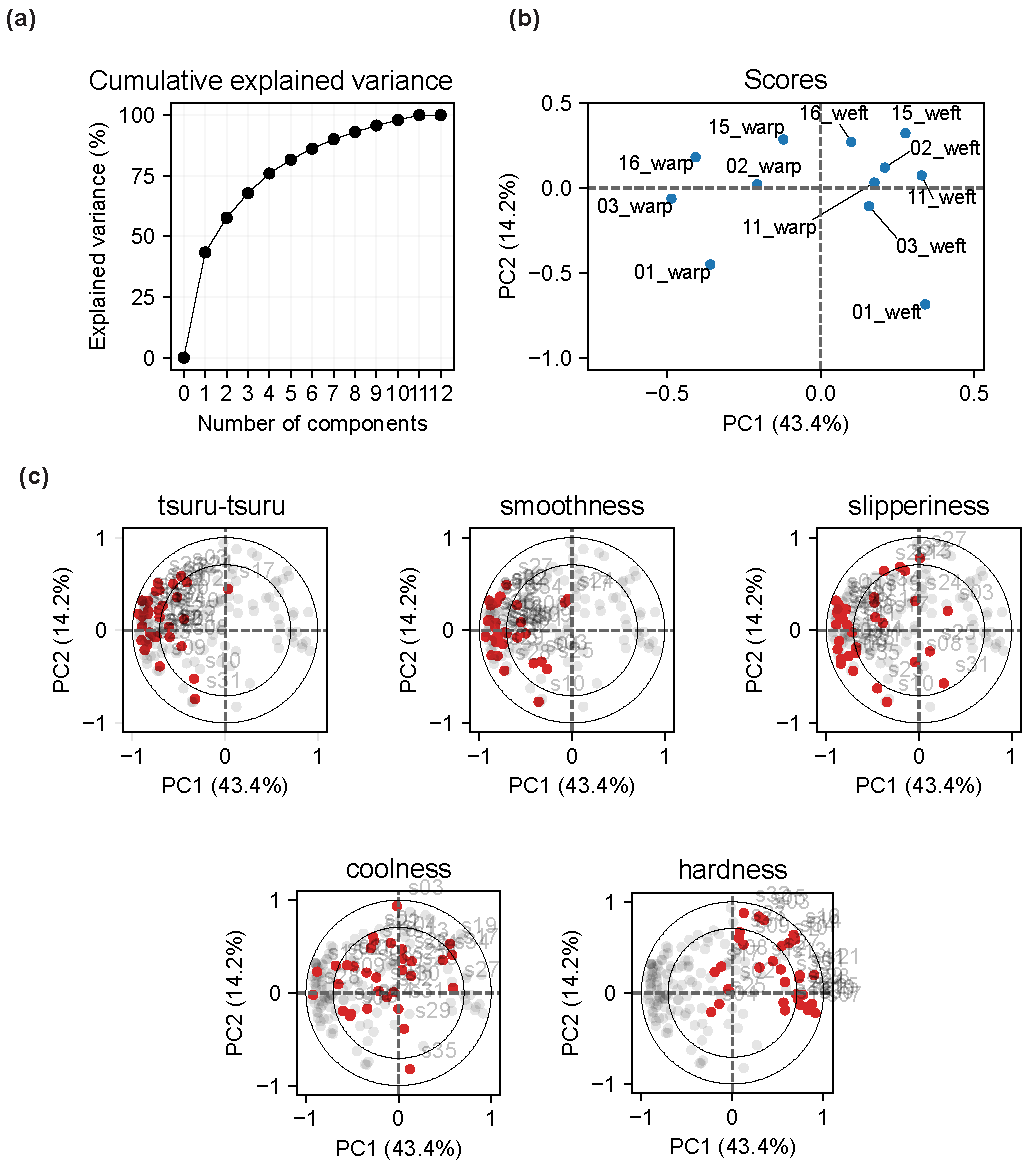
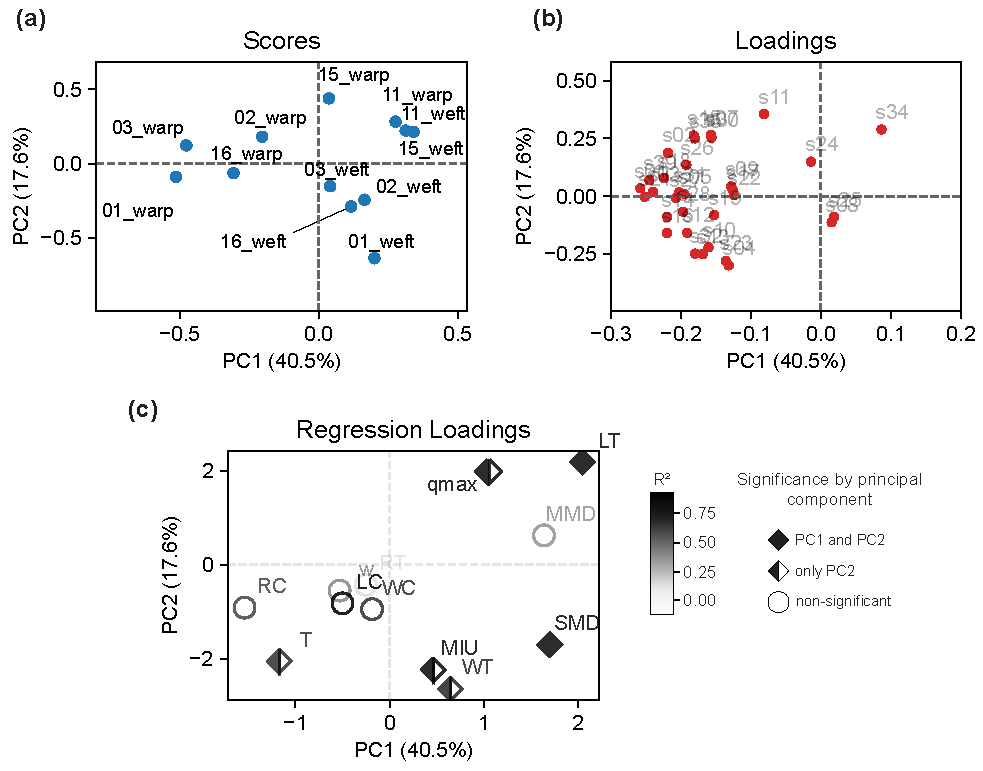
The score plot (see Figure 7b) shows an interesting polarization regarding the warp and weft directions. This polarization is supported by the physical properties illustrated in Figure 8.
The sample selection from the ranking experiment resulted in very smooth samples. In practice, the samples were much harder to distinguish by touch compared to the previous experiment. Examining the agreement among participants (see Figure 7c), despite the challenge of distinguishing between samples, significant consensus is observed for tsuru-tsuru and smoothness, although slightly less for slipperiness. Agreement for coolness is notably low. In the case of hardness, there is less agreement among participants, but it notably explains the polarization between warp and weft in the scores plot. Smooth samples are on the left, and the hard samples are on the right. This observation is intriguing, considering the samples were mounted on a considerably thick cardboard substrate and could not move. Despite this, participants successfully detected hardness with relative consensus, highlighting their sensitivity to this attribute. By now, the results suggested that tsuru-tsuru was a good drop-in replacement for the attribute smoothness and possibly slipperiness.
4.2.2. Preference Evaluation
The scores plot (Figure 9a) shows similar relationships among samples as observed in the descriptive evaluation, including the same polarization in the warp/weft directions. This suggests that participants prefer samples with properties of tsuru-tsuru. The regression loadings (Figure 9c) show participants prefer samples with low values of LT and SMD (first principal component). The second principal component indicates about half of the participants prefer samples with high qmax and low MIU and WT, while the other half prefers the opposite. This explains the same (top/bottom) polarization (Figure 9b) as seen in the descriptive evaluation. This suggests tsuru-tsuru to have weak connotations of coolness. The results also suggest that the interpretation of tsuru-tsuru is participant-dependent. For example, participants who prefer high qmax and low MIU may interpret tsuru-tsuru as a mixture of slipperiness and coolness.
4.2.3. Clustering
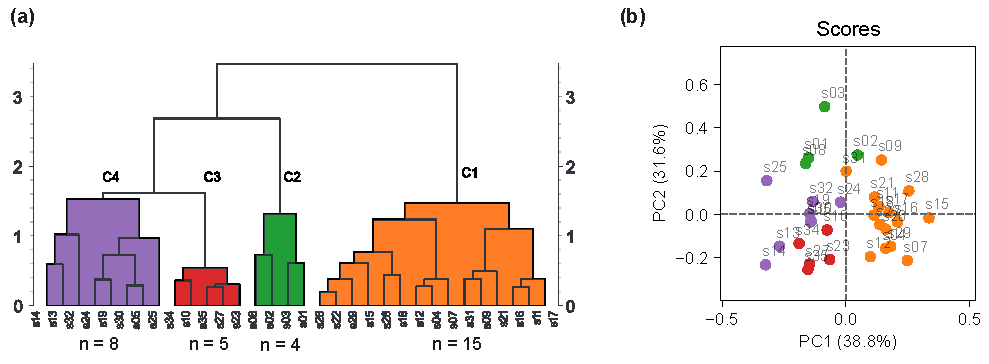
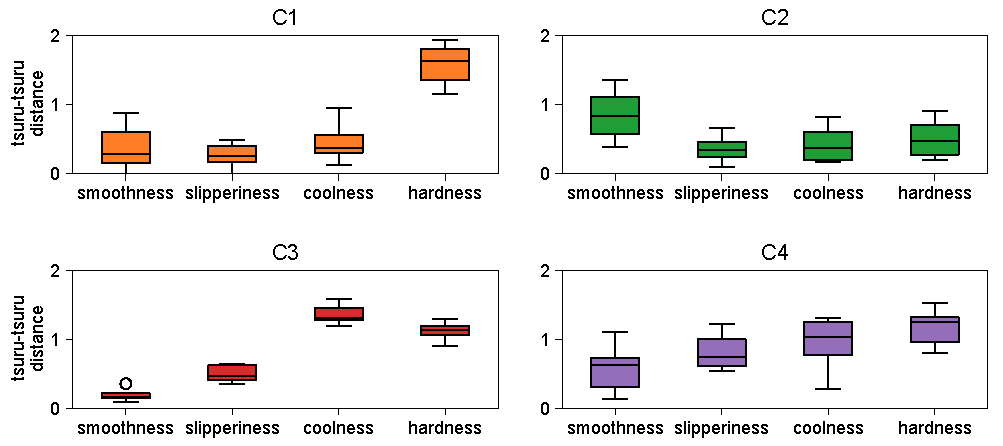
Clustering (Figure 10) shows some differences in the interpretation of tsuru-tsuru, with about 47% of the participants (C1) interpreting it as a mixture of mainly smoothness and slipperiness. The second-largest group (C4), comprising 25%, interpreted tsuru-tsuru mainly as smoothness. There was no relationship between clusters and the gender of the participants. It is worth highlighting the agreement for tsuru-tsuru throughout the experiments despite slightly different interpretations of what tsuru-tsuru is.
5. Conclusions
This study investigated the Japanese onomatopoeia tsuru-tsuru as a potentially useful attribute in the assessment of fabric surface properties by non-trained individuals in sensory evaluation experiments. Tsuru-tsuru was compared to less abstract but more traditionally used attributes: smoothness, slipperiness, coolness, and hardness. The study encompassed two experiments: (1) a ranking sensory evaluation and (2) a descriptive sensory evaluation. The experiments assessed the participants’ individual differences regarding the sample score and attributes. The participants’ preferences were assessed. Clustering was carried out to investigate the participants’ understanding/perception of tsuru-tsuru based on other attributes.
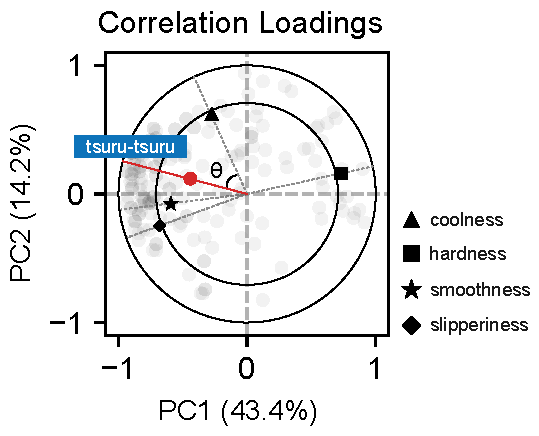
Overall, the sensory assessments showed that tsuru-tsuru (Figure 11) performed comparably with attributes like smoothness and slipperiness. Tsuru-tsuru allowed participants to properly distinguish samples, including features like weave direction. Participants demonstrated a high level of agreement when using tsuru-tsuru, implying that participants shared similar perceptions and understanding of what the attribute means.
Preference assessments indicated that participants liked fabric samples with the qualities of tsuru-tsuru. Moreover, results showed polarization in the preference for warm/cool feelings. The clustering analysis revealed that participants had slightly differing interpretations of tsuru-tsuru in relation to smoothness, coolness, slipperiness, and hardness.
Establishing good communication with consumers is a crucial aspect of fabric design. Attributes such as smoothness and hardness may not be clearly understood by consumers. These findings collectively highlight the potential value of tsuru-tsuru as an attribute for describing and assessing textile surface properties by non-trained individuals.
Author Contributions
R.R.S. designed and supervised the experiments, analyzed the data and drafted the manuscript. N.K. performed the experiments. S.S. guided and supplied feedback and commented on the final format of the paper. All authors have read and agreed to the published version of the manuscript.
Funding
This research received no external funding.
Informed Consent Statement
Informed consent was obtained from all subjects involved in the study.
Data Availability Statement
Data are contained within the article.
Conflicts of Interest
The authors declare no conflict of interest.
Abbreviations
The following abbreviations are used in this manuscript:
KES-F
Kawabata Evaluation System for Fabrics
MIU
Coefficient of Friction
MMD
Mean Deviation of MIU
SMD
Surface Roughness
LT
Linearity of Tensile
WT
Tensile Energy
RT
Tensile Resilience
LC
Linearity of Compression
WC
Compression Energy
RC
Compression Resilience
qmax
Maximum value of heat flux
PCA
Principal Component Analysis
PCR
Principal Component Regression
Appendix A
Appendix A.1. Fabric Sample Physical Properties
Table A1.
Characteristic values and standard conditions of measurement of the physical properties.
Table A1.
Characteristic values and standard conditions of measurement of the physical properties.
Property
Symbol
Characteristic Value
Unit
Measurement Condition
Compression
LC
Linearity of compression displacement curve
-
Maximum pressure, Pm = 5 kPa
WC
Compression energy
J/m
Rate of compression = 20 µm/s
RC
Compression resilience
%
Tensile
LT
Linearity of tensile displacement curve
-
Maximum tensile load: 490 N/m
WT
Tensile energy
J/m
Tensile speed = 0.2 mm/s
RC
Tensile resilience
%
Surface
MIU
Coefficient of friction
-
20 steel piano wires with 0.5 mm diameter and 10 mm length.
MMD
Mean deviation of MIU
-
Contact force = 0.49 N
SMD
Geometrical roughness
µm
Steel piano wire with 0.5 mm diameter and 5 mm length. Contact force = 0.1 N
Thickness
T
Thickness at pressure of 49.0 Pa
mm
Weight
W
Fabric weight per unit area
g/m
q
q
Maximum value of heat flux
W/m
T = 10 C
Table A2.
Physical properties measured using the KES-F system of machines.
Table A2.
Physical properties measured using the KES-F system of machines.
Sample
LC
WC (J/m2)
RC (%)
LT
WT (J/m2)
RT (%)
MIU
MMD
SMD (µm )
qmax (kW/m2)
Warp
Weft
Warp
Weft
Warp
Weft
Warp
Weft
Warp
Weft
Warp
Weft
1
0.56
0.10
44.90
0.67
0.64
1.53
7.89
51.43
57.29
0.32
0.56
0.004
0.007
0.76
3.68
0.18
2
0.38
0.05
41.46
0.69
0.74
0.51
2.80
57.06
58.12
0.27
0.37
0.004
0.014
0.73
1.96
0.23
3
0.50
0.06
57.11
0.61
0.72
0.60
4.17
59.18
51.53
0.25
0.45
0.003
0.010
0.63
1.20
0.20
4
0.33
0.13
43.09
0.95
1.06
14.38
14.91
72.24
82.92
0.43
0.43
0.007
0.013
2.10
2.54
0.13
5
0.37
0.14
54.09
1.02
0.96
3.69
5.76
79.08
64.73
0.33
0.40
0.012
0.013
2.83
2.37
0.15
6
0.49
0.13
42.05
0.72
0.79
2.39
13.10
62.90
43.30
0.41
0.43
0.005
0.006
0.77
1.64
0.13
7
0.54
0.11
46.79
0.64
0.68
2.15
6.36
65.01
54.15
0.29
0.35
0.009
0.015
1.87
2.63
0.16
8
0.41
0.13
50.54
1.01
1.09
20.75
10.57
69.90
81.60
0.34
0.45
0.024
0.013
1.22
2.34
0.15
9
0.44
0.20
45.12
0.76
0.75
0.54
3.47
64.25
75.35
0.48
0.64
0.006
0.008
1.79
2.49
0.11
10
0.42
0.58
37.54
0.83
0.67
1.22
5.41
57.58
58.33
0.32
0.39
0.035
0.028
4.58
2.53
0.09
11
0.48
0.07
37.97
0.90
0.84
0.36
0.61
43.60
62.68
0.34
0.25
0.009
0.046
2.27
2.01
0.20
12
0.20
0.11
56.61
0.78
0.86
1.91
0.95
92.30
92.70
0.33
0.28
0.008
0.010
1.96
1.97
0.22
13
0.27
0.10
52.70
0.79
0.79
0.97
2.93
82.12
87.32
0.20
0.28
0.009
0.008
2.34
2.09
0.20
14
0.51
0.03
50.07
0.69
0.74
0.57
0.18
44.19
64.62
0.16
0.19
0.009
0.010
0.96
0.79
0.25
15
0.20
0.09
37.31
0.84
0.87
0.11
0.52
64.83
45.73
0.14
0.14
0.010
0.009
1.66
0.91
0.26
16
0.17
0.11
38.80
0.74
0.65
0.32
0.54
54.65
66.81
0.15
0.21
0.009
0.010
2.09
1.79
0.18
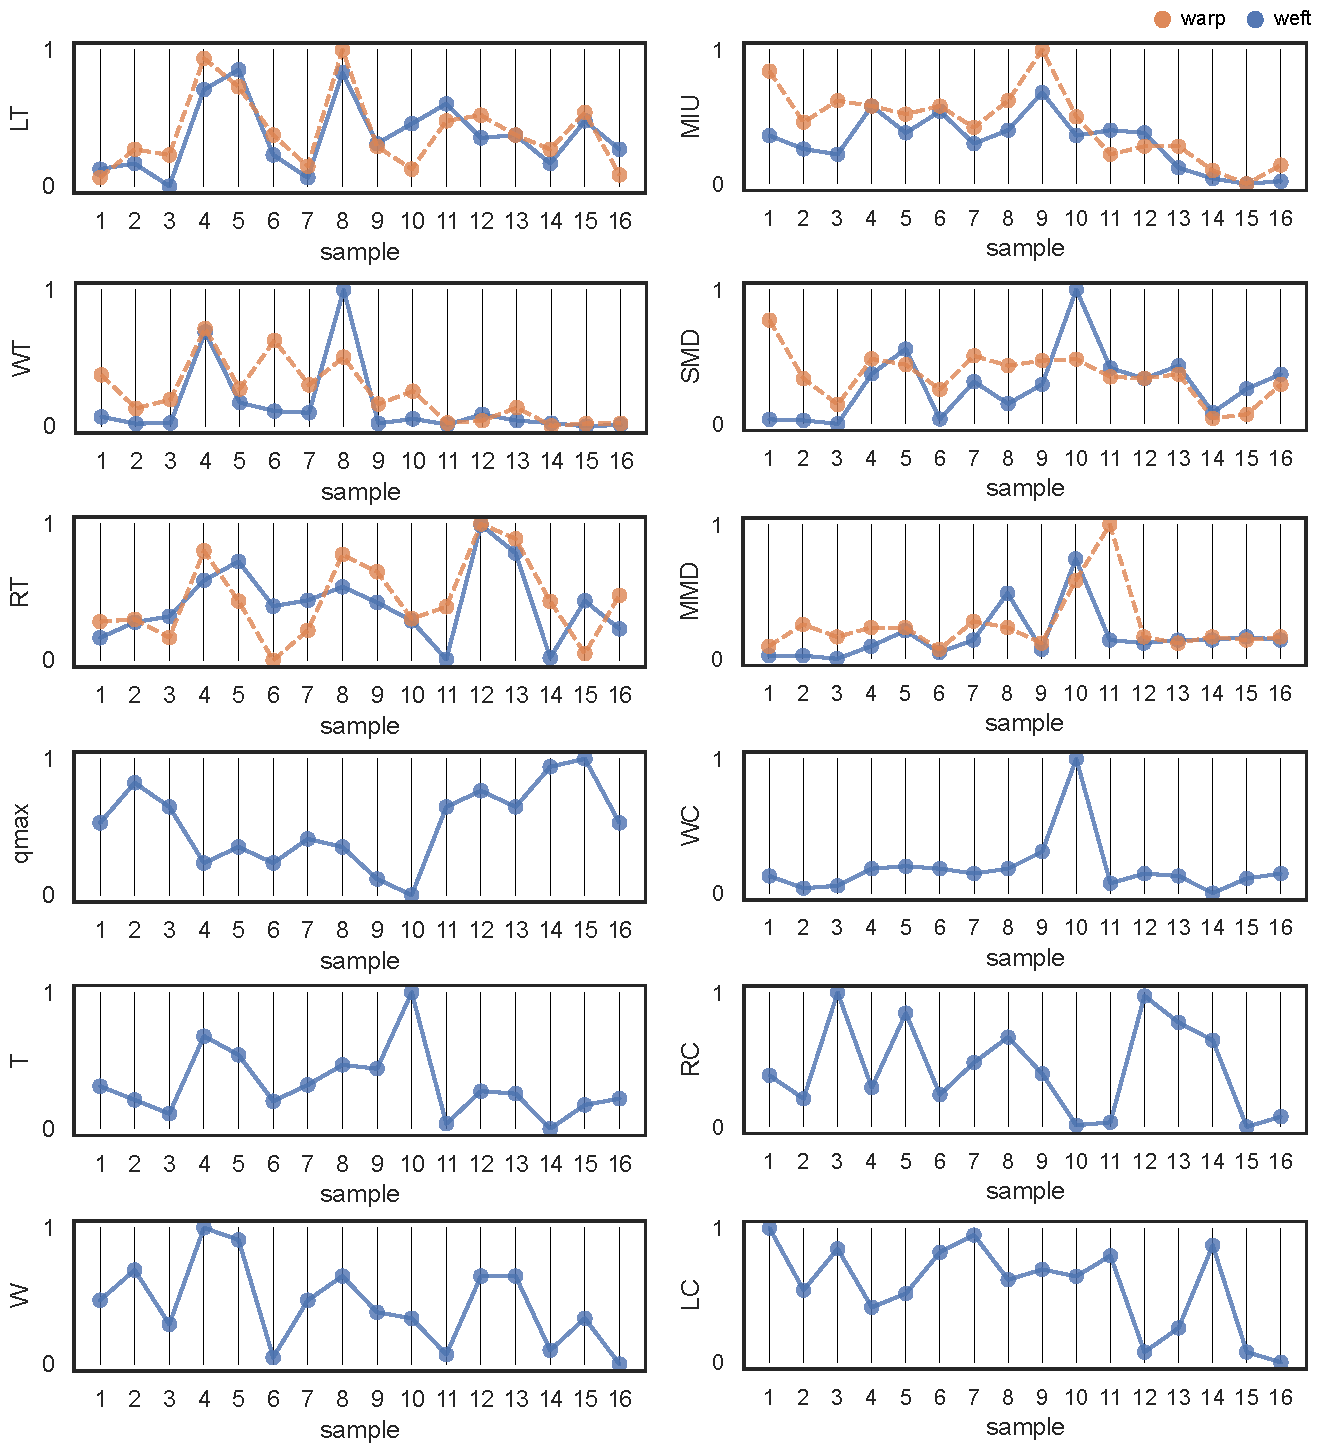
Figure A1.
Fabric physical properties measured using the KES-F system. Parameters are normalized between 0 and 1.
Figure A1.
Fabric physical properties measured using the KES-F system. Parameters are normalized between 0 and 1.
Appendix A.2. Software
The analysis was carried out using Python version 3.11 as the base language. NumPy version 1.25.2 and Pandas version 2.0.3 were used for data manipulation. Matplotlib version 3.7.2 was used to generate the plots. For statistical analysis, Statsmodels version 0.14.0 was utilized. Principal Component Analysis (PCA) was conducted using statsmodels.api, PCR was conducted using statsmodels.api.PCA, and regression used statsmodels.api.OLS. Hierarchical clustering was performed using scipy.cluster.hierarchy from scipy version 1.11.3.
References
Ares, G.; Varela, P. Trained vs. consumer panels for analytical testing: Fueling a long lasting debate in the field. Food Qual. Prefer.2017, 61, 79–86. [Google Scholar] [CrossRef]
Okamoto, S.; Nagano, H.; Ho, H.N. Psychophysical dimensions of material perception and methods to specify textural space. In Pervasive Haptics: Science, Design, and Application; Springer: Tokyo, Japan, 2016; pp. 3–20. [Google Scholar]
Komiya, K.; Kotani, Y. Classification of Japanese onomatopoeias using hierarchical clustering depending on contexts. In Proceedings of the 2011 Eighth International Joint Conference on Computer Science and Software Engineering (JCSSE), Nakhonpathom, Thailand, 11–13 May 2011; pp. 108–113. [Google Scholar]
Etzi, R.; Spence, C.; Zampini, M.; Gallace, A. When sandpaper is ‘Kiki’ and satin is ‘Bouba’: An exploration of the associations between words, emotional states, and the tactile attributes of everyday materials. Multisensory Res.2016, 29, 133–155. [Google Scholar] [CrossRef] [PubMed]
Nagatomo, T.; Hiraki, T.; Ishizuka, H.; Miki, N. Unsupervised learning enables extraction of tactile information from text database. IEEE Access2021, 11, 101155–101166. [Google Scholar] [CrossRef]
Toshihiro, W.; Skrzypczak, E.R.; Snowden, P. Kenkyusha’s New Japanese-English Dictionary, 5th ed.; Kenkyusha: Tokyo, Japan, 2003. [Google Scholar]
Yamagata, K.; Kwon, J.; Kawashima, T.; Shimoda, W.; Sakamoto, M. Computer Vision System for Expressing Texture Using Sound-Symbolic Words. Front. Psychol.2021, 12, 654779. [Google Scholar] [CrossRef]
Kawabata, S. The Standardization and Analysis of Hand Evaluation, 2nd ed.; Textile Machinery Society of Japan: Osaka, Japan, 1980. [Google Scholar]
Tucker, L.R. The extension of factor analysis to three-dimensional matrices. In Contributions to Mathematical Psychology; Holt, Rinehart, and Winston: New York, NY, USA, 1964; pp. 109–127. [Google Scholar]
Joliffe, I.T.; Morgan, B. Principal component analysis and exploratory factor analysis. Stat. Methods Med. Res.1992, 1, 69–95. [Google Scholar] [CrossRef] [PubMed]
Næs, T.; Brockhoff, P.B.; Tomic, O. Statistics for Sensory and Consumer Science; John Wiley & Sons: Hoboken, NJ, USA, 2011. [Google Scholar]
Figure 1.
Photographs of the fabric samples taken under a microscope. Samples 1–8 were woven, and samples 9–16 were knitted. Samples No. 2 and No. 3, composed of polyester fibers, are frequently employed in summer underwear, commonly associated with the tactile sensation known as tsuru-tsuru in Japan.
Figure 2.
Data set used in the ranking sensory analysis.
Figure 2.
Data set used in the ranking sensory analysis.
Figure 3.
Tucker-1 matrix unfolding. The 3-way matrix is unfolded horizontally into a 2-way matrix. The new columns represent participant-attribute pairs.
Figure 3.
Tucker-1 matrix unfolding. The 3-way matrix is unfolded horizontally into a 2-way matrix. The new columns represent participant-attribute pairs.
Figure 4.
Data set used in the second experiment.
Figure 4.
Data set used in the second experiment.
Figure 5.
The regression loadings matrix (Equation (5)) was used to calculate the cosine distance between tsuru-tsuru and other attributes. Plot shows regression loadings with Participant 1 highlighted.
Figure 5.
The regression loadings matrix (Equation (5)) was used to calculate the cosine distance between tsuru-tsuru and other attributes. Plot shows regression loadings with Participant 1 highlighted.
Figure 6.
(Top row) Scores and (bottom row) correlation loadings from the ranking experiment. The scores represent the relationship among the samples as ranked by the participants. Red markers on scores plots represent samples chosen for the descriptive analysis. The correlation loadings depict the agreement among participants.
Figure 7.
(a) Cumulative explained variance, (b) scores and (c) correlation loadings for the descriptive sensory experiment. The same correlation loadings plot is shown multiple times, with each attribute highlighted individually (red markers), while the markers for the other attributes are dimmed. This representation is particularly helpful in visualizing the level of agreement for each sensory attribute.
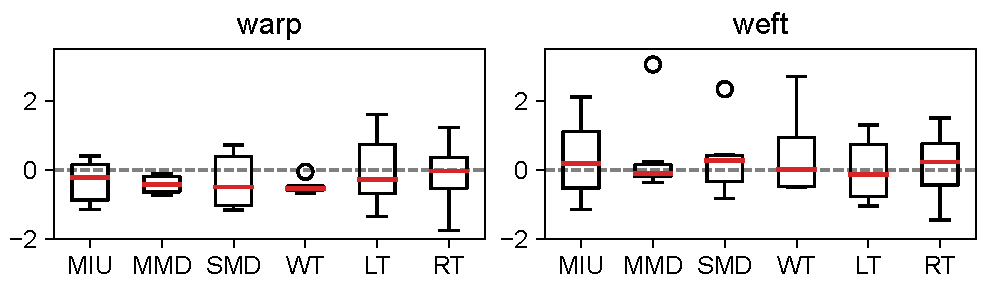
Figure 8.
Box plot of standardized physical properties. Overall, the warp direction exhibits smaller values for physical properties that are direction-dependent.
Figure 8.
Box plot of standardized physical properties. Overall, the warp direction exhibits smaller values for physical properties that are direction-dependent.
Figure 9.
Principal component regression. (a) Scores, (b) loadings, (c) regression of physical properties onto the first 5 principal components. The darkness of the marker corresponds to the magnitude of the explained variance (R²). Significant attributes (p-value < 0.05) are depicted with either a full or half black fill. Markers lacking a fill were not significant. A full fill indicates significance in both principal components, while a half fill represents significance only in the second component.
Figure 10.
(a) Dendrogram depicting the results of the cluster analysis of the cosine distances between the attribute tsuru-tsuru and the attributes smoothness, slipperiness, coolness, and hardness using the first five principal components of the loadings matrix. (b) PCA was applied to the cosine distances matrix for easier visualization of clusters.
Figure 11.
Box plot visualizations of each cluster. The y-axis indicates the cosine distance between tsuru-tsuru and the other attributes. Cosine distance values range between 0 and 2, with lower values indicating greater similarity.
Figure 11.
Box plot visualizations of each cluster. The y-axis indicates the cosine distance between tsuru-tsuru and the other attributes. Cosine distance values range between 0 and 2, with lower values indicating greater similarity.
Table 1.
Sample properties.
Table 1.
Sample properties.
Sample No.
Fiber (%)
Yarn Density
Thickness (mm)
Weight (g/m2)
knitted
wales/cm
courses/cm
1
POM100
24.6
50.0
0.55
170
2
P100
23.6
27.9
0.44
220
3
P100
20.9
28.2
0.33
130
4
P89/Pu11
24.3
19.3
0.95
290
5
P86/Pu14
12.3
24.3
0.80
270
6
P100
22.5
18.6
0.43
75
7
P100
19.3
20.8
0.56
170
8
P85/Pu15
40.8
25.5
0.72
210
woven
ends/cm
picks/cm
9
P100
14.1
51.6
0.69
150
10
C100
20.0
28.5
1.30
140
11
P100
73.5
44.4
0.25
80
12
W100
34.4
25.8
0.51
210
13
W100
21.1
24.9
0.49
210
14
P100
52.4
46.9
0.21
87
15
P77/C23
72.5
87.0
0.40
140
16
S50/C50
47.0
13.8
0.45
64
POM: Polyacetal, P: Polyester, Pu: Polyurethane, C: Cotton, S: Silk, W: Wool. Thickness was measured under a pressure of 49.0 Pa. using the KES-G5 compression tester (Kato Tech Co., Ltd., Kyoto, Japan).
Disclaimer/Publisher’s Note: The statements, opinions and data contained in all publications are solely those of the individual author(s) and contributor(s) and not of MDPI and/or the editor(s). MDPI and/or the editor(s) disclaim responsibility for any injury to people or property resulting from any ideas, methods, instructions or products referred to in the content.
Romao Santos, R.; Katayama, N.; Sukigara, S.
Investigation of Japanese Onomatopoeia Tsuru-Tsuru as a Suitable Sensory Attribute for Perception of Surface Properties of Textiles by Non-Trained Individuals. Textiles2023, 3, 438-453.
https://doi.org/10.3390/textiles3040026
AMA Style
Romao Santos R, Katayama N, Sukigara S.
Investigation of Japanese Onomatopoeia Tsuru-Tsuru as a Suitable Sensory Attribute for Perception of Surface Properties of Textiles by Non-Trained Individuals. Textiles. 2023; 3(4):438-453.
https://doi.org/10.3390/textiles3040026
Chicago/Turabian Style
Romao Santos, Raphael, Nozomi Katayama, and Sachiko Sukigara.
2023. "Investigation of Japanese Onomatopoeia Tsuru-Tsuru as a Suitable Sensory Attribute for Perception of Surface Properties of Textiles by Non-Trained Individuals" Textiles 3, no. 4: 438-453.
https://doi.org/10.3390/textiles3040026
Article Metrics
No
No
Article Access Statistics
For more information on the journal statistics, click here.
Multiple requests from the same IP address are counted as one view.
Romao Santos, R.; Katayama, N.; Sukigara, S.
Investigation of Japanese Onomatopoeia Tsuru-Tsuru as a Suitable Sensory Attribute for Perception of Surface Properties of Textiles by Non-Trained Individuals. Textiles2023, 3, 438-453.
https://doi.org/10.3390/textiles3040026
AMA Style
Romao Santos R, Katayama N, Sukigara S.
Investigation of Japanese Onomatopoeia Tsuru-Tsuru as a Suitable Sensory Attribute for Perception of Surface Properties of Textiles by Non-Trained Individuals. Textiles. 2023; 3(4):438-453.
https://doi.org/10.3390/textiles3040026
Chicago/Turabian Style
Romao Santos, Raphael, Nozomi Katayama, and Sachiko Sukigara.
2023. "Investigation of Japanese Onomatopoeia Tsuru-Tsuru as a Suitable Sensory Attribute for Perception of Surface Properties of Textiles by Non-Trained Individuals" Textiles 3, no. 4: 438-453.
https://doi.org/10.3390/textiles3040026


