1. Introduction
The sixth assessment report (AR6) released by the Intergovernmental Panel on Climate Change (IPCC) states that the impacts of human action on climate change are real and irreversible. They will worsen if nothing is done to mitigate these impacts [
1]. According to AR6, currently, between a quarter and a third of the land’s net primary-production potential is used for producing food, animal feed, fiber, wood, and energy, demonstrating that ecosystem services are based on what biomes offer.
Similarly, the Sustainable Development Goals (SDGs) have achieved broad recognition by claiming that stewardship of terrestrial ecosystems, particularly forests and their rich biodiversity, is essential for maintaining life on Earth [
2]. One of the targets of SDG 15—Life on Land—determines the conservation, restoration, and sustainable use of terrestrial ecosystems and their services, in particular forests and drylands [
3].
Caatinga is an ecologically rich and seasonally dry tropical forest (SDTF) located in the semiarid region of Brazil. The Brazilian Caatinga has well-defined environmental and social importance, as the local population has developed solid cultural traditions. The economy is based on livestock and family farming [
4,
5] which are directly interconnected with the ecosystem services offered by this domain.
This region has approximately 4479 vegetable species and significant endemic species. It is located across ten Brazilian federal states. However, biological and genetic heritage are not often discussed in the literature [
6,
7]. Therefore, studies on the conservation of such a strategic biome are essential.
Caatinga forest is at risk, due to five centuries of natural-resources exploration and future trends of a drier climate in the biome [
8,
9]. The complexity of this biome, composed of different physiognomies, the unplanned use of natural resources, the irregular rainfall distribution with high interannual variability and very long dry periods, makes the region susceptible to desertification [
6,
10]. The absence of preservation policies, scientific gaps, and a proportionally low area under protection as conservation units compared to other biomes in Brazil, puts this entire region under pressure [
7,
11,
12].
There are many factors of environmental degradation in the Brazilian unique seasonally-dry-tropical-forest, the Caatinga, including deforestation, firewood extraction, mining, pasture, monoculture, and urban growth [
13]. Thus, the continuous monitoring of land-use and land-cover (LULC) changes in this large area, through remote sensing by cloud computing, is the appropriate tool to detect deforestation and biodiversity loss across the region.
Recently published articles studied the spatial and temporal dynamics of land-use and land-cover change in other domains of Brazil [
14,
15,
16]. However, there is still a lack of knowledge in mapping native vegetation with the complexity and seasonality of the Caatinga domain. The Google Earth Engine (GEE) platform currently appears as a tool for new studies, intended to produce large-scale assessments of LULC changes in Brazil and worldwide, especially in tropical forests such as the Amazon. However, similar efforts are less frequent for the Caatinga domain. Most recent studies use Landsat time series, since moderate-spatial-resolution data (30 m) are the most suitable for regional analyses [
10,
17,
18].
Semi-arid environments are mainly characterized by alternating rainy and dry seasons (seasonality), with rainfall concentrated in a few months of the year. These uncertainties in the timing and the quality of rainy and dry seasons pose significant threats to the conservation of the native forest and its biodiversity [
9]. Rainfall is one of the most important drivers of ecosystem dynamics and productivity, and the rainfall anomaly also represents a challenge for monitoring LULC changes. Thus, the characterization of the rainfall regime within semi-arid environments is essential for studies that seek to map LULC changes. since the variation of the start- and end-dates of the rainy season is critical to the total amount of rainfall during the season and for the vegetation productivity [
9,
19,
20].
From a societal viewpoint, the dates of the onset and end of the rainy season, as well as the amount of accumulated seasonal rainfall, are essential for agriculture, for example. On the other hand, the meteorological data is related to the beginning and end of the rainy season, representing sudden changes in the heat source of the tropical atmosphere. Its rate determines the magnitude of this source. In a recent study, the authors used remote-sensing products interpolated with physical stations to generate the daily precipitation of regions from the CHIRPS satellite, which has data collection available on the GEE platform [
21].
In this study, we aim to monitor the native vegetation of the Campo Maior Complex (CMC) in the semi-arid region of Brazil from 2016 to 2020, considering the interannual variability of the rainy and dry seasons and discussing the trends and impacts of forest-degradation vectors. We used Landsat and CHIRPS satellite data recuperated and processed io the Google Earth Engine platform.
2. Materials and Methods
2.1. Study Area
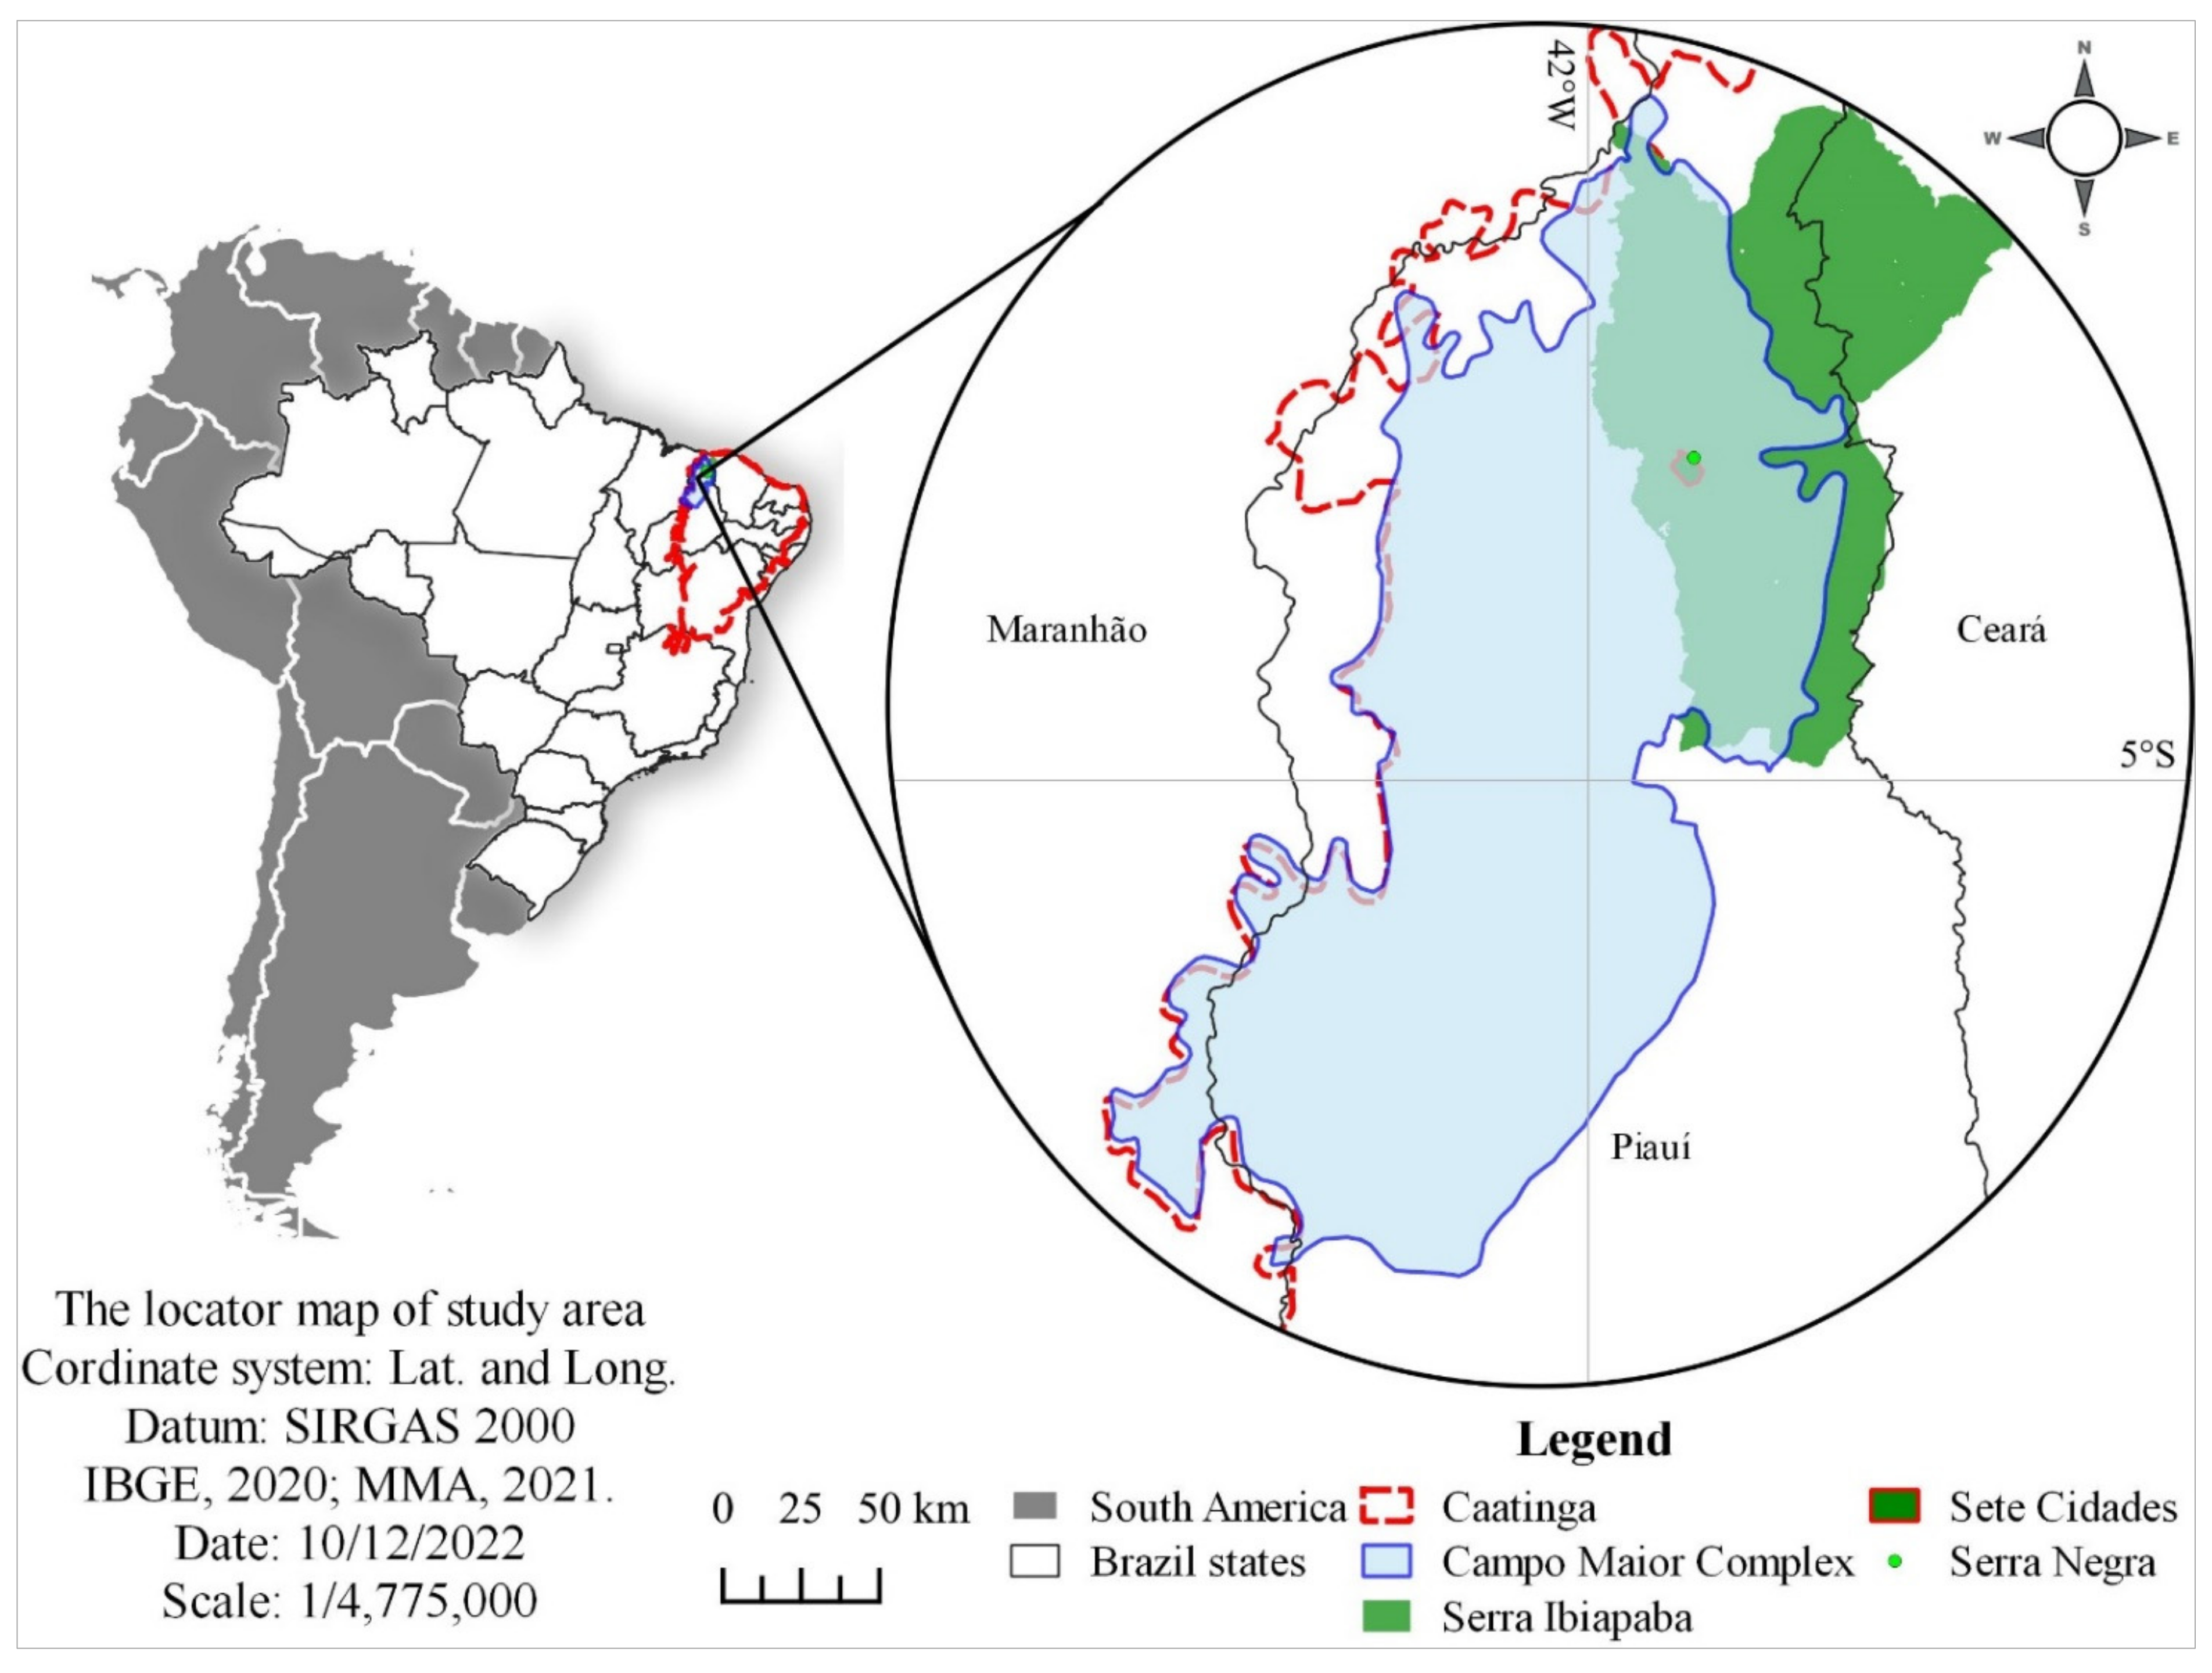
The Brazilian Caatinga is located in the northeast of the country, occupying an area of 844,453 km², representing 11% of the country’s territory, and covering in whole or in part the states of Bahia, Sergipe, Alagoas, Pernambuco, Paraíba, Rio Grande do Norte, Ceará, Maranhão, Minas Gerais, and Piauí [
13].
The Campo Maior Complex, with 41,420 km², is located almost entirely in Piauí state (76 municipalities), with a small part in Maranhão state (5 municipalities). More precisely, the CMC is in the northwest of Caatinga, with a population of 2,119,688 inhabitants, with 74% of these inhabitants residing in urban areas. These conservation units (CUs) are located within the CMC: Sete Cidades National Park, Recanto da Serra Negra Natural Reserve, and Serra Ibiapaba Environmental Preservation Area [
22,
23,
24]. The perennial rivers named Longá, Poti, and Parnaíba are present in the area. The CMC is an ecotone between the savanna-like Cerrado and Caatinga.
The CMC is located in a semi-arid environment, characterized by long dry periods and irregular rainfall, concentrated in a short rainy season, with an average annual precipitation of 1300 mm. The climate in the region is similar to the one in almost all the territory of the Brazilian Caatinga. Thus, the studies and analyses of the interannual variability of rainfall are essential for this region, due to the water stress and the unstable conditions of foliar maintenance of the vegetation [
25].
According to Velloso, Sampaio and Pareyn [
22], herbaceous vegetation is predominant in the CMC, highlighting the fact that the physiognomy is similar to the African savannah. In the floodplains, it is possible to detect the presence of carnaubas (native palms). Non-flooded regions are characterized by the presence of shrubby-tree vegetation composed of some Cerrado elements [
25].
Figure 1 presents the location of the study area.
2.2. Long-Term Rainy- and Dry-Season Characterization
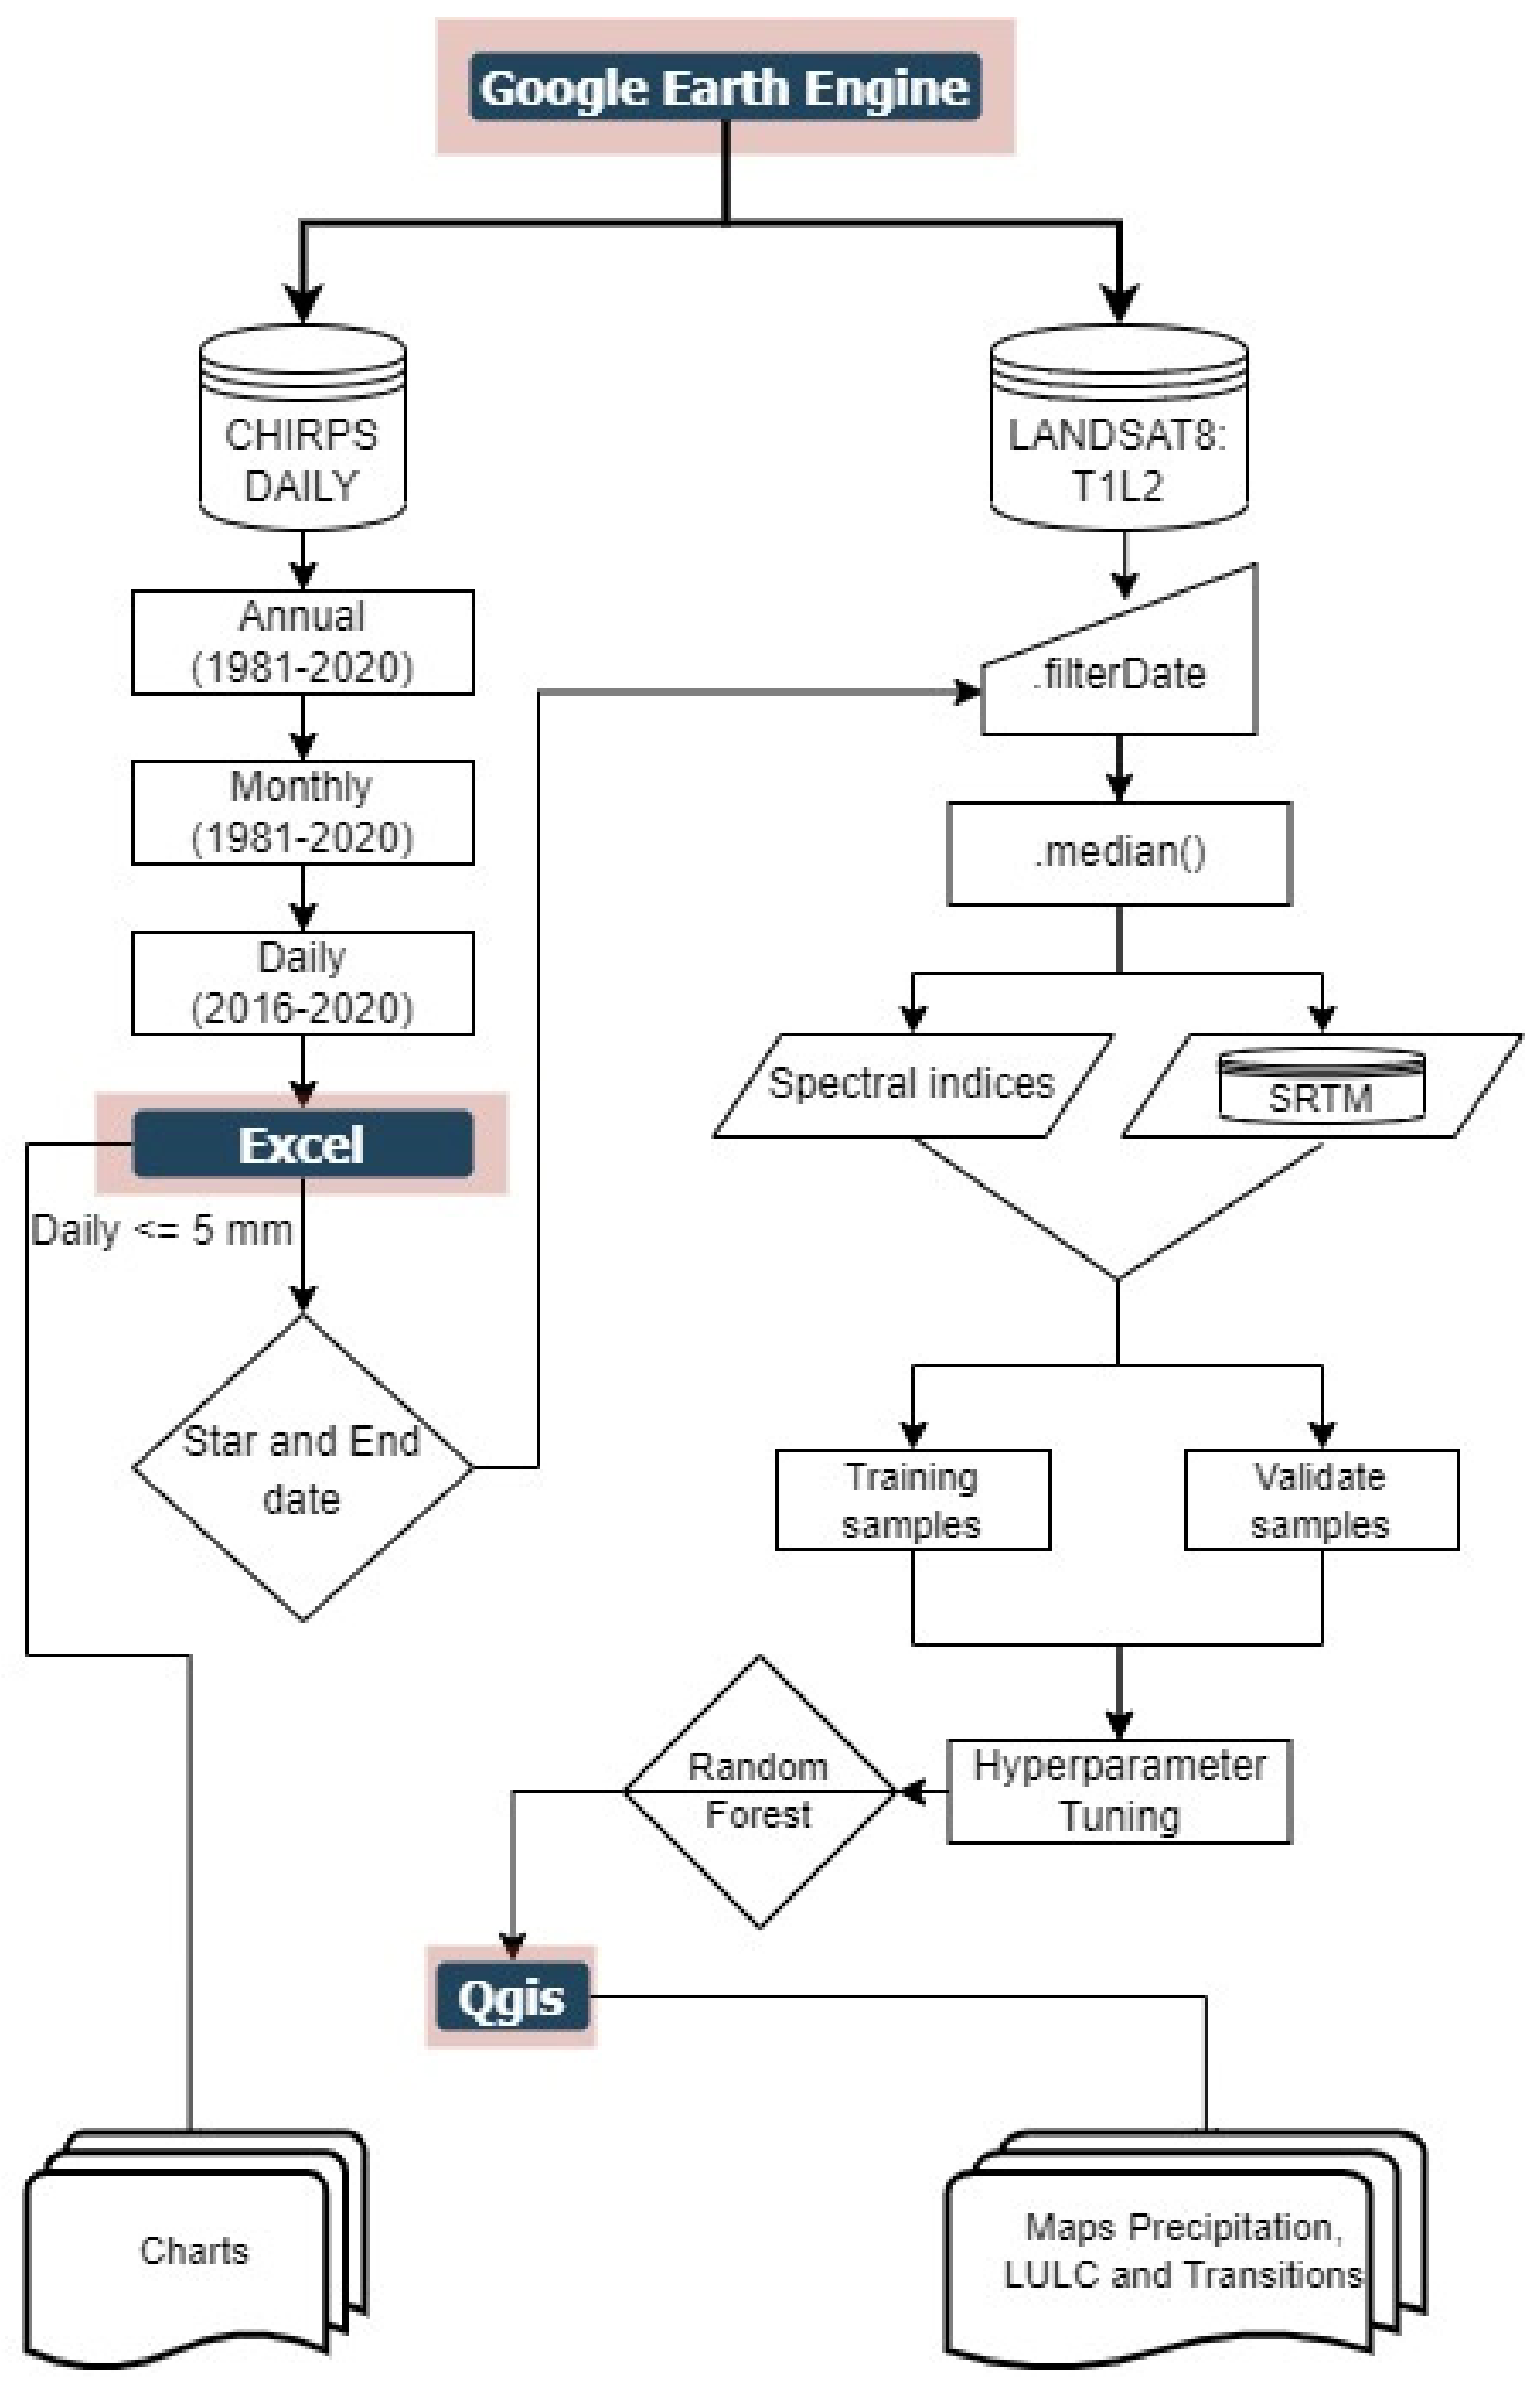
The Climate Hazards Group Infrared Precipitation with Station (CHIRPS) data are available on the Google Earth Engine platform, with over 30 years of data at 0.05° spatial resolution. These data are obtained through remote-sensing estimates and terrestrial meteorological stations, and issued to create, analyze, and detect trends in the time series of the rainfall and drought regimes [
21]. We used this database to characterize the CMC’s long-term rainy and dry seasons from the 1981 to 2020 period. This 39-year-long period exceeds the time period used in climatology to define normals (30 years) [
9].
CHIRPS data were downloaded to identify the most significant period of consecutive days with a daily mean of rainfall below 5 mm [
26]. Obtaining and filtering the rainy data was essential for this study, because the vegetation in the region is sensitive to changes due to rainfall. This procedure allowed a better interpretation of the targets to be collected as samples for the land-use and land-cover classification method.
Figure 2 presents the flowchart of the procedure workflow.
MS Excel was used to determine the date period from logical functions (IF with AND), which was inserted as ‘.filterDate’ in the GEE platform for the LULC mapping period (2016–2020). This filtering represented the most extended period with an average daily precipitation of less than 5 mm/day for each year. In addition, MS Excel made the charts and tables used in this study.
2.3. Land-Use and Land-Cover (LULC)
We processed Operational Land Imager (OLI) and Thermal Infrared Sensor (TIRS) Landsat-8 (L8) data from 2016 to 2020 (five years), accessed via the Google Earth Engine (GEE) platform (
https://earthengine.google.com accessed on 1 October 2022). We used Collection 2, Level 2, which contains surface reflectance (SR) and land surface temperature (LST) derived from data produced by Landsat 8 OLI/TIRS sensors [
17]. We used multispectral bands at 30 m spatial resolution, and with five visible and near-infrared (VNIR) bands, plus two short-wave infrared (SWIR) bands.
Additional input variables were included in the procedure workflow. We added values from the Normalized Difference Water Index (NDWI), Enhanced Vegetation Index (EVI), Modified Normalized Difference Water Index (MNDWI), Soil Adjusted Vegetation Index (SAVI), and Normalized Bare Soil Index (NBDI) from Landsat-8, and the slope value from the Shuttle Radar Topography Mission (SRTM) [
27]. Afterward, a date reducer was applied in accordance with the beginning and end of the most extended period of consecutive days with daily mean precipitation less than 5 mm, obtained from CHIRPS.
For the classification processing, we selected the optimal parameters for the random forest (RF) algorithm from the literature. We tested and established the optimal parameters for the random forest (RF) algorithm, expecting to obtain the highest overall classification-accuracy possible. Several studies have used the number of trees as a parameter to select satisfactory results. Moreover, the literature shows that a large number of trees will provide a stable result for the classification results [
28], so we used 700 trees. As a second parameter for RF, we used the number of variables in each split equal to the square root of the number of total variables [
27,
29,
30].
The classification accuracy-assessment used the most popular metrics in the literature, overall accuracy (OA) and the kappa coefficient (KC). Training data were collected through visual interpretation, the most common method for determining thematic classes. We selected training samples from locations that did not change over time. To evaluate the effect of the training sample-sizes, we randomly split the total sampling-points into 80% for training data and 20% for validation data.
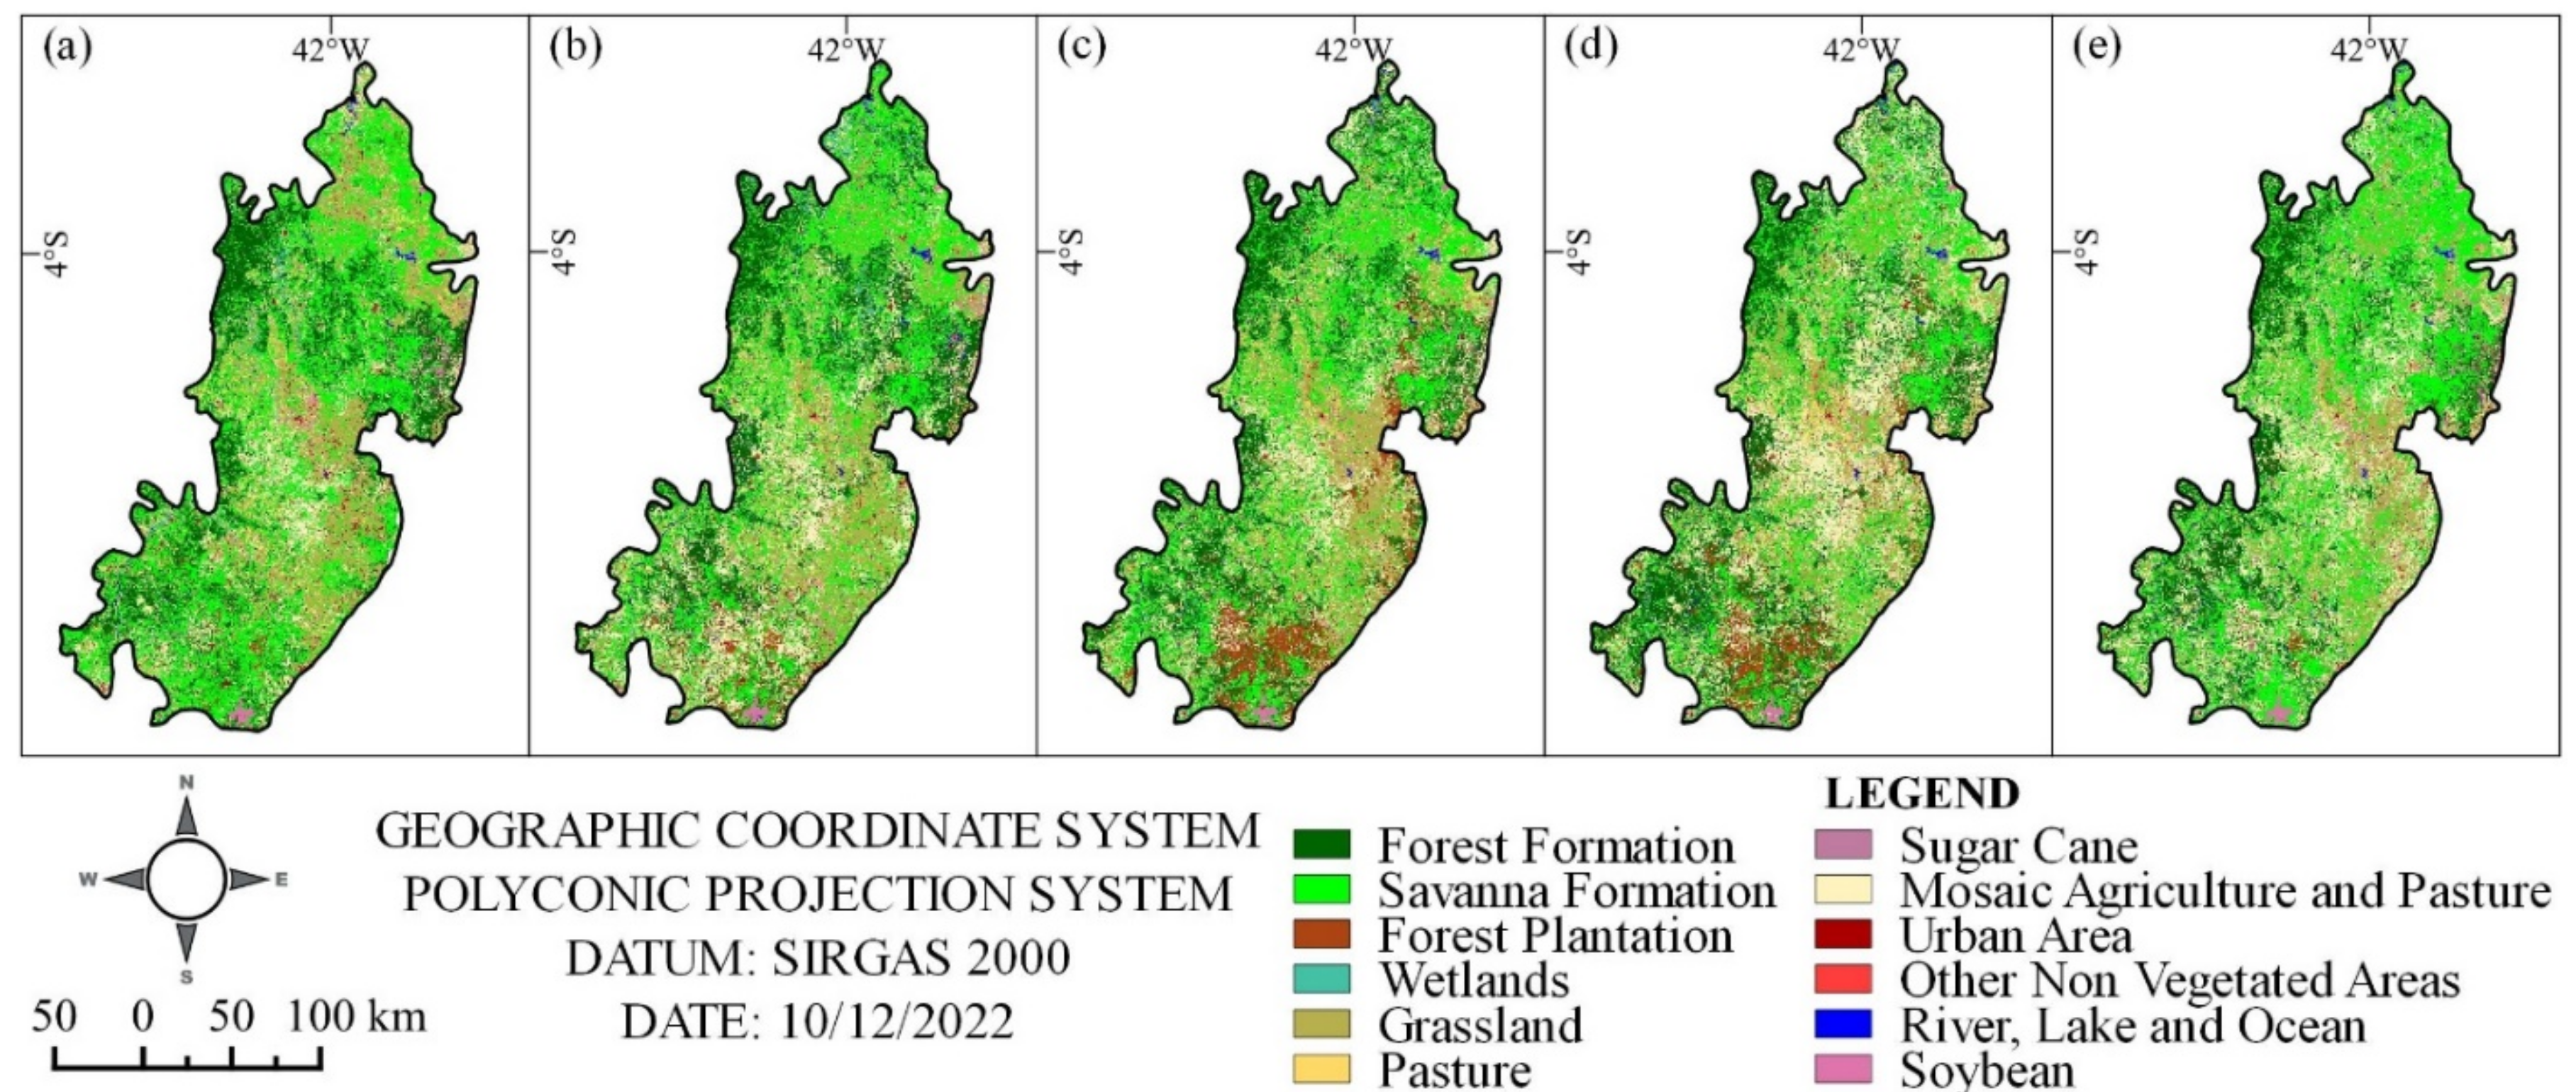
For 2018 and 2019, cloud cover was less than 15% and 40%, respectively. For the other years, the parameter was less than 10%. This difference is a consequence of the lack of better-quality data for full coverage of the CMC area. We considered the same subset of thematic land-use and land-cover (LULC) classes over time: Forest Formation; Savanna Formation; Forest Plantation; Wetlands; Grassland; Pasture; Sugar Cane; Mosaic Agriculture and Pasture; Urban Area; Other non-Vegetated Areas; River, Lake, and Ocean; and Soybean [
14].
The QGIS software was used to create the layout of the resulting maps. Its SPC plugin was used to process and quantify the LULC changes, the processing for detecting thematic-class changes among two images classified at different times, considering the base year of 2016. The product generated from LULC changes was organized into classes: Non-Natural Formation; Floodable Area; Deforestation; Regeneration; and Vegetation.
The Non-Natural Formation class indicates the permanence in some non-natural formation classes. The Floodable Area thematic type shows the differences between natural and non-natural classes for river, lake, and ocean. The Deforestation class indicates the changes of pixels from the natural vegetation (forest and savanna) formation to non-natural types. The Regeneration class suggests changes in pixels from a non-natural class to a natural-formation class. The Vegetation class indicates the permanence of the natural formation.
3. Results
3.1. The Rainfall Regime
On the GEE platform, using the CHIRPS time-series data, a code was created to characterize the annual-averaged precipitation from 1981 to 2020, the historical monthly-averaged precipitation from 1981 to 2020; and the daily averaged-precipitation from 2016 to 2020 for the CMC area (GEE script available at:
https://code.earthengine.google.com/?scriptPath=users%2FaulaGEE%2FAulaJS%3Aart1_ddma accessed on 15 October 2022).
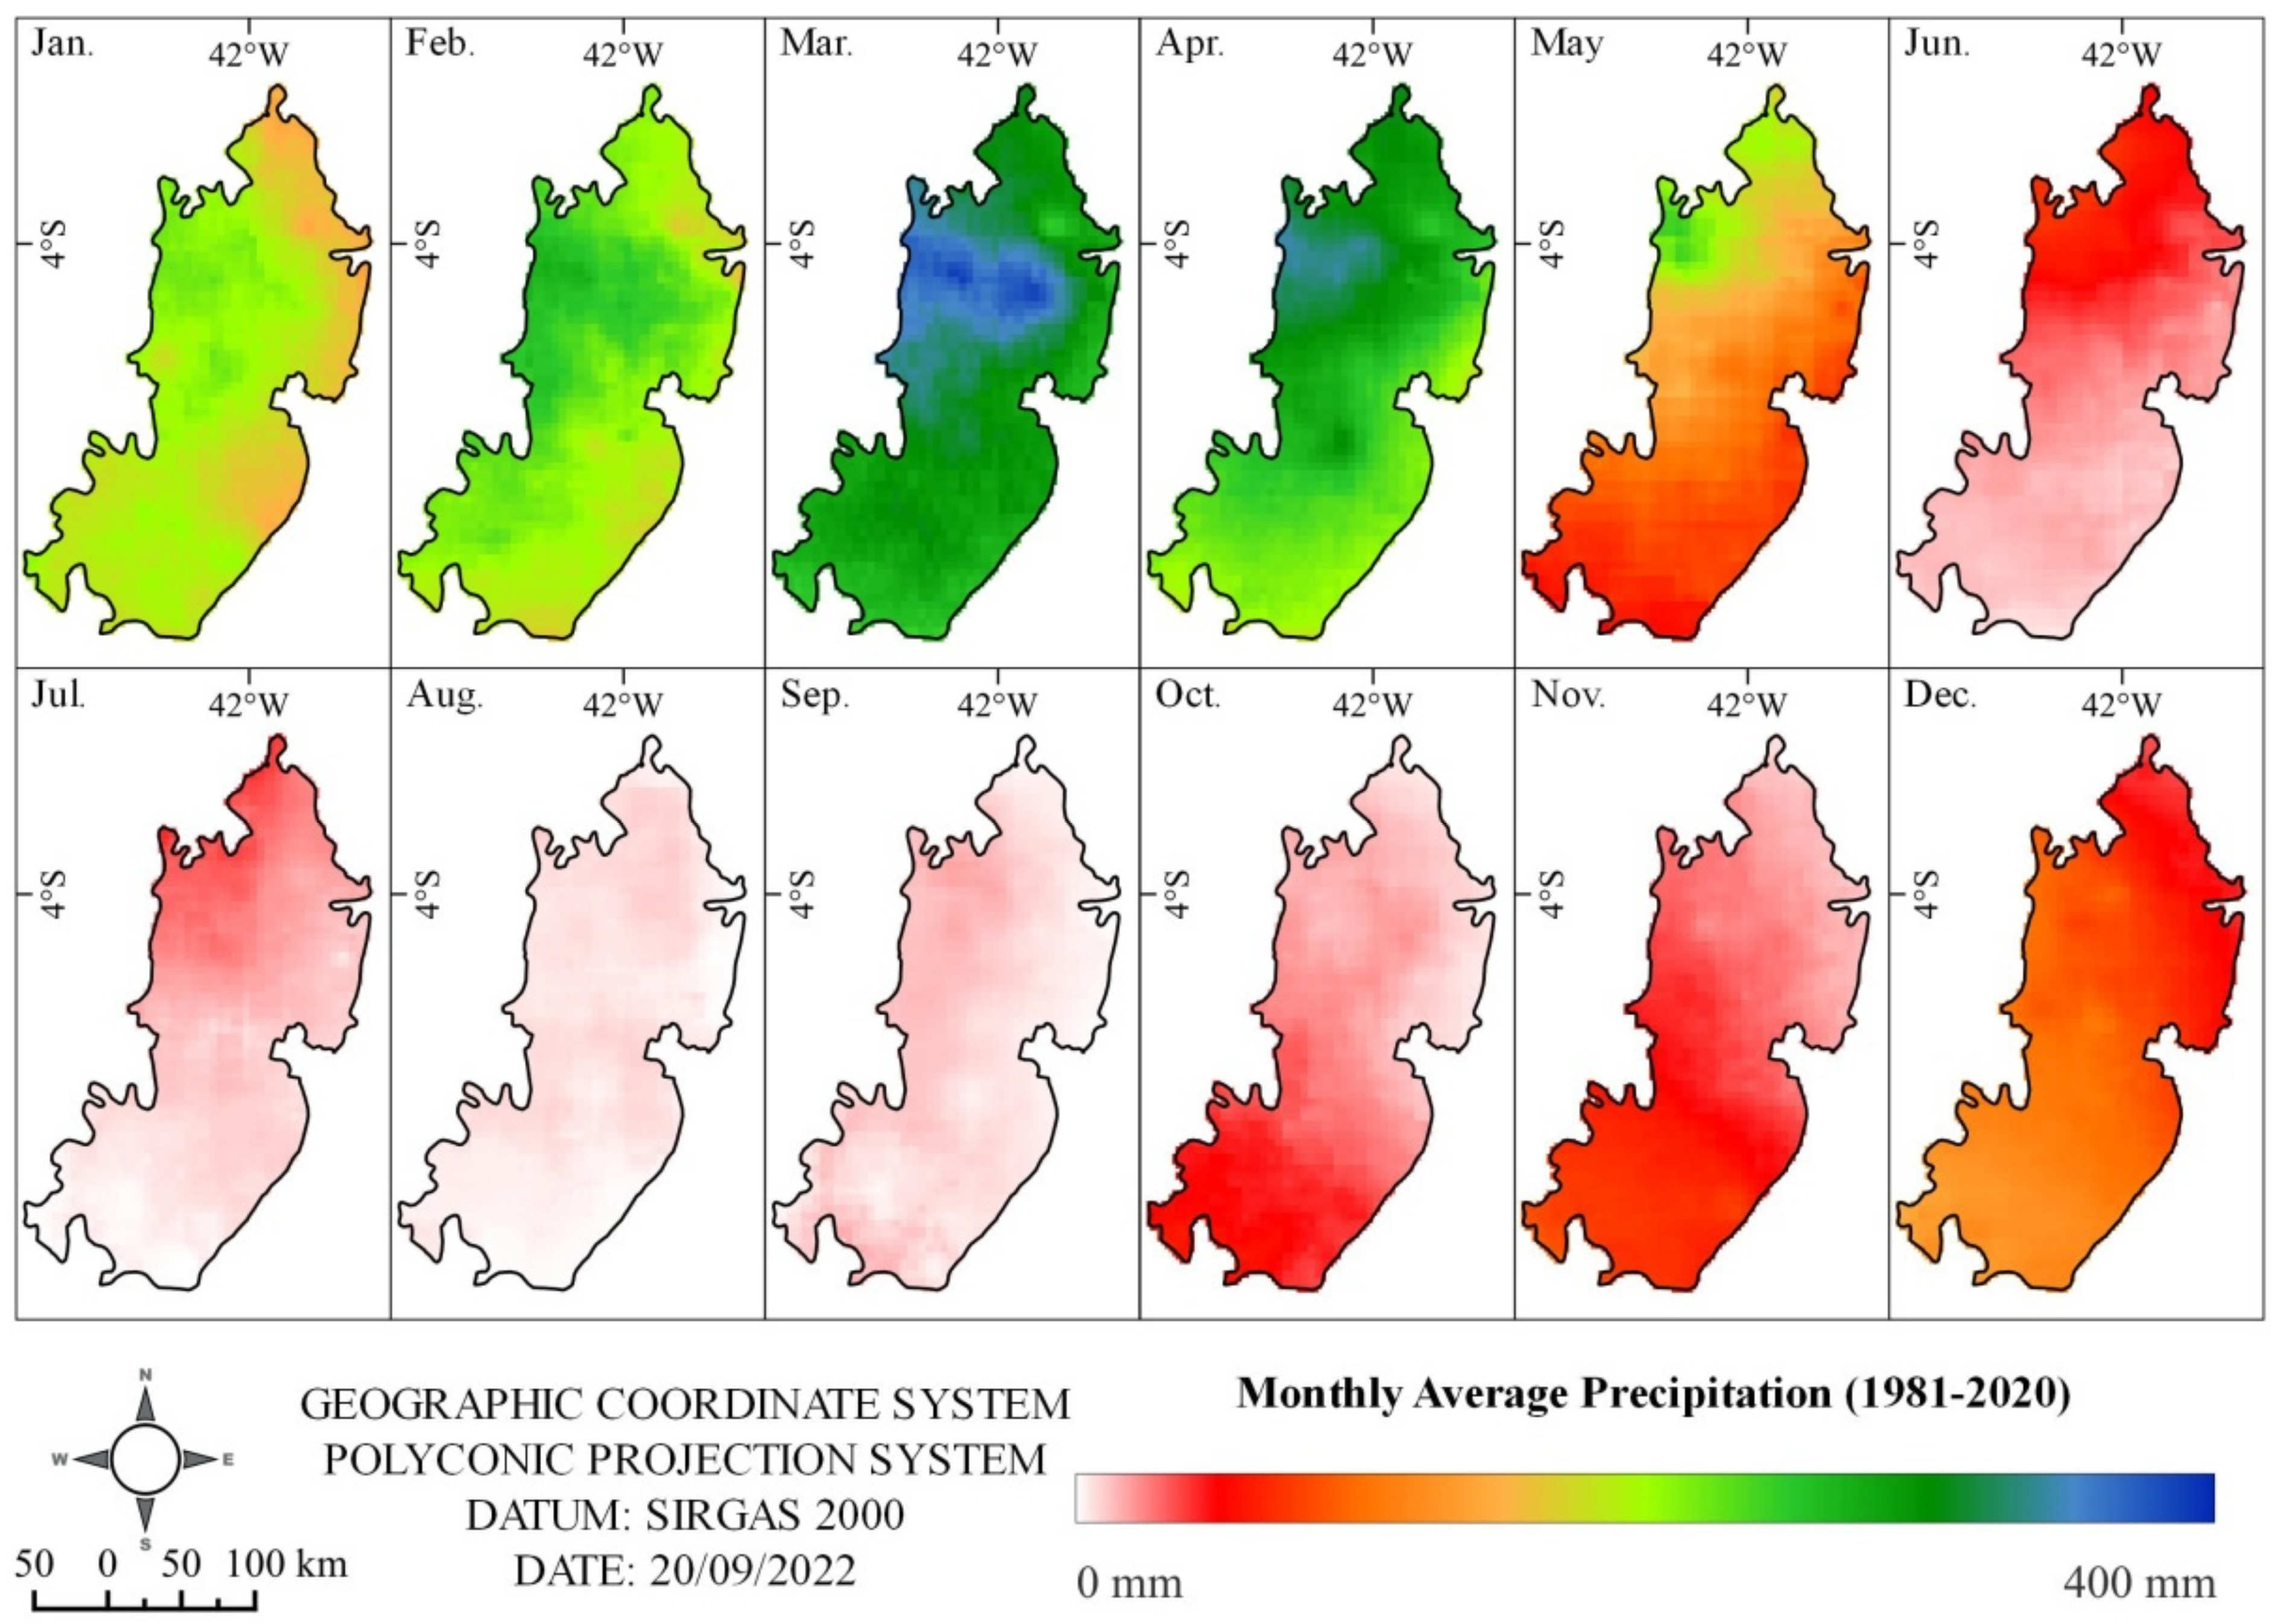
Figure 3 presents the maps generated for the historical monthly-averaged precipitation.
From
Figure 3, it is clear that in May there is a considerable drop in rainfall in the region, and the first four months of the year are the months with the highest precipitation. Even the months from June to December are characterized by less rainfall; the most critical periods for the lack of rain are in August and September.
The municipalities in the extreme south part of the CMC area are more exposed to a lack of rain. Consequently, they are more vulnerable to the maintenance of the ecosystem services provided by the green vegetation [
13]. A pattern of decreasing precipitation from west to east coincides with the Amazon–Cerrado–Caatinga transition, which presents a decreasing-rainfall regime on a larger scale [
31].
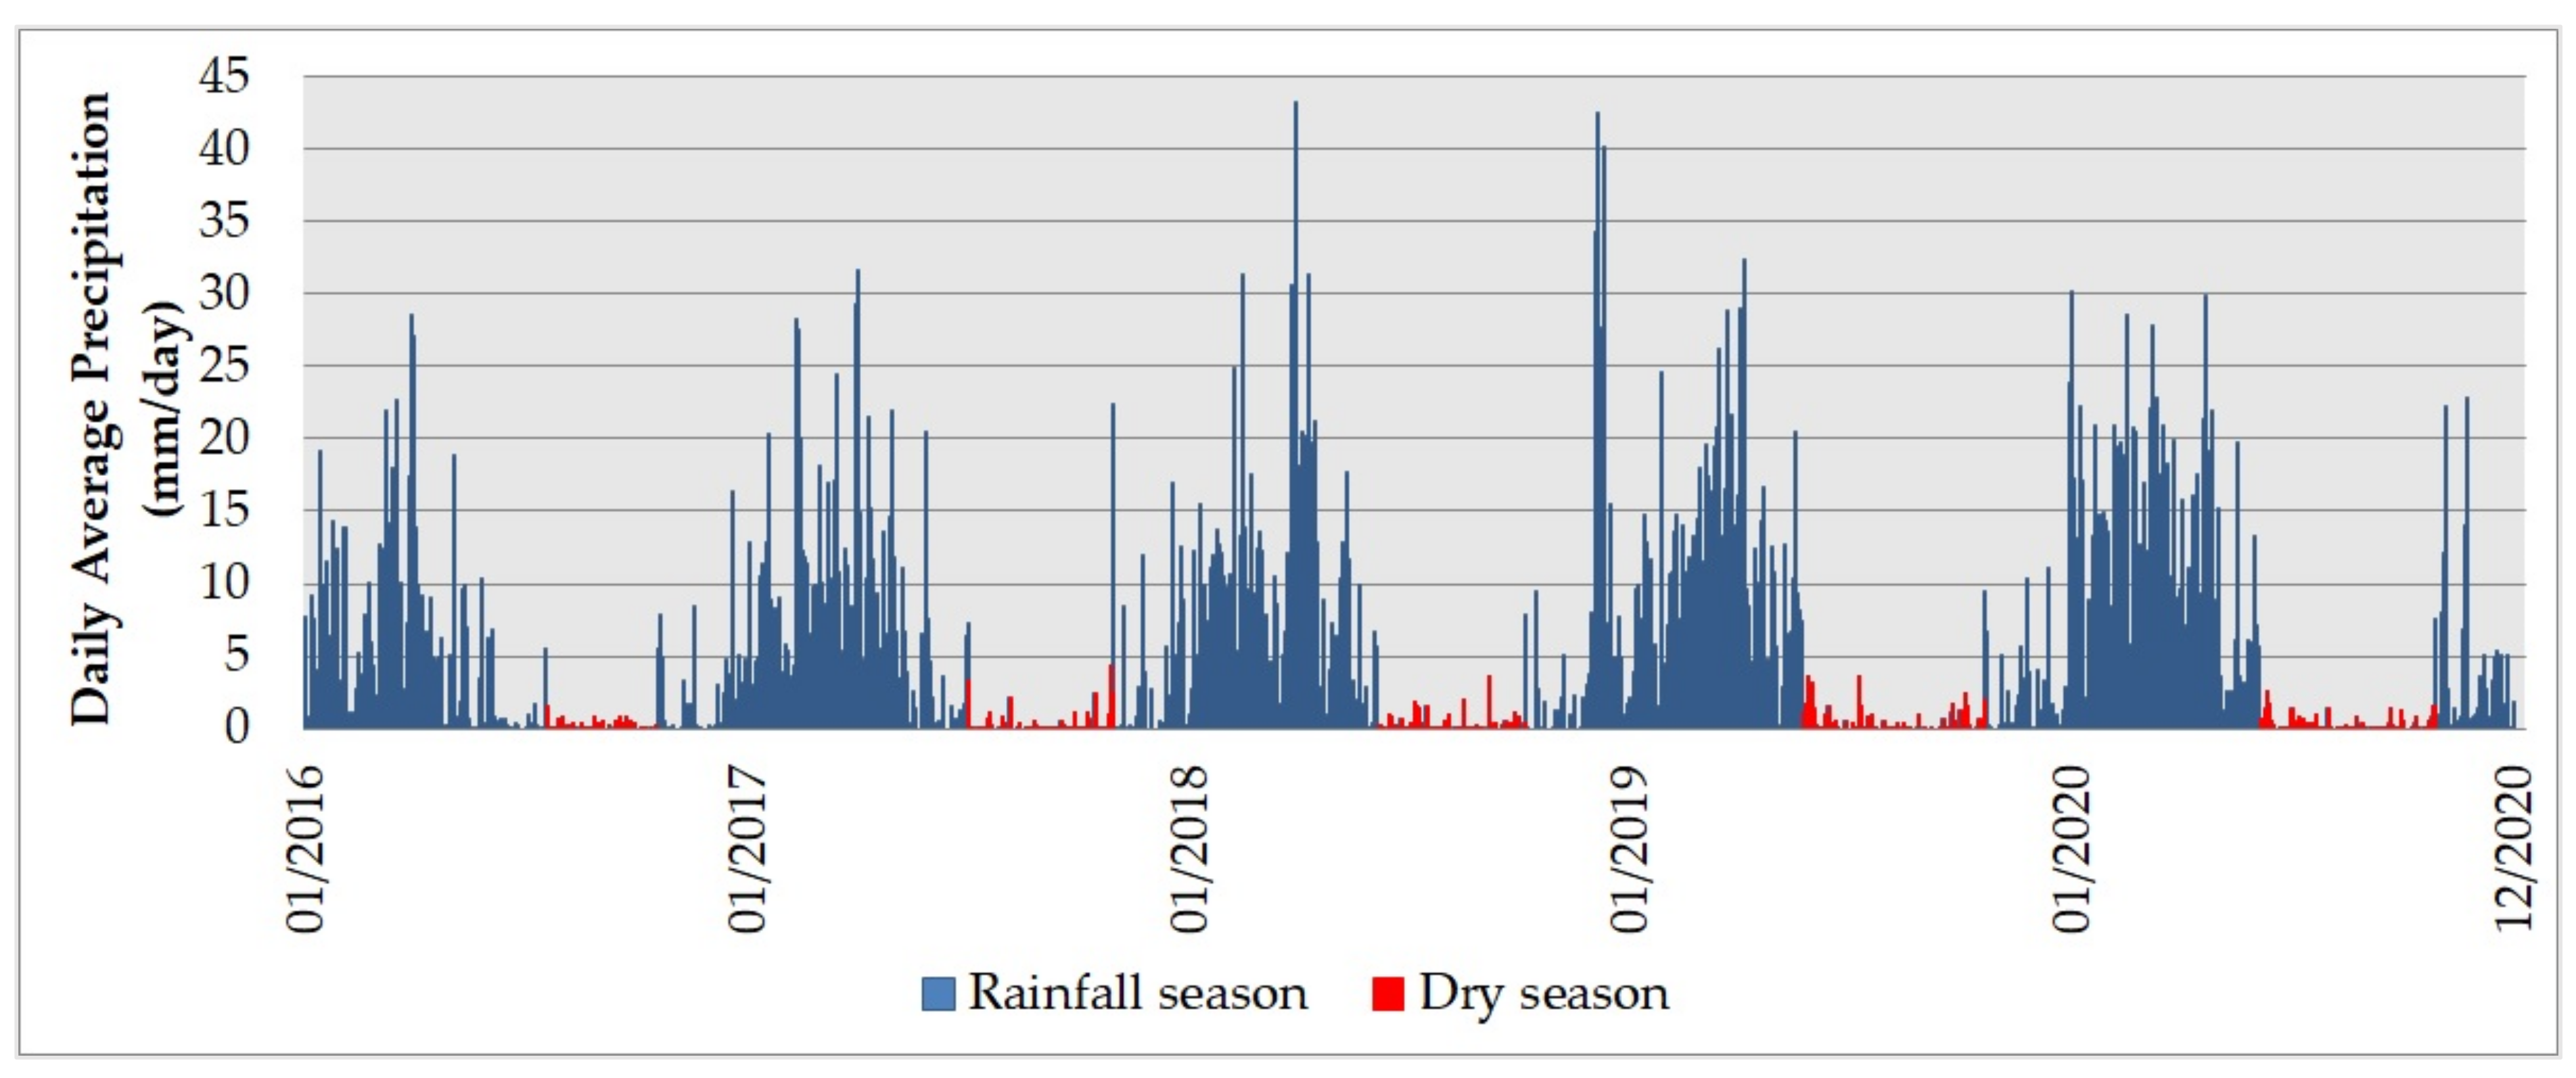
The rainfall data from 2016 to 2020, generated on the GEE platform, were extracted in ‘.csv’ format. The most extended period of days with daily-averaged precipitation of less than 5 mm/day was filtered in MS Excel.
Figure 4 presents the data extracted from the CHIRPS daily series for 2016 to 2020.
The following dates were extracted from MS Excel, indicating each year’s dry season start- and end-date, from 19 July 2016 to 19 October 2016; from 3 July 2017 to 30 October 2017; from 6 June 2018 to 5 October 2018; from 23 May 2019 to 20 October 2019; and from 4 June 2020 to 26 October 2020. These defined dry periods were used for filtering the Landsat-8 imagery on the GEE platform before running the RF-classification procedure, meaning that any image outside this range was excluded. Our results showed that, considering the time window of 2016 to 2020, 2019 was the most severe year in terms of consecutive days of rainfalls under 5 mm.
3.2. Land-Use and Land-Cover Maps
In remote-sensing image classification, there was one main category of error related to the representativeness of the training samples. Even when made by an expert in the field, visual interpretation is a difficult task, as the physical parameters with which the training samples are collected are usually different from the settings received by the sensor. For this reason, often, training samples are obtained to give larger and more representative sets of the LULC classes. The balance between the training-sample size, which is time consuming, and the overall accuracy of the classification, is also an issue.
The accuracy obtained from the LULC maps is as follows: (a) for the year 2016, OA = 94.68% and KC = 94.27%; (b) for the year 2017, OA= 93.97% and KC = 94.19%; (c) for the year 2018, OA= 94.62% and KC = 94.50%; (d) for the year 2019, OA = 94.19% and KC = 93.43%; (e) for the year 2020, OA= 95.86% and KC = 95.30%. The obtained results demonstrate that the classification is considered significantly good.
The Mapbiomas project has an informative panel assessing the accuracy obtained by the studies carried out by it. The OA for the entire Brazilian territory is 91.3%, and in the Caatinga region, where this study was carried out, it is 81.8% [
10,
14]. The validation by comparison of a consolidated project at national and international level demonstrates that the results obtained in the study are valid. These resulting accuracies are related to the reliability of the classification. We obtained OA values from 78% to 89% for the Wetlands, Sugar Cane, and Mosaic Agriculture and Pasture classes. The other thematic categories had an OA greater than 90%.
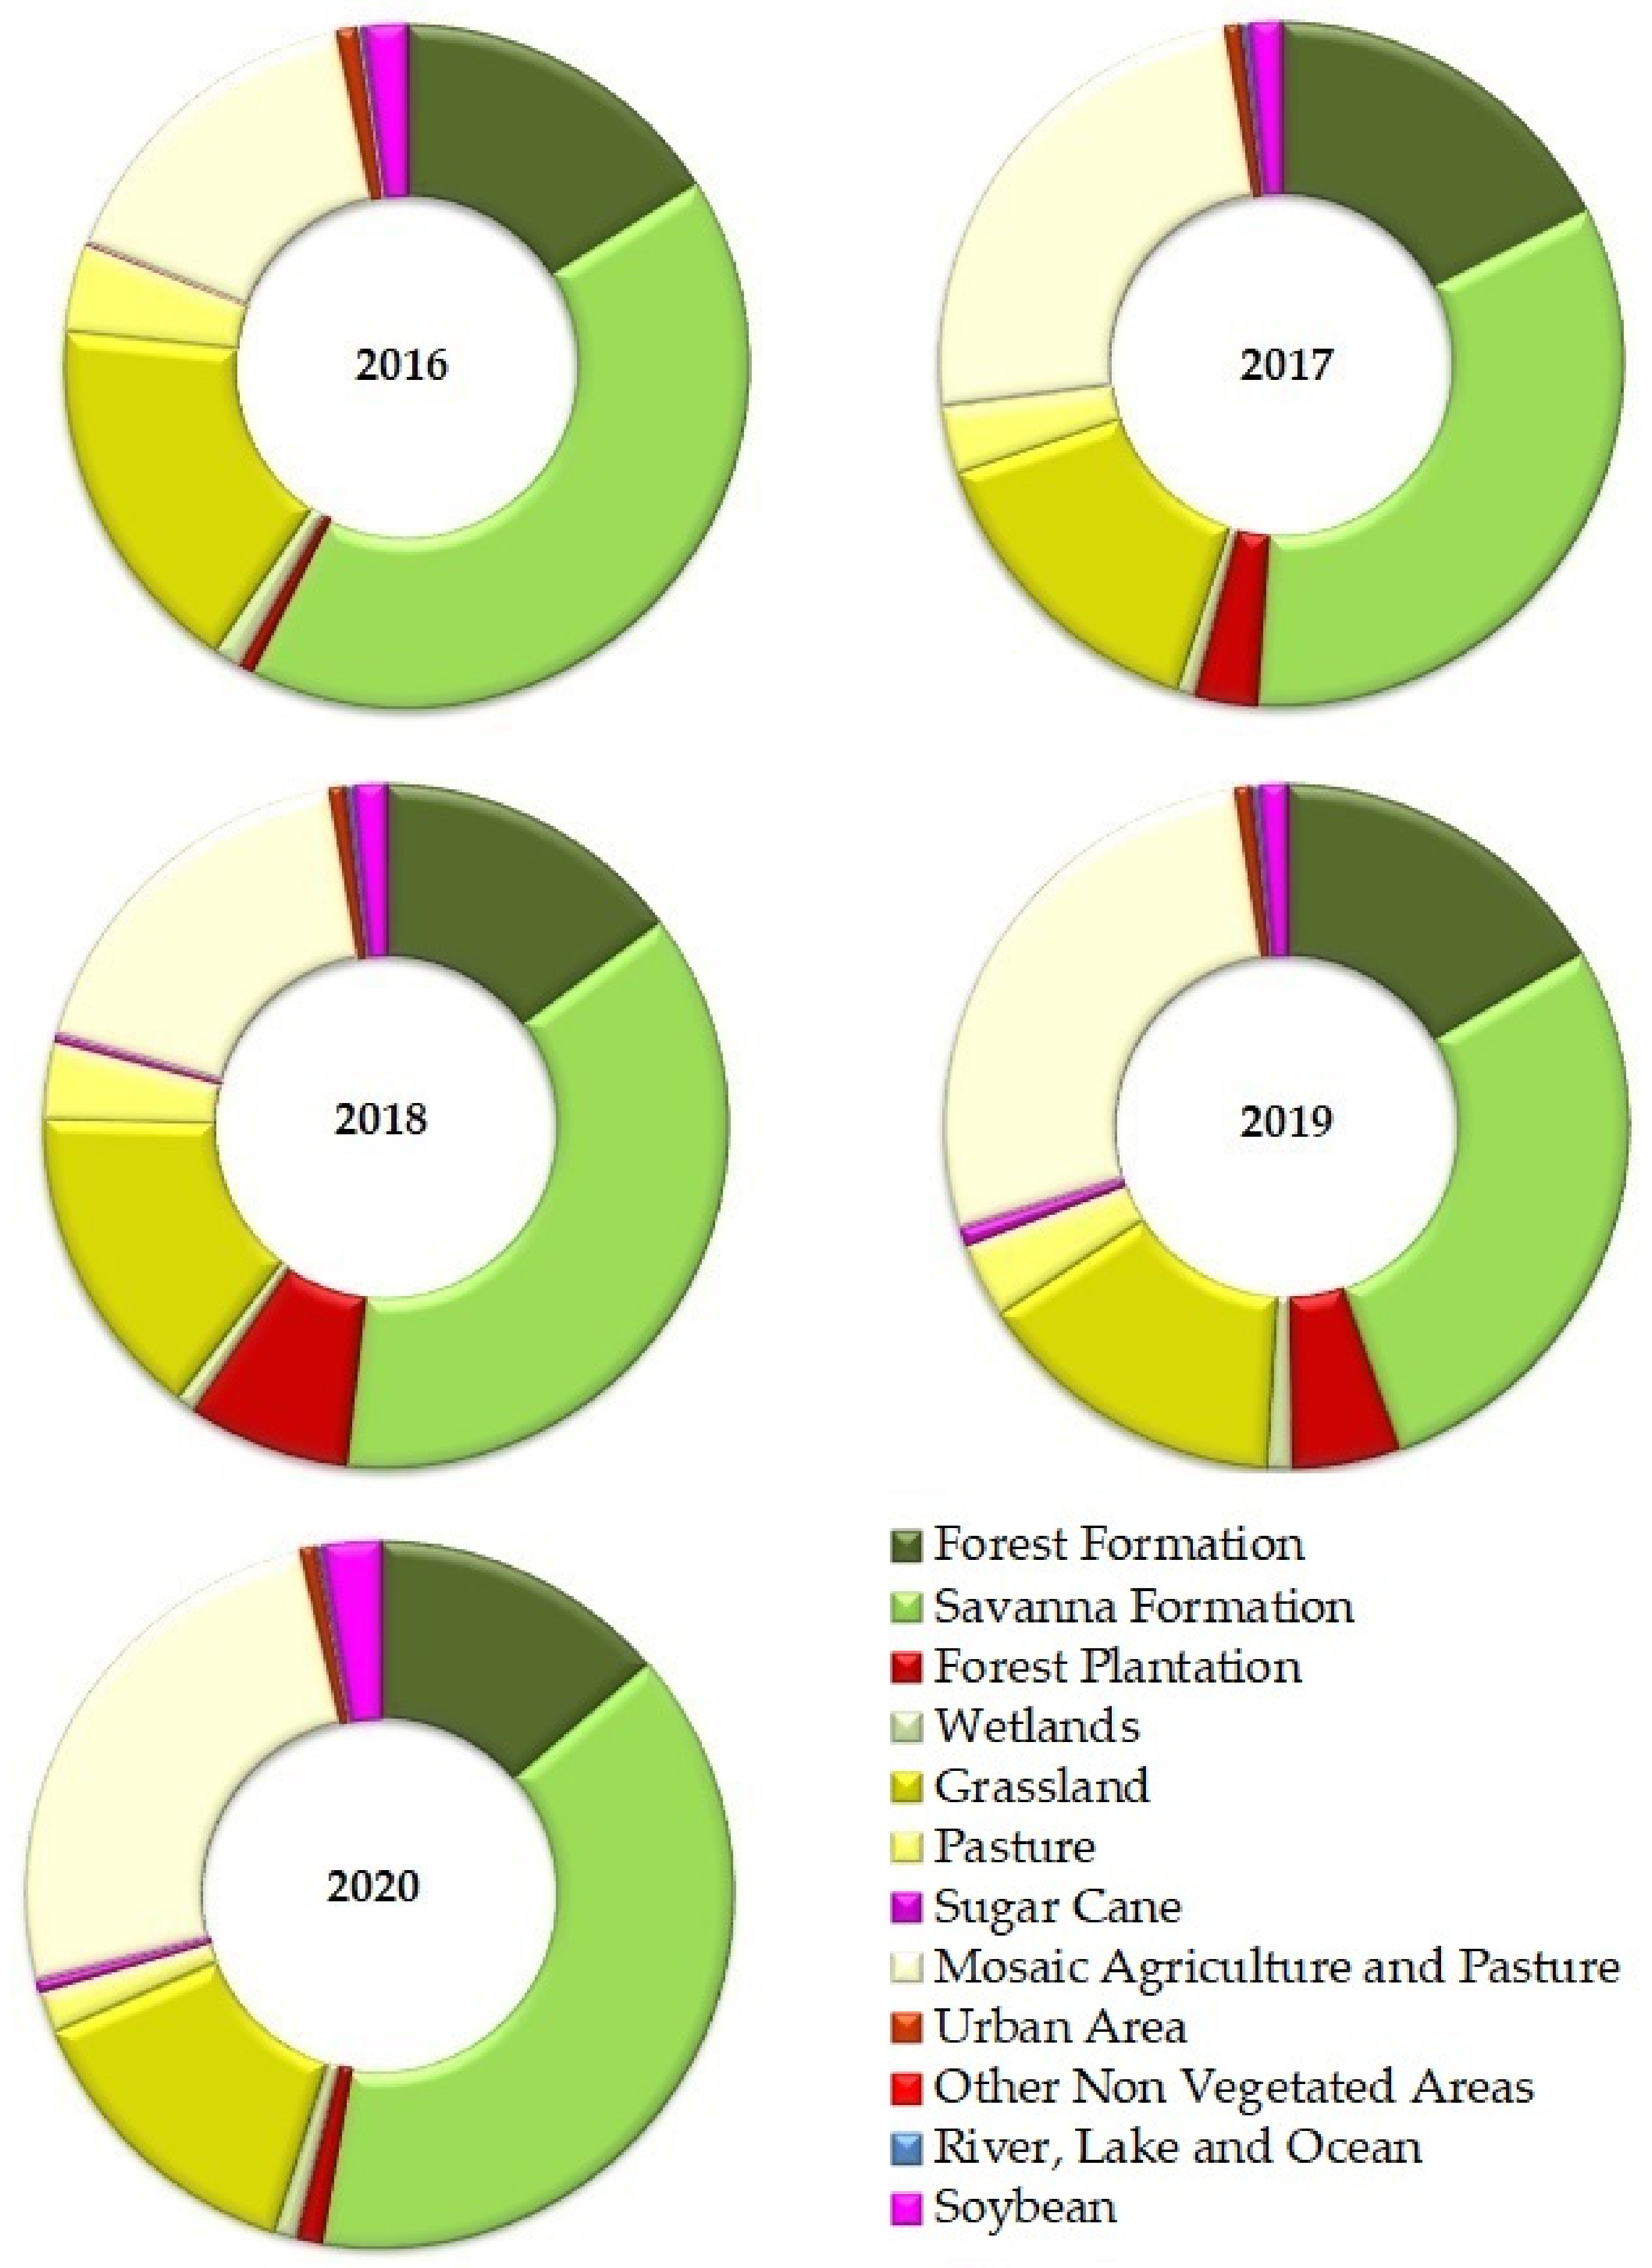
Table 1 and
Figure 6 show the area by each thematic type in each year. The natural formation classes, such as Forest Formation, Savanna Formation, and Grassland, show considerable variations throughout this study. The Savanna Formation is the one with the most variability. Agriculture classes such as Sugar Cane, Mosaic Agriculture, and Pasture and Soybean show a significant increase. Refining the image-date selection, based on the most extended period without rain, leads to a land classification in the post-harvest crop period. Hence, our study is crucial for understanding the conservation
versus degradation of the natural formations within the CMC area.
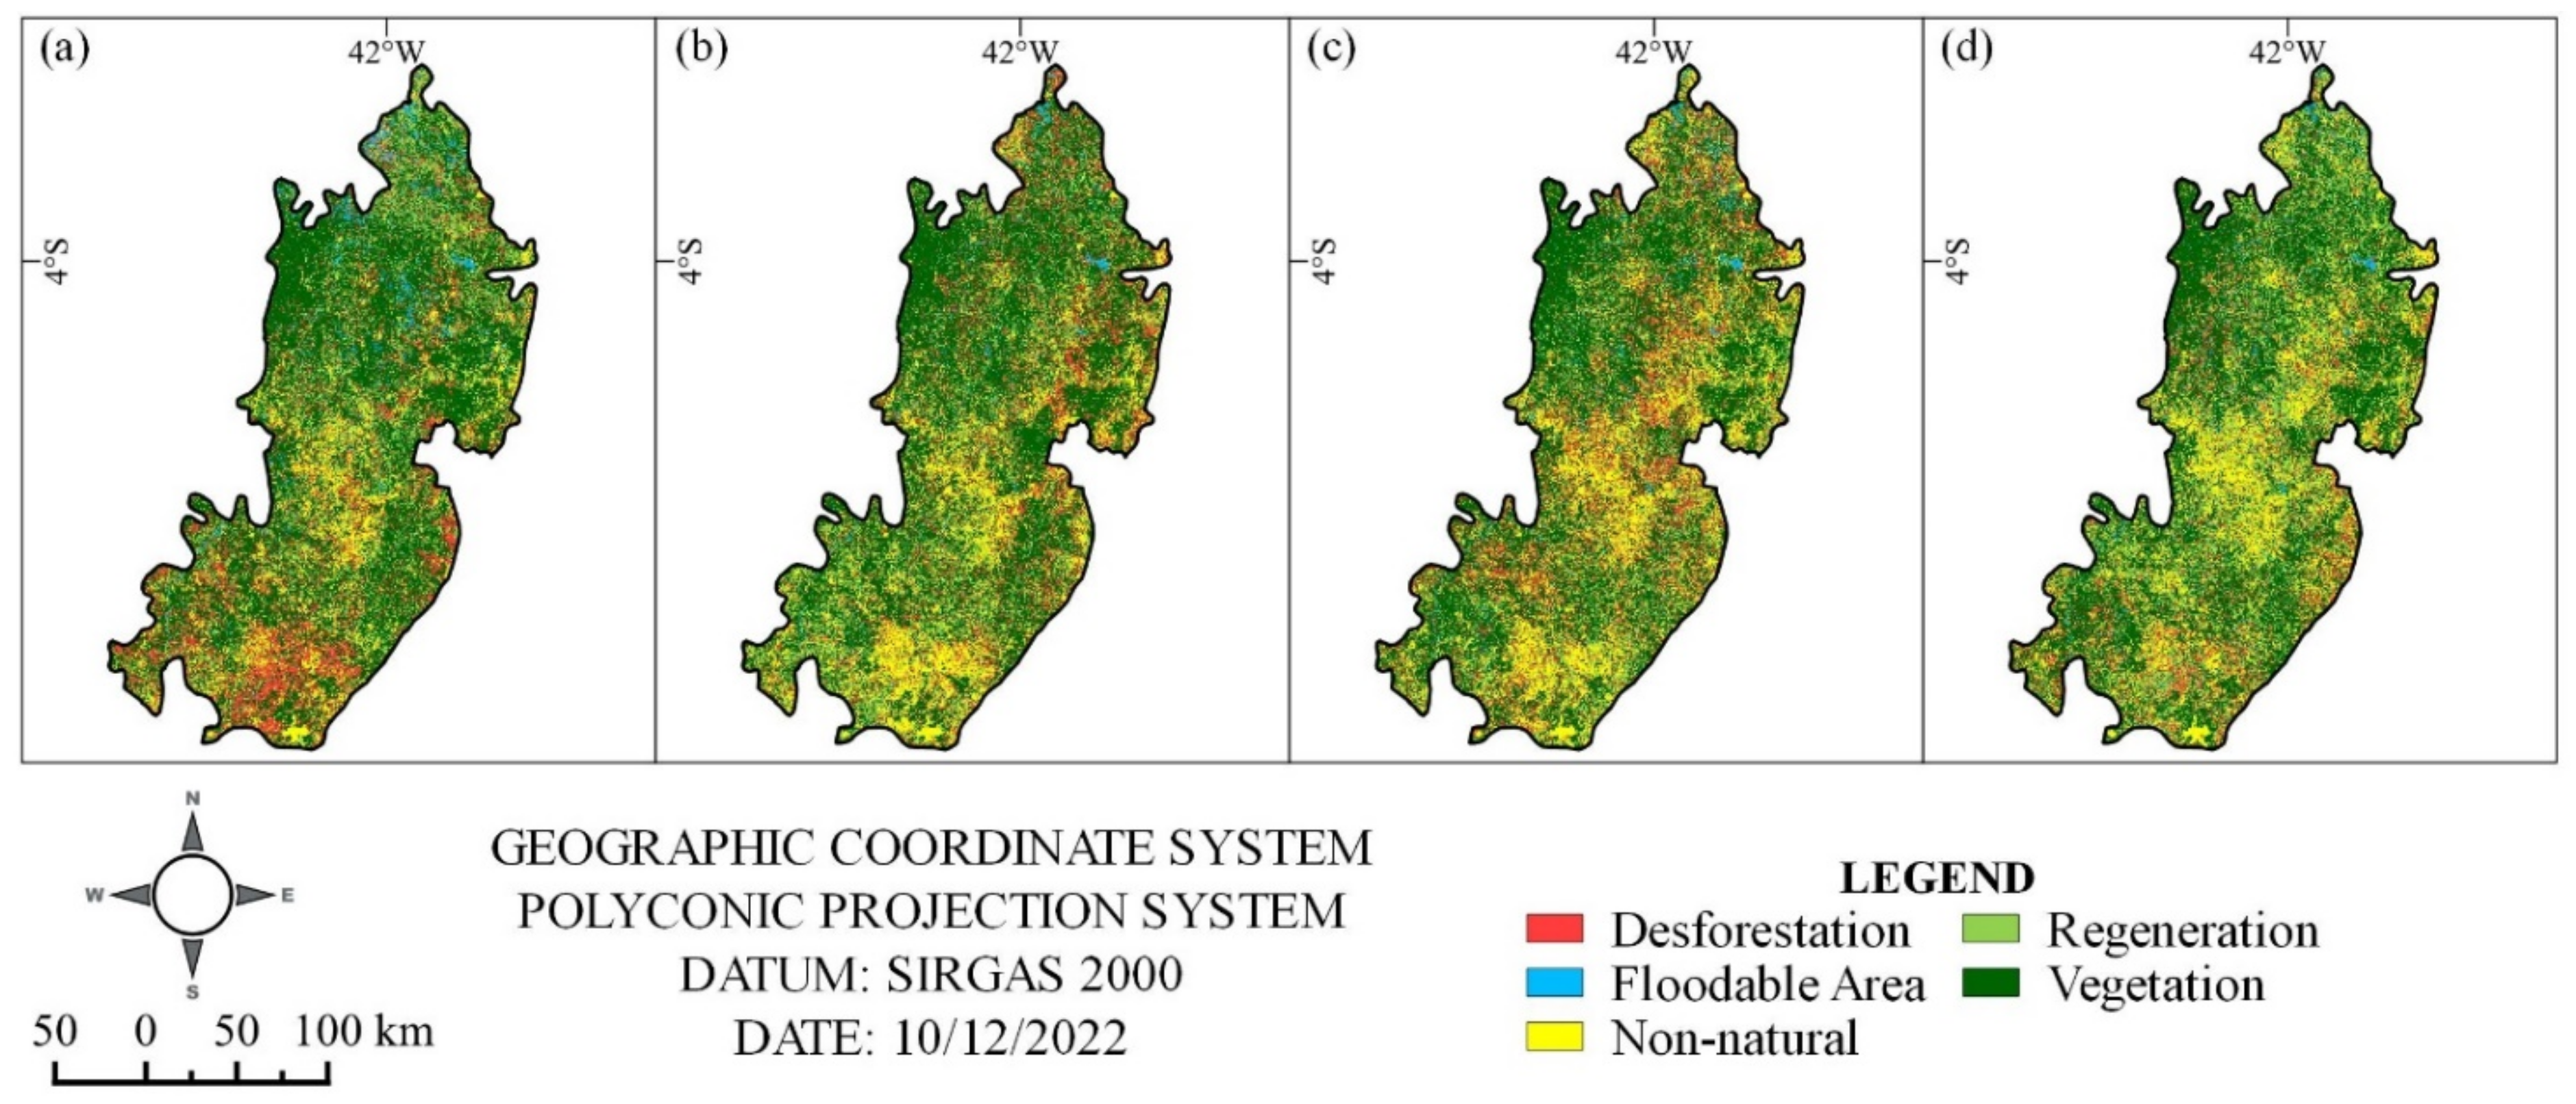
3.3. LULC-Change Analysis
Comparing two classifications to assess land-cover changes is a way of knowing how the changes in the classes occur.
Figure 7 and
Table 2 show the resulting comparison of one year and the previous year for the resulting LULC maps.
The most significant representation of Deforestation occurs in comparing the LULC maps from 2017 to 2018. The Floodable area showed a more excellent presentation in the years 2016 to 2017, and maintained stability in the two following periods, with a reduction between the years 2019 and 2020. The Non-natural formation class increased from the base year of 2016 to its highest percentage from 2018 to 2019. The Regeneration class presented the highest rate between 2019 and 2020, and it is possible to observe an increase every two years. The Vegetation class had its lowest representation in the same year that Deforestation was the highest (from 2017 to 2018).
4. Discussion
4.1. The Rainy- and Dry-Season Characterization
Although rain-gauge measurement is the most traditional and reliable method [
32], remote-sensing data such as CHIRPS is indicated for scientific research, due to the historical series and the possibility of obtaining a daily-precipitation scale for a region [
21]. Due to the seasonal and irregular rainfall, the forests located in the CMC are classified as seasonally dry tropical forests (SDTF) [
18,
33]. This characterization directly influences the biotic or abiotic changes in flower blooming, emergence, and aging of leaf chlorophyll-pigmentation [
25]. The rainy and dry descriptions are essential steps for the best LULC classification. They are a confinable indicator of public policies to combat deforestation in the CMC, in which the majority vector is agricultural activities.
Figure 3 shows that March is the month with the highest historical average-monthly-precipitation (1981–2020), and the spatial distribution of this precipitation in the Figure shows that the northern region of the CMC area is the one that reaches the highest volumes of rainfall. The southern part of the CMC area is where the lowest values for precipitation are recorded for the longest time. These values correspond to the CMC area’s most significant drought characteristics in Caatinga. This pattern demonstrates the seasonal complexity of the territory and the demand for the characterization of the rainfall regime.
The definition of dates using a daily temporal-scale made it possible to choose the period with the lowest disturbance of the vegetation and, consequently, to achieve a better interpretation of the thematic classes to be selected in the collection for the filtering reduction of the Landsat-images selection.
4.2. Land-Use and Land-Cover Maps
Most of the recent regional studies use the Landsat time series. Given this moderate spatial resolution (30 m), these data are the most suitable for regional environmental-analyses [
30,
34,
35]. Therefore, with the recent increase of cloud computing platforms (e.g., the GEE platform), a wide range of classifiers are available to process and analyze entire satellite imagery databases (e.g., Landsat), in an automated way.
Other studies have used predictive models to classify LULC types using the GEE [
36]. Random forest (RF) models are used to generate an optimum decision tree for classifying Landsat data, accurately mapping cropping-extent in Australia and China [
37], and mapping wood vegetation in Australia [
38].
Considering that the CMC region is highly seasonal, the selection of an optimum approach for LULC classification is needed. The seasonality in the CMC region makes the spectral response of land-use and land-cover types in remote-sensing products widely variant in specific climate-regimes [
18]. Thus, methods that accurately map LULC types are critical for monitoring anthropogenic pressure and land degradation.
Livestock activity in the region aggravates the soil compaction; in addition, activities such as wood extraction for potteries and coffee plantations are predominant [
39]. Monitoring information from the Mapbiomas project shows that other crops [
14], such as sugarcane and soybeans, are being developed within the region. Hence, the estimation of the conservation status in the CMC is crucial.
In Brazil, ensuring food security while safeguarding the environment is a crucial challenge. The LULC maps (
Figure 2) of the CMC area produced here include detailed information on natural and non-natural formations, which can be used to address the issues related to the increasing agribusiness and the resulting deforestation in the region south of CMC. Notably, the political and scientific discussion regarding a suitable combination between agricultural production and the protection of forests, biodiversity, and the climate, has achieved new dimensions with the non-conservation position of the current government [
40].
Nowadays, Brazil is a world player in producing and exporting agricultural commodities, notably soybeans. Brazil had more than 110 million tons of soybeans in 2017, with most of its production concentrated in the savanna-like Cerrado biome. However, due to technological advances and agricultural mechanization, large soy-production properties have occupied the Caatinga and the CMC region. The data reported from private rain-gauges installed in a grain-production region point to the beginning of the grain planting occurring in November and the finalization of the harvest activities in May [
41]. In this way, the date filtering used for the Landsat-8 collection is for the off-season. Therefore, the thematic class Mosaic Agriculture and Pasture is well reported, because it is easier to collect samples due to the regular format and textures observed in the satellite scenes.
The Brazilian Forest Code determines that the legal reserve areas must be delimited and conserved for the Cerrado, Caatinga, Pantanal, and Pampa biomes as at least 20% of the total area for any private property. The CMC region presents the vegetational biophysical characteristics of a transition area between Legal Amazonia and Cerrado. Nonetheless, for the due purposes of conservational legislation, this territory is almost all located in the Caatinga biome. With the weakness of the conservation legislation and the technological advances in the mechanization of agriculture, the exploitation of lands for agricultural production and exportation is increasing in the entire CMC area.
4.3. Dynamics of the LULC Maps
Our results make it possible to demonstrate and discuss which areas of the CMC region are undergoing pressure, considering a range of drivers. In addition, we classified these changes into types of thematic classes, focusing on the dynamics between deforestation and regeneration.
We show significant changes in pixels for the Deforestation class in the areas identified as having higher climate risk from 2016 to 2017. This region is relatively new to agricultural production in Piauí, and has been used by agribusiness and for planting artificial forests to commercialize its products, such as coal and cellulose.
Maps (b) and (c) in
Figure 7 show a more significant distribution of deforestation, with map (b) showing the highest percentage of deforested areas within the time frame of this study, 20.19%. This deforestation is concentrated in the northeast region of the CMC, which is also where the conservation units within the territory are located. The map (d) shows a reduction in deforestation and an increase in vegetation regeneration, compared with the previous years.
Monitoring agricultural cropping is also crucial, as it is consolidated the primary driver of changes within the region. The first limitation of low natural soil-fertility was overcome by technological investments in agricultural mechanization for both single- and double-cropping rotations. The literature demonstrates that the agriculture frontier is still expanding, and is moving to other domains on the border of the Caatinga biome. Caatinga is already a degraded biome, where the critical limitation is water scarcity [
42,
43]. For this reason, the movement of the agriculture frontier to the Caatinga vegetation must be treated with concern, as the price of the land in this biome is usually lower than the national average.
5. Conclusions
Cloud computing frameworks are opening new paradigms for remote-sensing image classification. The Landsat historical dataset, freely available on these platforms, is the most-used source for tracking continuous regional-land-use changes back to the 1980s. In addition, the high performance of the GEE computing platform makes the manipulation of a large amount of remote-sensing data more user-friendly and suitable for agricultural monitoring. Moreover, the relative facilities of a vast range of methods challenge the users in their optimal selection.
The characterization of the rainfall regime is essential for choosing an appropriate period for the analysis carried out in regions classified as SDTF, as in the case of natural forest formations arranged in the CMC area. The data obtained by remote sensing can be used for study purposes; however, it is more appropriate that these regions are equipped with rain gauges, for better data-accuracy.
The LULC maps are essential for understanding which degradation vectors act in the region, and how they are arranged in the territory. In addition, they monitor the environmental risk, and this study points out that a large area of the CMC is located in regions of high and medium climate-risk. Consequently, the disorderly occupation promoted by agribusiness causes the degradation of natural formations, mainly forest and savanna.
The Campo Maior Complex region is vital for biodiversity and maintaining ecosystem services in a dynamic transition-area. This study paves the way for improvements and expansion in the understanding of land-use and land-cover dynamics linked to the level of conservation and deforestation of a place that, until recently, has not been visible to agribusiness, but is being gradually occupied for grain production, due to mechanization and technological advances in agriculture.


 ,
, 


