Article

Multiple-Molecule Drug Repositioning for Disrupting Progression of SARS-CoV-2 Infection by Utilizing the Systems Biology Method through Host-Pathogen-Interactive Time Profile Data and DNN-Based DTI Model with Drug Design Specifications

Laboratory of Automatic Control, Signal Processing and Systems Biology, Department of Electrical Engineering, National Tsing Hua University, Hsinchu 30013, Taiwan
*
Author to whom correspondence should be addressed.
Stresses 2022, 2(4), 405-436; https://doi.org/10.3390/stresses2040029
Submission received: 2 September 2022 / Revised: 19 October 2022 / Accepted: 20 October 2022 / Published: 3 November 2022
(This article belongs to the Special Issue SARS-CoV-2 and Stresses)

Abstract

:
The coronavirus disease 2019 (COVID-19) pandemic has claimed many lives since it was first reported in late December 2019. However, there is still no drug proven to be effective against the virus. In this study, a candidate host–pathogen–interactive (HPI) genome-wide genetic and epigenetic network (HPI-GWGEN) was constructed via big data mining. The reverse engineering method was applied to investigate the pathogenesis of SARS-CoV-2 infection by pruning the false positives in candidate HPI-GWGEN through the HPI RNA-seq time profile data. Subsequently, using the principal network projection (PNP) method and the annotations of the Kyoto Encyclopedia of Genes and Genomes (KEGG) pathway, we identified the significant biomarkers usable as drug targets for destroying favorable environments for the replication of SARS-CoV-2 or enhancing the defense of host cells against it. To discover multiple-molecule drugs that target the significant biomarkers (as drug targets), a deep neural network (DNN)-based drug–target interaction (DTI) model was trained by DTI databases to predict candidate molecular drugs for these drug targets. Using the DNN-based DTI model, we predicted the candidate drugs targeting the significant biomarkers (drug targets). After screening candidate drugs with drug design specifications, we finally proposed the combination of bosutinib, erlotinib, and 17-beta-estradiol as a multiple-molecule drug for the treatment of the amplification stage of SARS-CoV-2 infection and the combination of erlotinib, 17-beta-estradiol, and sertraline as a multiple-molecule drug for the treatment of saturation stage of mild-to-moderate SARS-CoV-2 infection.

1. Introduction

In late December 2019, China reported cases of pneumonia to the World Health Organization (WHO). In January 2020, the WHO named this disease coronavirus disease 2019 (COVID-19). As of 21 June 2022, there have been more than 500 million confirmed cases of COVID-19 and more than 6 million deaths [1]. COVID-19 is caused by the severe acute respiratory syndrome coronavirus 2 (SARS-CoV-2). The high transmissibility and clinical severity of COVID-19 rapidly caused a global health crisis. In most cases, the symptoms of COVID-19 are mild. The most commonly reported symptoms are headache (34–70%), myalgia (36–63%), fatigue (63%), cough (50.3–63.2%), and fever (43–45%) [2,3]. However, some cases result in an acute course and complications. So far, the pathogenesis of COVID-19 has not been completely clarified, and more than two years after the beginning of the COVID-19 outbreak, there is still no drug proven to be effective against it.
SARS-CoV-2 is a positive-sense single-stranded RNA virus and encodes approximately 29 proteins, including four structural proteins [4,5,6]. Some proteins of SARS-COV-2 have been confirmed to interact with host proteins and affect host gene expression [7,8]. In addition to genetic regulation, epigenetic regulation is also important to the viral infection [9,10,11]. MicroRNA (miRNA) can cause RNA silencing and post-transcriptional repression of gene expression [12,13]. They can regulate various cellular activities, including apoptosis, cell growth, and differentiation [14]. Long noncoding RNA (lncRNA), a class of non-coding RNA, can be an inhibitory regulator of miRNA [15,16] or involved in transcriptional regulation. They are involved in different regulatory mechanisms during viral infection [17].
For new drug discovery, the global pharmaceutical industry faces high attrition rates [18], high costs increasing with time, and changing regulatory requirements. These risks cause investors to be less willing to invest in the pharmaceutical industry. Therefore, drug repositioning (also called drug repurposing) is proposed [19,20]. Drug repositioning refers to the identification of new usages for investigational or approved drugs which are outside the scope of the original medical indication. However, the experimental methods to verify the drug–target interaction (DTI) are extremely expensive and time-consuming. It is necessary that the systems biology method be employed to investigate pathogenic mechanisms to identify significant drug targets, and this should be followed by computational methods based on the DTI model to predict the drugs for significant drug targets on a large scale to reduce the high cost and development time, especially during the COVID-19 outbreak. Moreover, combination therapy for multiple proteins (drug targets) using more than one medication or modality has been used for many diseases, including various cancers [21] and infections [22]. It has been proposed for the treatment of COVID-19 in some research [23,24]. Veklury (Remdesivir) is an FDA-approved drug for mild-to-moderate COVID-19. However, the efficiency of Remdesivir is still debatable [25,26,27]. Olumiant (Baricitinib), the other FDA-approved drug, is used in the treatment of COVID-19 in hospitalized adults who require supplemental oxygen, invasive or non-invasive mechanical ventilation, or extracorporeal membrane oxygenation (ECMO—that is, Baricitinib is not used for mild-to-moderate COVID-19).
In this study, we first employed the systems biology method via host–pathogen–interactive (HPI) RNA-seq time profile data to investigate the pathogenesis of COVID-19 in order to identify significant biomarkers as drug targets and treat the SARS-CoV-2 infection at the amplification and saturation stages. Recently, a deep neural network (DNN)-based DTI model that targets proteins to significantly improve the prediction of DTI compared to conventional DTI models has been introduced by a deep learning algorithm through the feature vectors of molecular drugs [28,29]. Therefore, a DNN-based DTI model was trained by DTI databases [30,31,32,33,34] to efficiently predict candidate molecular drugs for each significant biomarker (drug target) of the amplification and saturation stages of SARS-CoV-2 infection. Then, based on drug design specifications, in order to prune some candidate drugs, a set of candidate molecular drugs combined as a multiple-molecule drug was proposed as a potential combination therapy to target these significant biomarkers at the amplification and saturation stages to disrupt the progression of SARS-CoV-2 infection. Therefore, the systematic procedure of repositioning a multiple-molecule drug for disrupting the progression of SARS-CoV-2 infection by utilizing the systems biology method through HPI RNA-seq data and DNN-based DTI model with drug design specifications are described as follows: (1) constructing the candidate HPI genome-wide genetic and epigenetic network (HPI-GWGEN) using big data mining from databases [35,36,37,38,39,40,41,42,43,44,45,46]; (2) system identification and system order selection to eliminate the false positives in the candidate HPI-GWGEN to obtain the real HPI-GWGEN using the system models and HPI RNA-seq time profile data; (3) applying the principal network projection (PNP) method to construct the core HPI-GWGEN and obtain the core HPI signaling pathways and their abnormal downstream cellular functions of SARS-CoV-2 infection using annotations of the Kyoto Encyclopedia of Genes and Genomes (KEGG) pathways [47,48]; (4) investigating and comparing the pathogenic mechanisms between the amplification and saturation stages of SARS-CoV-2 infection to identify significant biomarkers as drug targets against SARS-CoV-2 infection at the amplification and saturation stages; and (5) predicting the candidate drugs for significant biomarkers using a DNN-based DTI model and selecting potential multiple-molecule drugs for the therapeutic treatment of the amplification and saturation stages of SARS-CoV-2 infection with three drug design specifications, i.e., regulation ability, toxicity, and sensitivity. We finally proposed the combination of bosutinib, erlotinib, and 17-beta-estradiol as a multiple-molecule drug for the treatment of the amplification stage of SARS-CoV-2 infection and the combination of erlotinib, 17-beta-estradiol, and sertraline as a multiple-molecule drug for the treatment of the saturation stage of mild-to-moderate SARS-CoV-2 infection.

2. Results

2.1. Core HPI Signaling Pathways during Amplification and Saturation Stage of SARS-CoV-2 Infection by the Systems Biology Method

To find the molecular drugs for disrupting SARS-CoV-2 infection, systematic methods including reverse engineering (i.e., reversing the infectious process of SARS-CoV-2) were first used to construct the real HPI-GWGEN by the genome-wide HPI RNA-seq time-profile data, and the PNP method was applied to extract the core HPI-GWGEN for analysis. With the annotation of KEGG pathways, the core HPI-GWGEN was annotated as the core signal pathways to identify significant biomarkers as drug targets for the pathogenesis of SARS-CoV-2 infection at the amplification and saturation stages (note that the amplification and saturation stages are defined according to the RNA-seq time profile data in Section 4.2.1). After training the DNN-based DTI model, we predicted the potential multi-molecule drugs that target the significant biomarkers (drug targets) against SARS-CoV-2 infection at the amplification and saturation stages based on the DNN-based DTI model and three drug design specifications, respectively. The procedure of the systems biology method and drug discovery is shown in Figure 1.
The number of nodes and edges in candidate HPI-GWGEN and real HPI-GWGENs of amplification and saturation infectious stages are shown in Table 1. The significant pruning of edges between candidate and real HPI-GWGEN implies that the false-positive edges in candidate HPI-GWGEN are eliminated by the system order selection. The real HPI-GWGENs of amplification and saturation infectious stages are respectively shown in Figure A1, which are represented with the aid of Cytoscape [49].
In addition to the significant deletion of false-positive edges, the PNP method was applied to evaluate the significance of each node to the network matrix according to its projection value. The core HPI-GWGENs in the amplification and saturation stages were built by extracting the top-6000-significance nodes from the corresponding real HPI-GWGENs of the amplification and saturation infectious stages. The core HPI-GWGENs of amplification and saturation infectious stages are shown in Figure 2 and Appendix A, which were represented with the aid of Cytoscape [49]. The top-6000-significance nodes can be uploaded to the database for annotation, visualization, and integrated discovery (DAVID) functional annotation tool [47,48] to help investigate the pathogenic mechanism of the amplification and saturation stages of SARS-CoV-2 infection. The enrichment analysis of KEGG pathways for amplification and saturation infectious stages are shown in Table 2 and Table 3, respectively. The enrichment analysis of KEGG may imply what pathways are involved in each infection stage. We try to find the pathogenetic molecular mechanism for the viral amplification in early infection and the pathogenetic molecular mechanism for the viral saturation in late infection.
With the help of the enrichment analysis of KEGG and the exiting literature, the core host–pathogen interactive signaling pathways and their downstream abnormal cellular functions of SARS-CoV-2 infection at the amplification and saturation stages are shown in Figure 3. The core signaling pathways with red background in the middle of Figure 3 are common between the amplification and saturation stages of SARS-CoV-2 infection; the specific signaling pathways on the left-hand-side are the amplification stage of SARS-CoV-2 infection; and the specific signaling pathways on the right-hand-side are the saturation stage of SARS-CoV-2 infection.

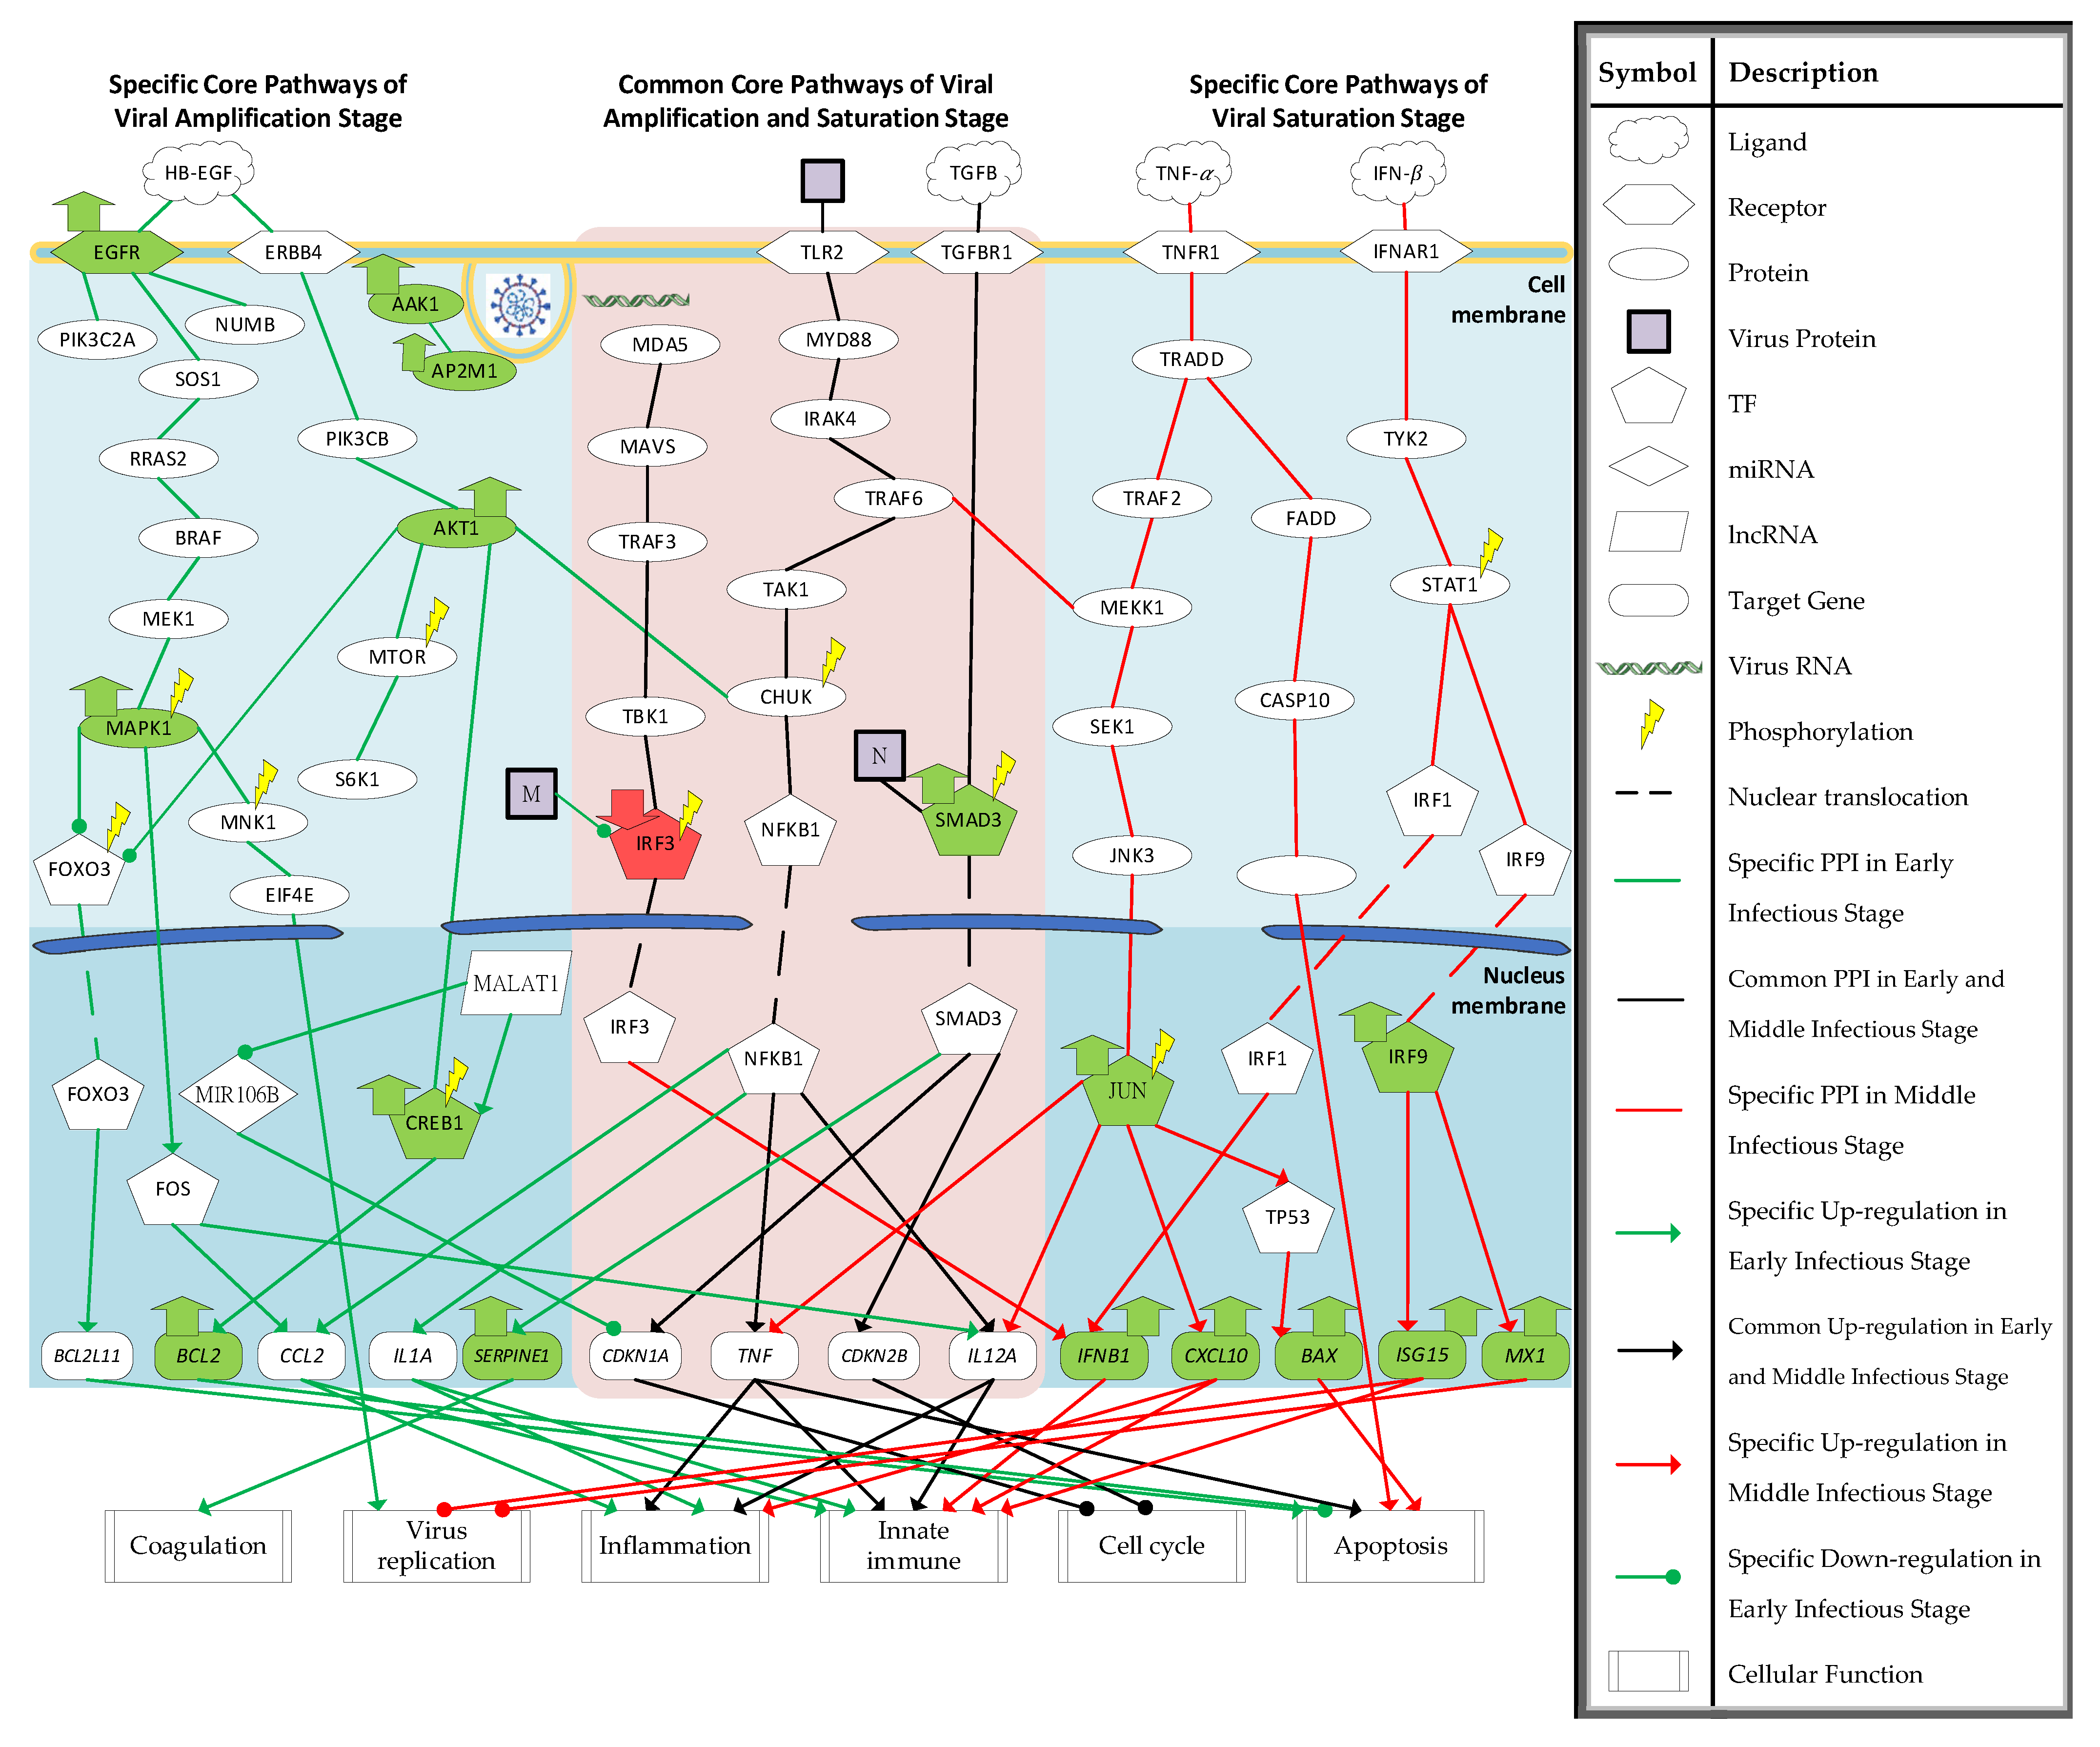
2.2. Investigation of Specific Core HPI Signaling Pathways and Their Downstream Abnormal Cellular Functions during SARS-CoV-2 Infection

2.2.1. Investigation of Specific Core HPI Signaling Pathways in Amplification Infectious Stage

According to the core HPI signaling pathways of SARS-CoV-2 infection, several downstream abnormal cellular functions were identified in Figure 3. We try to investigate the progression of SARS-CoV-2 infection. In specific core signaling pathways of the amplification infectious stage in the left column of Figure 3, AP2M1 and AAK1 were identified to be associated with endocytosis. AAK1 can phosphorylate AP2M1, which promotes receptor-mediated endocytosis to help with viral entry [50].
The receptor EGFR was identified to activate MAPK1 by signaling through SOS1, RRAS2, BRAF, and MEK1. The activation of receptor EGFR may be caused by the ligand HB-EGF. For coronavirus infection, the upregulation of ligand HB-EGF, which can bind to the receptor EGFR and ERBB4, has been observed [51]. MAPK1 is the pivotal component to activate the downstream cellular function of receptor EGFR. MAPK1 suppresses the TF FOXO3 by phosphorylation and activates MNK1 and TF FOS. The target gene of TF FOXO3, BCL2L11, encodes the Bcl-2-like protein 11 (BIM) and acts as an apoptotic activator [52]. Lots of pathogens may interfere in the host’s cellular functions to establish the proper environment for replication. Because viruses, including SARS-CoV-2, need to use the host cell for replication, the apoptosis of the host cell in early infection may be not desirable for it [53]. Thus, the suppression of BCL2L11 causes the survival of the host cell, which is necessary for the replication of SARS-CoV-2. MNK1 activates the translation initiation factor EIF4E. EIF4E can direct the ribosomes to bind to the 5′ cap of mRNA. It has been reported that the inhibition of the interaction between viral mRNA and EIF4E can suppress the replication of SARS-CoV-2 [54], which implies that the activation of EIF4E is also a desirable event for the replication of SARS-CoV-2. The activation of TF FOS induces the target genes CCL2 and IL12. CCL2 belongs to cytokine genes and is involved in inflammation and immunoregulatory processes. It exhibits a chemotactic activity for basophils and monocytes, which can help the host cell defend the SARS-CoV-2 virus. In addition to activating MAPK1, receptor EGFR also interacts with PIK3C2A and NUMB. Recently, the activation of PIK3C2A has been proven to act both in the control of receptor endocytosis and resensitization [55], and the activation of receptor EGFR can increase the activity of PIK3C2A [56]. The activation of endocytic adaptor protein NUMB has been reported to promote the recycling of EGFR [57]. The recycling and resensitization may enhance the activation of downstream genes of receptor EGFR.
The receptor ERBB4 is also activated by the binding of HB-EGF. After interacting with HB-EGF, receptor ERBB4 activates PIK3CB and then activates the AKT1. AKT1 can suppress TF FOXO3 and activate MTOR, CHUK, and TF CREB1. The phosphorylation of MTOR can activate the S6K1. The activation of S6K1 induces protein synthesis, including the viral protein at the ribosome [58]. The activation of TF CREB1 by AKT1 induces the target gene BCL2, which can encode an outer mitochondrial membrane protein to block the apoptosis of cells. Therefore, the expression of BCL2 can promote the survival of the infected cells. As mentioned above, the survival of infected cells may help in the replication of SARS-CoV-2. The TF CREB1 is also activated by lncRNA MALAT1. The high expression of MALAT1 has been reported to be differentially expressed in severe COVID-19 [59]. A previous study has shown that the lncRNA MALAT1 can maintain the phosphorylation of TF CREB1 for continuous CREB1 signaling activation [60]. The lncRNA MALAT1 has also been found to regulate the miRNA MIR106B. The miRNA MIR106B is silenced by MALAT1 and induces the target gene of MIR106B [61]. Here, the identified target gene of miRNA MIR106B is CDKN1A [62], which can block cell cycle progression by inhibiting the cyclin-dependent kinase (CDK). Lots of viruses can induce the host cell cycle arrest to produce resources and construct a proper environment for viral replication to increase replication efficiency [63].
In summary, the activated EGFR is involved in the endocytosis which may help the entry of virus and establishes a favorable environment, including the suppression of pro-apoptotic protein and the activation of eukaryotic translation initiation factor. Furthermore, receptor EGFR has been shown to act as a cofactor for the internalization of several viruses [64,65]. Endocytosis is also required for the entry of SARS-CoV-2 into the host cell. To disrupt the proper environment for viral replication, we choose EGFR and AKT1, as significant biomarkers, as drug targets for the specific pathogenesis of the amplification stage to destroy the favorable environment.

2.2.2. Investigation of Common Core HPI Signaling Pathways of Amplification and Saturation Infectious Stages

Some signaling pathways were identified in both the amplification and saturation stages of SARS-CoV-2 infection. The common signaling pathways of amplification and saturation infectious stages are shown in the middle column of Figure 3 with a red background. The receptor TLR2 has been shown to detect the SARS-CoV-2 envelope (E) protein as its ligand [66]. It is a common pathogen recognition receptor that activates the host’s innate immunity. After detecting the SARS-CoV-2 E protein, TF NFKB1 is activated by signaling through MYD88, IRAK4, TRAF6, TAK1, and CHUK. The activation of TF NFκ-B induces the target genes CCL2, IL1A, TNF, and IL12A. All of them are involved in the inflammation and innate immune responses [67,68,69] to defend against SARS-CoV-2 infection. TNF may also be implicated in apoptosis [70]. It is the ligand of receptor TNFR1 as well. In addition to the activation of TF NFκ-B as a defense response of the host cell, melanoma differentiation-associated protein 5 (MDA5) can detect replicative intermediates of both positive- and negative-strand RNA viruses [71]. After detecting the virus, TF IRF3 is phosphorylated through signaling proteins MDA5, MAVS, TRAF3, and TBK1, which can induce the target gene IFNB1. The IFNB1 can be the ligand of the receptor IFNAR1. The infected host cells will release interferons (IFN) and let nearby cells enhance their anti-viral defenses. Like other viruses [72], SARS-CoV-2 also interrupts the host cell’s immune system. The SARS-CoV-2 membrane (M) protein was identified to inhibit the production of IFN. A recent study has shown that SARS-CoV-2 M protein can prevent nuclear translocation of TF IRF3 and inhibit the phosphorylation of IRF3 [73].
The host cell cycle is also interfered with by the SARS-CoV-2 protein. The receptor TGFBR1 was identified to activate TF SMAD3, which may be caused by the ligand TGF-β. The upregulation of ligand TGF-β has been observed in SARS-CoV-2 infection [74,75]. The phosphorylation of SMAD3 induces the target genes CDKN1A, CDKN2B, and SERPINE1. Both CDKN1A and CDKN2B are CDK inhibitors to disrupt the cell cycle’s progression. As mentioned above, cell cycle arrest is a desirable event for viral replication. SARS-CoV-2 nucleocapsid (N) protein was identified to interact with TF SMAD3 to enhance the downstream target genes, which was consistent with previous research [76]. In addition to causing cell cycle arrest, TF SMAD3 is also involved in coagulopathy by inducing the target gene SERPINE1. The overexpression of SERPINE1 has been reported to play an important role in COVID-19-associated coagulopathy, leading to acute respiratory distress syndrome (ARDS) [77]. Coagulopathy may be fatal, so TF SMAD3 should be suppressed.
Briefly, the abnormal suppression of IRF3, which induces IFNB1, by the SARS-CoV-2 M protein and the overactivation of TF SMAD3 establishes the proper environment for the replication of SARS-CoV-2. Therefore, we choose IFNB1 and SMAD3 as significant biomarkers (drug targets) for the overlapping pathogenesis of the amplification and saturation stages.

2.2.3. Investigation of Specific Core HPI Signaling Pathways at Saturation Infectious Stage

In the saturation infectious stage, the mRNA level of the virus is decreased. Based on signaling pathways in the right column of Figure 3, we investigate the host defense mechanism against SARS-CoV-2 infection. The inducted proteins of target genes TNF and IFNB1 may be the ligands. While receiving the ligand TNF-α, the downstream proteins of receptor TNFR1 are activated. The activation of receptor TNFR1 can activate TRAF2 and FADD through signaling protein TRADD. After activation of TRAF2, TF JUN is phosphorylated via signaling proteins MEKK1/SEK1/JNK3, which induce the target genes TNF, IL12A, CXCL10, and TP53. The target gene CXCL10 is a pro-inflammatory cytokine that is involved in lots of processes such as apoptosis, chemotaxis, and the activation of peripheral immune cells [78,79,80]. The induction of TP53 can induce the target gene BAX. BAX is a pro-apoptosis protein that has been shown to be involved in P53-mediated apoptosis [81]. The other apoptotic pathway activated by the receptor TNFR1 is through FADD, which activates the BH3 interacting-domain (BID) protein through signaling protein CASP10 [82]. BID is also a pro-apoptosis protein. As mentioned above, the apoptosis of the infected host cells can reduce the replication of virus because the virus must employ the living host cell for replication.
Another specific signaling pathway of the saturation infectious stage is the production of ISG. With the binding of ligand IFN-β, receptor IFNAR1 interacts with TYK2. TYK2 can stimulate the phosphorylation of STAT1 to interact with TF IRF1 and TF IRF9. TF IRF1 induces the target gene IFNB1 and TF IRF9 targets genes ISG15 and MX1. Interferon-stimulated gene 15 (ISG15) is important to host cells against virus infection. It is involved in several cellular functions, including the limit of the newly synthesized virus proteins, induction of natural killer cell proliferation, and the enhancement of lytic capabilities of lymphokine-activated killer-like cells [83]. The target gene MX1 can antagonize the replication process of several different RNA and DNA viruses. Recent research has shown that MX1 is upregulated after SARS-CoV-2 infection, that MX1 has a direct effect on the viral ribonucleoprotein complex, and that its GTPase activity is essential for its antiviral function [84].
In summary, for the specific core HPI signaling pathways in the saturation infectious stage, the virus mRNA level begins to reduce. The activation of TNF and IFN signaling pathways may contribute to the host cell defense against SARS-CoV-2 infection. Furthermore, the enhancement of IFNB1 in common core HPI signaling pathways potentially enhances the IFN signaling pathway. Thus, the TF JUN is picked as the drug target for the specific pathogenesis in the saturation infectious stage to enhance the defense of SARS-CoV-2 infection.

2.3. Multiple-Molecule Drug Discovery and Design by DNN-Based DTI Model with Drug Design Specifications

After investigating the core HPI signaling pathways and their downstream abnormal cellular functions for SARS-CoV-2 infection at the amplification and saturation stages in the above subsection, we finally chose EGFR, AKT1, IFNB1, and SMAD3 as the drug targets for the amplification stage of SARS-CoV-2 infection and picked IFNB1, SMAD3, and JUN as the drug targets for saturation stage of SARS-CoV-2 infection. The purpose of drug targets for the amplification infectious stage is mostly to reduce the interferences of the host cell by SARS-CoV-2. The drug target JUN for therapy in the saturation infectious stage is to shorten the course of the SARS-CoV-2 infection by reducing the virus’s replication. Subsequently, the DNN-based DTI model is constructed and trained by DTI databases to predict the candidate repurposing drugs that target these significant biomarkers (drug targets). Finally, the potential multiple-molecule drug is proposed for SARS-CoV-2 infection by screening the candidate repurposing drugs with three drug design specifications. The architecture of the DNN-based DTI model for DTI prediction is shown in Figure 4.

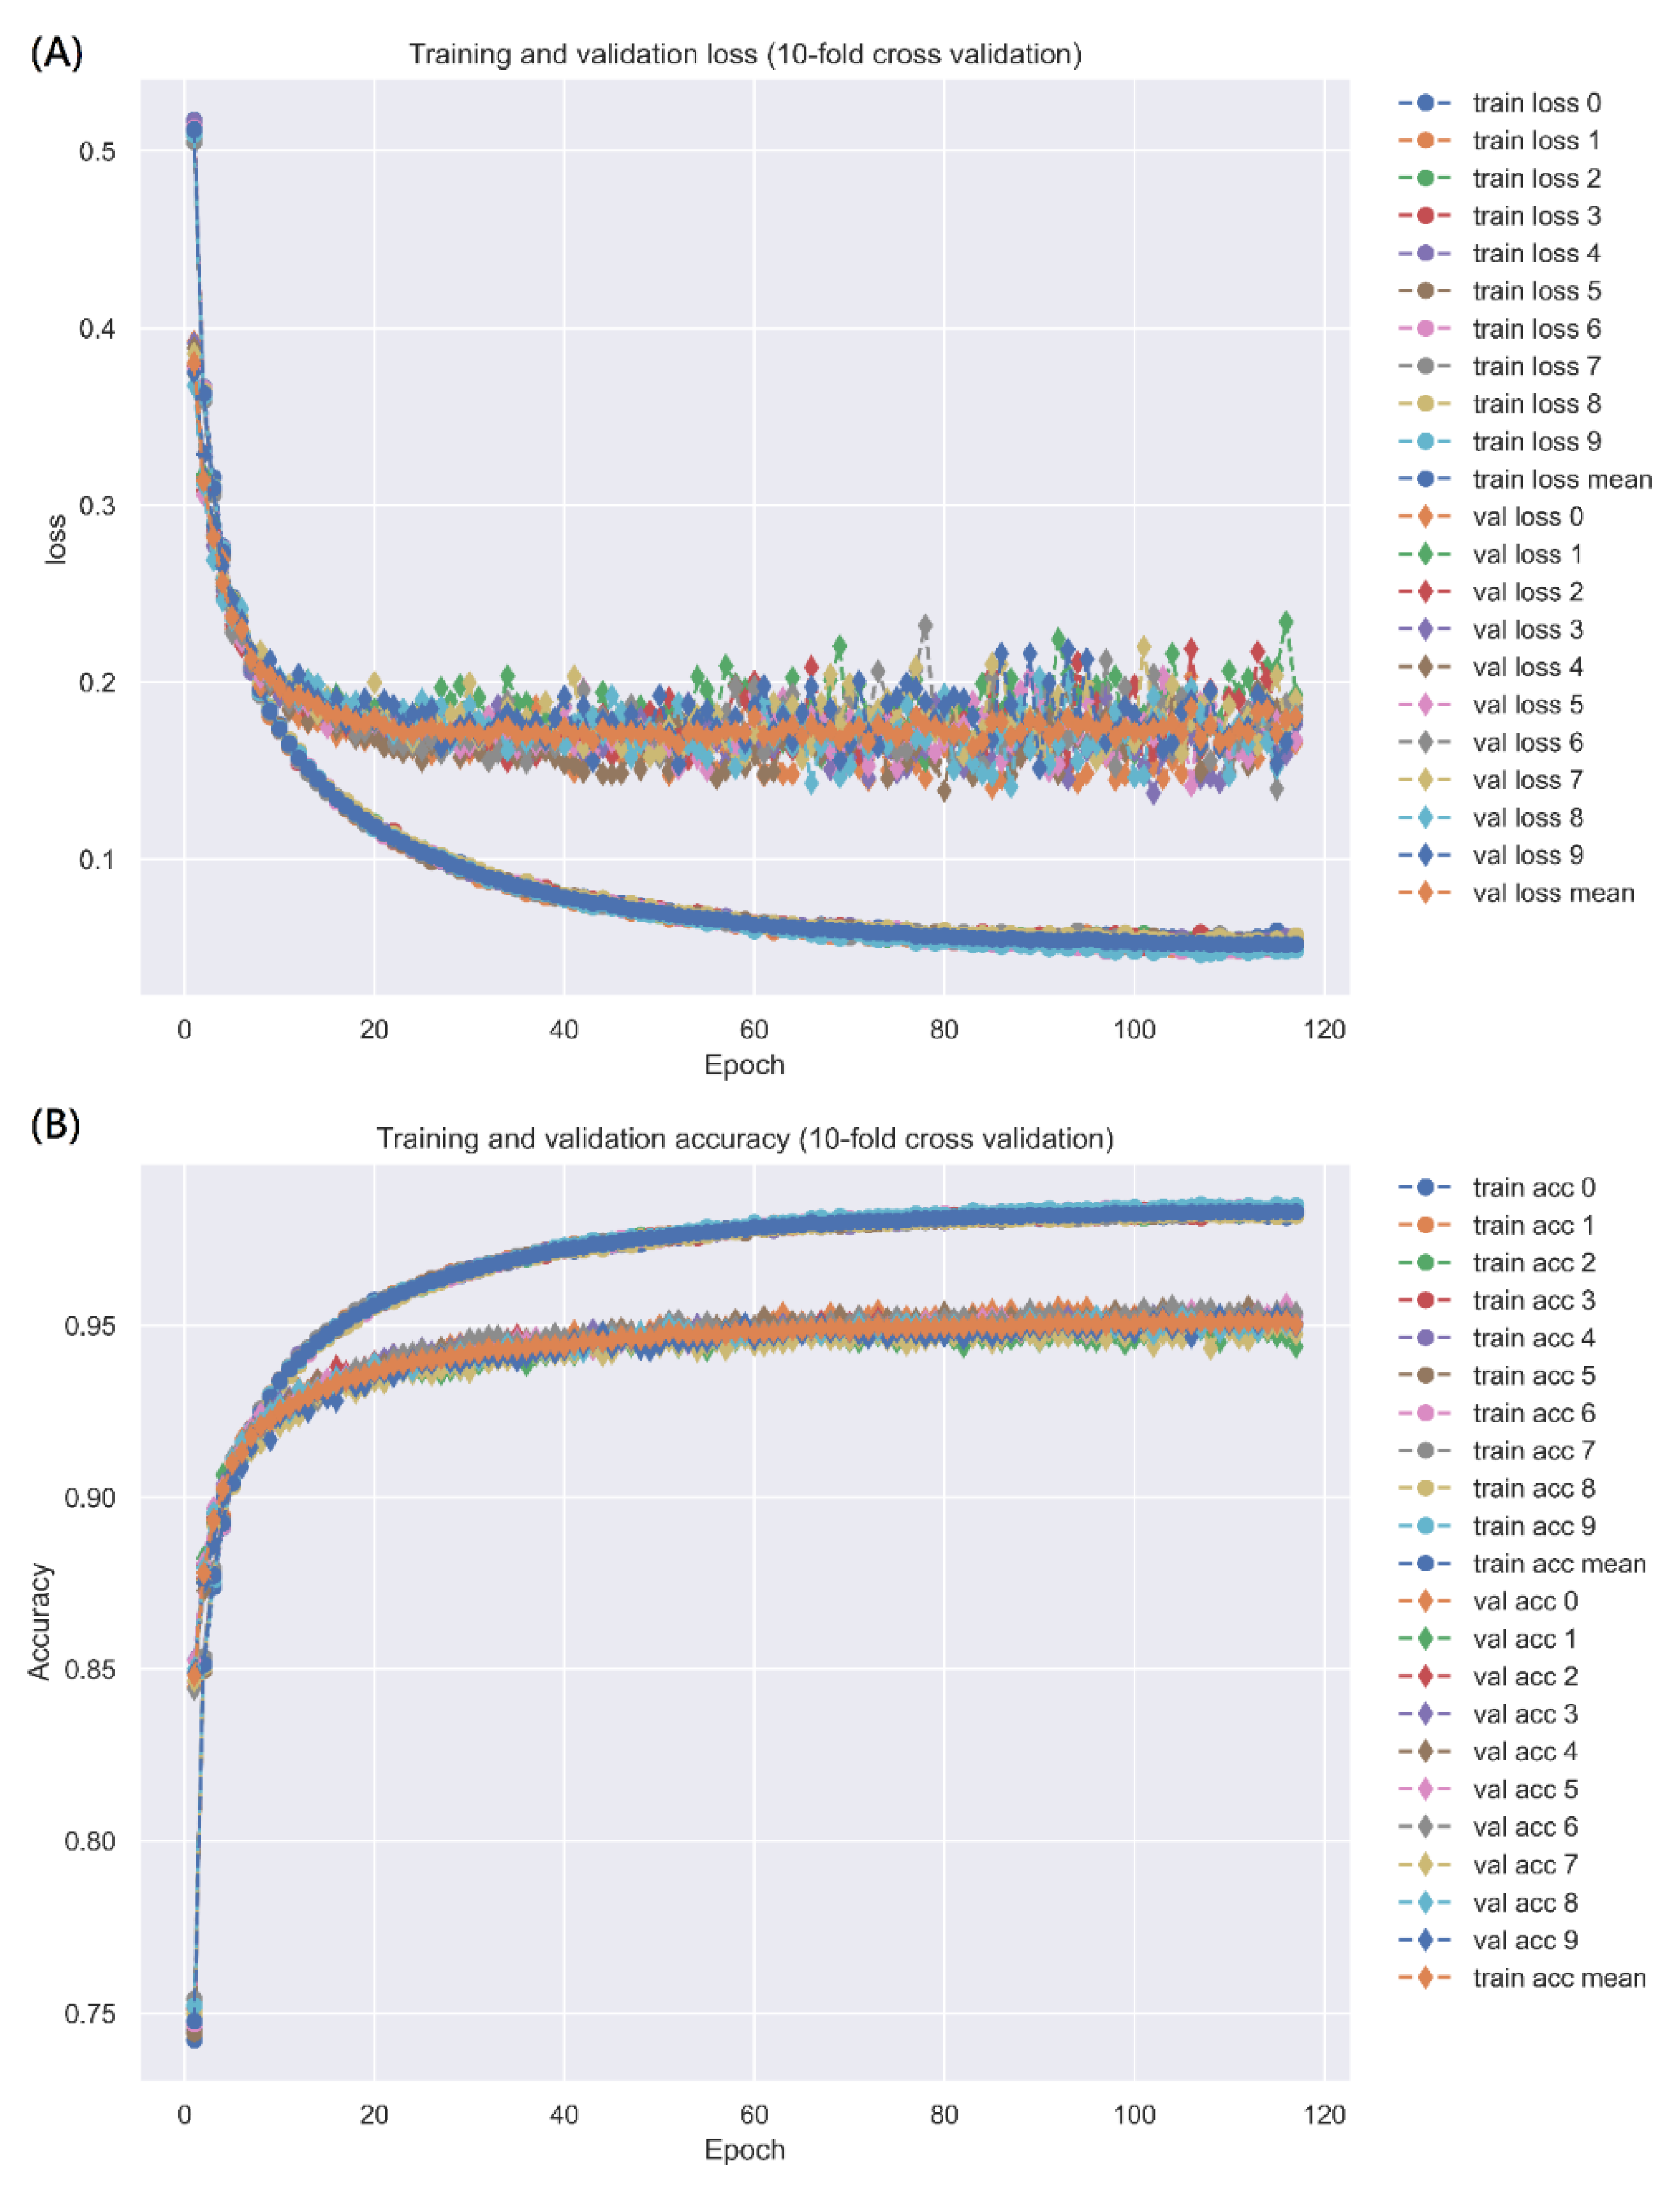
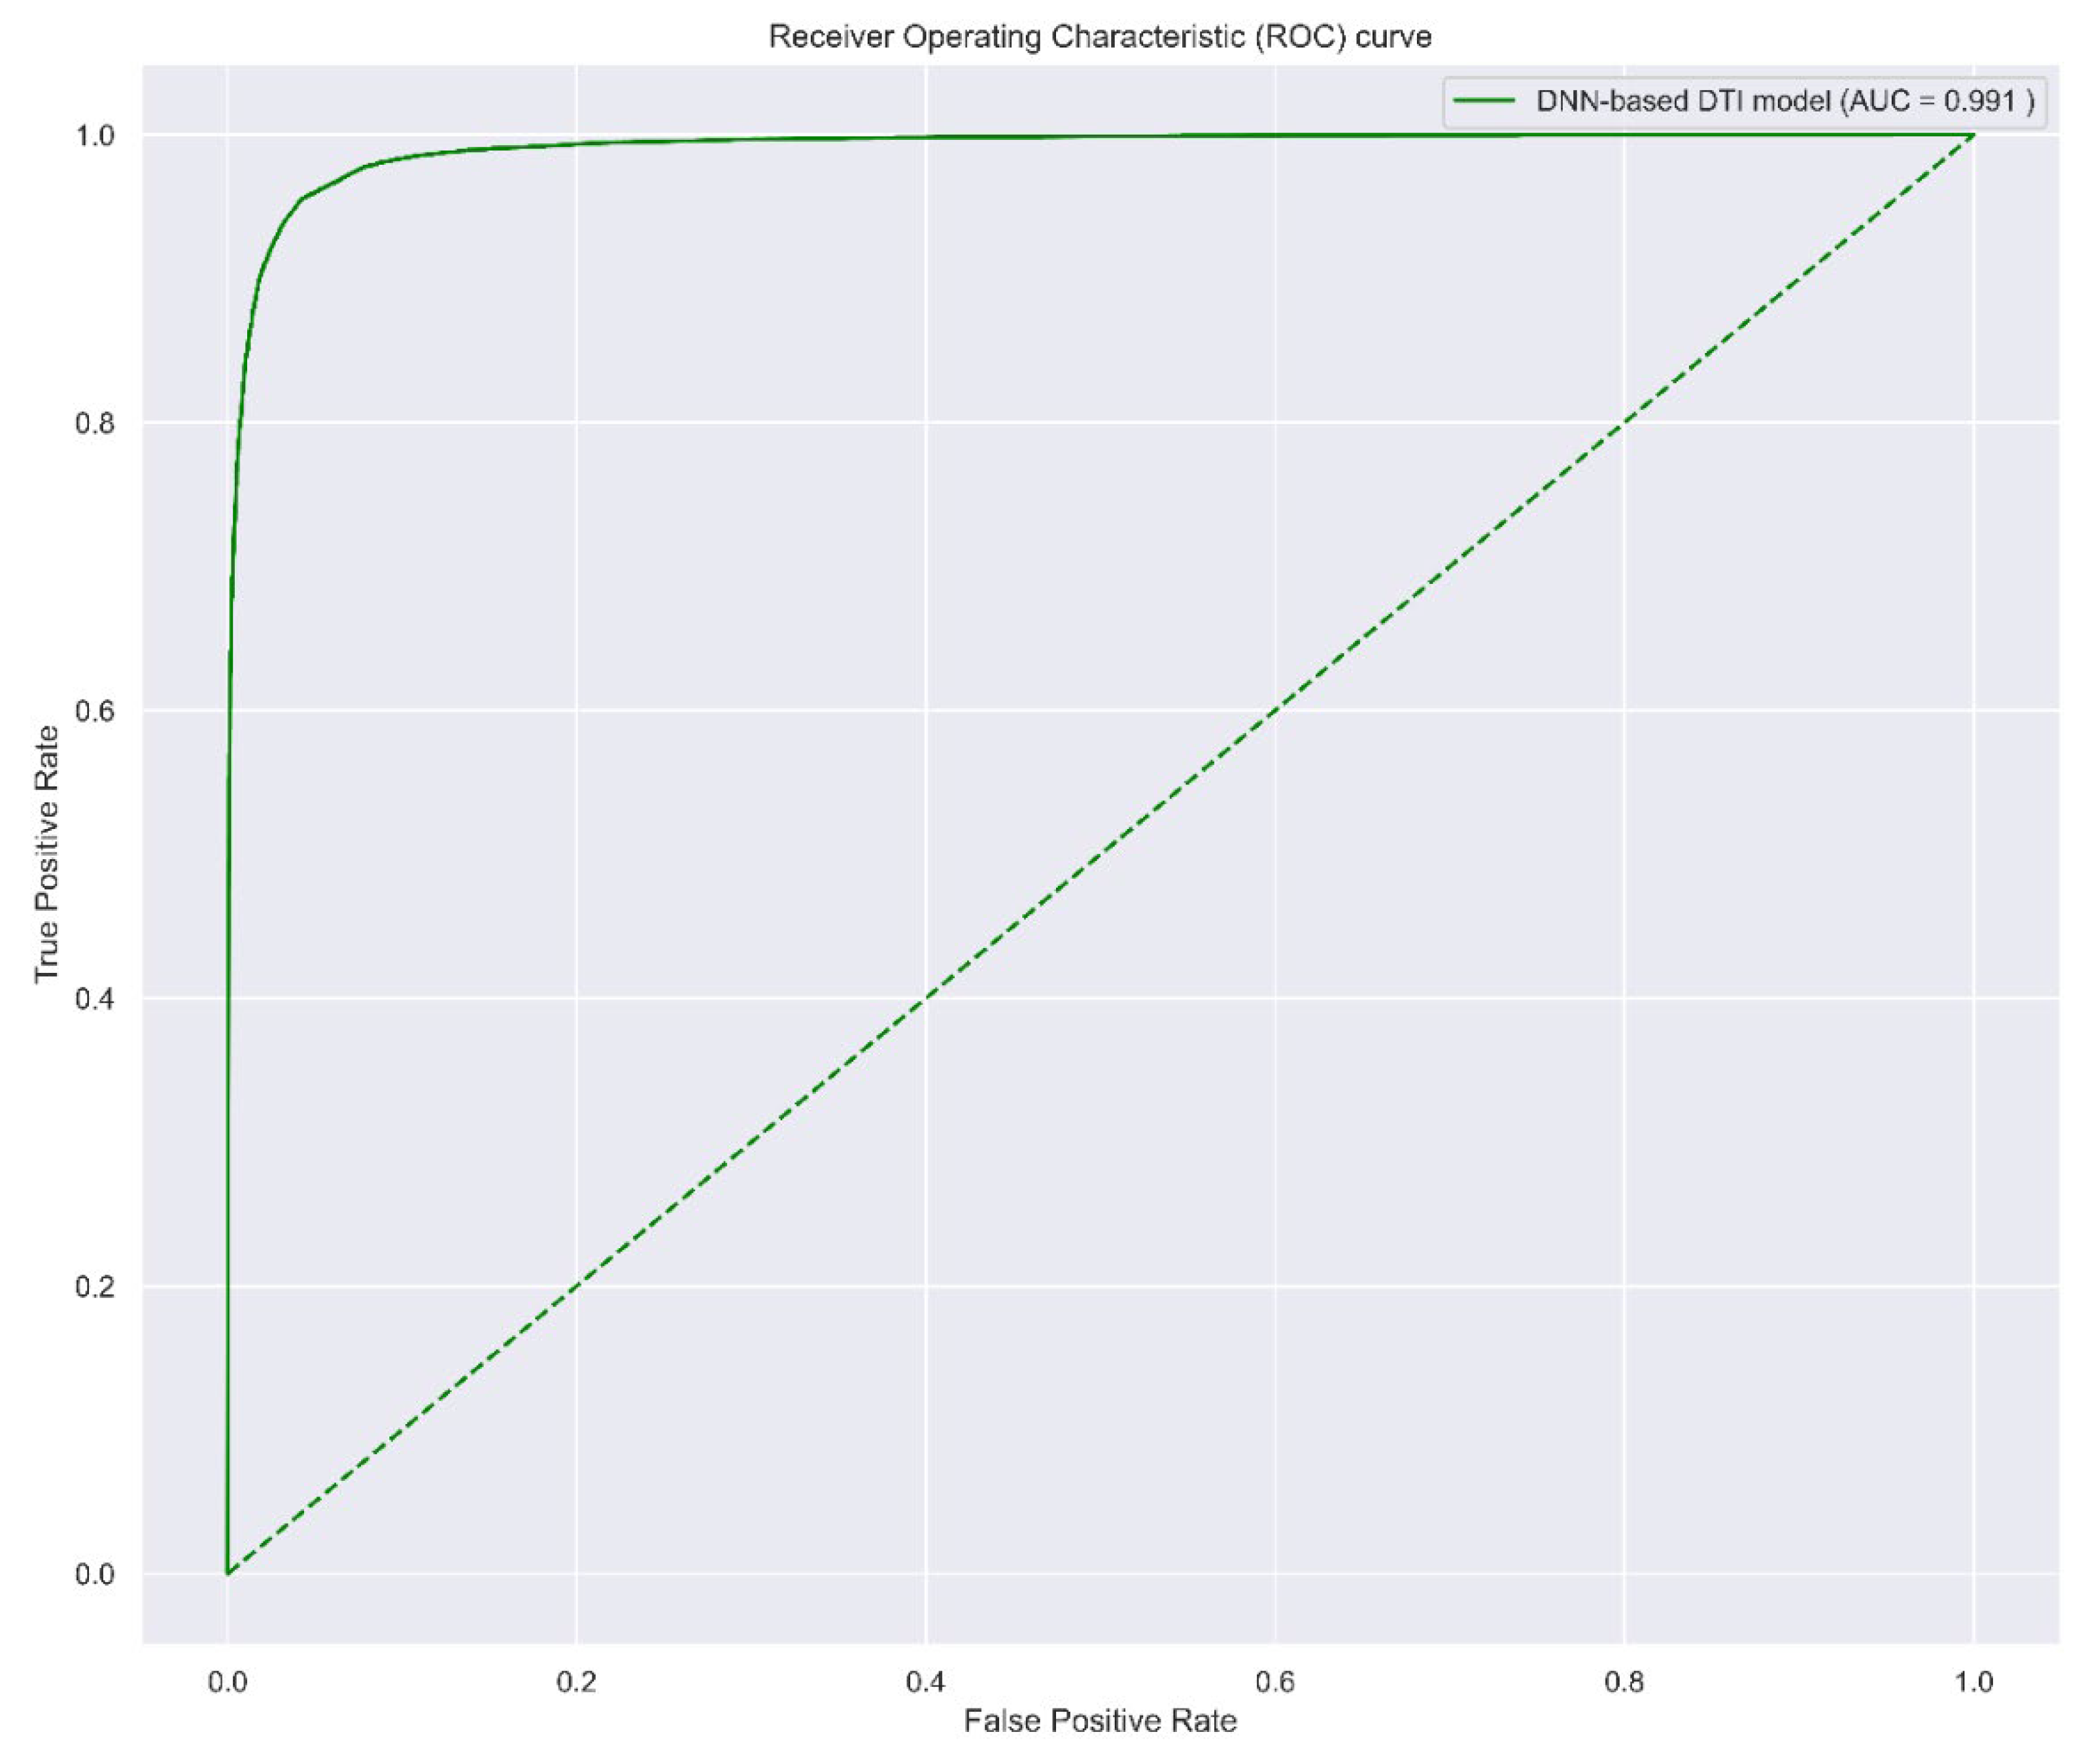
2.3.1. Prediction Performance of DNN-Based DTI Model

The model was trained by Keras with a batch size = 64, epoch = 200 (with Early Stopping), and Adam optimizer (default arguments). A 10-fold cross-validation was applied to estimate the prediction performance of the DNN-based DTI model, which is shown in Table 4. The learning process (loss and accuracy of training and validation) is visualized in Figure 5 (the early stop at epoch = 117 to avoid overfitting). Finally, the receiver operating characteristic (ROC) curve is plotted in Figure 6, and the area under the ROC curve (AUC) is 0.991, which implies that the model has good ability to distinguish between positive and negative interactions.

2.3.2. Multiple-Molecule Drug Repositioning for Disrupting the Progression of SARS-CoV-2 Infection

After training the DNN-based DTI model, we can predict the candidate drugs which target the significant drug targets found by the systems biology method. The regulation ability, toxicity, and sensitivity of the drug are considered as drug design specifications for screening the candidate drugs. The regulation ability indicates the upregulation (>0) or downregulation (<0) of the drug target interaction. Therefore, if a drug target is upregulated during infection process, we need to select a drug to downregulate it, and vice versa. A small value of sensitivity indicates a lower sensitivity to chemical perturbation for the cell, and a higher LC50 implies a lower toxicity for the body. Thus, to upregulate a target gene, we tend to find a molecular drug with a larger regulation ability, a small value of sensitivity, and a larger LC50 value. Based on these drug design specifications, some candidate drugs for the significant drug targets are shown in Table 5. Finally, the potential multiple-molecule drug shown in Table 6 is proposed for the treatment of the amplification stage of SARS-CoV-2 infection, and the potential multiple-molecule drug shown in Table 7 is proposed for the saturation stage of mild-to-moderate SARS-CoV-2 infection.

3. Discussion

After two years of the COVID-19 pandemic, many drugs have been used to treat COVID-19. Nevertheless, there is still no drug proven effective against COVID-19 and no clear mechanism for how SARS-CoV-2 affects the host cell to replicate efficiently. We first constructed the dynamic models to describe the candidate HPI-GWGEN and used HPI RNA-seq time-profile data to identify the core signaling pathways of the HPI-GWGEN during SARS-CoV-2 infection. Then, we explored the possible systematic molecular mechanism of why SARS-CoV-2 can replicate rapidly by the reverse engineering method. Although the treatment of cytokine storm (the main cause of mortality in COVID-19) is a crucial issue, the suppression of viral load is also important. For viral infection, the drugs can be designed to target the host or virus. The drugs targeting the virus are designed to target viral proteins such as viral proteases to inhibit their biological function. The rapid mutation of viruses may cause the failure of the drugs that target the virus, especially RNA viruses. The variant of viruses may not only increase the transmissibility but also cause the failure of vaccines and the drugs targeting the viral protein. Although the design of drugs targeting the virus is more popular, antiviral drugs targeting host proteins have also been used for other viral infections. For instance, the commercial drug interferon alpha has been shown to be effective against the viral infection of hepatitis B and C virus, papillomavirus (Kaposi’s sarcoma) virus, and human herpesvirus 8 [85]. The drug Nitazoxanide shows antiviral activity for some viruses by targeting the host protein and affecting the host cellular functions [85,86]. Thus, we try to find the drugs that target the host proteins to reduce the risk of the variant of SARS-CoV-2. With the temporal information of HPI RNA-seq time-solved data, we could investigate the core HPI signaling pathways of SARS-CoV-2 infection, as shown in Figure 3, to identify the significant drug targets for the amplification and saturation infectious stages. Then, we utilized the DNN-based DTI model to predict the candidate drugs which can induce or inhibit the significant biomarkers (drug targets). After screening drug design specifications, we suggested the multiple-molecule drug consisting of bosutinib, erlotinib, and 17-beta-estradiol for the treatment of the amplification stage of SARS-CoV-2 infection and the multiple-molecule drug consisting of erlotinib, 17-beta-estradiol, and sertraline for the treatment of the saturation stage of mild-to-moderate SARS-CoV-2 infection.
In the multiple-molecule drug for the amplification stage of SARS-CoV-2 infection, Bosutinib, a synthetic quinolone derivative and tyrosine kinase inhibitor, is commonly used for the treatment of chronic myeloid leukemia. It has been shown that Bosutinib can inhibit the activation of EGFR and induce the apoptosis of cells [87]. In addition to the inhibition of EGFR activation, it can inhibit the activation of Akt as well [87]. Erlotinib, a quinazoline derivative, is a common EGFR inhibitor that is used to treat cancer, especially for EGFR mutation-positive, non-small-cell lung cancer [88]. In addition to the inhibition of EGFR, a previous study has also shown that Erlotinib can inhibit the activation of Smad2/3 [89]. Furthermore, Erlotinib was reported to prevent fibrosis development in in vivo models [51], and it was proposed as a therapeutic agent in the treatment of COVID-19 [90]. For the drug targeting IFNB1, we predicted 17-beta-estradiol. 17-beta-estradiol is a synthetic form of estradiol, a steroid sex hormone, which may be involved in inflammation and the immune [91]. A previous study shows that 17-beta-estradiol can induce IFN, especially IFN-β, via the activation of IRF1 [92]. 17-beta-estradiol is also reported to suppress the phosphorylation of Smad2 and Smad3 and reduce their gene reporter activity in response to TGF-beta [93]. Interestingly, many observations have shown that the mortality rate of men is higher than women [94,95,96]. Estradiol may be a protective role against COVID-19 [97]. Hence, it was also proposed as a therapy of COVID-19 [98]. Here, we think that it can induce IFNB1 and suppress the phosphorylation of SMAD3 to achieve protection against COVID-19. In the multiple-molecule drug for the saturation stage of SARS-CoV-2 infection, Sertraline, a selective serotonin reuptake inhibitor used in the treatment of depression, can upregulate JUN and induce apoptosis [99,100,101]. The apoptosis of infected cells is important to clean the viruses in infected cells. In addition to the upregulation of JUN, the anticoagulant property of Sertraline has been reported as well [102].
In summary, we applied the systems biology method to clearly understand the molecular mechanism of rapid replication of SARS-CoV-2. Subsequently, we identified the significant biomarkers as drug targets to destroy the proper microenvironment for the replication of SARS-CoV-2 or enhance the defense of host cells against SARS-CoV-2. EGFR, AKT1, IFNB1, and SMAD3 are chosen as the drug targets for the amplification stage of SARS-CoV-2 infection, and IFNB1, SMAD3, and JUN are picked out as the drug targets for the saturation stage of SARS-CoV-2 infection. After training the DNN-based DTI model with DTI databases, we could predict the potential molecular drugs with three design specifications for the treatment of SARS-CoV-2 infection. Finally, we proposed the combination of bosutinib, erlotinib, and 17-beta-estradiol as the multiple-molecule drug for the treatment of the amplification stage of SARS-CoV-2 infection and the combination of erlotinib, 17-beta-estradiol, and sertraline as the multiple-molecule drug for the treatment of the saturation stage of mild-to-moderate SARS-CoV-2 infection.

4. Materials and Methods

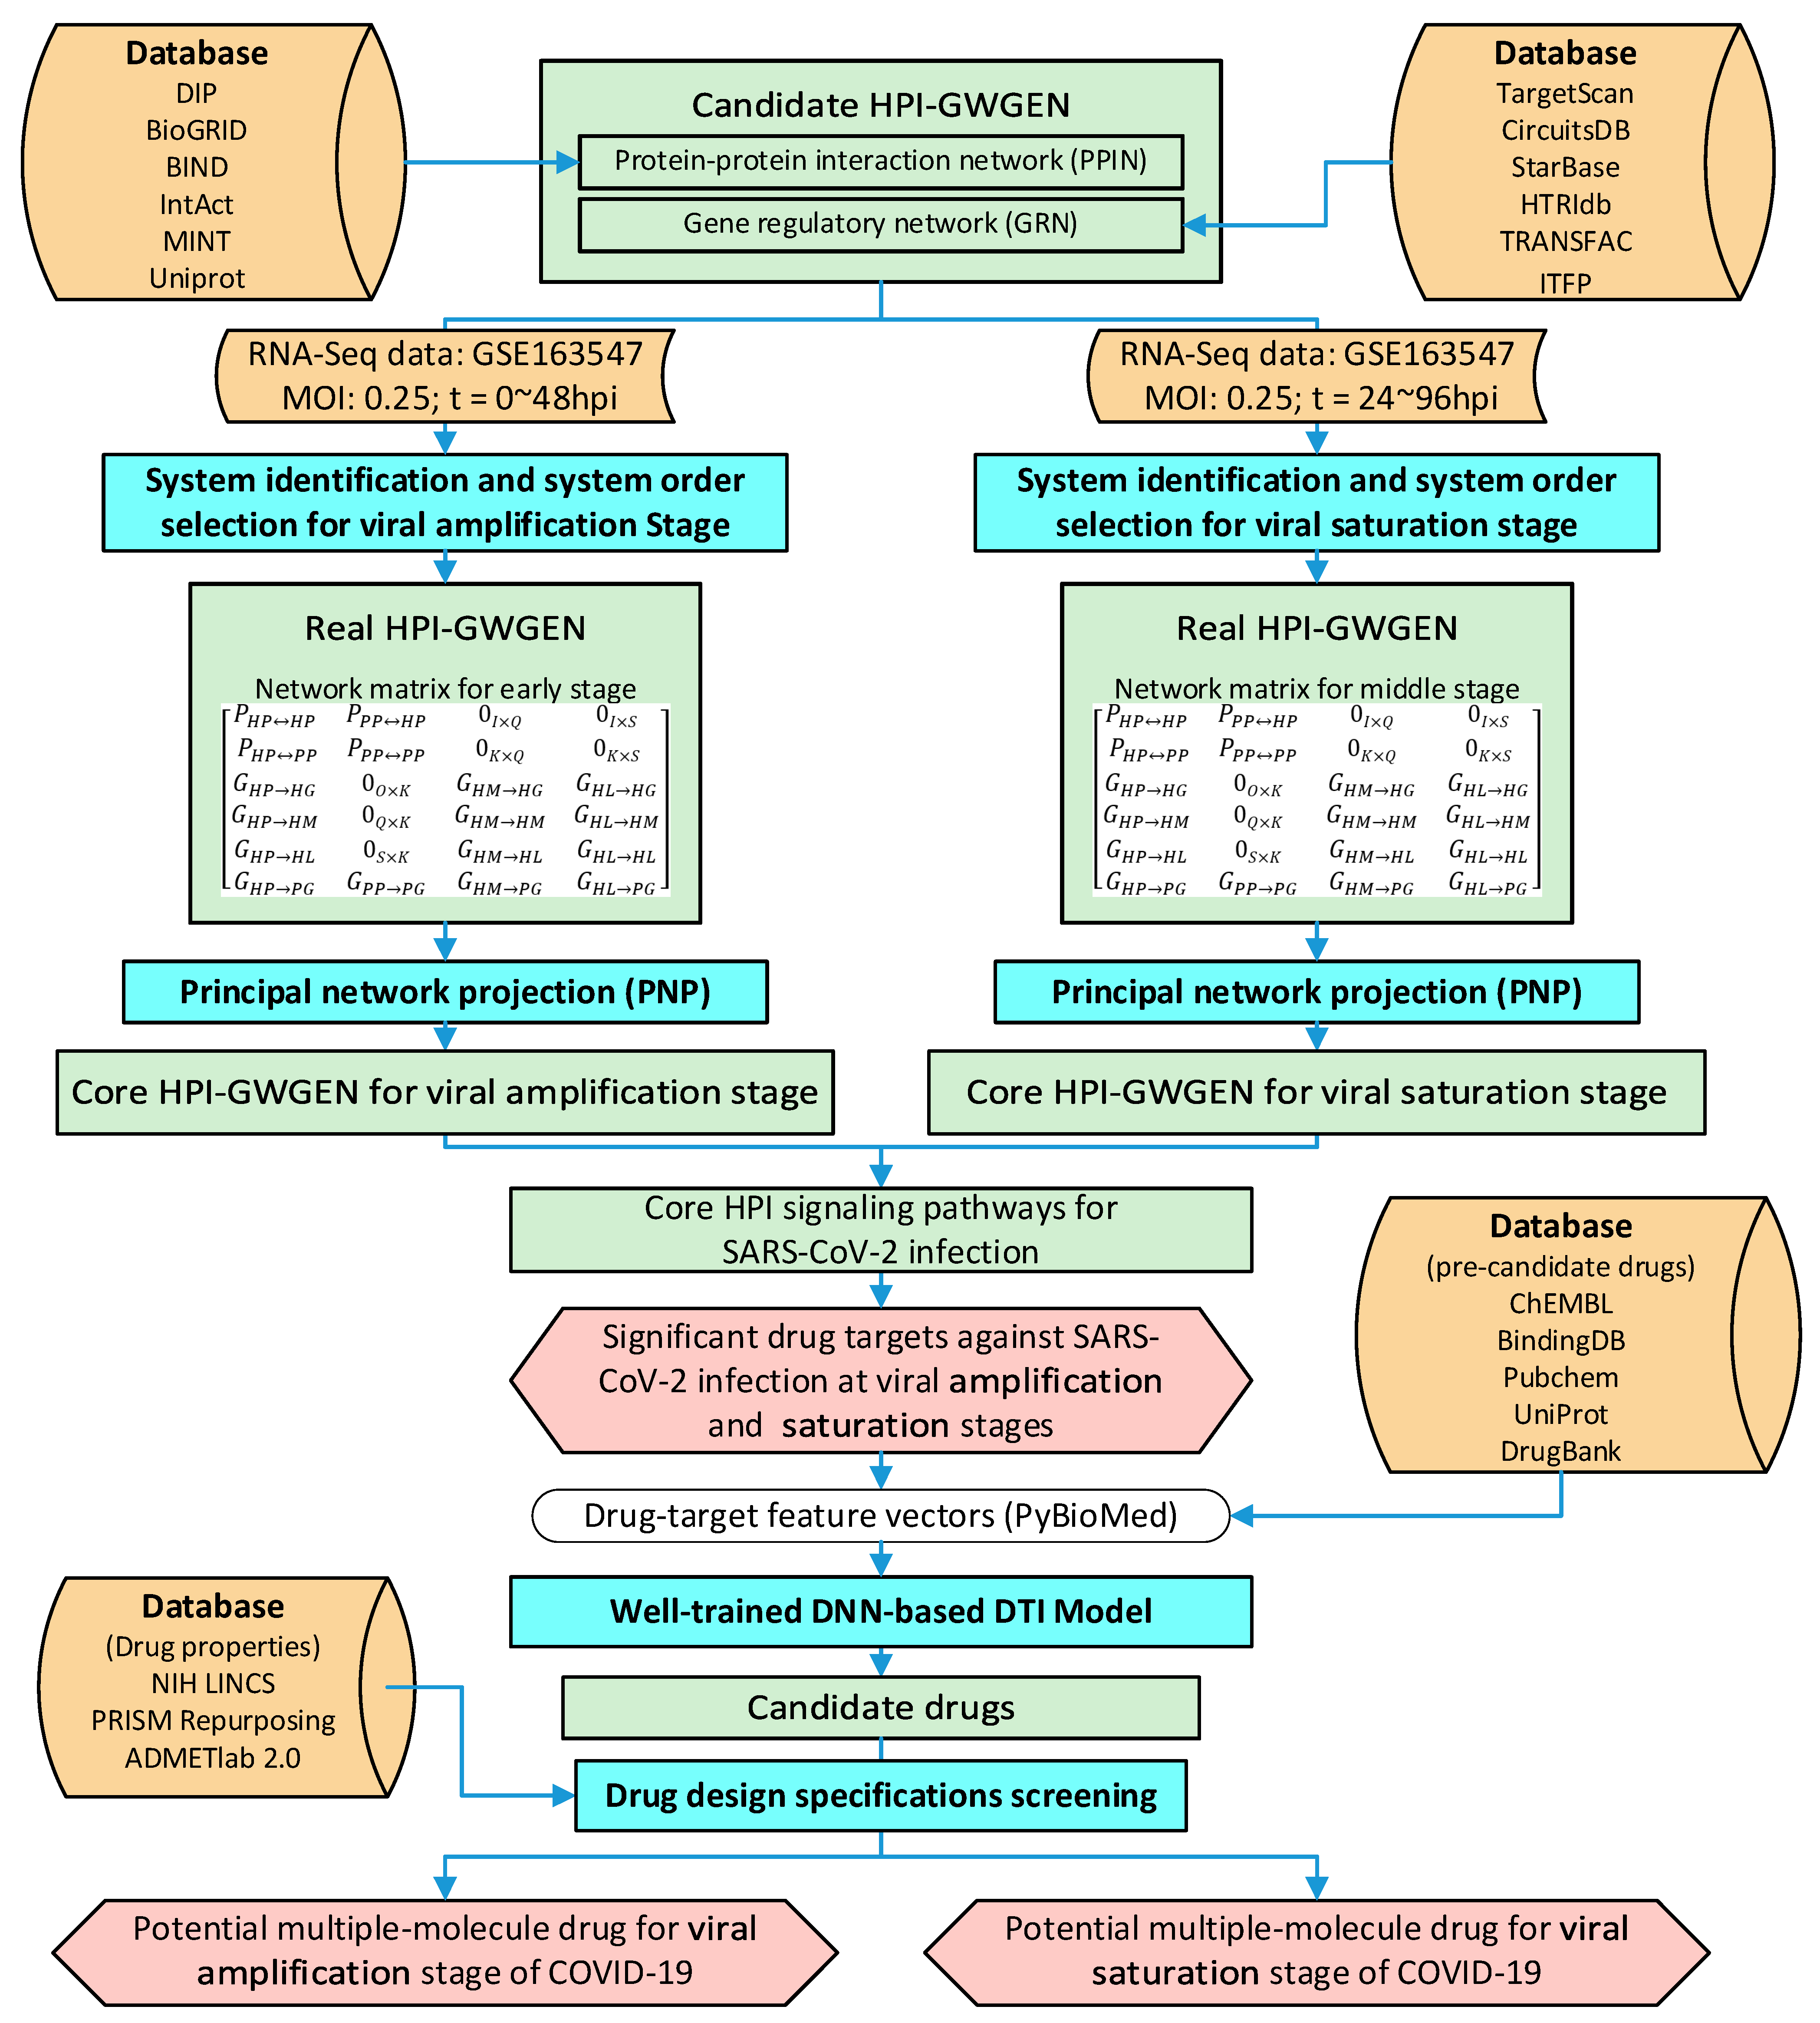
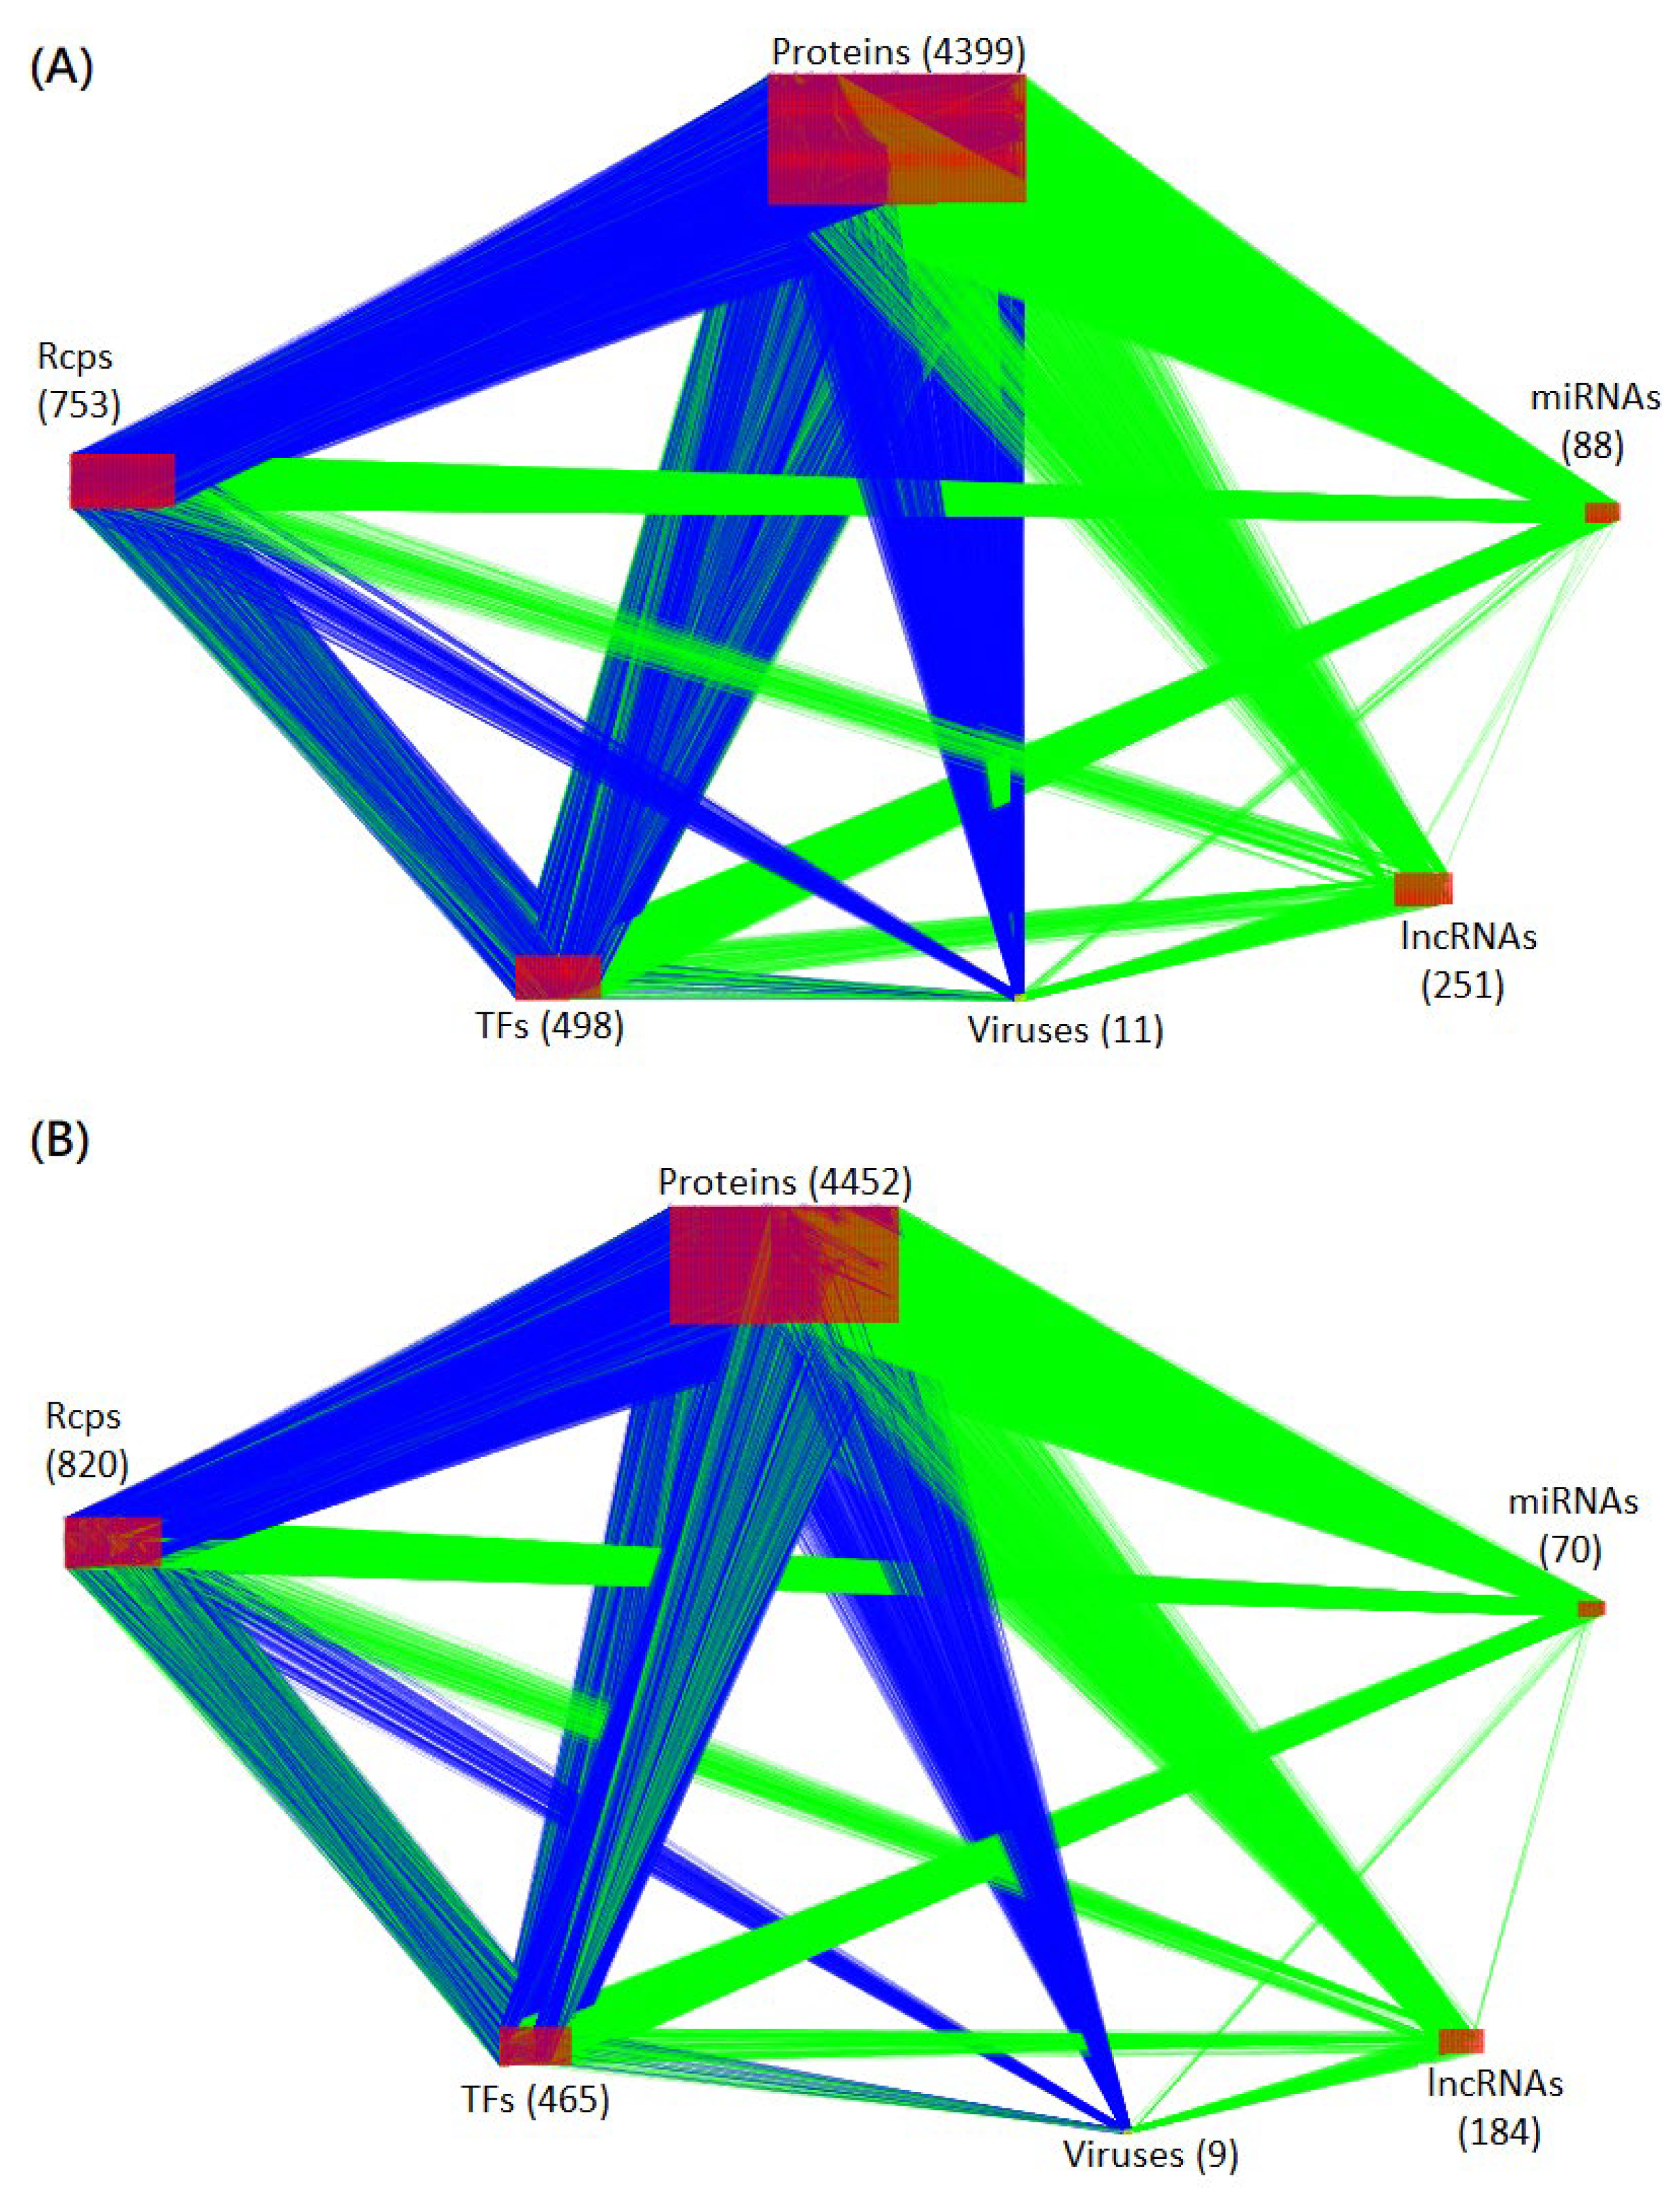
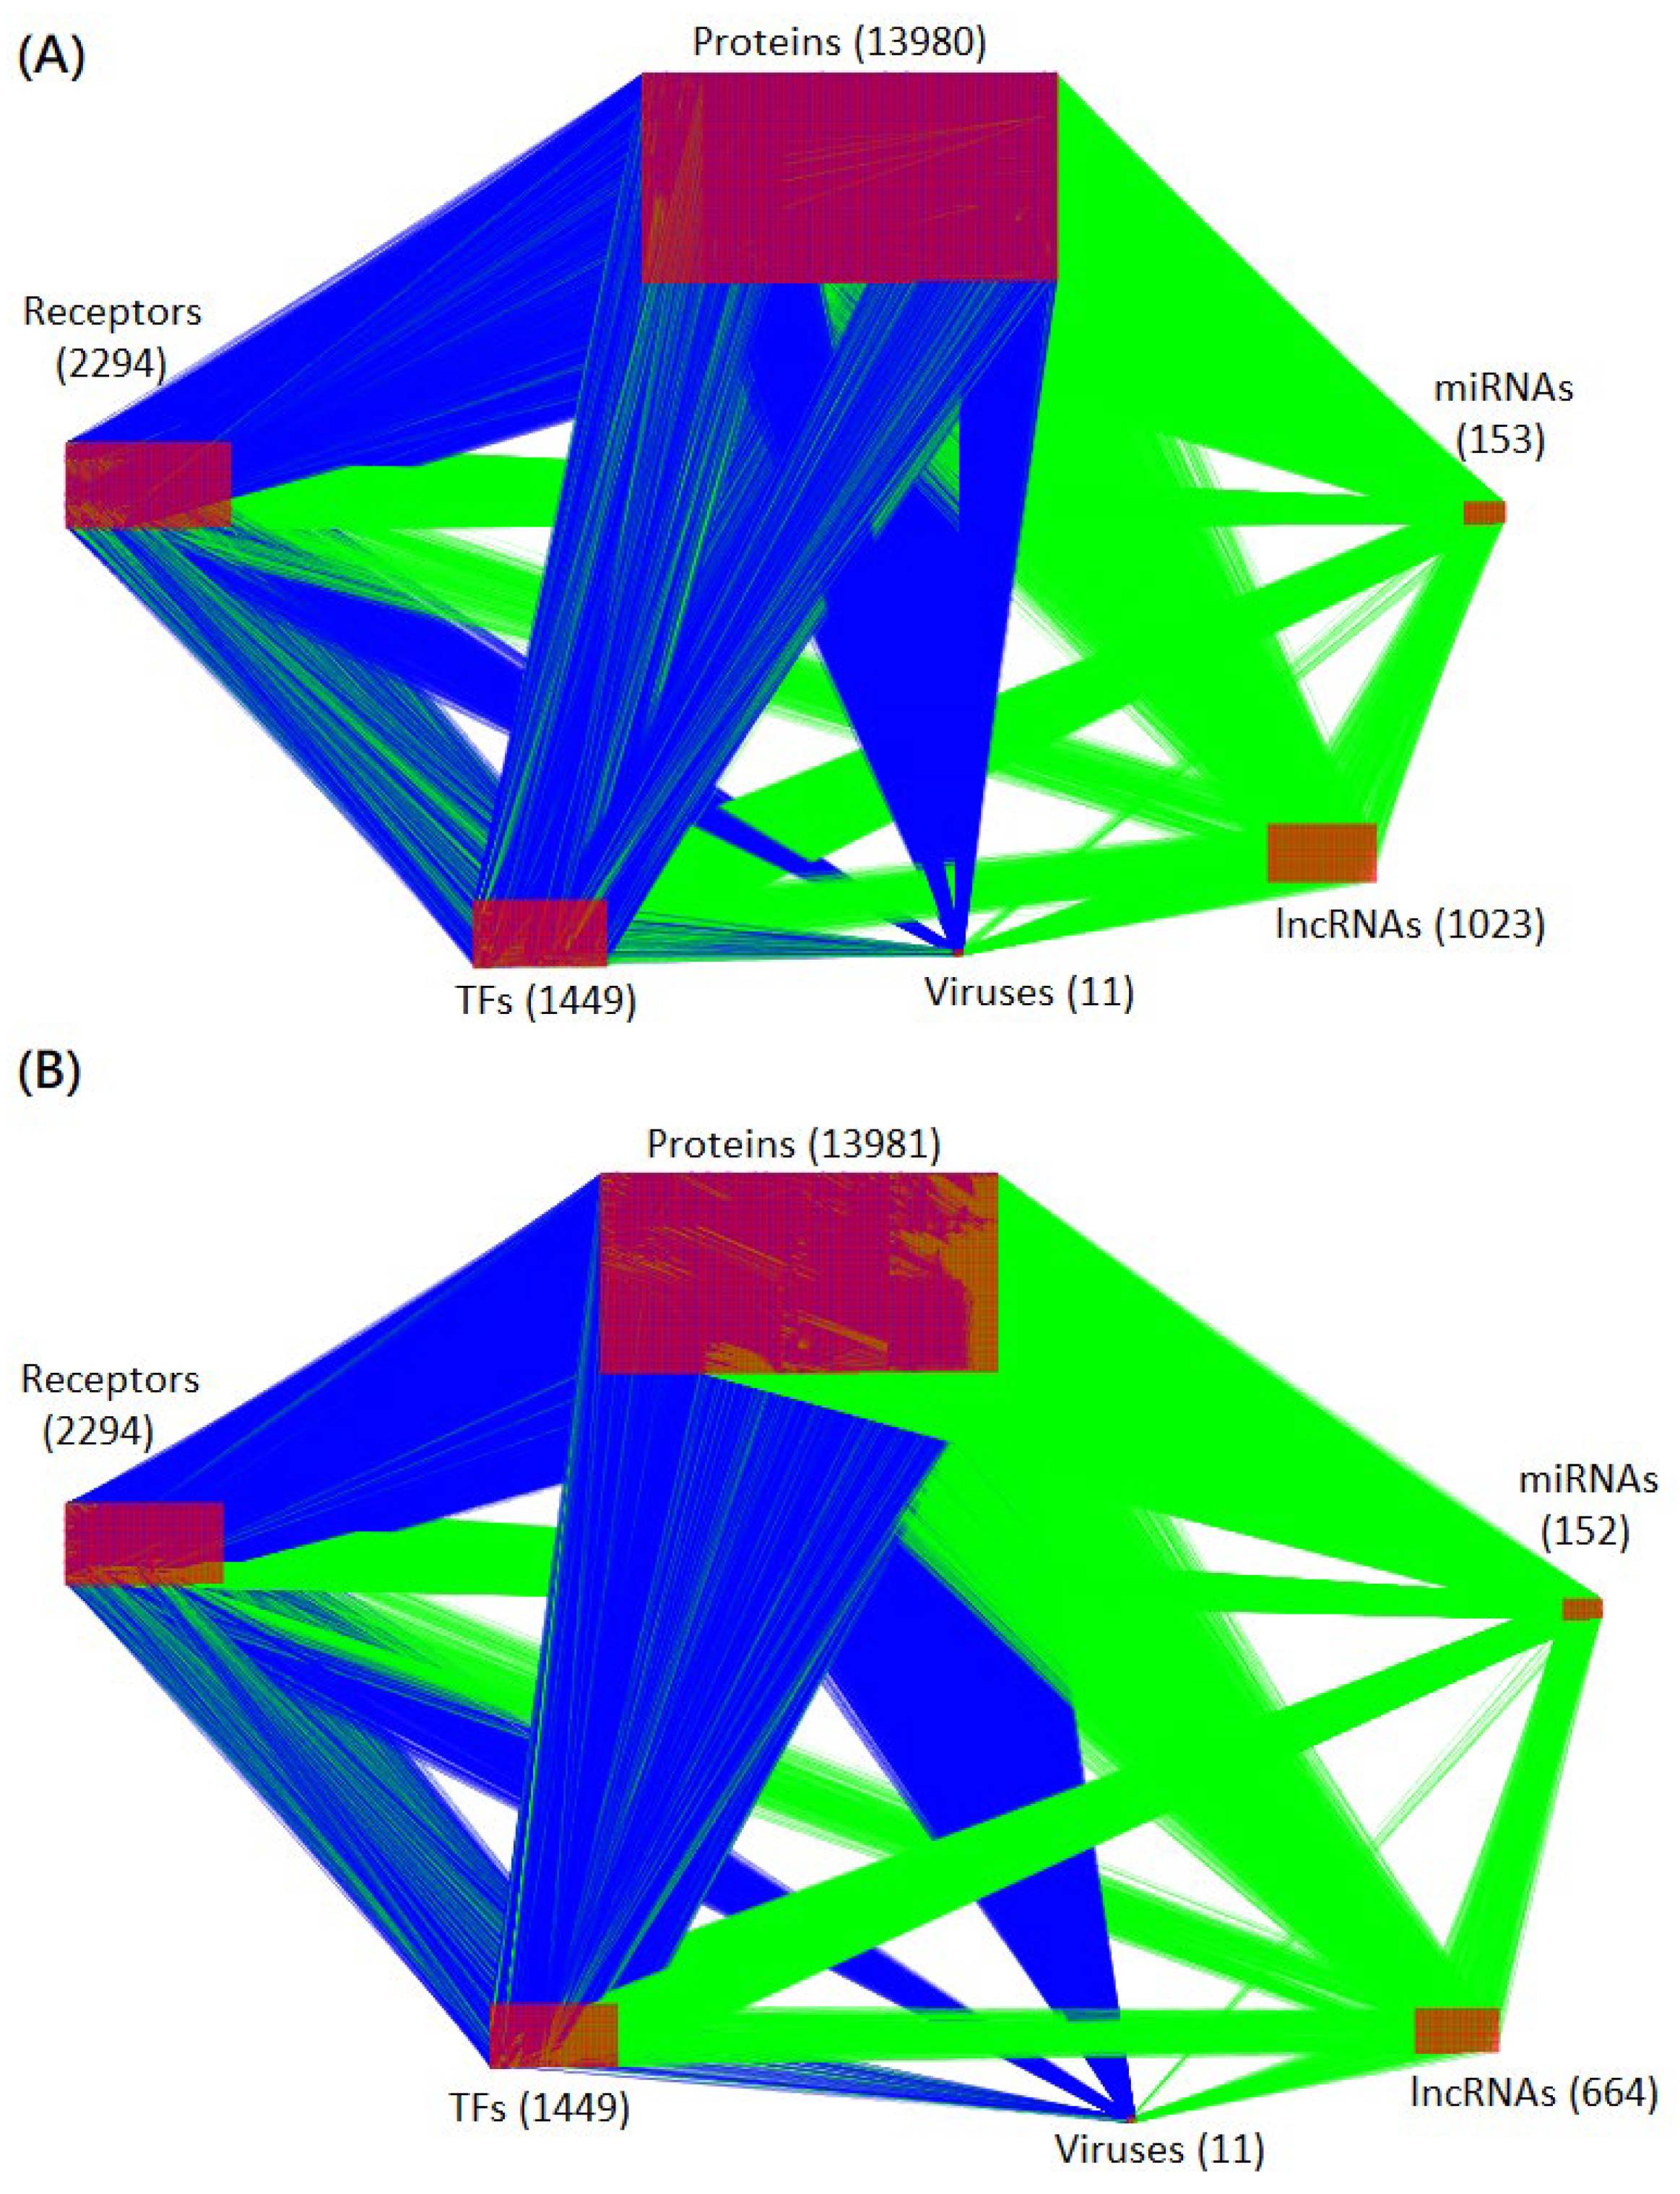
4.1. Construction of the Candidate HPI-GWGEN Using Big Data Mining

The HPI-GWGEN contains two networks: the HPI protein–protein interaction network (HPI-PPIN) and the HPI gene regulation network (HPI-GRN). Both of them can be further classified into the host intraspecies network, host–pathogen interspecies network, and pathogen intraspecies network. In the candidate HPI-GWGEN, we are only concerned with whether proteins, genes, miRNAs, or lncRNAs in the candidate HPI-GWGEN have existing interactions or regulations. This can be expressed by a Boolean matrix.
The host intraspecies of candidate HPI-PPINs were constructed using the data from some databases, including the Database of Interacting Proteins (DIP) [46], the Biological General Repository for Interaction Datasets database (BioGRID) [45], the Biomolecular Interaction Network Database (BIND) [44], the IntAct Molecular Interaction Database (IntAct) [43], and the Molecular INTeraction Database (MINT) [41]. The pathogen intraspecies and host–pathogen interspecies of candidate PPIN were constructed from BioGRID [45], IntAct [43], and UniProt [42].
The databases for the construction of the host intraspecies of candidate HPI-GRNs included TargetScan [40], CircuitsDB [39], and starBase v2.0 [38] for epigenetic regulation (miRNA and lncRNA) and the Human Transcriptional Regulation Interactions database (HTRIdb) [35], the Transcription Factor database (TRANSFAC) [37], and Integrated Transcription Factor Platform database (ITFP) [36] for other regulations (transcription factors). There are currently not enough regulations between humans and SARS-Cov-2 to construct an HPI-GRN. We first supposed that the regulations of the host on the virus genes are not negative. We then used systematic methods to eliminate the false positives.

4.2. System Identification of HPI-GWGEN Using HPI RNA-Seq Time-Profile Data

4.2.1. HPI RNA-Seq Time-Profile Data

To find the crosstalk between humans and SARS-CoV-2, the dynamic models for the candidate HPI-GWGEN were constructed, and HPI RNA-seq time-profile data were utilized to present the expressions of HPI-GWGEN during the amplification and saturation infectious stages for these HPI-GWGEN models. The dynamic models can describe the candidate HPI-GWGEN through the reverse engineering method [103] using HPI RNA-seq time-profile data to reflect the system behavior of HPI-GWGEN during SARS-CoV-2 infection.
The HPI RNA-seq data could be downloaded from the National Center for Biotechnology Information (NCBI) (GEO number: GSE163547) [104]. We found the average for two samples infected with the MOI of 0.25 at 0, 4, 24, 48, 72, and 96 h post-infection (hpi). The genome-wide HPI RNA-seq time-profile data were employed to identify the system parameters of candidate HPI-GWGENs using the system identification method [103]. Since the mRNA level of SARS-CoV-2 majorly increased with time, reached the peak at 48 hpi, and slowly decreased (saturation) after 48 hpi, we defined the period from 0 to 48 hpi as the (viral) amplification stage and the period from 24 to 96 hpi as the (viral) saturation stage. With the Gencode v35/v27 annotation, the nodes were sorted into six types to be adopted for the dynamic models: host proteins, virus proteins, host genes, host miRNAs, host lncRNAs, and virus genes.

4.2.2. Dynamic Models for HPI-GWGEN

For the candidate HPI-PPIN in candidate HPI-GWGEN, the expression levels of host proteins and interactive pathogen proteins can be modeled as the following dynamic equations [103]:
p i H t + 1 = p i H t + h = 1 H i C h i p H H   p i H t p h H t + v = 1 V i C v i p P H p i H t p v P t   + α H i g i H t γ H i p i H t + β H i + n H i t α H i   0   a n d γ H i   0 ,   for   i = 1 ,   2 ,   ,   I  
where p i H t , p h H t , p v P t , and g i H t represent the expression level of the i th host protein, the h th host protein, the v th pathogen protein, and the i th host gene at time t, respectively; H i and V i are the number of the host proteins and the pathogen proteins that interact with the i th host protein, respectively; C h i p H H and C v i p H P specify the interactive ability between the h th host protein and the i th host protein and between the v th pathogen protein and the i th host protein, respectively; α H i , γ H i , and β H i indicate the translation rate from the corresponding mRNA, the degradation rate, and the basal activity level of the i th host protein, respectively; the basal level denotes the unknown or unavailable interaction such as phosphorylation; n H i t is the stochastic noise of the i th host protein at time t; I is the total number of host proteins in candidate HPI-PPIN.
The dynamic interaction models of pathogen proteins of HPI-PPIN in the candidate HPI-GWGEN can be described as the following discrete-time dynamic equations [103]:
p k P t + 1 = p k P t + h = 1 H k C h k p H P   p k P t p h H t + v = 1 V k C v k p P P p k P t p v P t + α P k g k P t γ P k p k P t + β P k + n P k t α P k   0   a n d γ P k   0 ,   for   k = 1 ,   2 ,   ,   K
where p k P t , p h H t , p v P t , and g k P t denote the expression level of the k th pathogen protein, the h th host protein, the v th pathogen protein, and the k th pathogen gene at time t, respectively; H k and V k are the number of the host proteins and the pathogen proteins that interact with the k th pathogen protein in a candidate HPI-PPIN, respectively; C h k p H P and C v k p P P specify the interactive ability between the h th host protein and the k th pathogen protein and between the v th pathogen protein and the k th pathogen protein, respectively; α P k , γ P k , and β P k indicate the translation rate from the corresponding mRNA, the degradation rate, and the basal activity level of the k th pathogen protein, respectively; n P k t represents the stochastic noise of the k th pathogen protein at time t; K is the total number of pathogen proteins in a candidate HPI-PPIN.
The dynamic regulatory models of host genes in the HPI-GRN of a candidate HPI-GWGEN can be depicted as the following discrete-time dynamic equations [103]:
g o H t + 1 = g o H t + h = 1 H o C h o T G   p h H t + μ = 1 U o C μ o M G g o H t m μ t + λ = 1 L o C λ o L G l λ t   γ G o g o H t + β G o + n G o t ,   C μ o M G   0   a n d γ G o   0 for   o = 1 ,   2 ,   ,   O
where g o H t , p h H t , m μ t , and l λ t denote the expression level of the o th host gene, the h th host TF, the μ th host miRNA, and the λ th host lncRNA at time t, respectively; H o , U o , and L o represent the number of host TFs, host miRNAs, and host lncRNAs that have regulation on the o th host gene, respectively; C h o T G , C μ o M G , and C λ o L G specify the regulation ability of the h th host TF, the μ th host miRNA, and the λ th host lncRNA on the o th host gene, respectively; γ G o and β G o indicate the degradation rate and the basal activity level of the o th host gene, respectively; n G o t is the stochastic noise of the o th host gene at time t; O is the total number of host genes in a candidate HPI-GRN.
The dynamic regulatory models of the host miRNAs in the HPI-GRN of a candidate HPI-GWGEN can be modeled as the following discrete-time dynamic equations [103]:
m q t + 1 = m q t + h = 1 H q C h q T M   p h H t + μ = 1 U q C μ q M M m q t m μ t + λ = 1 L q C λ q L M l λ t γ M q m q t + β M q + n M q t ,   C μ q M M   0   a n d γ M q   0 for   q = 1 ,   2 ,   ,   Q
where m q t , p h H t , m μ t , and l λ t denote the expression level of the q th host miRNA, the h th host TF, the μ th host miRNA, and the λ th host lncRNA at time t, respectively; H q , U q , and L q represent the number of host TFs, host miRNAs, and host lncRNAs that have regulation on the q th host miRNA, respectively; C h q T M , C μ q M M , and C λ q L M specify the regulation ability of the h th host TF, the μ th host miRNA, and the λ th host lncRNA on the q th host miRNA, respectively; γ M q and β M q represent the degradation rate and the basal activity level of the q th host miRNA, respectively; n M q t is the stochastic noise of the q th host miRNA at time t; Q is the total number of host miRNAs in candidate HPI-GRN.
The dynamic regulatory models of the host lncRNAs in the HPI-GRN of a candidate HPI-GWGEN can be depicted as the following discrete-time dynamic equations [103]:
l s t + 1 = l s t + h = 1 H s C h s T L   p h H t + μ = 1 U s C μ s M L l s t m μ t + λ = 1 L s C λ s L L l λ t γ L s l s t + β L s + n L s t ,   C μ s M L   0   a n d γ L s   0 for   s = 1 ,   2 ,   ,   S
where l s t , p h H t , m μ t , and l λ t denote the expression level of the s th host lncRNA, the h th host TF, the μ th host miRNA, and the λ th host lncRNA at time t, respectively; H s , U s , and L s represent the number of host TFs, host miRNAs, and host lncRNAs that have regulation on the s th host lncRNA, respectively; C h s T L , C μ s M L , and C λ s L L specify the regulation ability of the h th host TF, the μ th host miRNA, and the λ th host lncRNA on the s th host lncRNA, respectively; γ L s and β L s indicate the degradation rate and the basal activity level of the s th host lncRNA, respectively; n L s t is the stochastic noise of the s th host lncRNA at time t; S is the total number of host lncRNAs in a candidate HPI-GRN.
The dynamic regulatory models of the pathogen genes in the HPI-GRN of a candidate HPI-GWGEN can be depicted as the following discrete-time dynamic equations [103]:
g w P t + 1 = g w P t + h = 1 H w C h w T V   p h H t + μ = 1 U w C μ w M V g w P t m μ t + λ = 1 L w C λ w L V l λ t + y = 1 Y w C y w P V   p y P t γ V w g w P t + β V w + n V w t ,   C μ w M V   0   a n d γ V w   0 for   w = 1 ,   2 ,   ,   W
where g w P t , p h H t , m μ t , l λ t , and p y P t denote the expression level of the w th pathogen gene, the h th host TF, the μ th host miRNA, the λ th host lncRNA and y th pathogen protein at time t, respectively; H w , U w , L w , and Y w represent the number of host TFs, host miRNAs, host lncRNAs, and pathogen TFs that have regulation on the w th pathogen gene, respectively; C h w T V , C μ w M V , C λ w L V , and C y w P V specify the regulation ability of the h th host TF, the μ th host miRNA, the λ th host lncRNA, and the y th pathogen protein on the w th pathogen gene, respectively; γ V w and β V w indicate the degradation rate and the basal activity level of the w th pathogen gene, respectively; n V w t is the stochastic noise of the w th pathogen gene at time t; W is the total number of pathogen genes in a candidate HPI-GRN.

4.2.3. System Identification and System Order Selection for HPI-GWGEN

With the discrete-time dynamic models for the candidate HPI-GWGEN, we can perform system identification using HPI RNA-seq time-profile data. Nevertheless, the number of parameters may be larger than the number of samples, which may cause over-fitting in the least square parameter estimation. Furthermore, the candidate HPI-GWGEN contains many false positives. Thus, we used the cubic spline interpolation to solve the over-fitting problem in the system identification process [103]. Then, we applied a system order detection method, the Akaike information criterion (AIC) [103], to detect the system order of the dynamic equations of protein interaction and gene regulation after the system identification to prune the false positives out of the system order in the candidate HPI-GWGENs to obtain the real HPI-GWGEN.
To estimate the parameters in Equations (1)–(6), we arranged each equation as the linear regression form with regressor (expression level from RNA-seq data) ω i t and the parameter vector C i as follows:
p i H t + 1 = p i H t p 1 H t p i H t p H i H t   p i H t p 1 P t   p i H t p V i P t   g i H t   p i H t   1 C 1 i p H H C H i i p H H C 1 i p P H C V i i p P H α H i 1 γ H i   β H i + n H i t = ω H i t C H i + n H i t ,   for   i = 1 ,   2 ,   ,   I
p k P t + 1 = p k P t p 1 H t p k P t p H k H t   p k P t p 1 P t p k P t p V k P t   g k P t   p k P t   1 C 1 k p H P C H k k p H P C 1 k p P P C V k k p P P α P k 1 γ P k β P k + n P k t = ω P k t   C P k + n P k t ,   for   k = 1 ,   2 ,   ,   K
g o H t + 1 =   p 1 H t p H o H t   g o H t m 1 t g o H t m U o t   l 1 t l L o t   g o H t   1 C 1 o T G C H o o T G C 1 o M G C U o o M G C 1 o L G C L o o L G 1 γ G o β G o + n G o t = ω G o t   C G o + n G o t ,   for   o = 1 ,   2 ,   ,   O
m q t + 1 =   p 1 H   p H q H t   m q t m 1 t   m q t m U q t   l 1 t l L q t   m q t   1 C 1 q T M C H q q T M C 1 q M M C U q q M M C 1 q L M C L q q L M 1 γ M q β M q + n M q t = ω M q t   C M q + n M q t ,   for   q = 1 ,   2 ,   ,   Q
l s t + 1 =   p 1 H   p H s H t   l s t m 1 t   l s t m U s t   l 1 t l L s t   l s t   1 C 1 s T L C H s s T L C 1 s M L C U s s M L C 1 s L L C L s s L L 1 γ L s β L s + n L s t = ω L s t   C L s + n L s t ,   for   s = 1 ,   2 ,   ,   S
g w P t + 1 =   p 1 H   p H w H t   g w P m 1 t   g w P m U w t   l 1 t l L w t   p 1 P t   p Y w P t   g w P t   1 C 1 w T V C H w w T V C 1 w M V C U w w M V C 1 w L V C L w w L V C 1 w P V C Y w w P V 1 γ V w β V w + n V w t = ω V w t   C V w + n V w t ,   for   w = 1 ,   2 ,   ,   W
Then, we used the time points from t 2 to t T (T represents the number of time points of each infectious stage after interpolation) as the vector of observations. We could form the regressor matrices π i and the vectors of observations Π i with Equations (7)–(12) as the following augmented regression equations, respectively:
p i H t 2 p i H t 3 p i H t T = ω H i t 1 ω H i t 2 ω H i t T 1 C H i + n H i t 1 n H i t 2 n H i t T 1   Π H i = π H i   C H i + N H i ,   for   i = 1 ,   2 ,   ,   I
p k P t 2 p k P t 3 p k P t T = ω P k t 1 ω P k t 2 ω P k t T 1 C P k + n P k t 1 n P k t 2 n P k t T 1   Π P k = π P k   C P k + N P k ,   for   k = 1 ,   2 ,   ,   K
g o H t 2 g o H t 3 g o H t T = ω G o t 1 ω G o t 2 ω G o t T 1 C G o + n G o t 1 n G o t 2 n G o t T 1   Π G o = π G o   C G o + N G o ,   for   o = 1 ,   2 ,   ,   O
m q t 2 m q t 3 m q t T = ω M q t 1 ω M q t 2 ω M q t T 1 C M q + n M q t 1 n M q t 2 n M q t T 1   Π M q = π M q   C M q + N M q ,   for   q = 1 ,   2 ,   ,   Q
l s t 2 l s t 3 l s t T = ω L s t 1 ω L s t 2 ω L s t T 1 C L s + n L s t 1 n L s t 2 n L s t T 1   Π L s = π L s   C L s + N L s ,   for   s = 1 ,   2 ,   ,   S
g w P t 2 g w P t 3 g w P t T = ω V w t 1 ω V w t 2 ω V w t T 1 C V w + n V w t 1 n V w t 2 n V w t T 1   Π V w = π V w   C V w + N V w ,   for   w = 1 ,   2 ,   ,   W
With regressor matrices π i and the regression vectors of observations Π i , we could obtain the estimated parameter vectors C ^ i by solving the following constrained optimization problems with some biological upper and lower bounds (i.e., the translation rate α i   0 , the degradation rate γ i   0 , and the regulation ability of miRNAs 0 ) on Equations (13)–(18) [103]:
C ^ H i = a r g m i n C H i π H i   C H i Π H i 2 2   ,   subject   to   0 0 0 0 H i | 0 0 0 0 V i | 1 0 0 0 1 0 C ^ H i 0 1
C ^ P k = a r g m i n C P k π P k   C P k Π P k 2 2   ,   subject   to   0 0 0 0 H k | 0 0 0 0 V k | 1 0 0 0 1 0 C ^ P k 0 1
C ^ G o = a r g m i n C G o π G o   C G o Π G o 2 2   , subject   to   0 0 0 0 0 0 0 0 0 0 0 0 H o | 1 0 0 0 1 0 0 0 1 0 0 0 U o | 0 0 0 0 0 0 0 0 0 0 0 0 L o | 0 0 0 0 0 0 1 0 C ^ G o 0 0 0 1
C ^ M q = a r g m i n C M q π M q   C M q Π M q 2 2   ,   subject   to   0 0 0 0 0 0 0 0 0 0 0 0 H q | 1 0 0 0 1 0 0 0 1 0 0 0 U q | 0 0 0 0 0 0 0 0 0 0 0 0 L q | 0 0 0 0 0 0 1 0 C ^ M q 0 0 0 1
C ^ L s = a r g m i n C L s π L s   C L s Π L s 2 2   , subject   to   0 0 0 0 0 0 0 0 0 0 0 0 H s | 1 0 0 0 1 0 0 0 1 0 0 0 U s | 0 0 0 0 0 0 0 0 0 0 0 0 L s | 0 0 0 0 0 0 1 0 C ^ L s 0 0 0 1
C ^ V w = a r g m i n C V w π V w C V w Π V w 2 2   ,   subject   to   0 0 0 0 0 0 0 0 0 0 0 0 H w | 1 0 0 0 1 0 0 0 1 0 0 0 U w | 0 0 0 0 0 0 0 0 0 0 0 0 L w | 0 0 0 0 0 0 0 0 0 0 0 0 Y w | 0 0 0 0 0 0 1 0 C ^ V w 0 0 0 1
We wanted to prune the false positives in the candidate HPI-GWGEN by detecting the edges out of the system order (i.e., the number of interactions or regulations for each node). The AIC considers both the estimated variance and model complexity to obtain the fittest number of edges (i.e., the system order). The AIC value for each model of a node with estimated parameters is given as follows (the dim () in equations represents the dimension of vector) [103]:
A I C H i H i , V i = log   π H i   C ^ H i Π H i 2 2 T 1   + 2   dim C ^ H i T 1
A I C P k H k ,   V k = log   π P k   C ^ P k Π P k 2 2   T 1 + 2   dim C ^ P k T 1
A I C G o H o , U o , L o = log   π G o   C ^ G o Π G o 2 2 T 1 + 2   dim C ^ G o T 1
A I C M q H q , U q , L q = log   π M q   C ^ M q Π M q 2 2 T 1 + 2   dim C ^ M q T 1
A I C L s H s , U s , L s = log   π L s   C ^ L s Π L s 2 2 T 1 + 2   dim C ^ L s T 1
A I C V w   H o , U o , L o ,   Y w = log   π V w C ^ V w Π V w 2 2 T 1 + 2   dim C ^ V w T 1
In the AICs in Equations (25)–(30), increasing the number of interactions or regulations would decrease the system identification error in the first term but increase the second term in the right-hand-side of Equations (25)–(30), and vice versa. The right number (system order of each node) of regulations and interactions would lead to the minimum value of AIC. In other words, when the false positives are considered in AIC with a larger model complexity, a larger AIC value is obtained because the false positives cannot reduce the estimated error variance in the first term and increase the model complexity in the second term. Hence, we can delete some false-positive interactions or regulations in each node of the candidate HPI-GWGEN to achieve the correct (real) HPI-GWGEN via the AIC method. After solving optimization problems in Equations (19)–(24) with the aid of the MATLAB function lsqlin and considering the system order, we could obtain the real HPI-GWGEN. To represent the real HPI-GWGEN as a network matrix, we needed to integrate the PPIN and GRN. When we described the dynamic models in Equations (1)–(6), we did not consider the zero term. To represent different models (especially, different dimension of network) with a network matrix, we had to fill the terms which lack interaction or regulation (i.e., without interaction or regulation in candidate HPI-GWGENs or the false positives pruned off after system order detection) with zeros. For convenience, we still used the same superscript for estimated coefficients of interaction or regulation to denote the relation between two nodes, i.e., C 12 p H H ^ still represents the estimated interactive ability between the 1st host protein and the 2nd host protein; it will be zero if these proteins do not interact in the candidate HPI-GWGEN, or it will be a false positive pruned off after system order selection. Then, the network matrix M R ( I + K + O + Q + S + W ) × ( I + K + M + L ) of the real HPI-GWGEN was integrated as the following network matrix:
M = P H P H P P P P H P 0 I × Q 0 I × S   P H P P P P P P P P 0 K × Q 0 K × S G H P H G 0 O × K G H M H G G H L H G G H P H M 0 Q × K G H M H M G H L H M G H P H L 0 S × K G H M H L G H L H L G H P P G G P P P G G H M P G G H L P G = C 11 p H H ^ C 21 p H H ^ C I 1 p H H ^ C 11 p P H ^ C K 1 p P H ^ C 12 p H H ^ C 22 p H H ^ C I 2 p H H ^ C 12 p P H ^ C K 2 p P H ^ 0 I × Q 0 I × S C 1 I p H H ^ C 2 I p H H ^ C I I p H H ^ C 1 I p P H ^ C K I p P H ^ C 11 p H P ^ C 21 p H P ^ C I 1 p H P ^ C 11 p P P ^ C K 1 p P P ^ C 12 p H P ^ C 22 p H P ^ C I 2 p H P ^ C 12 p P P ^ C K 2 p P P ^ 0 K × Q 0 K × Q C 1 K p H P ^ C 2 K p H P ^ C I K p H P ^ C 1 K p P P ^ C K K p P P ^ C 11 T G ^ C 21 T G ^ C I 1 T G ^ C 11 M G ^ C Q 1 M G ^ C 11 L G ^ C S 1 L G ^ 0 O × K C 1 O T G ^ C 2 O T G ^ C I O T G ^ C 1 O M G ^ C Q O M G ^ C 1 O L G ^ C S O L G ^ C 11 T M ^ C 21 T M ^ C I 1 T M ^ C 11 M M ^ C Q 1 M M ^ C 11 L M ^ C S 1 L M ^ 0 Q × K C 1 Q T M ^ C 2 Q T M ^ C I Q T M ^ C 1 Q M M ^ C Q Q M M ^ C 1 Q L M ^ C S Q L M ^ C 11 T L ^ C 21 T L ^ C I 1 T L ^ C 11 M L ^ C Q 1 M L ^ C 11 L L ^ C S 1 L L ^ 0 S × K C 1 S T L ^ C 2 S T L ^ C I S T L ^ C 1 S M L ^ C Q S M L ^ C 1 S L L ^ C S S L L ^ C 11 T V ^ C 21 L L ^ C I 1 T V ^ C 11 P V ^ C K 1 P V ^ C 11 M V ^ C Q 1 M V ^ C 11 L V ^ C S 1 L V ^ C 1 W T V ^ C 2 W L V ^ C I W T V ^ C 1 W P V ^ C K W P V ^ C 1 W M V ^ C Q W M V ^ C 1 W L V ^ C S W L V ^
where P and G represent the PPIN and GRN, respectively; HP, PP, HG, HM, HL, and PG specify the host protein, the pathogen protein, the host gene, the host miRNA, the host lncRNA, and the pathogen gene, respectively.
We wanted to investigate the significant pathogenesis for the amplification and saturation stages based on their real HPI-GWGEN. However, the real HPI-GWGEN was too large to be analyzed by the annotation of KEGG pathways. Thus, we applied the PNP method to extract the core HPI-GWGEN from the real HPI-GWGEN, which is more easily annotated by KEGG pathways [47,48].

4.3. PNP Method to Extract the Core HPI-GWGEN from Network Matrix of Real HPI-GWGEN

The is a method that projects each row (node) of network matrix M in Equation (31) (real HPI-GWGEN) onto the significant 85% structure of the overall network so that we can know the importance of each node to the overall network according to the projection value. We first performed the singular value decomposition (SVD) for the network matrix using the following equation:
M = L E R T ,   L R R o w × R o w ,   R T R C o l × C o l   and   E R R o w × C o l
where the columns of L and R denote the left singular vectors and right singular vectors of M, respectively; E only contains the singular values of M on the entries of e i i and e 11 e 22 e 33 0 ; R o w = I + K + O + Q + S + W and C o l = I + K + M + L are the row and column dimensions of network matrix M, respectively.
Here, we adopted the truncated SVD. That is, we chose the top t singular values that consisted of more than 85% of the energy of network. In other words, the minimum t is satisfied with the following equation:
k = 1 t e k k 2 i = 1 C o l e i i 2 85 %  
Then, we define the projection value for the a th row of the network matrix on the top t singular vectors of the network matrix M using the following equation:
P r o j a = k = 1 t M a R k T 2 ,   f o r   a = 1 ,   ,   R o w  
where M a and R k T represent the a th row of M in Equation (31) and the k th column of R (the columns of R are the right singular vectors of M), respectively.
Subsequently, the projection values of each node were ranked from large to small values (a larger value implies more significance to the network). We used the top-6000-significance nodes to construct the core HPI-GWGEN, which is acceptable for the annotation of KEGG pathways in DAVID [47,48]. Thus, we could extract the core HPI-GWGEN of the amplification and saturation stages from the real HPI-GWGEN of the amplification and saturation stages, correspondingly. With the aid of the annotation of KEGG pathways, we investigated the pathogenic mechanism. Finally, considering the core HPI signaling pathways and their downstream abnormal cellular functions, we selected the significant biomarkers as drug targets against the amplification and saturation stages of SARS-CoV-2 infection.

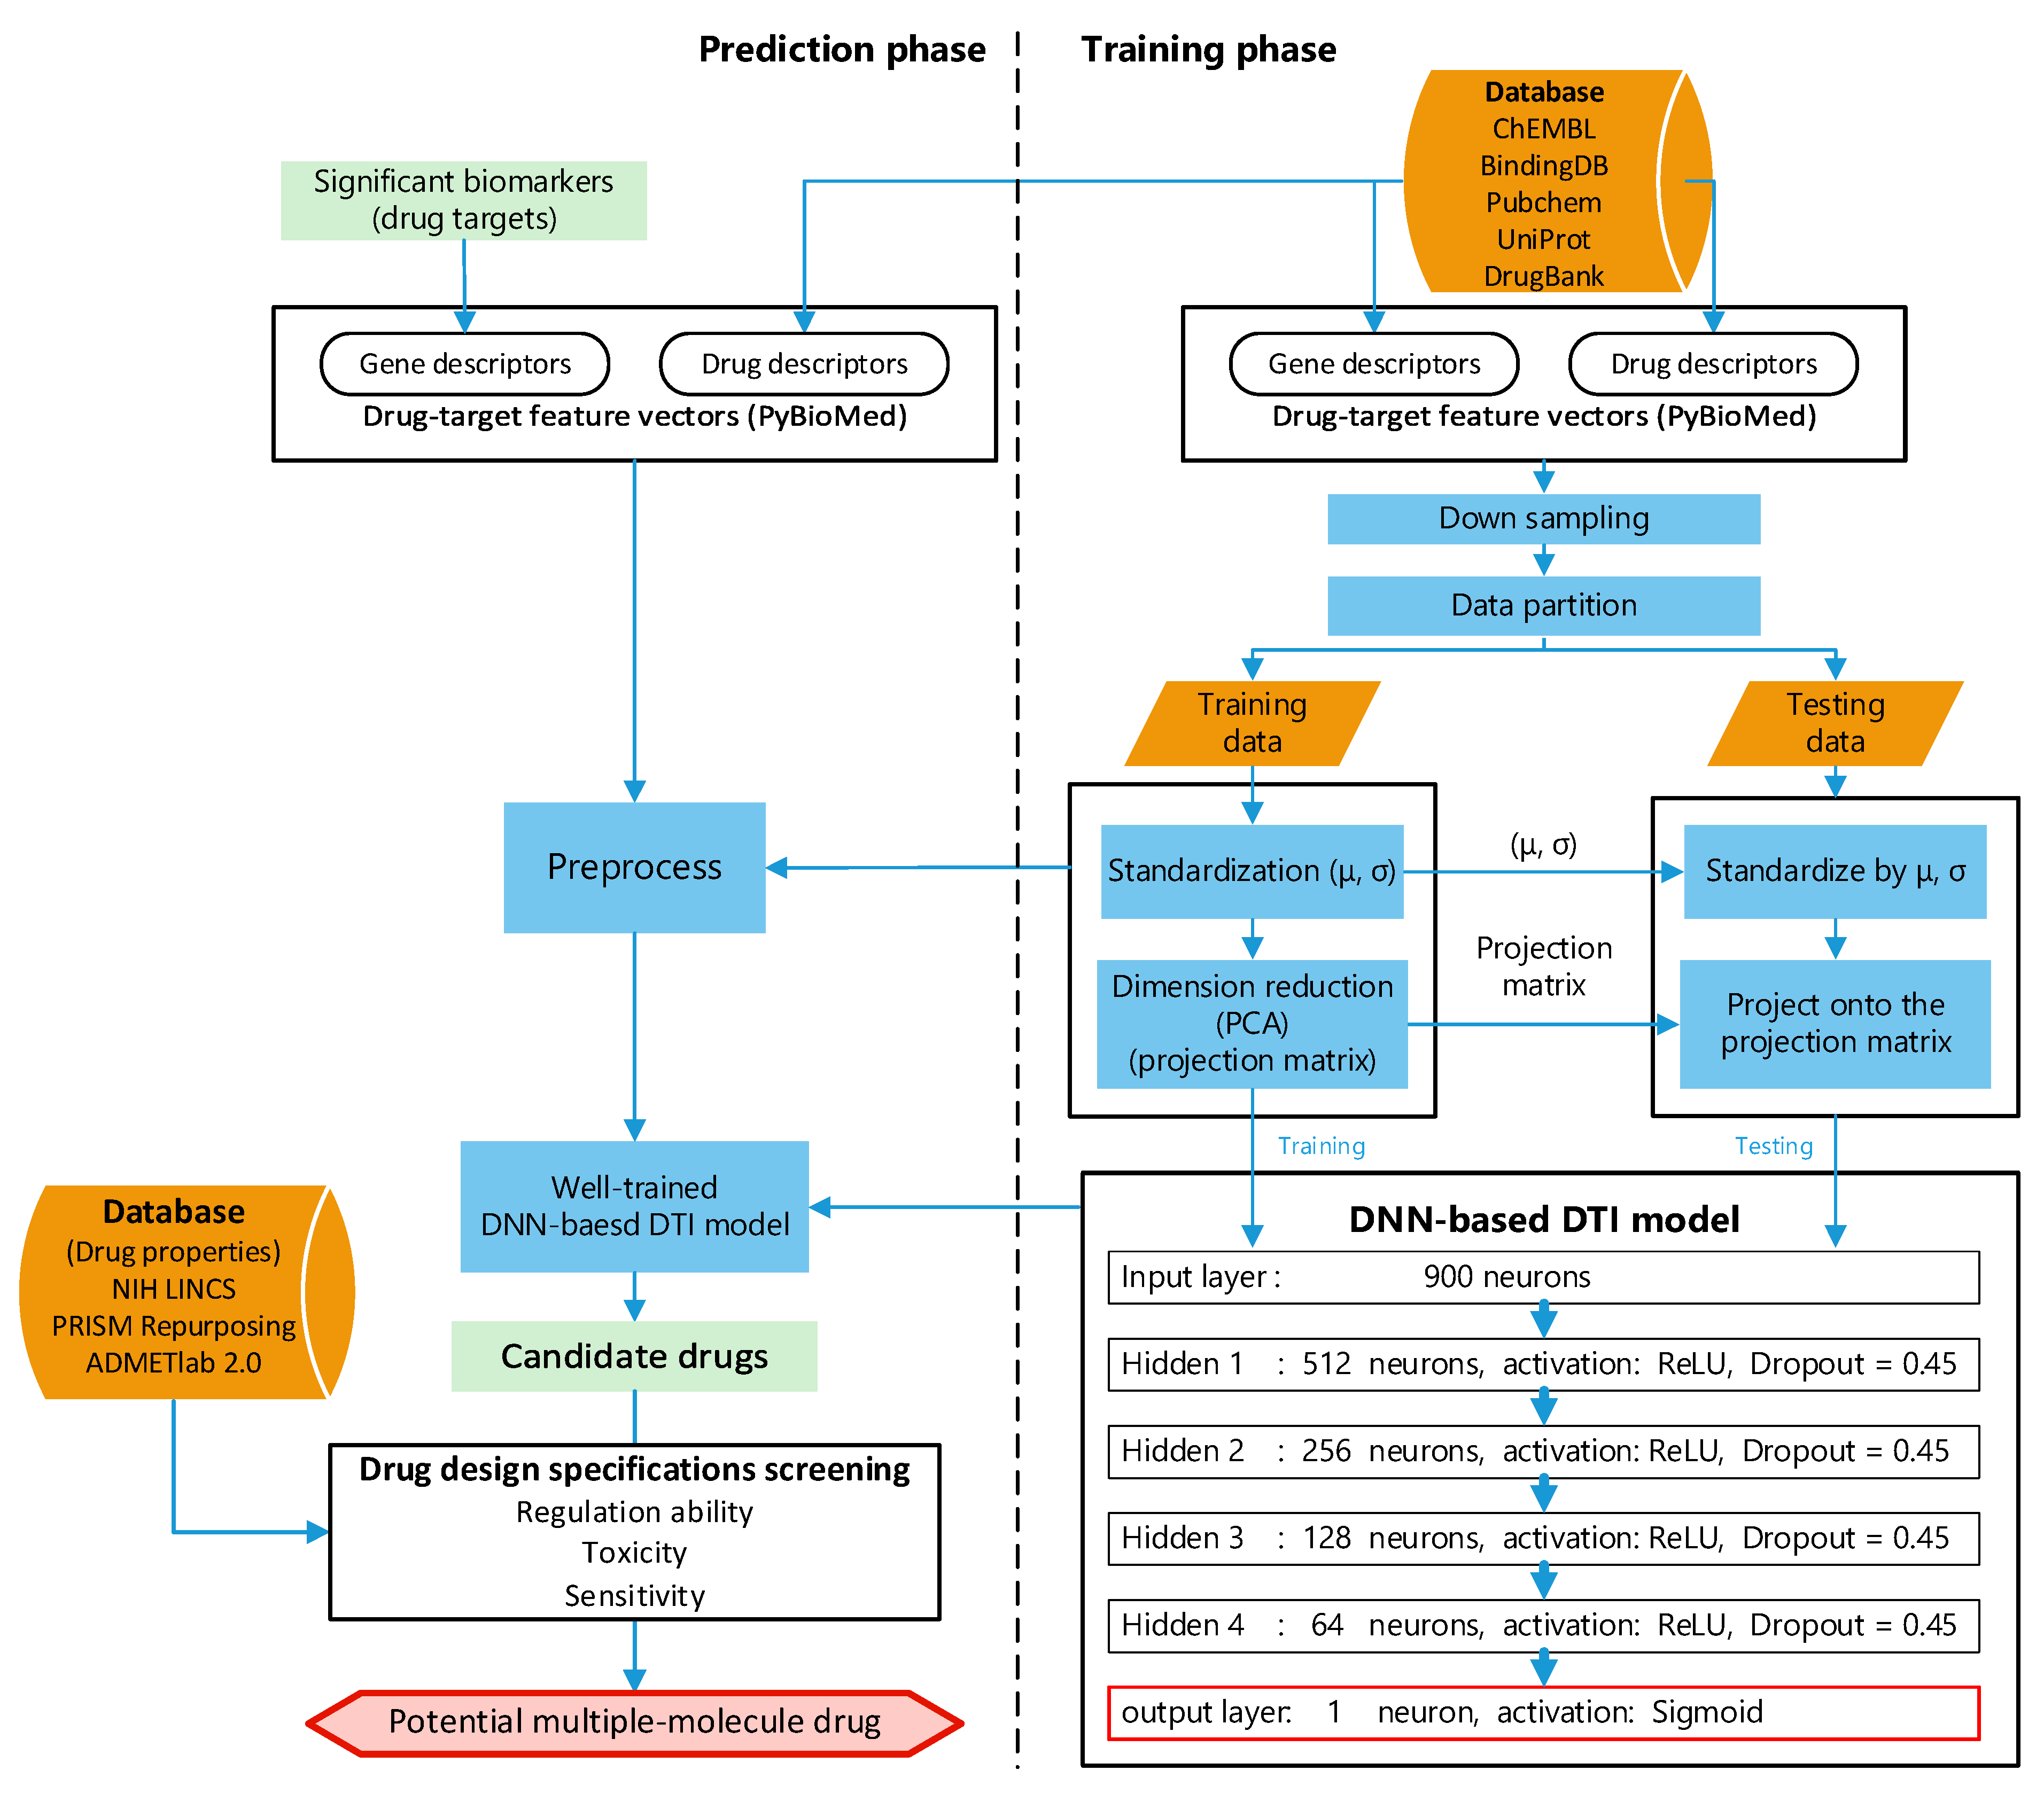
4.4. Systematic Discovery and Design of Multiple-Molecule Drug by UtilizingDNN-Based DTI Model with Drug Design Specifications

4.4.1. Preprocess of Targets and Drugs Data

To train the DNN-based DTI model in Figure 4, we first collected the DTI data from databases, including ChEMBL [30], BindingDB [31], Pubchem [32], UniProt [33], and DrugBank [34]. To calculate chemical descriptors for drugs and properties of proteins, we used PyBioMed [105], a python package, to transform the drugs and targets into features. Subsequently, the drug and target features were merged into a feature vector F D T as in the following equation:
F D T = F D ,   F T = f d 1 ,   f d 2 , ,   f d a ,   ,   f d A ,   f t 1 ,   f t 2 ,   ,   f d b , ,   f t B
where F D and F T are the features of the drug and target (protein), respectively; f d a and f t b are the a th drug feature and the b th target feature, respectively; A and B are the total number of features of the drug and the total number of features of the target, respectively. The input of the DNN-based DTI model should be in the feature vector form.
The collected drug–target interaction data contain 80,291 proven (positive) interactions and 100,024 unproven (negative) interactions, which implies that the collected data suffer from data imbalance. Data imbalance can cause the model to predict the majority, leading to prediction bias. Hence, the negative interactions were randomly deleted to match the number of positive interactions. Then, we divided all the data into training data (four-fifths) and testing data (one-fifth). To improve the convergence of gradient descent, we first performed feature scaling for the training dataset. Because there were some outliers for some features, we used standardization for each feature of training data. Then, PCA was applied to reduce the dimensions of the feature vector to 900 for the convenience of computing the DNN-based DTI model with 900 neurons in the input layer, as shown in Figure 4.

4.4.2. Architecture of DNN-Based DTI Model

Recent studies [28,29] have shown that the DNN-based DTI model can improve the prediction of interaction probability. We employed the DNN to predict the DTI for the pre-candidate molecular drugs with the significant biomarkers (drug targets). The architecture of neural network is shown in Figure 4. The neural network contains four hidden layers. Each hidden layer contains 512, 256, 128, and 64 neurons, respectively. Each neuron in the hidden layer has a bias, ReLU as the activation function to learn the nonlinearity, and a dropout ( = 0.45) to avoid overfitting [106]. The output layer contains a neuron, a bias, and sigmoid as the activation function to represent the output between 0 and 1 as the drug–target interaction probability.
Since the DTI prediction was the binary classification, we used the binary cross-entropy as the loss function. The adaptive moment estimation (Adam) [107] was adopted as the optimization algorithm to update the parameters of the DNN-based DTI model. The DNN-based DTI model was trained by Keras with batch size = 64, epoch = 200 (with Early Stopping), and Adam optimizer (default arguments). The 10-fold cross-validation was first applied to examine the prediction performance of the DNN-based DTI model. Finally, the AUC was used to judge the ability of DNN-based DTI model to distinguish positive and negative interaction.

4.4.3. Drug Design Specifications

In addition to the drug–target interaction, the regulation ability, toxicity, and sensitivity of the drug are considered when we chose the drugs to make sure the quality of drugs. The Library of Integrated Network-Based Cellular Signatures (LINCS) L1000 dataset [108,109] is used for drug regulation ability, i.e., the indicates the upregulation (>0) or downregulation (<0) of the drug target interaction. The drug sensitivity is also considered. The PRISM Repurposing dataset [110] contains chemical perturbations of compounds for homo sapiens cells. The closer zero value of sensitivity indicates the less sensitivity chemical perturbation for the cell. The other drug design specification is the toxicity (LC50), which is obtained by the tool ADMETlab 2.0 [111]. The higher value of LC50 implies the lower toxicity for the body.

Author Contributions

Conceptualization, C.-G.W. and B.-S.C.; methodology, C.-G.W. and B.-S.C.; software, C.-G.W., and B.-S.C.; validation, C.-G.W. and B.-S.C.; formal analysis, C.-G.W. and B.-S.C.; investigation, C.-G.W. and B.-S.C.; data curation, C.-G.W.; writing—original draft preparation, C.-G.W.; writing—review and editing, C.-G.W. and B.-S.C.; visualization, C.-G.W.; supervision, B.-S.C.; funding acquisition, B.-S.C. All authors have read and agreed to the published version of the manuscript.

Funding

This research was funded by the Ministry of Science and Technology, grant number MOST 111-2221-E-007-130-MY2.

Data Availability Statement

The RNA-seq data were downloaded from NCBI (accession number: GSE163547) (https://www.ncbi.nlm.nih.gov/geo/query/acc.cgi?acc=GSE163547) on 1 September 2021.

Conflicts of Interest

The authors declare no conflict of interest.

Appendix A

Figure A1. Visualization of real HPI-GWGEN of amplification and saturation infectious stages. The blue and green edges (lines) represent the protein–protein interactions and gene regulations, respectively. The numbers of each type of node (protein, receptor, transcription factor, miRNA, lncRNA, and virus) are shown in the figure. (A,B) are the real HPI-GWGENs at the amplification and saturation infectious stages, respectively.
Stresses 02 00029 g0a1

References

  1. WHO. Available online: https://covid19.who.int/ (accessed on 22 June 2022).
  2. Lechien, J.R.; Chiesa-Estomba, C.M.; Place, S.; Van Laethem, Y.; Cabaraux, P.; Mat, Q.; Huet, K.; Plzak, J.; Horoi, M.; Hans, S.; et al. Clinical and epidemiological characteristics of 1420 European patients with mild-to-moderate coronavirus disease 2019. J. Intern. Med. 2020, 288, 335–344. [Google Scholar] [CrossRef] [PubMed]
  3. Stokes, E.K.; Zambrano, L.D.; Anderson, K.N.; Marder, E.P.; Raz, K.M.; El Burai Felix, S.; Tie, Y.; Fullerton, K.E. Coronavirus Disease 2019 Case Surveillance—United States, 22 January–30 May 2020. MMWR Morb. Mortal. Wkly. Rep. 2020, 69, 759–765. [Google Scholar] [CrossRef] [PubMed]
  4. Gordon, D.E.; Jang, G.M.; Bouhaddou, M.; Xu, J.; Obernier, K.; White, K.M.; O’Meara, M.J.; Rezelj, V.V.; Guo, J.Z.; Swaney, D.L.; et al. A SARS-CoV-2 protein interaction map reveals targets for drug repurposing. Nature 2020, 583, 459–468. [Google Scholar] [CrossRef]
  5. Kim, D.; Lee, J.Y.; Yang, J.S.; Kim, J.W.; Kim, V.N.; Chang, H. The Architecture of SARS-CoV-2 Transcriptome. Cell 2020, 181, 914–921.e10. [Google Scholar] [CrossRef] [PubMed]
  6. Wu, F.; Zhao, S.; Yu, B.; Chen, Y.M.; Wang, W.; Song, Z.G.; Hu, Y.; Tao, Z.W.; Tian, J.H.; Pei, Y.Y.; et al. A new coronavirus associated with human respiratory disease in China. Nature 2020, 579, 265–269. [Google Scholar] [CrossRef] [PubMed] [Green Version]
  7. Flynn, R.A.; Belk, J.A.; Qi, Y.; Yasumoto, Y.; Wei, J.; Alfajaro, M.M.; Shi, Q.; Mumbach, M.R.; Limaye, A.; DeWeirdt, P.C.; et al. Discovery and functional interrogation of SARS-CoV-2 RNA-host protein interactions. Cell 2021, 184, 2394–2411.e16. [Google Scholar] [CrossRef] [PubMed]
  8. Stukalov, A.; Girault, V.; Grass, V.; Karayel, O.; Bergant, V.; Urban, C.; Haas, D.A.; Huang, Y.; Oubraham, L.; Wang, A.; et al. Multilevel proteomics reveals host perturbations by SARS-CoV-2 and SARS-CoV. Nature 2021, 594, 246–252. [Google Scholar] [CrossRef] [PubMed]
  9. Balakrishnan, L.; Milavetz, B. Epigenetic Regulation of Viral Biological Processes. Viruses 2017, 9, 346. [Google Scholar] [CrossRef] [Green Version]
  10. Zhang, Q.; Cao, X. Epigenetic regulation of the innate immune response to infection. Nat. Rev. Immunol. 2019, 19, 417–432. [Google Scholar] [CrossRef]
  11. Leong, M.M.L.; Lung, M.L. The Impact of Epstein-Barr Virus Infection on Epigenetic Regulation of Host Cell Gene Expression in Epithelial and Lymphocytic Malignancies. Front. Oncol. 2021, 11, 629780. [Google Scholar] [CrossRef]
  12. Bartel, D.P. Metazoan MicroRNAs. Cell 2018, 173, 20–51. [Google Scholar] [CrossRef] [PubMed] [Green Version]
  13. Qureshi, A.; Thakur, N.; Monga, I.; Thakur, A.; Kumar, M. VIRmiRNA: A comprehensive resource for experimentally validated viral miRNAs and their targets. Database 2014, 2014, bau103. [Google Scholar] [CrossRef] [PubMed]
  14. Saliminejad, K.; Khorram Khorshid, H.R.; Soleymani Fard, S.; Ghaffari, S.H. An overview of microRNAs: Biology, functions, therapeutics, and analysis methods. J. Cell. Physiol. 2019, 234, 5451–5465. [Google Scholar] [CrossRef] [PubMed]
  15. Dykes, I.M.; Emanueli, C. Transcriptional and Post-transcriptional Gene Regulation by Long Non-coding RNA. Genom. Proteom. Bioinform. 2017, 15, 177–186. [Google Scholar] [CrossRef]
  16. Ma, L.; Cao, J.; Liu, L.; Du, Q.; Li, Z.; Zou, D.; Bajic, V.B.; Zhang, Z. LncBook: A curated knowledgebase of human long non-coding RNAs. Nucleic Acids Res. 2019, 47, D128–D134. [Google Scholar] [CrossRef] [Green Version]
  17. Chen, L.; Zhou, Y.; Li, H. LncRNA, miRNA and lncRNA-miRNA interaction in viral infection. Virus Res. 2018, 257, 25–32. [Google Scholar] [CrossRef]
  18. Waring, M.J.; Arrowsmith, J.; Leach, A.R.; Leeson, P.D.; Mandrell, S.; Owen, R.M.; Pairaudeau, G.; Pennie, W.D.; Pickett, S.D.; Wang, J.; et al. An analysis of the attrition of drug candidates from four major pharmaceutical companies. Nat. Rev. Drug Discov. 2015, 14, 475–486. [Google Scholar] [CrossRef]
  19. Ashburn, T.T.; Thor, K.B. Drug repositioning: Identifying and developing new uses for existing drugs. Nat. Rev. Drug Discov. 2004, 3, 673–683. [Google Scholar] [CrossRef]
  20. Pushpakom, S.; Iorio, F.; Eyers, P.A.; Escott, K.J.; Hopper, S.; Wells, A.; Doig, A.; Guilliams, T.; Latimer, J.; McNamee, C.; et al. Drug repurposing: Progress, challenges and recommendations. Nat. Rev. Drug Discov. 2019, 18, 41–58. [Google Scholar] [CrossRef]
  21. Bayat Mokhtari, R.; Homayouni, T.S.; Baluch, N.; Morgatskaya, E.; Kumar, S.; Das, B.; Yeger, H. Combination therapy in combating cancer. Oncotarget 2017, 8, 38022–38043. [Google Scholar] [CrossRef]
  22. Maenza, J.; Flexner, C. Combination antiretroviral therapy for HIV infection. Am. Fam. Physician 1998, 57, 2789–2798. [Google Scholar] [PubMed]
  23. Fang, J.; Li, H.; Du, W.; Yu, P.; Guan, Y.-Y.; Ma, S.-Y.; Liu, D.; Chen, W.; Shi, G.-C.; Bian, X.-L. Efficacy of Early Combination Therapy With Lianhuaqingwen and Arbidol in Moderate and Severe COVID-19 Patients: A Retrospective Cohort Study. Front. Pharmacol. 2020, 11, 560209. [Google Scholar] [CrossRef] [PubMed]
  24. Deng, J.; Zhou, F.; Hou, W.; Heybati, K.; Ali, S.; Chang, O.; Silver, Z.; Dhivagaran, T.; Ramaraju, H.B.; Wong, C.Y.; et al. Efficacy of lopinavir–ritonavir combination therapy for the treatment of hospitalized COVID-19 patients: A meta-analysis. Future Virol. 2022, 17, 169–189. [Google Scholar] [CrossRef]
  25. Roshanshad, A.; Kamalipour, A.; Ashraf, M.A.; Roshanshad, R.; Jafari, S.; Nazemi, P.; Akbari, M. The efficacy of remdesivir in coronavirus disease 2019 (COVID-19): A systematic review. Iran. J. Microbiol. 2020, 12, 376–387. [Google Scholar] [CrossRef] [PubMed]
  26. Ansems, K.; Grundeis, F.; Dahms, K.; Mikolajewska, A.; Thieme, V.; Piechotta, V.; Metzendorf, M.I.; Stegemann, M.; Benstoem, C.; Fichtner, F. Remdesivir for the treatment of COVID-19. Cochrane Database Syst. Rev. 2021, 8, Cd014962. [Google Scholar]
  27. Gil-Sierra, M.D.; Briceño-Casado, M.P.; Alegre-Del Rey, E.J.; Sánchez-Hidalgo, M. Efficacy of early use of remdesivir: A systematic review of subgroup analysis. Rev. Esp. Quimioter. 2022, 35, 249–259. [Google Scholar] [CrossRef]
  28. Chang, S.; Wang, L.H.; Chen, B.-S. Investigating Core Signaling Pathways of Hepatitis B Virus Pathogenesis for Biomarkers Identification and Drug Discovery via Systems Biology and Deep Learning Method. Biomedicines 2020, 8, 320. [Google Scholar] [CrossRef]
  29. Chang, S.; Chen, J.-Y.; Chuang, Y.-J.; Chen, B.-S. Systems Approach to Pathogenic Mechanism of Type 2 Diabetes and Drug Discovery Design Based on Deep Learning and Drug Design Specifications. Int. J. Mol. Sci. 2021, 22, 166. [Google Scholar] [CrossRef]
  30. Gaulton, A.; Bellis, L.J.; Bento, A.P.; Chambers, J.; Davies, M.; Hersey, A.; Light, Y.; McGlinchey, S.; Michalovich, D.; Al-Lazikani, B.; et al. ChEMBL: A large-scale bioactivity database for drug discovery. Nucleic Acids Res. 2012, 40, D1100–D1107. [Google Scholar] [CrossRef] [Green Version]
  31. Liu, T.; Lin, Y.; Wen, X.; Jorissen, R.N.; Gilson, M.K. BindingDB: A web-accessible database of experimentally determined protein–ligand binding affinities. Nucleic Acids Res. 2007, 35, D198–D201. [Google Scholar] [CrossRef] [Green Version]
  32. Kim, S.; Thiessen, P.A.; Bolton, E.E.; Chen, J.; Fu, G.; Gindulyte, A.; Han, L.; He, J.; He, S.; Shoemaker, B.A.; et al. PubChem Substance and Compound databases. Nucleic Acids Res. 2016, 44, D1202–D1213. [Google Scholar] [CrossRef] [PubMed]
  33. UniProt Consortium. UniProt: A worldwide hub of protein knowledge. Nucleic Acids Res. 2019, 47, D506–D515. [Google Scholar] [CrossRef] [PubMed] [Green Version]
  34. Knox, C.; Law, V.; Jewison, T.; Liu, P.; Ly, S.; Frolkis, A.; Pon, A.; Banco, K.; Mak, C.; Neveu, V.; et al. DrugBank 3.0: A comprehensive resource for “omics” research on drugs. Nucleic Acids Res. 2011, 39, D1035–D1041. [Google Scholar] [CrossRef] [PubMed] [Green Version]
  35. Bovolenta, L.; Acencio, M.; Lemke, N. HTRIdb: An open-access database for experimentally verified human transcriptional regulation interactions. BMC Genom. 2012, 13, 405. [Google Scholar] [CrossRef] [PubMed] [Green Version]
  36. Zheng, G.; Tu, K.; Yang, Q.; Xiong, Y.; Wei, C.; Xie, L.; Zhu, Y.; Li, Y. ITFP: An integrated platform of mammalian transcription factors. Bioinformatics 2008, 24, 2416–2417. [Google Scholar] [CrossRef] [Green Version]
  37. Wingender, E.; Chen, X.; Hehl, R.; Karas, H.; Liebich, I.; Matys, V.; Meinhardt, T.; Prüss, M.; Reuter, I.; Schacherer, F. TRANSFAC: An integrated system for gene expression regulation. Nucleic Acids Res. 2000, 28, 316–319. [Google Scholar] [CrossRef] [Green Version]
  38. Li, J.-H.; Liu, S.; Zhou, H.; Qu, L.-H.; Yang, J.-H. starBase v2.0: Decoding miRNA-ceRNA, miRNA-ncRNA and protein-RNA interaction networks from large-scale CLIP-Seq data. Nucleic Acids Res. 2013, 42, D92–D97. [Google Scholar] [CrossRef] [Green Version]
  39. Friard, O.; Re, A.; Taverna, D.; De Bortoli, M.; Corá, D. CircuitsDB: A database of mixed microRNA/transcription factor feed-forward regulatory circuits in human and mouse. BMC Bioinform. 2010, 11, 435. [Google Scholar] [CrossRef] [Green Version]
  40. Agarwal, V.; Bell, G.W.; Nam, J.W.; Bartel, D.P. Predicting effective microRNA target sites in mammalian mRNAs. Elife 2015, 4, e05005. [Google Scholar] [CrossRef]
  41. Licata, L.; Briganti, L.; Peluso, D.; Perfetto, L.; Iannuccelli, M.; Galeota, E.; Sacco, F.; Palma, A.; Nardozza, A.P.; Santonico, E.; et al. MINT, the molecular interaction database: 2012 update. Nucleic Acids Res. 2012, 40, D857–D861. [Google Scholar] [CrossRef]
  42. UniProt Consortium. UniProt: The universal protein knowledgebase in 2021. Nucleic Acids Res. 2020, 49, D480–D489. [Google Scholar]
  43. Orchard, S.; Ammari, M.; Aranda, B.; Breuza, L.; Briganti, L.; Broackes-Carter, F.; Campbell, N.H.; Chavali, G.; Chen, C.; del-Toro, N.; et al. The MIntAct project—IntAct as a common curation platform for 11 molecular interaction databases. Nucleic Acids Res. 2013, 42, D358–D363. [Google Scholar] [CrossRef] [PubMed]
  44. Bader, G.D.; Betel, D.; Hogue, C.W. BIND: The Biomolecular Interaction Network Database. Nucleic Acids Res. 2003, 31, 248–250. [Google Scholar] [CrossRef] [PubMed] [Green Version]
  45. Stark, C.; Breitkreutz, B.J.; Reguly, T.; Boucher, L.; Breitkreutz, A.; Tyers, M. BioGRID: A general repository for interaction datasets. Nucleic Acids Res. 2006, 34, D535–D539. [Google Scholar] [CrossRef] [PubMed] [Green Version]
  46. Salwinski, L.; Miller, C.S.; Smith, A.J.; Pettit, F.K.; Bowie, J.U.; Eisenberg, D. The Database of Interacting Proteins: 2004 update. Nucleic Acids Res. 2004, 32, D449–D451. [Google Scholar] [CrossRef] [Green Version]
  47. Huang, D.W.; Sherman, B.T.; Lempicki, R.A. Systematic and integrative analysis of large gene lists using DAVID bioinformatics resources. Nat. Protoc. 2009, 4, 44–57. [Google Scholar] [CrossRef]
  48. Huang, D.W.; Sherman, B.T.; Lempicki, R.A. Bioinformatics enrichment tools: Paths toward the comprehensive functional analysis of large gene lists. Nucleic Acids Res. 2009, 37, 1–13. [Google Scholar] [CrossRef] [Green Version]
  49. Shannon, P.; Markiel, A.; Ozier, O.; Baliga, N.S.; Wang, J.T.; Ramage, D.; Amin, N.; Schwikowski, B.; Ideker, T. Cytoscape: A software environment for integrated models of biomolecular interaction networks. Genome Res. 2003, 13, 2498–2504. [Google Scholar] [CrossRef]
  50. Agajanian, M.J.; Walker, M.P.; Axtman, A.D.; Ruela-de-Sousa, R.R.; Serafin, D.S.; Rabinowitz, A.D.; Graham, D.M.; Ryan, M.B.; Tamir, T.; Nakamichi, Y.; et al. WNT Activates the AAK1 Kinase to Promote Clathrin-Mediated Endocytosis of LRP6 and Establish a Negative Feedback Loop. Cell Rep. 2019, 26, 79–93.e8. [Google Scholar] [CrossRef] [Green Version]
  51. Venkataraman, T.; Coleman, C.M.; Frieman, M.B. Overactive Epidermal Growth Factor Receptor Signaling Leads to Increased Fibrosis after Severe Acute Respiratory Syndrome Coronavirus Infection. J. Virol. 2017, 91, e00182-17. [Google Scholar] [CrossRef] [Green Version]
  52. Luo, S.; Rubinsztein, D.C. BCL2L11/BIM. Autophagy 2013, 9, 104–105. [Google Scholar] [CrossRef] [PubMed] [Green Version]
  53. Häcker, G. Apoptosis in infection. Microbes Infect. 2018, 20, 552–559. [Google Scholar] [CrossRef] [PubMed]
  54. Kumar, R.; Afsar, M.; Khandelwal, N.; Chander, Y.; Riyesh, T.; Dedar, R.K.; Gulati, B.R.; Pal, Y.; Barua, S.; Tripathi, B.N.; et al. Emetine suppresses SARS-CoV-2 replication by inhibiting interaction of viral mRNA with eIF4E. Antivir. Res. 2021, 189, 105056. [Google Scholar] [CrossRef] [PubMed]
  55. Campa, C.C.; Franco, I.; Hirsch, E. PI3K-C2α: One enzyme for two products coupling vesicle trafficking and signal transduction. FEBS Lett. 2015, 589, 1552–1558. [Google Scholar] [CrossRef] [Green Version]
  56. Arcaro, A.; Zvelebil Marketa, J.; Wallasch, C.; Ullrich, A.; Waterfield Michael, D.; Domin, J. Class II Phosphoinositide 3-Kinases Are Downstream Targets of Activated Polypeptide Growth Factor Receptors. Mol. Cell. Biol. 2000, 20, 3817–3830. [Google Scholar] [CrossRef] [Green Version]
  57. Abdi, K.; Neves, G.; Pyun, J.; Kiziltug, E.; Ahrens, A.; Kuo, C.T. EGFR Signaling Termination via Numb Trafficking in Ependymal Progenitors Controls Postnatal Neurogenic Niche Differentiation. Cell Rep. 2019, 28, 2012–2022.e4. [Google Scholar] [CrossRef] [Green Version]
  58. Ramaiah, M.J. mTOR inhibition and p53 activation, microRNAs: The possible therapy against pandemic COVID-19. Gene Rep. 2020, 20, 100765. [Google Scholar] [CrossRef]
  59. Huang, K.; Wang, C.; Vagts, C.; Raguveer, V.; Finn, P.W.; Perkins, D.L. Long non-coding RNAs (lncRNAs) NEAT1 and MALAT1 are differentially expressed in severe COVID-19 patients: An integrated single cell analysis. medRxiv 2021. [Google Scholar] [CrossRef]
  60. Yao, J.; Wang, X.Q.; Li, Y.J.; Shan, K.; Yang, H.; Wang, Y.N.; Yao, M.D.; Liu, C.; Li, X.M.; Shen, Y.; et al. Long non-coding RNA MALAT1 regulates retinal neurodegeneration through CREB signaling. EMBO Mol. Med. 2016, 8, 346–362. [Google Scholar] [CrossRef]
  61. Zhuang, M.; Zhao, S.; Jiang, Z.; Wang, S.; Sun, P.; Quan, J.; Yan, D.; Wang, X. MALAT1 sponges miR-106b-5p to promote the invasion and metastasis of colorectal cancer via SLAIN2 enhanced microtubules mobility. EBioMedicine 2019, 41, 286–298. [Google Scholar] [CrossRef] [Green Version]
  62. Ivanovska, I.; Ball, A.S.; Diaz, R.L.; Magnus, J.F.; Kibukawa, M.; Schelter, J.M.; Kobayashi, S.V.; Lim, L.; Burchard, J.; Jackson, A.L.; et al. MicroRNAs in the miR-106b family regulate p21/CDKN1A and promote cell cycle progression. Mol. Cell. Biol. 2008, 28, 2167–2174. [Google Scholar] [CrossRef] [PubMed] [Green Version]
  63. Su, M.; Chen, Y.; Qi, S.; Shi, D.; Feng, L.; Sun, D. A Mini-Review on Cell Cycle Regulation of Coronavirus Infection. Front. Vet. Sci. 2020, 7, 586826. [Google Scholar] [CrossRef] [PubMed]
  64. Iwamoto, M.; Saso, W.; Sugiyama, R.; Ishii, K.; Ohki, M.; Nagamori, S.; Suzuki, R.; Aizaki, H.; Ryo, A.; Yun, J.-H.; et al. Epidermal growth factor receptor is a host-entry cofactor triggering hepatitis B virus internalization. Proc. Natl. Acad. Sci. USA 2019, 116, 8487–8492. [Google Scholar] [CrossRef] [PubMed] [Green Version]
  65. Hu, W.; Zhang, S.; Shen, Y.; Yang, Q. Epidermal growth factor receptor is a co-factor for transmissible gastroenteritis virus entry. Virology 2018, 521, 33–43. [Google Scholar] [CrossRef]
  66. Zheng, M.; Karki, R.; Williams, E.P.; Yang, D.; Fitzpatrick, E.; Vogel, P.; Jonsson, C.B.; Kanneganti, T.-D. TLR2 senses the SARS-CoV-2 envelope protein to produce inflammatory cytokines. Nat. Immunol. 2021, 22, 829–838. [Google Scholar] [CrossRef]
  67. DePaolo, R.W.; Lathan, R.; Rollins, B.J.; Karpus, W.J. The Chemokine CCL2 Is Required for Control of Murine Gastric Salmonella enterica Infection. Infect. Immun. 2005, 73, 6514–6522. [Google Scholar] [CrossRef] [Green Version]
  68. Gschwandtner, M.; Derler, R.; Midwood, K.S. More Than Just Attractive: How CCL2 Influences Myeloid Cell Behavior Beyond Chemotaxis. Front. Immunol. 2019, 10, 2759. [Google Scholar] [CrossRef] [Green Version]
  69. Dinarello, C.A. Overview of the IL-1 family in innate inflammation and acquired immunity. Immunol. Rev. 2018, 281, 8–27. [Google Scholar] [CrossRef] [Green Version]
  70. Rath, P.C.; Aggarwal, B.B. TNF-induced signaling in apoptosis. J. Clin. Immunol. 1999, 19, 350–364. [Google Scholar] [CrossRef]
  71. Wu, B.; Peisley, A.; Richards, C.; Yao, H.; Zeng, X.; Lin, C.; Chu, F.; Walz, T.; Hur, S. Structural basis for dsRNA recognition, filament formation, and antiviral signal activation by MDA5. Cell 2013, 152, 276–289. [Google Scholar] [CrossRef] [Green Version]
  72. Alcami, A.; Koszinowski, U.H. Viral mechanisms of immune evasion. Trends Microbiol. 2000, 8, 410–418. [Google Scholar] [CrossRef]
  73. Sui, L.; Zhao, Y.; Wang, W.; Wu, P.; Wang, Z.; Yu, Y.; Hou, Z.; Tan, G.; Liu, Q. SARS-CoV-2 Membrane Protein Inhibits Type I Interferon Production Through Ubiquitin-Mediated Degradation of TBK1. Front. Immunol. 2021, 12, 662989. [Google Scholar] [CrossRef] [PubMed]
  74. Vaz de Paula, C.B.; Nagashima, S.; Liberalesso, V.; Collete, M.; da Silva, F.P.G.; Oricil, A.G.G.; Barbosa, G.S.; da Silva, G.V.C.; Wiedmer, D.B.; da Silva Dezidério, F.; et al. COVID-19: Immunohistochemical Analysis of TGF-β Signaling Pathways in Pulmonary Fibrosis. Int. J. Mol. Sci. 2021, 23, 168. [Google Scholar] [CrossRef]
  75. Ferner, R.E.; Aronson, J.K. Remdesivir in COVID-19. BMJ 2020, 369, m1610. [Google Scholar] [CrossRef] [PubMed] [Green Version]
  76. Wang, W.; Chen, J.; Hu, D.; Pan, P.; Liang, L.; Wu, W.; Tang, Y.; Huang, X.R.; Yu, X.; Wu, J.; et al. SARS-CoV-2 N Protein Induces Acute Kidney Injury via Smad3-Dependent G1 Cell Cycle Arrest Mechanism. Adv. Sci. 2022, 9, e2103248. [Google Scholar] [CrossRef]
  77. Kellici, T.F.; Pilka, E.S.; Bodkin, M.J. Therapeutic Potential of Targeting Plasminogen Activator Inhibitor-1 in COVID-19. Trends Pharmacol. Sci. 2021, 42, 431–433. [Google Scholar] [CrossRef]
  78. Angiolillo, A.L.; Sgadari, C.; Taub, D.D.; Liao, F.; Farber, J.M.; Maheshwari, S.; Kleinman, H.K.; Reaman, G.H.; Tosato, G. Human interferon-inducible protein 10 is a potent inhibitor of angiogenesis in vivo. J. Exp. Med. 1995, 182, 155–162. [Google Scholar] [CrossRef] [Green Version]
  79. Romagnani, P.; Annunziato, F.; Lazzeri, E.; Cosmi, L.; Beltrame, C.; Lasagni, L.; Galli, G.; Francalanci, M.; Manetti, R.; Marra, F.; et al. Interferon-inducible protein 10, monokine induced by interferon gamma, and interferon-inducible T-cell alpha chemoattractant are produced by thymic epithelial cells and attract T-cell receptor (TCR) alphabeta+ CD8+ single-positive T cells, TCRgammadelta+ T cells, and natural killer-type cells in human thymus. Blood 2001, 97, 601–607. [Google Scholar]
  80. Sidahmed, A.M.; León, A.J.; Bosinger, S.E.; Banner, D.; Danesh, A.; Cameron, M.J.; Kelvin, D.J. CXCL10 contributes to p38-mediated apoptosis in primary T lymphocytes in vitro. Cytokine 2012, 59, 433–441. [Google Scholar] [CrossRef] [Green Version]
  81. BAX BCL2 Associated X, Apoptosis Regulator [Homo sapiens (Human)]. Available online: https://www.ncbi.nlm.nih.gov/gene/581 (accessed on 18 July 2022).
  82. Milhas, D.; Cuvillier, O.; Therville, N.; Clavé, P.; Thomsen, M.; Levade, T.; Benoist, H.; Ségui, B. Caspase-10 Triggers Bid Cleavage and Caspase Cascade Activation in FasL-induced Apoptosis. J. Biol. Chem. 2005, 280, 19836–19842. [Google Scholar] [CrossRef] [Green Version]
  83. Dzimianski, J.V.; Scholte, F.E.M.; Bergeron, É.; Pegan, S.D. ISG15: It’s Complicated. J. Mol. Biol. 2019, 431, 4203–4216. [Google Scholar] [CrossRef] [PubMed]
  84. Bizzotto, J.; Sanchis, P.; Abbate, M.; Lage-Vickers, S.; Lavignolle, R.; Toro, A.; Olszevicki, S.; Sabater, A.; Cascardo, F.; Vazquez, E.; et al. SARS-CoV-2 Infection Boosts MX1 Antiviral Effector in COVID-19 Patients. iScience 2020, 23, 101585. [Google Scholar] [CrossRef] [PubMed]
  85. Kausar, S.; Said Khan, F.; Ishaq Mujeeb Ur Rehman, M.; Akram, M.; Riaz, M.; Rasool, G.; Hamid Khan, A.; Saleem, I.; Shamim, S.; Malik, A. A review: Mechanism of action of antiviral drugs. Int. J. Immunopathol. Pharmacol. 2021, 35, 20587384211002621. [Google Scholar] [CrossRef] [PubMed]
  86. Piacentini, S.; La Frazia, S.; Riccio, A.; Pedersen, J.Z.; Topai, A.; Nicolotti, O.; Rossignol, J.F.; Santoro, M.G. Nitazoxanide inhibits paramyxovirus replication by targeting the Fusion protein folding: Role of glycoprotein-specific thiol oxidoreductase ERp57. Sci. Rep. 2018, 8, 10425. [Google Scholar] [CrossRef] [PubMed] [Green Version]
  87. Segrelles, C.; Contreras, D.; Navarro, E.M.; Gutiérrez-Muñoz, C.; García-Escudero, R.; Paramio, J.M.; Lorz, C. Bosutinib Inhibits EGFR Activation in Head and Neck Cancer. Int. J. Mol. Sci. 2018, 19, 1824. [Google Scholar] [CrossRef] [PubMed] [Green Version]
  88. Wang, Y.; Schmid-Bindert, G.; Zhou, C. Erlotinib in the treatment of advanced non-small cell lung cancer: An update for clinicians. Ther. Adv. Med. Oncol. 2012, 4, 19–29. [Google Scholar] [CrossRef] [PubMed] [Green Version]
  89. Jeong, J.; Kim, J. Combination Effect of Cilengitide with Erlotinib on TGF-β1-Induced Epithelial-to-Mesenchymal Transition in Human Non-Small Cell Lung Cancer Cells. Int. J. Mol. Sci. 2022, 23, 3423. [Google Scholar] [CrossRef]
  90. Naik, R.R.; Shakya, A.K.; Aladwan, S.M.; El-Tanani, M. Kinase Inhibitors as Potential Therapeutic Agents in the Treatment of COVID-19. Front. Pharmacol. 2022, 13, 806568. [Google Scholar] [CrossRef]
  91. National Center for Biotechnology Information. PubChem Compound Summary for CID 5757, Estradiol. Available online: https://pubchem.ncbi.nlm.nih.gov/compound/5757 (accessed on 25 July 2022).
  92. Kröger, A.; Dallügge, A.; Kirchhoff, S.; Hauser, H. IRF-1 reverts the transformed phenotype of oncogenically transformed cells in vitro and in vivo. Oncogene 2003, 22, 1045–1056. [Google Scholar] [CrossRef] [Green Version]
  93. Malek, D.; Gust, R.; Kleuser, B. 17-Beta-estradiol inhibits transforming-growth-factor-beta-induced MCF-7 cell migration by Smad3-repression. Eur. J. Pharmacol. 2006, 534, 39–47. [Google Scholar] [CrossRef]
  94. Penna, C.; Mercurio, V.; Tocchetti, C.G.; Pagliaro, P. Sex-related differences in COVID-19 lethality. Br. J. Pharmacol. 2020, 177, 4375–4385. [Google Scholar] [CrossRef] [PubMed]
  95. Bhopal, S.S.; Bhopal, R. Sex differential in COVID-19 mortality varies markedly by age. Lancet 2020, 396, 532–533. [Google Scholar] [CrossRef]
  96. Doerre, A.; Doblhammer, G. The influence of gender on COVID-19 infections and mortality in Germany: Insights from age-and gender-specific modeling of contact rates, infections, and deaths in the early phase of the pandemic. PLoS ONE 2022, 17, e0268119. [Google Scholar] [CrossRef] [PubMed]
  97. Zafari Zangeneh, F.; Shoushtari, M.S. Estradiol and COVID-19: Does 17-Estradiol Have an Immune-Protective Function in Women Against Coronavirus? J. Fam. Reprod. Health 2021, 15, 150–159. [Google Scholar] [CrossRef] [PubMed]
  98. Suba, Z. Prevention and therapy of COVID-19 via exogenous estrogen treatment for both male and female patients: Prevention and therapy of COVID-19. J. Pharm. Pharm. Sci. 2020, 23, 75–85. [Google Scholar] [CrossRef] [Green Version]
  99. Gil-Ad, I.; Zolokov, A.; Lomnitski, L.; Taler, M.; Bar, M.; Luria, D.; Ram, E.; Weizman, A. Evaluation of the potential anti-cancer activity of the antidepressant sertraline in human colon cancer cell lines and in colorectal cancer-xenografted mice. Int. J. Oncol. 2008, 33, 277–286. [Google Scholar] [CrossRef] [Green Version]
  100. Chen, S.; Xuan, J.; Wan, L.; Lin, H.; Couch, L.; Mei, N.; Dobrovolsky, V.N.; Guo, L. Sertraline, an Antidepressant, Induces Apoptosis in Hepatic Cells Through the Mitogen-Activated Protein Kinase Pathway. Toxicol. Sci. 2014, 137, 404–415. [Google Scholar] [CrossRef]
  101. Xia, D.; Zhang, Y.T.; Xu, G.P.; Yan, W.W.; Pan, X.R.; Tong, J.H. Sertraline exerts its antitumor functions through both apoptosis and autophagy pathways in acute myeloid leukemia cells. Leuk. Lymphoma 2017, 58, 2208–2217. [Google Scholar] [CrossRef]
  102. Halperin, D.; Reber, G. Influence of antidepressants on hemostasis. Dialogues Clin. Neurosci. 2007, 9, 47–59. [Google Scholar] [CrossRef]
  103. Chen, B.S.; Wu, C.C. Systems Biology: An Integrated Platform for Bioinformatics, Systems Synthetic Biology and Systems Metabolic Engineering; Nova Publishers: Hauppauge, NY, USA, 2014. [Google Scholar]
  104. Puray-Chavez, M.; LaPak, K.M.; Schrank, T.P.; Elliott, J.L.; Bhatt, D.P.; Agajanian, M.J.; Jasuja, R.; Lawson, D.Q.; Davis, K.; Rothlauf, P.W.; et al. Systematic analysis of SARS-CoV-2 infection of an ACE2-negative human airway cell. Cell Rep. 2021, 36, 109364. [Google Scholar] [CrossRef]
  105. Dong, J.; Yao, Z.-J.; Zhang, L.; Luo, F.; Lin, Q.; Lu, A.-P.; Chen, A.F.; Cao, D.-S. PyBioMed: A python library for various molecular representations of chemicals, proteins and DNAs and their interactions. J. Cheminformatics 2018, 10, 16. [Google Scholar] [CrossRef] [PubMed] [Green Version]
  106. Srivastava, N.; Hinton, G.; Krizhevsky, A.; Sutskever, I.; Salakhutdinov, R. Dropout: A simple way to prevent neural networks from overfitting. J. Mach. Learn. Res. 2014, 15, 1929–1958. [Google Scholar]
  107. Kingma, D.P.; Ba, J. Adam: A method for stochastic optimization. arXiv 2014, arXiv:1412.6980. [Google Scholar]
  108. Subramanian, A.; Narayan, R.; Corsello, S.M.; Peck, D.D.; Natoli, T.E.; Lu, X.; Gould, J.; Davis, J.F.; Tubelli, A.A.; Asiedu, J.K. A next generation connectivity map: L1000 platform and the first 1,000,000 profiles. Cell 2017, 171, 1437–1452.e17. [Google Scholar] [CrossRef] [PubMed]
  109. Seçilmiş, D.; Hillerton, T.; Morgan, D.; Tjärnberg, A.; Nelander, S.; Nordling, T.E.M.; Sonnhammer, E.L.L. Uncovering cancer gene regulation by accurate regulatory network inference from uninformative data. NPJ Syst. Biol. Appl. 2020, 6, 37. [Google Scholar] [CrossRef]
  110. Corsello, S.M.; Nagari, R.T.; Spangler, R.D.; Rossen, J.; Kocak, M.; Bryan, J.G.; Humeidi, R.; Peck, D.; Wu, X.; Tang, A.A.; et al. Discovering the anticancer potential of non-oncology drugs by systematic viability profiling. Nat. Cancer 2020, 1, 235–248. [Google Scholar] [CrossRef] [Green Version]
  111. Xiong, G.; Wu, Z.; Yi, J.; Fu, L.; Yang, Z.; Hsieh, C.; Yin, M.; Zeng, X.; Wu, C.; Lu, A.; et al. ADMETlab 2.0: An integrated online platform for accurate and comprehensive predictions of ADMET properties. Nucleic Acids Res. 2021, 49, W5–W14. [Google Scholar] [CrossRef]
Figure 1. The flowchart of the systems biology method of investigating pathogenesis of SARS-CoV-2 infection to identify significant biomarkers as drug targets and systems drug discovery via a DNN-based DTI model to predict candidate molecular drugs for drug targets through a deep learning scheme and then to screen multiple-molecule drugs by drug design specifications for disrupting the SARS-CoV-2 infection at the amplification and saturation stages.
Stresses 02 00029 g001
Figure 2. Visualization of core HPI-GWGEN of amplification and saturation infectious stages. The blue and green edges (lines) represent the protein-protein interactions and gene regulations, respectively. The numbers of each type of node (protein, receptor, transcription factor, miRNA, lncRNA, and virus) are shown in the figure. (A,B) are the core HPI-GWGENs of amplification and saturation infectious stages, respectively.
Stresses 02 00029 g002
Figure 3. The core HPI signaling pathways and their downstream abnormal cellular functions of SARS-CoV-2 infection in (i) amplification stage (left-hand side), (ii) common between amplification and saturation infectious stages (red background in the middle of the figure), and (iii) saturation infectious stage (right-hand side). The green nodes represent the high expression of protein/gene. The red nodes represent the low expression of protein/gene.
Stresses 02 00029 g003
Figure 4. The flowchart of multiple-molecule drug design of the amplification and saturation stages of SARS-CoV-2 infection based on DNN-based DTI model and drug design specifications. The DNN-based DTI model was first trained by DTI data at the right column. Then, the well-trained DNN-based DTI model was used for the prediction of candidate drugs and the candidate drugs were finally screened by drug design specifications as the potential drugs to combine a multiple-molecule drug in the left column.
Stresses 02 00029 g004
Figure 5. The training and validation loss is represented in (A), and the training and validation accuracy is represented in (B). The early stop is adopted to avoid overfitting to stop at epoch = 117.
Stresses 02 00029 g005
Figure 6. The ROC curve of DNN-based DTI model. The higher AUC value indicates the higher ability to distinguish positive and negative interaction. The worst case (AUC = 0.5) is shown with the dotted line, which implies the model predicts the positive and negative randomly.
Stresses 02 00029 g006
Table 1. The number of nodes and edges in candidate and real HPI-GWGENs at amplification and saturation stages. After system identification and system order detection, the false positives in each node of candidate HPI-GWGEN can be pruned through each infectious stage of HPI RNA-seq data and then form the real HPI-GWGEN of each infectious stage.
NodeCandidate
HPI-GWGEN
Amplification Stage
Real HPI-GWGEN
Saturation Stage
Real HPI-GWGEN
Receptor229422942294
Transcription factor145214491449
Protein coding13,98913,98013,981
miRNA154153152
lncRNA88271023664
Virus111111
Total nodes26,72718,91018,551
EdgeCandidate
HPI-GWGEN
Amplification Stage
Real HPI-GWGEN
Saturation Stage
Real HPI-GWGEN
PPIs4,722,699953,4641,053,818
TF -> Receptor14,63394938697
TF -> TF11,84671686590
TF -> Protein84,18355,32651,376
TF -> miRNA17810288
TF -> lncRNA301290291
TF -> Virus15,97213159
miRNA -> Receptor88,42410,87110,267
miRNA -> TF71,04692288256
miRNA -> Protein570,83072,56367,652
miRNA -> lncRNA5502581478
miRNA -> Virus16942312
lncRNA -> Receptor436313306
lncRNA -> TF472270287
lncRNA -> Protein427422882337
lncRNA -> miRNA754
lncRNA -> lncRNA443
lncRNA -> Virus97,097753244
Virus -> Virus121224
Total edges5,689,7191,122,8951,210,769
Table 2. The enrichment analysis of KEGG pathways for core HPI-GWGEN of the amplification infectious stage.
KEGG PathwayCountp-Value
Cell cycle866.32 × 10−17
FoxO signaling pathway807.83 × 10−12
Pathways in cancer2361.37 × 10−10
Hepatitis B904.19 × 10−12
Hepatitis C841.81 × 10−8
ErbB signaling pathway525.17 × 10−8
Tight junction871.00 × 10−7
MAPK signaling pathway1336.95 × 10−7
Endocytosis1136.90 × 10−6
Table 3. The enrichment analysis of KEGG pathways for core HPI-GWGEN of the saturation infectious stage.
KEGG PathwayCountp-Value
Pathways in cancer2276.39 × 10−9
Th17 cell differentiation598.13 × 10−7
Cell cycle661.21 × 10−6
Osteoclast differentiation662.46 × 10−6
T cell receptor signaling pathway562.93 × 10−6
Human T-cell leukemia virus 1 infection1023.81 × 10−6
Apoptosis686.66 × 10−6
Hepatitis B771.59 × 10−5
Hepatitis C751.7 × 10−5
Table 4. The prediction performance of DNN-based DTI model by 10-fold cross-validation.
Validation LossValidation AccuracyTest LossTest Accuracy
10.16564090.950650.21808970.9521126
20.19298580.94380010.17890170.9493726
30.18070190.95049430.18560360.9519569
40.17618610.95072780.20227590.951521
50.18686790.95275160.2163080.9517078
60.16712050.95267010.19562540.9513031
70.18501270.95368210.17767470.9516767
80.19058980.94745450.18653880.9505246
90.18133950.94994550.17922530.951988
100.17894790.94978980.18362740.9529221
Average0.18053930.95019660.1923870.9515085
Standard
Deviation
0.00860330.00272090.01438610.0009184
Table 5. According to drug design specifications, the candidate drugs for each significant drug target are list below.
Candidate
Drugs
Regulation Ability
(L1000)
Sensitivity
(PRISM)
Toxicity
(LC50, mol/kg)
Downregulation of EGFR
Fursultiamine−0.932−0.0352.928
fasudil−0.7910.3673.083
* Bosutinib−0.585−0.0176.273
cefaclor−0.383−0.0993.666
* Erlotinib−0.229−0.3325.73
Downregulation of AKT1
Iproniazid−0.802−0.3372.82
gabexate−0.733−0.1344.487
diazoxide−0.5440.3933.058
* Bosutinib−0.434−0.0176.273
Apoptosis-activator-II−0.3020.0375.695
Upregulation of IFNB1
topiramate0.8480.1612.289
* 17-beta-estradiol0.72−0.275.215
nitrofural0.691−0.4043.88
raclopride0.5140.0783.851
Acyclovir0.3630.30782.452
Downregulation of SMAD3
niridazole−0.7720.2642.746
* Erlotinib−0.537−0.3325.730
* 17-beta-estradiol−0.503−0.275.215
Azacitidine−0.412−0.3932.049
Nobiletin−0.312−0.4485.214
Upregulation of JUN
oleoylethanolamide0.878−0.153.54
carmoxirole0.776−0.0064.477
zibotentan0.6110.2093.013
* Sertraline0.5570.0977.434
Limonin0.367−0.366.726
The drugs with a star (*) are the potential drugs for multiple-molecule drugs in Table 6 and Table 7.
Table 6. The proposed potential multiple-molecule drug with the corresponding targets for disrupting the progression of the amplification stage of SARS-CoV-2 infection.
TargetEGFRAKT1IFNB1SMAD3
Drug
BosutinibVV
ErlotinibV V
17-beta-estradiol VV
Structure of multiple-molecule drug
BosutinibErlotinib17-beta-estradiol
Stresses 02 00029 i001Stresses 02 00029 i002Stresses 02 00029 i003
V indicates the drug can induce or inhibit the corresponding target.
Table 7. The proposed potential multiple-molecule drug with the corresponding targets for shortening the course of the saturation stage of SARS-CoV-2 infection.
TargetSMAD3IFNB1JUN
Drug
ErlotinibV
17-beta-estradiolVV
Sertraline V
Structure of multiple-molecule drug
Erlotinib17-beta-estradiolSertraline
Stresses 02 00029 i004Stresses 02 00029 i005Stresses 02 00029 i006
V indicates the drug can induce or inhibit the corresponding target.
Publisher’s Note: MDPI stays neutral with regard to jurisdictional claims in published maps and institutional affiliations.

