1. Introduction
Service quality in some organizations has been compromised and customer value is affected by the extension. Based on this assertion, consumer loyalty has been dwindling and some organizations are facing competitive challenges from substitute products and services. When organizations do not pay close attention to service quality, such organizations cannot survive and will eventually collapse. Nonetheless, when organizations pay close attention to service quality and deliver to customer expectations, customer satisfaction is obviously achieved and that organization survives. Every consumer expects value for money, in that everyone expects to gain from anything they spent their money on to purchase either a product or service.
Product or service quality can be seen as a collection of attributes, such as those related to production, distribution, marketing, and ancillary operations that satisfy customers and take into account a wide range of social factors. Additionally, quality plays a significant part in manufacturing and broadly construed customer service operations, and it is intimately tied to the effectiveness and efficiency of the supply chain’s operational processes [
1].
It is also important to note that, because of their diverse personalities, customers have quite different perceptions of the quality of goods and services. Services seem to be harder to shape and evaluate because of their uniqueness and volatility. Businesses should engage in actions designed to raise the caliber of their services. The fundamental tasks in this field include identifying the fundamental criteria for quality, augmenting the service delivery process with initiatives that enhance the organization’s reputation, informing clients of the variety of services available, creating a corporate culture that values positivity, going above and above for customers and keeping an eye on and measuring service excellence [
1].
Total quality management has a significant impact on service quality and customer satisfaction [
2]. The resulting socio-political changes completely justify the significance of the attention paid to service quality in the telecom sector. One of these developments, the reversal in consumer preferences for telecom services, can be attributed to global diversities in telecom companies. We can list increased demands and a change in telecom culture as some of the knock-on impacts of these changes, which represent a new type of telecom customer behavior [
3]. These actions influence how customers feel about telecom services, which in turn influences how they judge telecom services.
At this point, the major determinant of determining whether a service provider survives in the market will be the level of service quality provided. Other technological businesses, which have cutting-edge service technologies and excellent customer service, represent a serious threat to the other telecom companies [
4]. If organizations are to succeed in gaining and keeping clients in such a scenario, they must adopt a more pragmatist, market-oriented strategy such as SERVQUAL in order to meet the satisfaction level of their clients.
Additionally, the complexity of service quality assessment and the intangible character of service quality hampered interest in service quality [
5]. Defining and delivering quality service is challenging for the service provider.
Although the literature on service management does a good job of explaining why it is difficult to quantify service quality, it appears that very little research, particularly empirical research, has been conducted to ascertain how service firms are overcoming these challenges [
6].
There appears to be little dispute that SERVQUAL has demonstrated its value over the last ten years as the most often-used tool for gauging customer service. After SERVQUAL was introduced, many people criticized it and questioned its validity, accessibility, and reliability [
7].
3. Customer Satisfaction
Customer satisfaction is defined as a measurement that determines how happy customers are with a company’s products, services, and capabilities. Customer satisfaction information, including surveys and ratings, can help a company determine how best to improve or change its products and services.
An organization’s focus must be to satisfy its customers. This applies to industrial firms, retail and wholesale businesses, government bodies, service companies, nonprofit organizations, and every subgroup within an organization [
22].
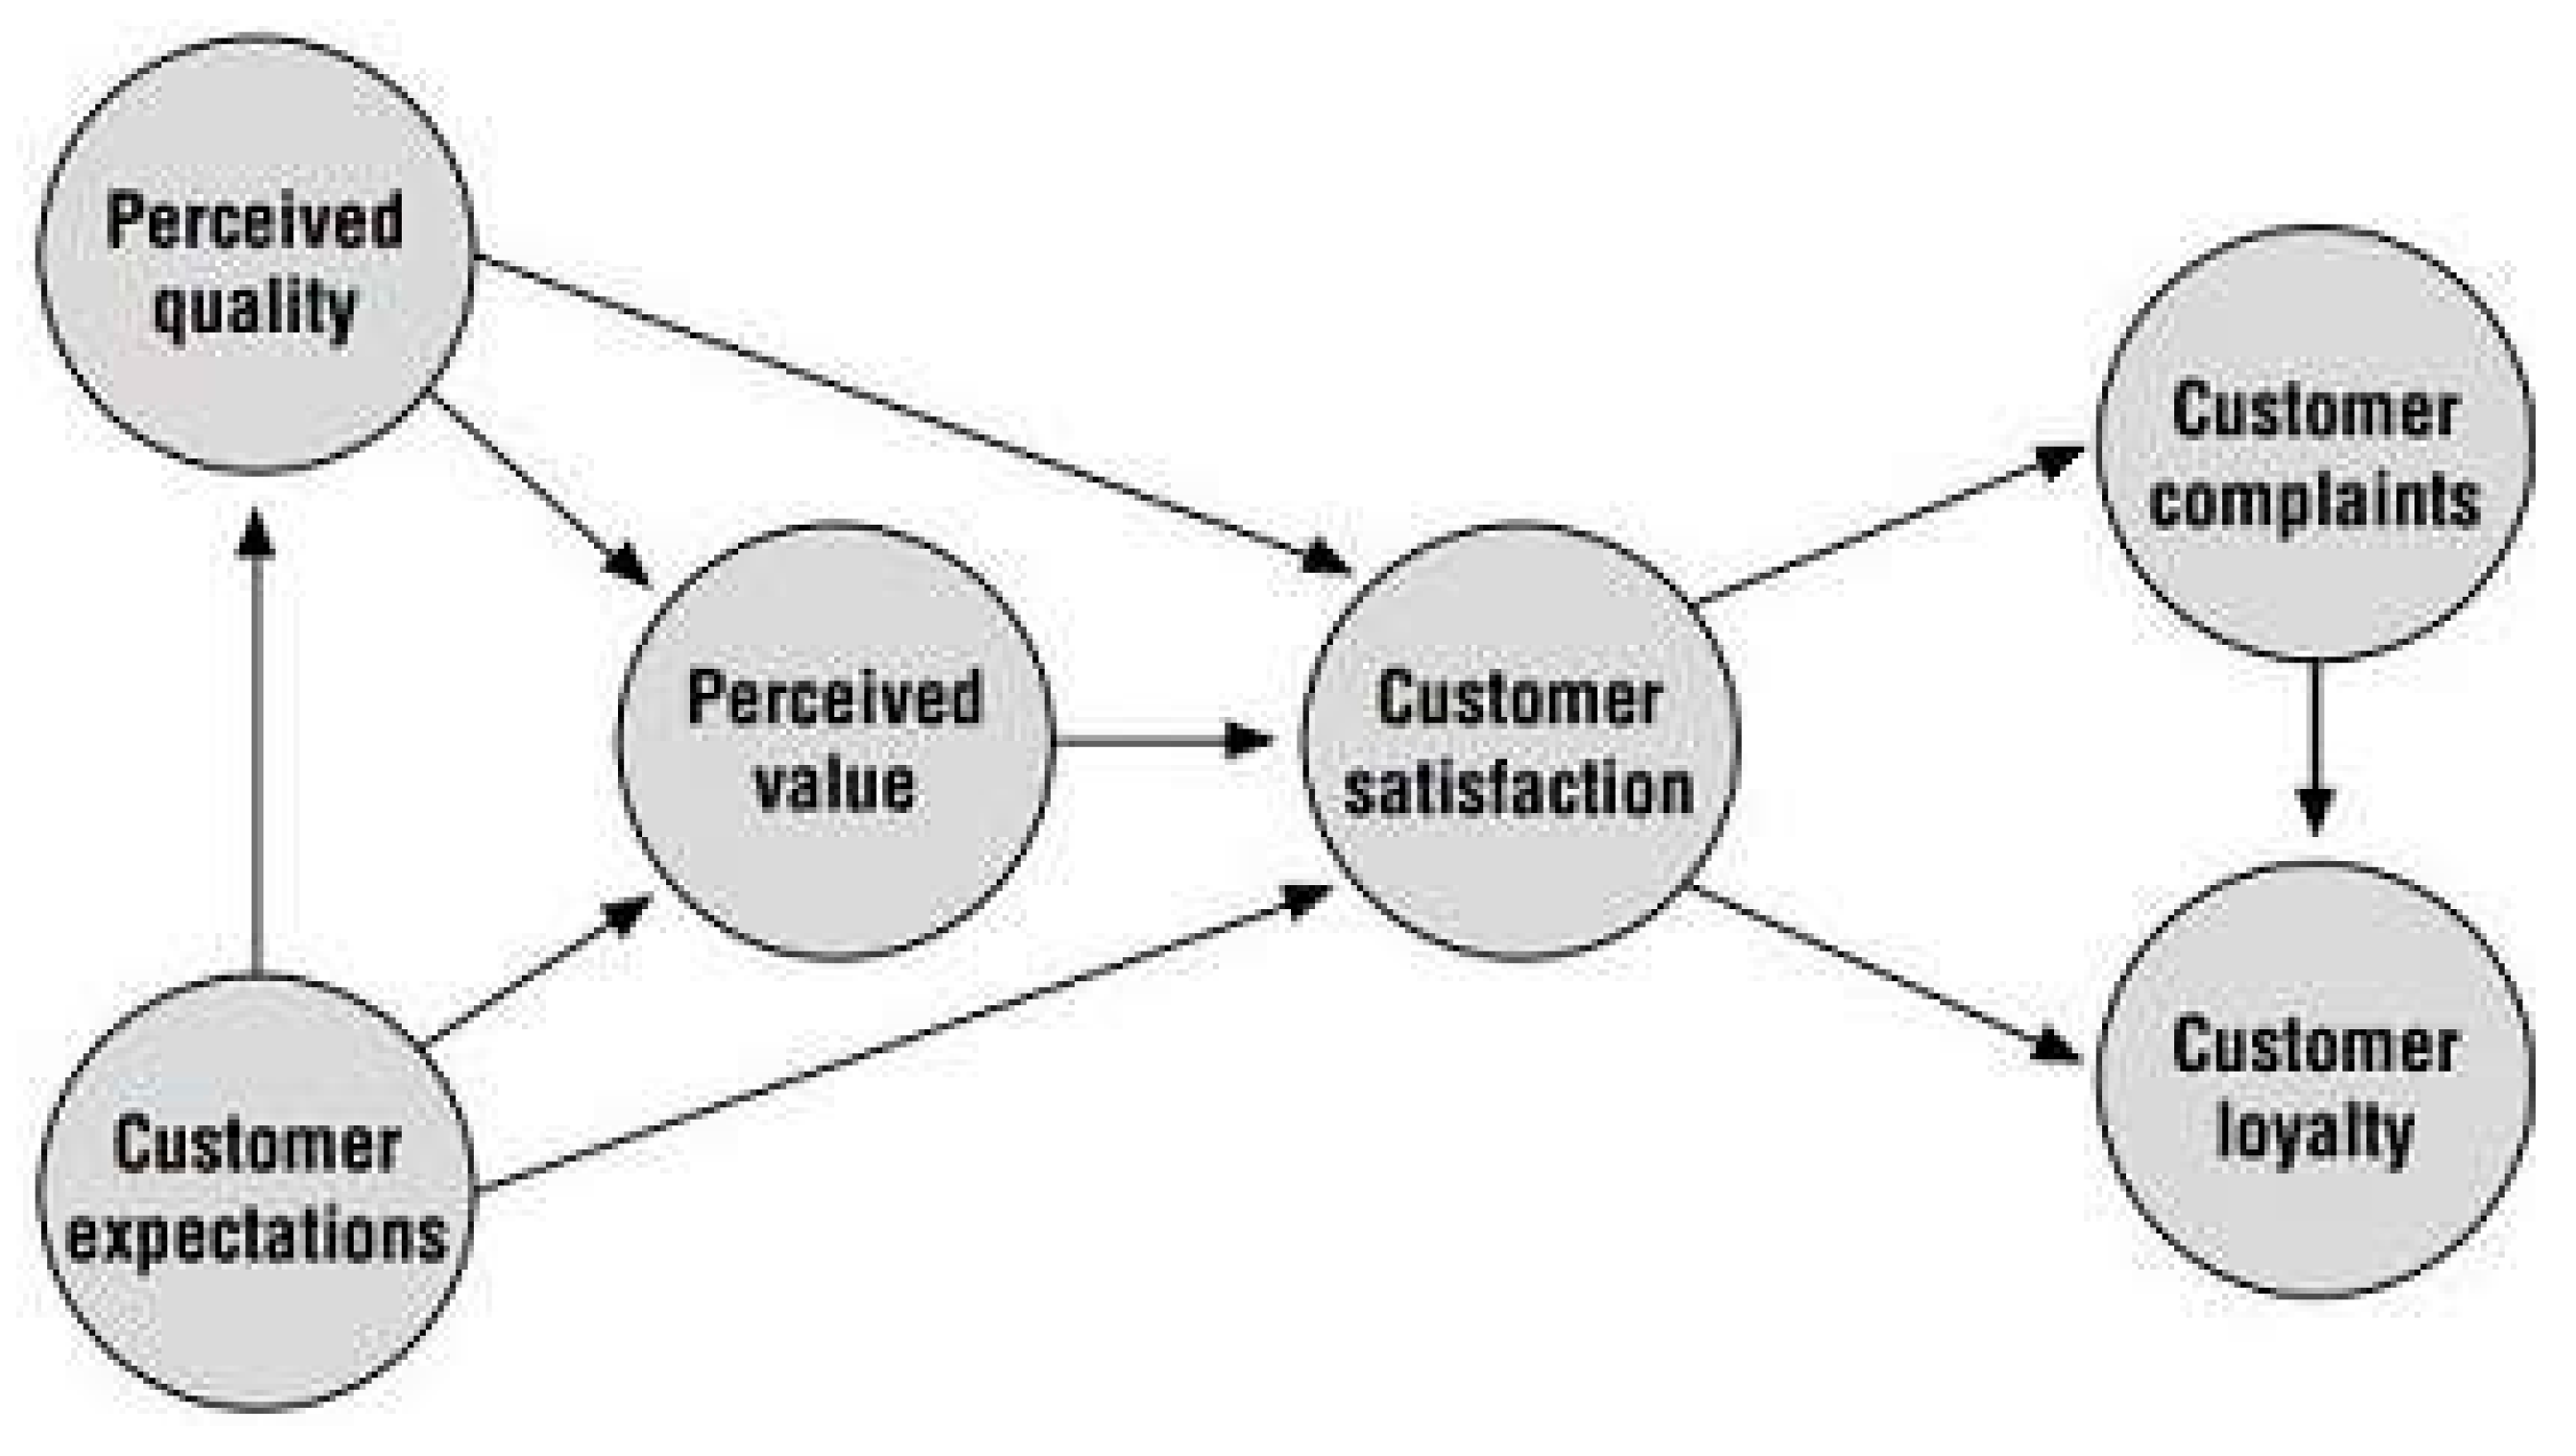
Scheme 1 shows the customers satisfaction model which deals with customer expetation which leads to perceived quality, perceived value when then brings customer satisfaction, then satisfaction causes customer complaints or customer loyalty. When the customer is not satisfied, it leads to complaint but when customers are satisfied, it leads to customer loyalty. The companies have to earn for the group of loyal customers through research, measurement, and determination of the optimal state of quality features of the services provided [
23]. However, it should be remembered that the quality assessment in each phase of the service has its own specificity [
1]. In the process of preparing the service, it should be monitored and implemented by competent staff. When using the product or when providing the service and using its results, the customer is the assessor. However, they are not professionally prepared for this, they are guided by emotions and their evaluation is largely subjective. It is therefore necessary to use instruments and tools that will enable us to examine and understand the client’s needs. The information obtained becomes the basis for the implementation of an optimal TQM strategy by telecommunication companies [
24].
Another important factor that may affect the success of TQM services is quality. The quality of resource services is now perceived as one of the most important components of the competitive struggle between companies. Customer satisfaction is a metric used to gauge how pleased customers are with a company’s offerings in terms of goods, services, and capabilities [
25]. Information about customer satisfaction, such as surveys and ratings, can assist a business in deciding how best to adjust or improve its goods and services. Customer satisfaction must be a company’s main priority. This rule is applicable to all types of organizations, including commercial enterprises, retail and wholesale businesses, governmental agencies, service providers, nonprofits, and every division within one. In marketing, the phrase “customer satisfaction” is commonly used. It evaluates whether a company’s goods and services meet or exceed customers’ expectations. A customer’s reported experience with a company, its products, or its services (ratings) is described as “the number of customers, or percentage of total customers, whose reported experience exceeds stated satisfaction goals” [
26].
“A customer satisfaction statistic was identified as being extremely helpful by 71% of the roughly 200 senior marketing managers who participated in the poll. Customer satisfaction scores within an organization can have a significant impact. They emphasize to staff members how crucial it is to meet consumer expectations. Additionally, when these evaluations decline, they signal issues that could harm profits and sales [
27].
3.1. Service Quality
Modern service marketing theory places a strong emphasis on quality enhancement and adherence to accepted standards of quality [
28]. Because it reinforces the idea that the value of the service received exceeds the price paid for it, high-quality service delivery leads to customer satisfaction and retention. High-quality service greatly increases profitability, according to research. Providing what consumers desire, both internally and externally, is what service excellence is all about. After using a product or service, a customer’s attitude or feeling toward it is known as customer satisfaction. As functions of the customer’s perceptions and expectations, satisfaction and service quality are frequently treated in tandem. By identifying the consumer’s expectations, perceptions of quality, preferences, and customer satisfaction can be calculated [
29].
3.2. Equipment and Materials
Equipment refers to tangibles and durable assets that help in the production of other goods and services. The equipment and materials that the telecom companies use are very important to pay attention to, since their use provides better service to a client. Physical facilities and infrastructure are the core products of telecommunication companies as much as technology and machines [
30]. Equipment is an asset that the company will spend money to acquire. Additionally, these resources are employed for an extended period with the intention of turning a profit. Equipment tends to lose value over time because of wear and tear from repeated use. Equipment will be depreciated throughout accounting bookkeeping tasks so that this reduction in value can be accurately recorded in the company’s accounting books. Materials are also a crucial component of the production process because they serve as the foundation for the product (the basic matter from which the product is made) [
31]. Things like pieces, components, and fuel are examples of materials. Materials utilized may be either durable or perishable depending on the final product created. Materials can be divided into two categories: direct materials and indirect materials.
H1. Equipment and materials of service quality positively influence customer satisfaction.
3.3. Before and During Services
Before services are services that are rendered by telecommunication companies to customers. “Before and During Services” are services rendered when services are in the production state [
32]. Some of these services include service quality, service charge, service time, before and providing service, working day convenience, and customer relationship. The conditions surrounding an ordinary conversation can differ greatly depending on your business, the size and culture of your firm, and other things. Every customer service contact is essentially unique. Several customer service principles apply to every interaction between a company and a client, even if the majority of businesses have specific policies and procedures in place to consider these factors.
The foundation for developing a customer experience that outperforms the competition is consistently putting these ideas into practice [
33]. It is obvious that customer service representatives must give priority to these actions before, during, and after each customer interaction in a world where nearly 90% of CEOs say they are primarily competing based on the customer experience.
H2. Before and during services of service quality positively influence customer satisfaction.
3.4. After-Sales Services
Any assistance offered to a customer after the product or service has already been purchased is referred to as an after-sales service. Because it frequently results in greater customer satisfaction, brand loyalty, and even word-of-mouth marketing, businesses use after-sales assistance as a business strategy.
After using the telecom company’s services, customers are contacted to offer comments and voice complaints [
34]. The majority of the input collected is used to improve customer service and please consumers. As significant as sales is the idea of after-sales support. Although it does not bring in any money for the business, it helps improve the organization’s reputation in the marketplace and with clients. Service provided after the transaction is crucial for both keeping current clients and gaining back any lost ones [
35]. The procedures that followed the sale of the goods and services are referred to as after-sales services. The services are of a maintenance, advisory, and repair nature. The type of after-sales support is entirely dependent on the sector and the item. Some would need installation, whereas others might need cleaning every several months.
H3. After-sales services of service quality positively influence customer satisfaction.
3.5. SERVQUAL
SERVQUAL is a service quality model developed by_”Parsu” Parasuraman, Valarie Zeithaml, and Len Berry [
36]. It draws attention to the essential elements of high-quality service. The developers of SERVQUAL first identified ten components of service quality, but in a subsequent study, these were condensed into five variables: reliability, assurance, tangibles, empathy, and responsiveness (RATER).
Customers’ expectations of service quality in terms of these five aspects and their impressions of the service they receive are both assessed using a questionnaire used by businesses that use SERVQUAL to monitor and manage service quality. Service quality is judged to be poor when client expectations exceed what they perceive to have been delivered [
37].
3.6. Mobile Telecommunication Landscape in Ghana
Ghana, a country with a stable democracy, a varied culture, and a thriving economy is regarded as the entryway to West Africa [
38]. Ghana offers numerous prospects for diverse businesses in Africa to prosper, serving as a microcosm of the continent’s emerging world. For better comprehension of the potential frontier markets in the new global economy, Ghana makes a suitable case study. According to UN figures in 2020, the population of Ghana was predicted to be 31,072,940 by the midpoint of the year [
39]. The mobile telecom sector is one of Ghana’s most well-known and prosperous sectors. The expansion of mobile communication in Ghana had a significant impact on the nation’s economic growth. Additionally, the percentage of people using mobile devices climbed slightly from 131.0% in the first quarter of 2016 to 131.9% at the conclusion of the second quarter. Estimating mobile penetration in Ghana involves dividing the total number of mobile users by the country’s entire population. Ghana’s mobile connection penetration rate was predicted to increase to 140% by 2020 [
40].
4. Research Methodology
To ascertain the relationship that exists between variables, a descriptive research design was used in the study. It aimed to explain the causes or consequences of one or more variables and to show how one variable affects other variables.
Eight hundred (800) respondents from MTN and Vodafone Ghana, Ghana’s two largest telecom providers, were the study’s intended sample. For this research work, a survey technique was adopted to collect data about the proclivity of TQM on customer satisfaction. Eight hundred (800) questionnaires were administered to customers and employees of both MTN Ghana and Vodafone Ghana Limited within the Greater Accra Region of Ghana. These people were chosen at random from ten (10) different MTN customer service centers and other places across Greater Accra. The canters were grouped into five (5) divisions. These divisions are as follows: Osu Center, Gbawe Center, Circle Center, Roman Ridge Center, and Kaneshie Center. The researcher administered eighty-five (85) questionnaires at each of the 10 care centers. With this, fifty-five (55) questionnaires were administered to the customers, and twenty (20) and ten (10) were given to employees and top management, respectively. In aggregate, five hundred and fifty (550) questionnaires were given to the customers, whereas two hundred (200) and one hundred (100) were respectively administered to employees and top management. A sum of 850 questionnaires was distributed, but 800 responses were retrieved for use, representing a 94.12% recovery rate. The investigators also ran preliminary tests such as reliability, validity, and multicollinearity tests to ascertain if the received data were reasonable enough for the research, and would fit the expected model. The data collected were analyzed and inferences were drawn in the study.
Research Framework
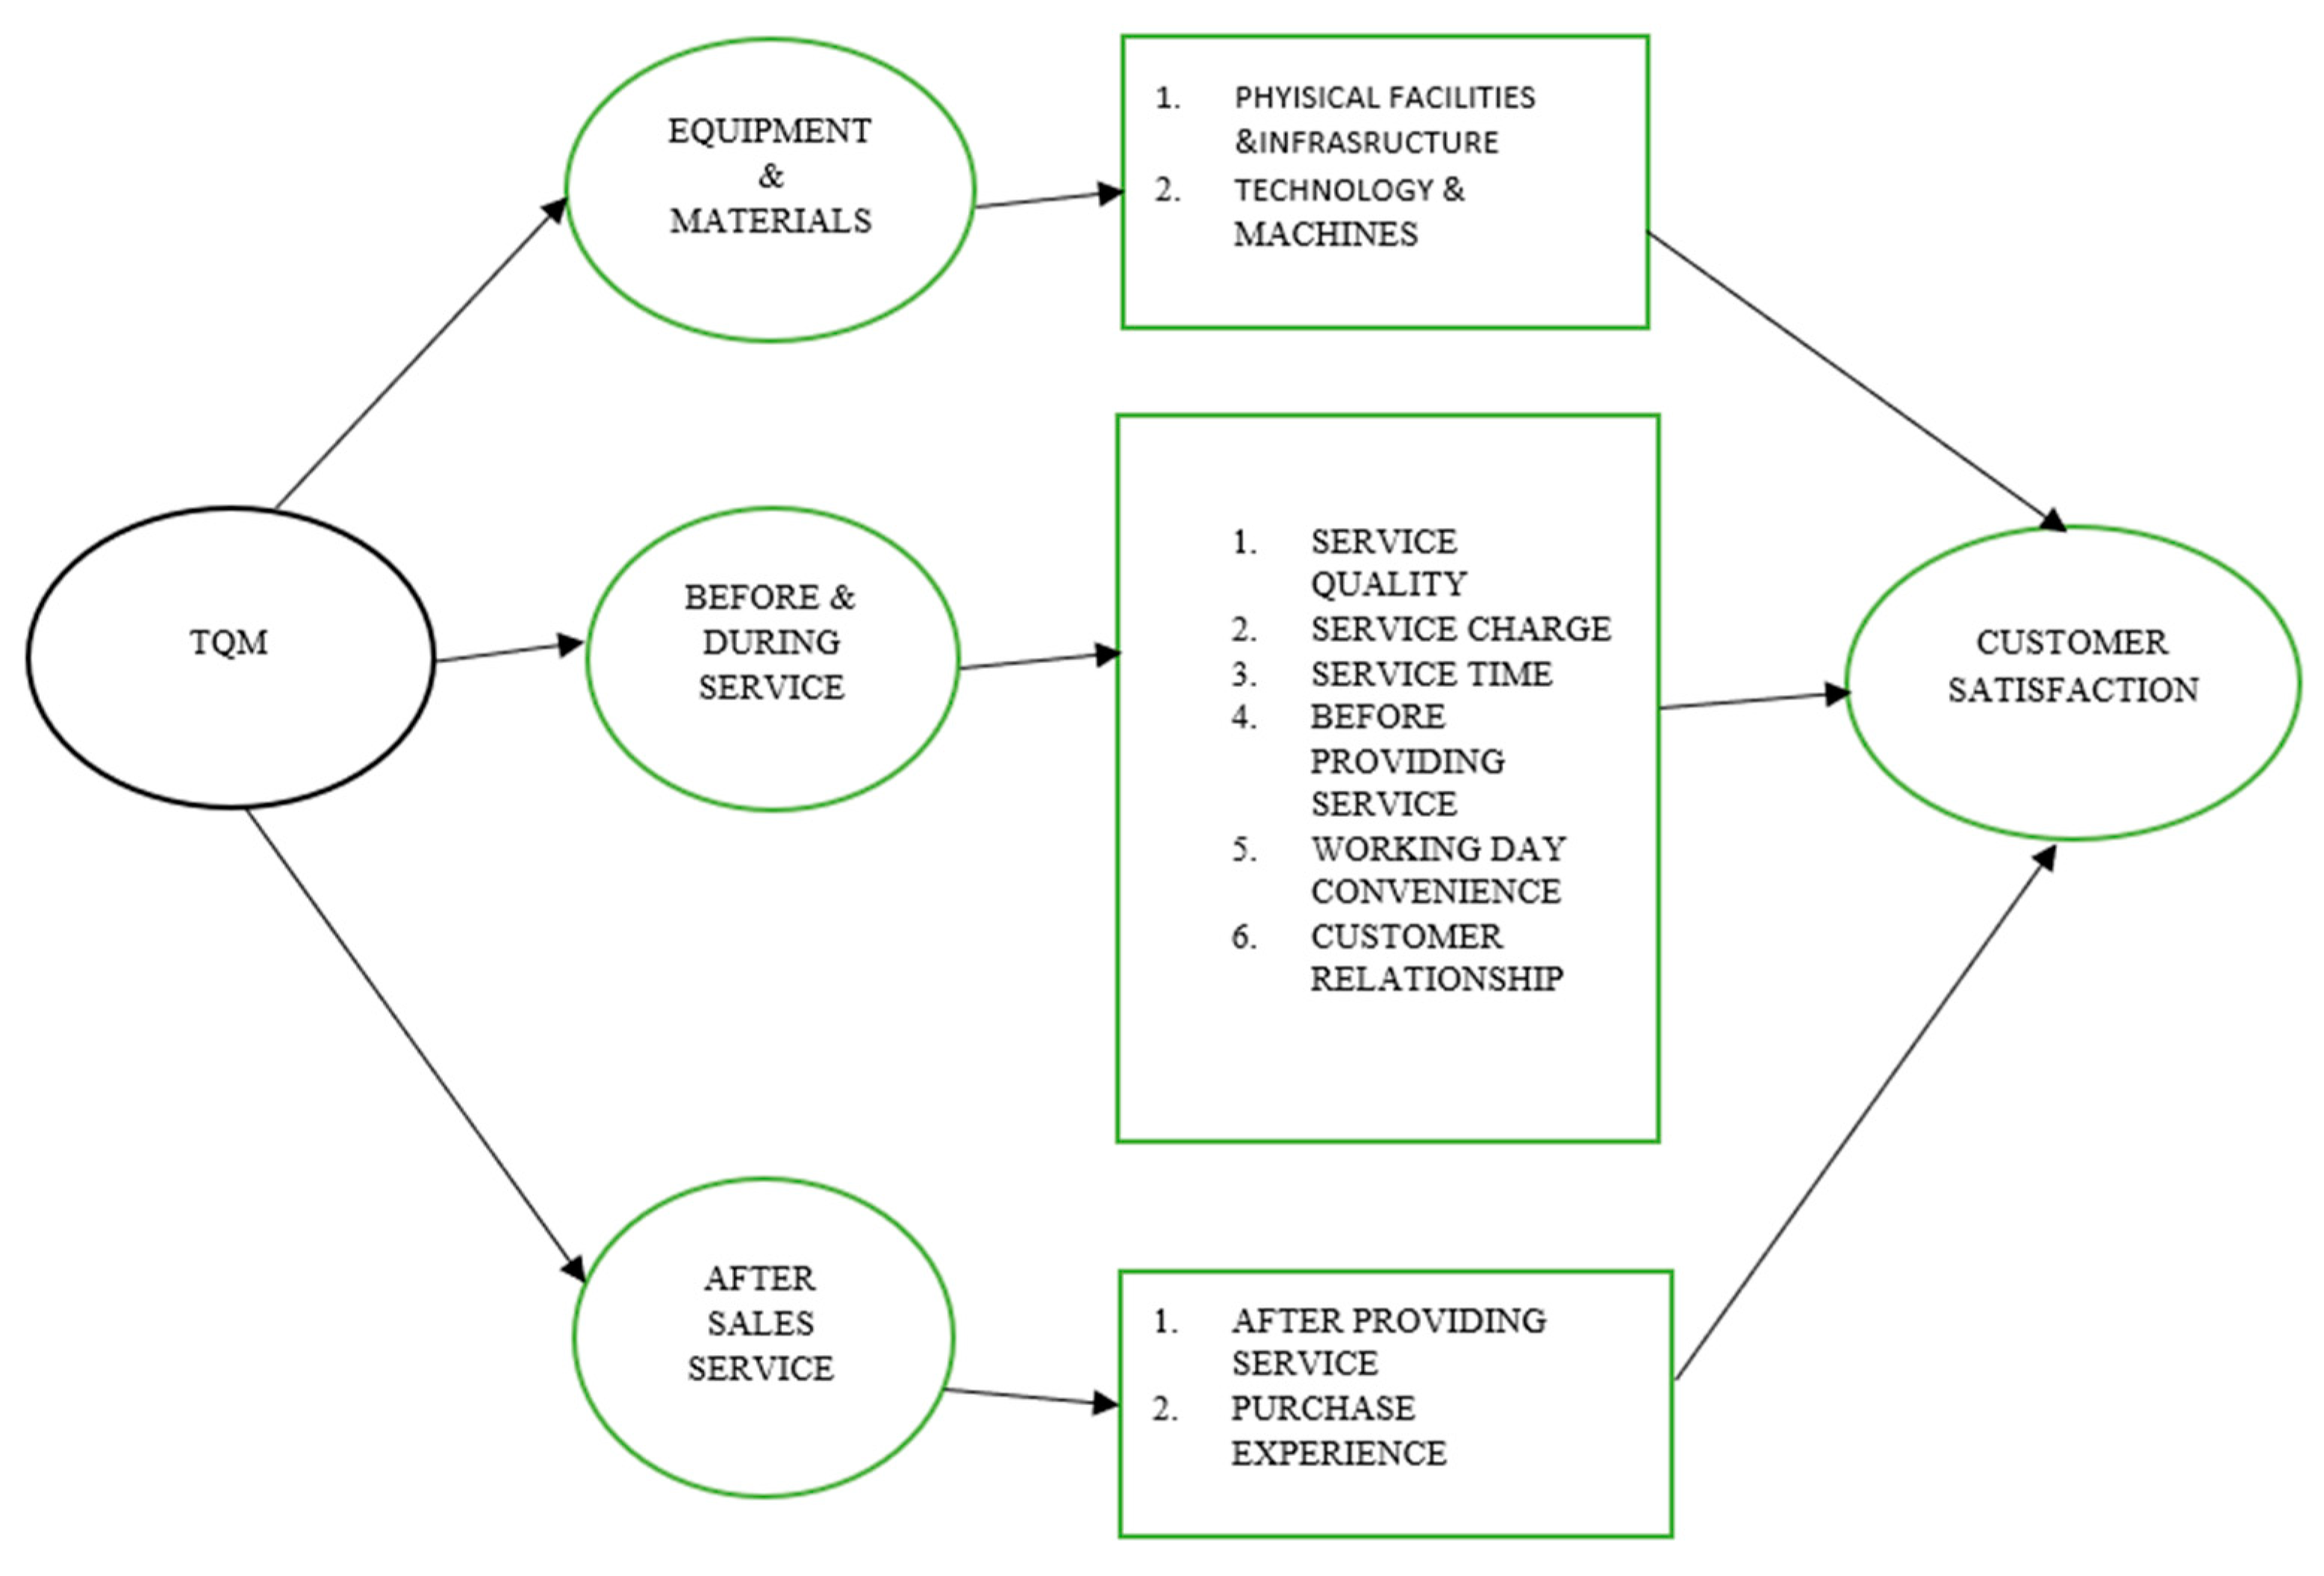
Figure 1 is the authors’ conceptual framework that discuss how TQM has influence on various services offered by the Telecommunication companies and its impact on customer satisfaction. The authors designed a conceptual framework for the study. The framework was used to make conceptual characteristics and knowledge accrual to support total quality management on customer satisfaction. The variables employed have effects on consumer behavior through customer satisfaction with telecom companies. TQM–SERVQUAL perception. In SERVQUAL, consumer behavior determines customer satisfaction through the provision of service quality.
Table 1 shows the labels of the various variables of the study. CSA of the
Table 1 represent Customer Satisfaction which is the dependent variable, and independent variables with the following labels; ETM which represent Equipment and materials, whiles BDS, and ASS represent Before and During service, and After-Sales Services respectively.
5. Findings and Discussions
From
Table 2, the findings showed that 473 (59.12%) out of 800 respondents were males, whereas 327 (40.88%) were females. Participants aged 31–40 were the highest of the age brackets ranging from below 21 years to 71 or more years. On an educational level, those with senior high certificates were 388 (48.50%) being the highest. A total of 9 (1.13%) were PhD holders making them the least in the cohort. From the table, all the respondents could read, understand, and interpret, since none was uneducated. Regarding marital status, people who were single at the time of the survey surpassed the others, with a value of 322 (40.25%). With respect to the number of years of subscription or engagement, individuals who have been with MTN Ghana and Vodafone Ghana for a period of 5–9 years formed a majority of the respondents, representing 328 (41.00%).
Table 3 shows the correlation matrix, which demonstrates the link between the variables. The results show that there is a positive and robust link between ETM and CSA at 902, as shown in the table (90.2%). This suggests that “Equipment and Materials” (ETM) has a substantial positive relationship with customer satisfaction (CSA). It specifies that “Equipment and Materials” (ETM) has a high tendency for customer satisfaction (CSA), which supports with the study by [
41]. CSA correlated positively with BDS and ASS at a percentage of 22.3 and 10.8 respectively. The investigational results illustrate that ASS has a positive relationship with ETM. This is because after-sales services are effectively utilized where there are good equipment and materials in place, and it gives the employees confidence to work efficiently.
Table 3 reveals, however, that a significant number of cross-correlation values for the independent variables are tiny. This provides a valid reason to be less concerned about the issue of multicollinearity among the independent variables [
42].
The results of the model estimation for the data shown in
Table 4 indicate admirable outcomes for the impact of comprehensive quality management on Customer Satisfaction. The authors considered a model that could practically envision Customer Satisfaction through total quality management, with a confidence interval level of 95.0 percent. The model had a
p-value of 0.001 in the experiment. The coefficient of determination (R-square) calculated from the table was 0.883. This number indicates that the model correctly predicted 88.3 percent of the distribution, implying that MTN’s and Vodafone’s total quality management techniques were responsible for nearly 90% of the changes or variance in Customer Satisfaction. The R-square score indicates that the model has a high level of precision because of the independent variables’ accurate estimating capabilities. The larger the percentage of accurate estimation, the better the model fits the study statistically. Variables used in a study have physiognomies to convincingly measure the phenomenon through the results produced in the experiment. As a result, a unit change in one variable is likely to have an influence on the other. An increase in one variable, on the other hand, causes an increase in the other, and vice versa. For example, if the variable “Equipment and Materials” is increased, there is a good chance that Customer Satisfaction will improve as well.
Table 4 shows that the correlation between “Equipment and Materials” for customer satisfaction is 0.623. This demonstrates that for every unit rise in top management commitment, there is an expected unit increase of 0.623 in customer satisfaction, with all other variables being constant. The findings show that “Equipment and Materials” has a favorable impact on Customer Satisfaction, with a statistically significant value of 0.003 in the study. This finding suggests that “Equipment and Materials” has a high inclination for organizations to succeed. This finding is analogous to an earlier study by [
43]. In this competitive environment through globalization, companies survive with much effort, unless organizations have good equipment and materials to create the avenues and strategies to forestall competitive advantage over their rivals. Total quality management (TQM) has long been recognized as one of the critical challenges that have waxed the interest of both management and customers. The variable “Before and During Services” reported a positive relationship with customer satisfaction and is highly significant in this research. “Before and During Services” is considered one of the effective TQM tools to offer businesses growth and success. A satisfied customer helps in business growth through referrals and recommendations. Our findings support previous research by [
44] who discovered that “Before and During Services” improves customer satisfaction. This research result provides empirical evidence that “After-Sales Services” positively affect customer satisfaction with a high statistical significance level of 0.002. Our study is in congruence with previous findings by [
45] which found that “After-Sales Services” have a positive effect on customer satisfaction. When a customer is not satisfied, the customer will switch to another competitive firm that offers customer satisfaction. Companies with effective and operative TQM implementation can accomplish corporate benefits such as productivity enhancement, quality enrichment, turnover maximization, organizational goodwill, and customer and staff retention.
The authors used a robustness and diagnostic test in
Table 5, which is an alternative to least squares regression for detecting significant observations and overcoming some limitations of traditional parametric and nonparametric methods, to examine the Customer Satisfaction for telecommunication companies in the implementation of TQM. “Equipment and Materials”, “Before and During Services”, and “After-Sales Services” were all identified as explanatory variables in this study. According to the results of the robust test, the model is statistically significant and higher (0.000), as shown in
Table 5. The effect of the explanatory variables (total quality management practices) on the dependent variable (Customer Satisfaction) was 0.914. This expounds that the variance explained by the model happened to be 91.4%, signifying immense results produced. From the investigation, the impact of improving customer satisfaction is consequential from the execution of TQM activities, since they have strong prediction power. The test, on the other hand, endorses the notion that TQM has a significant impact on customer satisfaction. The findings give an intensified confidence that total quality management practices are a booster for a firm’s customer satisfaction. As far as a business entity introduces and implements quality management activities, the organization’s competitive advantage will be improved [
46]. It is palpable that improving operational efficiency can result in customer satisfaction by delivering contented services on time and providing quality products to meet their needs and or requirements.
The
Table 6 shows the different services provided by telecom companies to the customers and their opinion about each of them. The majority of the customers say that “service quality”, “service charge”, “service time”, “customer relationship”, “purchase experience”, “technology”, and “working day convenience” are all rated “average” being 280, 260, 320, 310, 200, 300, 280, 180, 170, and 320, respectively. Only a small number of the respondents rated them as “bad” or “very bad”. Nonetheless, physical facilities and infrastructure is rated as “good” with 360 in total, whilst “service charge” and “working days convenience” were rated with 200 in total as “good”. It is believed that “service charge” is perceived to be high, which agrees with research conducted by [
47] on the high cost of telecom charges.
The
Table 7 lists the rankings of the various services that telecom companies offer to their consumers. The majority of customers choose “good relationship with customers” first, with “information in time” ranking second. Next comes “quick rectification of poor network” followed by “promising service delivery”. “Detection of mobile fraudsters” is the final step. This shows that telecommunication companies are unable to detect mobile fraudsters, leaving mobile users in the hands of fraudsters, causing inconvenience to mobile users. This agrees with a study conducted by [
48] on fraud crime mitigation of mobile applications.
Table 8 shows that, the majority of customers place “service delivery” first with a rating of 3.89, followed by “working convenience” in second place with a rating of 3.86, “information in time” in third place with a rating of 3.85, “physical facilities and infrastructure” in fourth place with a rating of 3.78, “technology and machines used” in fifth place with a rating of 3.64, “good relationship with customers” as sixth with 3.49, “quick rectification of poor network” as seventh with 3.44, and lastly “detection of mobile fraudsters” with 3.03.
The
Table 9 indicates that “good relationship with customers” ranked first with 4.41, which shows that establishing a good relationship with a client is of ultimate importance. “Information in time” is the second in line with 4.41, cluing that telecom companies must provide information on time to whoever needs it. “Physical facilities and infrastructure” is rated third with 3.95, “delivery security” is rated fourth with 3.91, “technology and machines used” rated fifth with 3.88, “quick rectification of poor network” is rated sixth with 3.80, “working days convenience” is rated seventh with 3.36, and the “detection of mobile fraudsters” as last with 3.10, which shows that more attention must be focused on that area. A critical concern must be given to “detection of mobile fraudsters” because many clients see that section as bad. A study conducted by [
49] on “an ensemble learning based approach for impression fraud detection in mobile advertising” revealed mobile fraud as a major threat in recent times.
The gap analysis in the
Table 10 shows that “tangible”, which includes “physical facilities and infrastructure” and “technology and machines used” show the highest average dimension of 0.41, which demonstrates that technology and machines have a positive impact on customer satisfaction. Our study is in congruence with previous findings by [
50]. The next is “reliability” which shows 0.40, meaning the company is reliable in times of rectifying issues. The third ranking is “empathy”, showing 0.39, which means that “customer relationship” and “working day” are on average ranking. “Responsiveness” is ranked as fourth in line, which gives a low signal for information given on time. The last ranking is “assurance”, showing 0.09, meaning telecom companies have to work on their “service delivery” and “detection of mobile fraudsters”. This also means customer satisfaction in the “detection of mobile fraudsters” is not satisfactory; therefore, telecom companies need to work on this. This study affirms the research conducted by [
51] on detection of Wangiri telecommunication fraud.
Table 11 shows the perception of service dimensions, “the telecom companies’ willingness to help customers and provide prompt service” is a heartbeat of the telecom companies which gives a ranking figure of 29 as the first in line as indicated in
Table 11. The second in rank is “the telecom companies’ ability to perform the promised service dependably and accurately” with a figure of 28, which is seen to be a concern of the telecom companies. “The caring and individual attention that the telecom companies provide to their customers” is ranked third with a figure of 16. “The knowledge and courtesy of the telecom companies’ employees and their ability to convey trust and confidence” ranked fourth with a figure of 15 and telecom companies need to take a critical look at that dimension because an employee needs to have full knowledge of their organization. The last to mention is “the appearance of the telecom companies’ physical facilities, equipment, personnel, and communication materials” as the fifth with a figure of 12, which gives the attention of poor appearance of these needs. According to [
52] telecommunication companies are willing to help their clients and provide prompt services.
From the
Table 12, it is inferred that the entire gap in SERVQUAL model is good because all those gaps are positive except “Assurance”, which includes
“service delivery” and “detection of mobile fraudsters”. It means that actual satisfaction is greater than expected satisfaction. Our study is in congruence with previous findings by [
53]. In the case of service delivery and detection of mobile fraudsters, it is showing a low value of 0.9, this gap implies that the expected satisfaction is below the perceived or actual satisfaction.
6. Hypothesis Testing
Customer relationship is the primary factor that determines the quality of the service. In addition, customers support TQM efforts at all times while using their network services. The outcome of this study’s empirical evidence supports the notion that total quality management has direct and beneficial impacts on corporate customer satisfaction. The findings of this study which is summarized in
Table 13, revealed that there is a link between “Equipment and Materials” and “service quality”, which positively influences customer satisfaction; hence, we accept H1, which is in line with the contribution of [
54]. In their study, total quality management had a significant effect on perceived service quality and customer satisfaction. SERVQUAL, according to Cronin and Taylor (1992), is paradigmatically wrong since it misjudged and adopted this disconfirmation model. Cronin and Taylor (1994) note that SERVQUAL confuses attitudes and satisfaction while assessing neither service quality nor customer satisfaction in previous works. They developed an alternative measuring instrument, SERVPERF, which simply considers performance, and claimed that service quality might be operationalized as “akin to an attitude.” The research of [
55] contends that service quality and customer satisfaction are separate constructs but related in that satisfaction mediates the impact of earlier periods’ perceptions of service quality and leads to the formation of new service quality perceptions, lends support to Cronin and Taylor’s critique. Service quality and results in the formation of new service quality perceptions. The SERVQUAL scale is based on Parasuraman, Zeithaml, and Berry’s (1985, 1988) gap theory, which contends that consumers’ perceptions of service quality are influenced by the discrepancy between their expectations for the performance of a general class of service providers and their assessments of the actual performance of a particular firm within that class. However, there is no substantial theoretical or empirical support for the usefulness of using the expectations–performance gap as a benchmark for service quality. In addition, [
56], conducted research on service quality. However, we believe it is more likely that H2 will be accepted, which states that “Before and During Services” of service quality positively influences customer satisfaction, which is in line with [
57]. In their study, customer satisfaction is a much stronger driver in influencing repurchase loyalty. They stated that service-quality customers with a concerted satisfaction edge stick to the products and services of an organization. We accept H3 as indicated in
Table 13, which is that “After-Sales Services” of service quality positively influence customer satisfaction because the empirical evidence presented in this study suggests that there is a favorable association between “After-Sales Services” and customer satisfaction which is in line with [
58]. In their study, their data analysis confirms the positive correlation between after-sales service quality and customer satisfaction, the positive correlation between customer satisfaction and customer loyalty, and the direct and indirect relationships between after-sales service quality and customer loyalty. According to [
59], the implementation of TQM helps improve customer satisfaction.
7. Conclusions and Recommendations
Data analysis and interpretation were conducted using the collected data. Responses from 800 employees and consumers were collected, and their opinions on the many TQM-related topics were interpreted. Some parity can be seen in the pattern of their reactions. Some of the clients were not prepared to reply. A hassle-free study has otherwise been undertaken. The data were analyzed using several statistical techniques, and the general findings were discovered and reported.
This study concludes that telecommunication companies can only survive and achieve customer satisfaction by paying close attention to service quality. The results indicated that when service quality is compromised, telecommunication companies would lose their clientele base, which affects customer satisfaction and customer values for that organization. This study suggests that TQM policies in the telecommunication industry must be centered on service quality, which includes “Equipment and Materials”, “Before and During Services”, and “After-Sales Services”. The study shows that telecommunication companies cannot survive without paying close attention to service quality since consumers assess telecommunication companies’ performances based on a company’s ability to satisfy customers through quality service delivery.
TQM is focused on how customers perceive the results of the service quality and how well they think the service was delivered. Nonetheless, some employees and top management also shared their views on how equipment and materials aid in customer satisfaction, in as much as a service can be dissatisfied, satisfied, or exceed customer expectations. Gaining a clear grasp of the connection between TQM and customer satisfaction from a SERVQUAL perspective is the study’s key goal.
The success of a firm depends on how satisfied its consumers are, and one of the elements that directly correlates with customer satisfaction is TQM [
60]. If TQM is applied, companies are able to quickly respond to customer requests and provide them with high-quality services. The authors conclude that with the good implementation of TQM techniques, telecommunication companies are able to satisfy their customers. Telecom companies must study customer relationships and develop a strong system of communication skills with their customers if they want to achieve customer satisfaction. Telecommunication companies must know how customers rate the quality of a company’s services and how to evaluate that quality to the advantage of business success [
61]. According to the results of this survey, the majority of businesses offer a wide range of TQM services, and these services help achieve customer satisfaction. Some customers are only somewhat satisfied with the TQM activities, so it is vital to train the employees more about the TQM services [
62]. Based on the above submissions, the authors conclude that paying attention to service quality on “equipment and materials”, “Before and During Services”, and “After-Sales Services” help achieve customer satisfaction, so telecommunication companies should monitor these various services in order to survive in business. The study suggests that telecommunication companies must pay attention to:
The tangible nature of services such as equipment and materials.
The companies should be reliable in their service delivery.
They should respond to issues and complaints as quickly as possible.
They should assure a customer of the good quality of services and readiness to resolve problems as and when they happen.
Additionally, telecom companies must show empathy (the ability to understand and share the feelings of their customers).
Therefore, total quality management had a significant impact on service quality thereby influencing customer satisfaction.
7.1. Limitation of the Study
The research significantly contributes to the influence of TQM on telecom companies to enhance satisfaction. Nevertheless, the study was faced with certain limitations. The first shortfall of the research is the limited data used by the researcher.
The research examination was constrained in the sense that the study could not do a thorough investigation of all telecom companies in Ghana. Therefore, the research relied on a sample size of a few telecom companies in the industry. Data collection concerning telecom operations is difficult, which is probably due to the reluctance of employees to allow easy access to information due to bureaucratic, dogmatic, and other influences in the telecom administration. Thence, the investigator could not administer questionnaires to all possible respondents of the population, except those reachable. However, the collated data was limited to a cross-section of the total population. In addition, in the model to estimate the impact of TQM on customer satisfaction, other satisfaction elements were not available even though that could not have affected the soundness of the results. Some of the employees also think providing data about the telecom company represents leaking or divulging valuable information into the public domain for competitors to see their strategies, strengths, and weakness. However, these limitations enumerated did not affect the predictability, validity, and precision of the findings of the research.
7.2. Policy Implications
Quite a number of policies can be espoused from the conclusive suggestions in the research. Considering the analysis of TQM services in the telecommunication sector, telecom service quality can be improved if guidelines and principles are meticulously followed. The implication is that so long as the TQM practices are addressed, customer satisfaction will be enhanced. Based upon the conclusions drawn in the research work, it is recommended that by emphasizing “Equipment and Materials”, “Before and During Services”, and “After-Sales Services”, the telecommunication companies can survive in the competitive environment. The research also suggests that establishments need to focus on these total quality management practices in order to sustain themselves in the business environment. For organizations to thrive well in the industry, they are essentially urged to develop relevant policies for the enhancement of good total quality management policies, which in turn could generate satisfactory returns. Well-executed total quality management policies through service quality are intended to increase customer satisfaction of telecommunication companies and circumvent massive adversities before occurring. From the findings, it is candidly suggested that Ghanaian telecom companies should increase the total quality management aspects such as “Equipment and Materials”, “Before and During Services”, and “After-Sales Services” in order to upsurge customer satisfaction. However, the study recommends that “Equipment and Materials” must be constantly checked in order to mediate the other policies into action. It is believed that when “Equipment and Materials” are constantly checked, it will aid in the effective completion of responsibilities assigned to employees in the aspects of “Before and During Services”, and “After-Sales Services” serves as a catalyst to achieve customer satisfaction.
“Before and During Services” which entails “service quality”, “service charge”, “service time”, “before providing service”, “working day convenience”, and “customer relationship” must be checked by the top management on a regular basis, and reports issued without delay to ensure efficient functioning of the telecom structure. Most times customers experience network disruption poses a lot of stress on customers when contacting service providers. Timely corrective action makes flawed systems get back on track to maintain optimum internal mechanisms. Therefore, all telecom companies must have competent top managers who will supervise the entire management and staff for quality service. Data validity tests can be made to confirm quality information and reporting if amounts or figures are found within a reasonable range, and variances can be dealt with swiftly. This will help telecoms measure satisfaction and facilitate prompt modification in case of deficiencies. However, after-sales services must adopt and stick to admirable total quality management policies that would regulate the shortfalls of the service rendered to customers of the telecommunication companies.
The researcher hereby suggests that telecom companies in Ghana adopt technological devices that will drive innovation in order to achieve maximum satisfaction as well as machines that can easily detect and trace fraudsters. However, physical facilities and infrastructure must be improved to suit the standard of customers, thereby increasing the satisfaction level of their customers. Nonetheless, technology and machines need to be in constant check so as to offer better service quality to their customers. The research proposes that telecom companies should stress more on the variables, which have a positive effect on customer satisfaction, and thus can increase their market share and revenue. With respect to the findings, this study will be appropriate for managers, CEOs, directors, and academicians.
7.3. Recommendations for Future Research
The research findings augmented knowledge in assessing the influence of total quality management on customer satisfaction in the telecom industry. However, the researcher implores that other areas could also be looked into to extend scholastic ideas in the field. Firstly, by hiring qualified employees to execute TQM policies, telecom companies should hire more qualified employees or provide the present staff with more training on TQM to improve customer satisfaction. Gathering feedback, serving customers at all times of day, and making customers feel wonderful by having good customer service are all conducted by employees. The research direction in this area will give a comprehensive view of customer trust and satisfaction.
Secondly, improving the understanding of the technical support of TQM on customer satisfaction may be examined as further research. Telecom operators must improve technical support of “Equipment and Materials” to help telecom businesses cut down on customer complaints, offer customers improved TQM services, and as TQM improves, activities get better, which leads to much improvement in customer satisfaction, thereby achieving customer satisfaction required. Another worthy area of research is the TQM influence on customer satisfaction for future academics to explore the amalgamation of TQM and consumer behavior. Thus, this research direction could be studied from the theoretical relations between TQM and consumer behavior.
To secure their particularities and leverages the substantial connections and synergies between them. TQM has to be effectively employed to ensure an appropriate link between consumer behavior, employees, and other stakeholders of telecommunication companies. However, TQM seeks to provide organizational sustainability in the telecom industry to ensure that the company functions more professionally and efficiently.


