1. Introduction
Multinational Enterprises (MNEs) routinely engage in deal-making through their holding companies and subsidiaries to develop competitive advantages in products and geographies. The aggregated nature and direction of the MNEs deals such as acquisitions, capital increases, spin-offs and alliances among others can be viewed as steps toward achieving the desired global product-geographies business structure. While deals are not the only method for such strategy implementation in general, they tend to be the primary one for MNEs in the pharmaceuticals (pharma) industry [
1]. Conversely, global strategy formulation and implementation can be expected to align with deal-making directions that result in the desired business structure. In addition to a global view on targeting desirable markets for existing product portfolios, new products’ development by geographies can also benefit from a global strategy that leverages regional knowledge to avoid the over-featuring of products [
2]. Hence, for both global strategy formulation and implementation, an understanding of the influence of deals on the business structure can offer efficiency benefits and validations. Other affected entities such as competitors, partners, policy makers, regulators and others also stand to gain through better anticipating their own reactions. However, for large MNEs, due to their typically complex shareholding and large number of subsidiaries, the relationship of the deals to the global strategy is not readily evident. Several studies have explored MNEs’ product and country diversification strategies separately while few have used an integrated approach. The goal of this study is to highlight the key global level strategy insights that can be derived only from an integrated view of these diversification metrics and motivate further research. In this work, empirically deriving desired structural goals of major MNEs and overlaying the nature of their past deals provides a practical approach to addressing two primary research questions. First, over the longer-term, what are the diversification structure goals that MNEs prefer? Second, what is the nature of the product-countries’ diversity in their deal-making for achieving their longer-term diversification structure goals?
Towards this objective, we selected the global pharma industry for insights into large highly regulated, knowledge-based MNEs. Several major MNEs by revenue today were born and evolved from M & A deals [
1], making deals analysis a credible approach for the objective. Network analysis of deals revealed the largest pharma MNEs with a global footprint as hubs of the major clusters. We analyzed the publicly declared interfirm deals of these pharma firms at the level of their Group Ultimate Owner (GUO), combining subsidiaries with the parent firm into a single entity that engages in deal-making across the globe. We isolated the products and countries’ diversity preferences as a cumulative from their historic deals to derive their deal profiles. We normalized these deal profiles using the Herfindahl–Hirschman index (
HHI) and compared them with their
HHI normalized current subsidiaries’ diversity structure to visualize structure goals with the nature of deals that can lead to them. We rationalized these insights, including goals, to deals relationships that did not appear empirically.
Using strategic inclinations as an indirect measure of firm performance, we contribute to the MNEs diversification literature on the link between integrated products-countries diversification and firm performance. While this study focused on countries, the insights can be extended to regions sharing similar demographics. The information on the derived global diversity preferences or strategic inclinations impacts not only the entity itself, but also other stakeholders in the affected geographical regions and market sectors, with societal implications for sizable populations. As the MNEs’ inclinations become more evident, the consistent or readjusted expectations can guide actions of the affected ecosystems comprising of a range of other firms, policy makers, government bodies, NGOs, community groups and other stakeholders.
2. Literature Review
Firms that extended their operations outside their home country have been referred to as multinationals or multinational enterprises (MNEs), multinational corporations (MNCs), multinational firms or multinational companies [
3]. Multinationals have further been classified as multidomestic, global and transnational depending on their respective organization designs and particularly centralized or decentralized management, local responsiveness and interdependence [
4]. MNEs have been distinguished by their levels of globalization in terms of sales volumes in home regions such as NAFTA, EU and Asia [
5]. While global- or group-level product-country diversification strategies can be expected to vary between the types of MNEs, this study intentionally does not differentiate amongst them. For the objective of investigating the relationship between current product-country diversification structure of firms with historic deals that contributed to them, we focus on the relative differences in these broad diversification metrics for revealing strategy insights. We refer to all MNE types as MNEs. (Although MNEs are not conventionally defined in this manner, the highest global deal-making firms are typically MNEs, which we validate for the firms selected for profiling in this study. For more precise insights on these MNE types’ agnostic relationship, we selected the pharma industry that is known to have grown primarily through deals.) We selected the pharma industry that is known to have grown primarily through deals [
1]. Our literature review section is divided into two parts—a survey of relevant MNE diversification strategy literature, and a review of the landscape of the global pharma industry from which we derive the insights.
Diversification strategy has been defined as “range and relatedness of the products sold” [
6], which covers only the product (range) dimension in our study. The geographic or countries spread diversity metric in our study has been discussed in reference to the different but related context of the degree of internationalization, defined as the “firm’s relative emphasis on foreign versus domestic operations” [
6]. Our countries’ diversity metrics are a relative breadth measure of a number of countries of operation or of deal making, closer to the broader definition of “greater presence in international locations” [
7]. Globalization or the integration of MNEs’ worldwide activities under a single strategy can involve both the diversity metrics in our study [
7].
The MNE diversification literature encompassing these concepts and dimensions primarily contains correlations with performance and risk. This literature can be divided into three categories:
- (i)
Product diversification-related—Product diversity has been studied in general [
8] and differentiated by related and unrelated products [
9,
10,
11,
12] in relation to firm financial and risk performance and competitiveness [
13,
14].
- (ii)
Country diversification related—Countries’ diversification in terms of geographic scale and scope [
15], target or host country characteristics [
16,
17] and distance [
18,
19] has been linked with financial and risk performance [
9,
20,
21,
22] and reputation [
23], with dependencies such as firm size [
24] in several studies.
- (iii)
Integrated products and countries’ diversification-related—Studies that have linked firm performance with both product and country diversification have investigated the dimensions of degree of products diversification [
25], reasons for diversification [
5,
26], profitability [
27], high financial return–low risk performance strategies [
11] and the complexity of managing globally dispersed operations and the higher costs of corporate governance [
9].
Our study uses an integrated approach for products and countries’ diversification, contributing to the literature category (iii). The current literature includes multiple theories and views with their respective merits; some of the main threads are summarized here. The sustainable long-term performance of MNEs has been attributed to the ability of building dynamic capabilities and simultaneously engaging in explore-and-exploit activities for long-term competitive advantage [
28]. The Bain industrial organization theory, explaining the causal effect of structure-conduct-performance (SCP) using the financial metrics of profitability and market share for performance [
29], has been widely debated for its focus on the extension of monopoly or capital barriers to entry to ensure longer-term performance. This theory was also questioned due to bi-directionality that undermines its causality implication [
30]. A resource-based view, also at odds with this theory, advocates that diversification and vertical integration of unique assets results in better longer-term performance [
29]. A study on Korean construction multinationals that considered current ratio and debt ratio as long-term financial metrics of performance reported mixed results and ultimately proposed that in order to match long term strategy for financial sustainability, overseas construction markets should be treated as independent markets and not an alternative to the domestic market [
31]. Several emerging markets studies focus on facets that are less significant for the global incumbents in this study. Related to integrated product and international diversification, an empirical study found first that US multinationals that are more internationally diversified performed no better than ones less diversified; second, that product and international diversification were inversely related with dependencies on industry type, market opportunities and leadership philosophies; and third, that product and international diversification were not profitable by themselves, though interaction between them could lead to performance gains [
32]. A later study challenged the methods and results of this study [
33].
With a lack of consensus in the literature on the performance link and the complexity in empirical determination of precise influencing factors, in this study we assume that cumulatively high enough performance with low enough risk was achieved over a longer term through the choices made by “successful” MNEs in the dataset. We assign the “successful” tag to the MNEs selected as they have long histories and exist profitably today, having successfully navigated myriad business challenges over time. Their cumulative deal-making history, consequently, can be considered as an enabler to successful performance, particularly for the pharma MNEs that we selected for this study, where deals are known to be a primary driver of their growth and evolution. Over the longer-term, if certain competing firms in Big Pharma achieved acceptable and even attractive financial returns, then we considered their cumulative deal-making strategies to be “good enough” within the constraints of the available data. Several performance measures described in the theories can be achieved through deals. The causal factors from deals between the peer groups for achieving the “better than survival” performance can include a range of capabilities enhancements vertically and/or horizontally, i.e., product diversification, and selective market share capture, i.e., new geographies. Deals analysis has been applied for quantifying relationships between representative firms within their ecosystem [
34], formation dynamics of the emerging electric vehicles business ecosystems [
35] and ambidextrous Internet of Things (IoT)-linked firm strategy insights [
36]. Utilizing historic deal profiles of pharma MNEs for insights into successful longer-term integrated product-country diversification strategies is the novel approach we present. We were motivated to first present a new empirical basis for macro- and longer-term deals-driven strategies to motivate fresh discourse built on the foundation of previous work. Our study is focused on the potential benefits of combined product and geographies diversification that should be of value to global or MNE group-level strategists.
To interpret and validate our results, we explored the landscape of the global pharma industry to understand the deal-making inclinations, identify major pharma MNEs and their businesses or products that are central to our investigation. Pharma MNEs are characterized by broad product portfolios and mature global supply chains [
37]. Many pharma MNEs also have long histories of evolution, primarily from M & A [
1] with high revenues supported by economies of scale and drug pipelines [
38]. A number of pharma companies generate annual revenue exceeding USD 26 billion [
39] and appear in the Fortune Global 500 [
37]. The largest pharma firms, also referred to as “Big Pharma”, operate through a large number of subsidiaries and attract a large partner ecosystem. The global pharma market was valued in 2020 at 1.27 trillion US dollars, which was a significant increase from 2001 when it was valued at just 390 billion US dollars [
40]. The major 10 pharma firms by prescriptions sales in 2020 were Roche (Switzerland), Novartis (Switzerland), AbbVie (USA), Johnson & Johnson (USA), Bristol Myers Squibb (USA), Merck & Co. (USA), Sanofi (France), Pfizer (USA), GlaxoSmithKline (UK) and Takeda (Japan). MNEs in pharma are science-based and knowledge-intensive [
38]. Consolidation and megadeals are their primary instruments for new drug pipelines. R & D budgets tend to be large and, in turn, result in differentiated and patented products for sustainable competitive advantage over purely indigenous firms in foreign locations. The pharma industry spends 20% or more of its sales revenue on R & D projects to ensure a steady pipeline for sales of new branded drugs and to offset expiry of product patent protections. Patent expiry can lead to significant revenue erosion due to competition from generic drug manufacturers. Pharma MNEs invest simultaneously in maintaining their product pipelines with new patents and partnering for generics and biosimilar manufacture on expiring patents. The nature of deals can range from acquiring direct competitors, investing in biotech acquisitions [
41], cooperation for developing drugs (particularly high-impact biologicals), enhancing R & D productivity [
42,
43], cultivating their own capability for generics [
44] and biosimilar manufacture and other strategies for hedging risks through portfolio optimization [
45,
46]. In addition to focusing on revenue, pharma MNEs engage in strategies that leverage cost synergies to maintain high margins through the outsourcing of capital-intensive activities such as clinical trials and the manufacture of clinical trial material. The opportunity of outsourcing the entire drug development cycle to CROs and CDMOs is driving consolidation amongst them and creating full-service strategic global suppliers. The structure of the pharma industry has been characterized by tiers similar to the suppliers network in the automotive industry [
47]. Tier 1 suppliers provide materials and services to Big Pharma that directly impact the drug development process in areas such as combinational chemistry, biotech, high throughput screening instrumentation and contract research. Tier 2 suppliers provide reagents, instruments and integrated systems, animals, etc., that enable the science to develop new drugs. Pharma products have also been classified by type such as oral, topical, modified release, novel, etc., and by the targeted organ system such as digestive system, cardiovascular system, nervous system, etc. Several major pharma companies are engaged with both pharmaceuticals and biopharmaceuticals, the difference being that the latter are manufactured in living organisms rather than a purely chemical synthesis.
In summary, we contribute to literature on MNEs’ integrated product-countries diversification strategy by utilizing insights derived from the deal histories of presently operating major pharma MNEs. This guidance can benefit MNEs in pharma and other highly regulated industries in strategy formulation and validation. A more precise understanding of diversification inclinations of major MNEs offers the opportunity for regional policy makers to better anticipate industry directions and the associated regional impact.
3. Data and Method
3.1. Data
The deal data for this work were sourced from the Zephyr database, one of the solutions offered by Bureau van Dijk Electronic Publishing (BvDEP) for corporate finance research [
48]. The deal types covered are publicly declared corporate M & As, initial public offerings (IPO), private equity, venture capital deals and formal collaborations such as joint ventures. The deal information is sourced from advisor submissions, company press releases, various electronic publications of business news, stock exchanges and company websites. We extracted deal data for firms classified under US SIC Code 2834, representing the pharmaceutical (pharma) industry. The major pharma firms analyzed in this study have significant operations and interactions in the United States, and hence the US SIC classification allowed comprehensive coverage. The relational links of firms with their respective GUOs that were used to group deal-making subsidiaries from the Zephyr database were sourced from the Orbis database. The Orbis database is also one of the solutions offered by BvDEP and contains information on close to 400 million companies and entities globally, with 41 million of these having detailed financial information [
49].
On the date of retrieval of 19 August 2020, the Zephyr database contained 34,715 pharma companies that engaged in deals with at least one of the incumbent companies classified under US SIC classification Code 2834, covering the period from 27 August 2002. Only deals with status of “completed” and “assumed completed” were considered for the purpose of this study, thereby eliminating deals with the other statuses of “pending”, “rumored” and “withdrawn”. Deal types’ metadata were also available, such as acquisition, IPO, minority share increase, institutional buy-out, management buy-out, capital increase, share buy-back and joint venture. We considered all the available types without differentiation, as they all constitute activity measures of interest to this study. For deals referring to transactions involving a single company, such as IPOs, capital increase and minority stake increase, the concerned firm was considered as both the acquirer and target. Of the 34,715 deals, 22,763 (66%) deals were completed or assumed completed between 7231 firms. The Orbis data on GUOs and their subsidiaries were sourced on 11 November 2020 and applied on Zephyr-identified deal-making firms.
3.2. Method
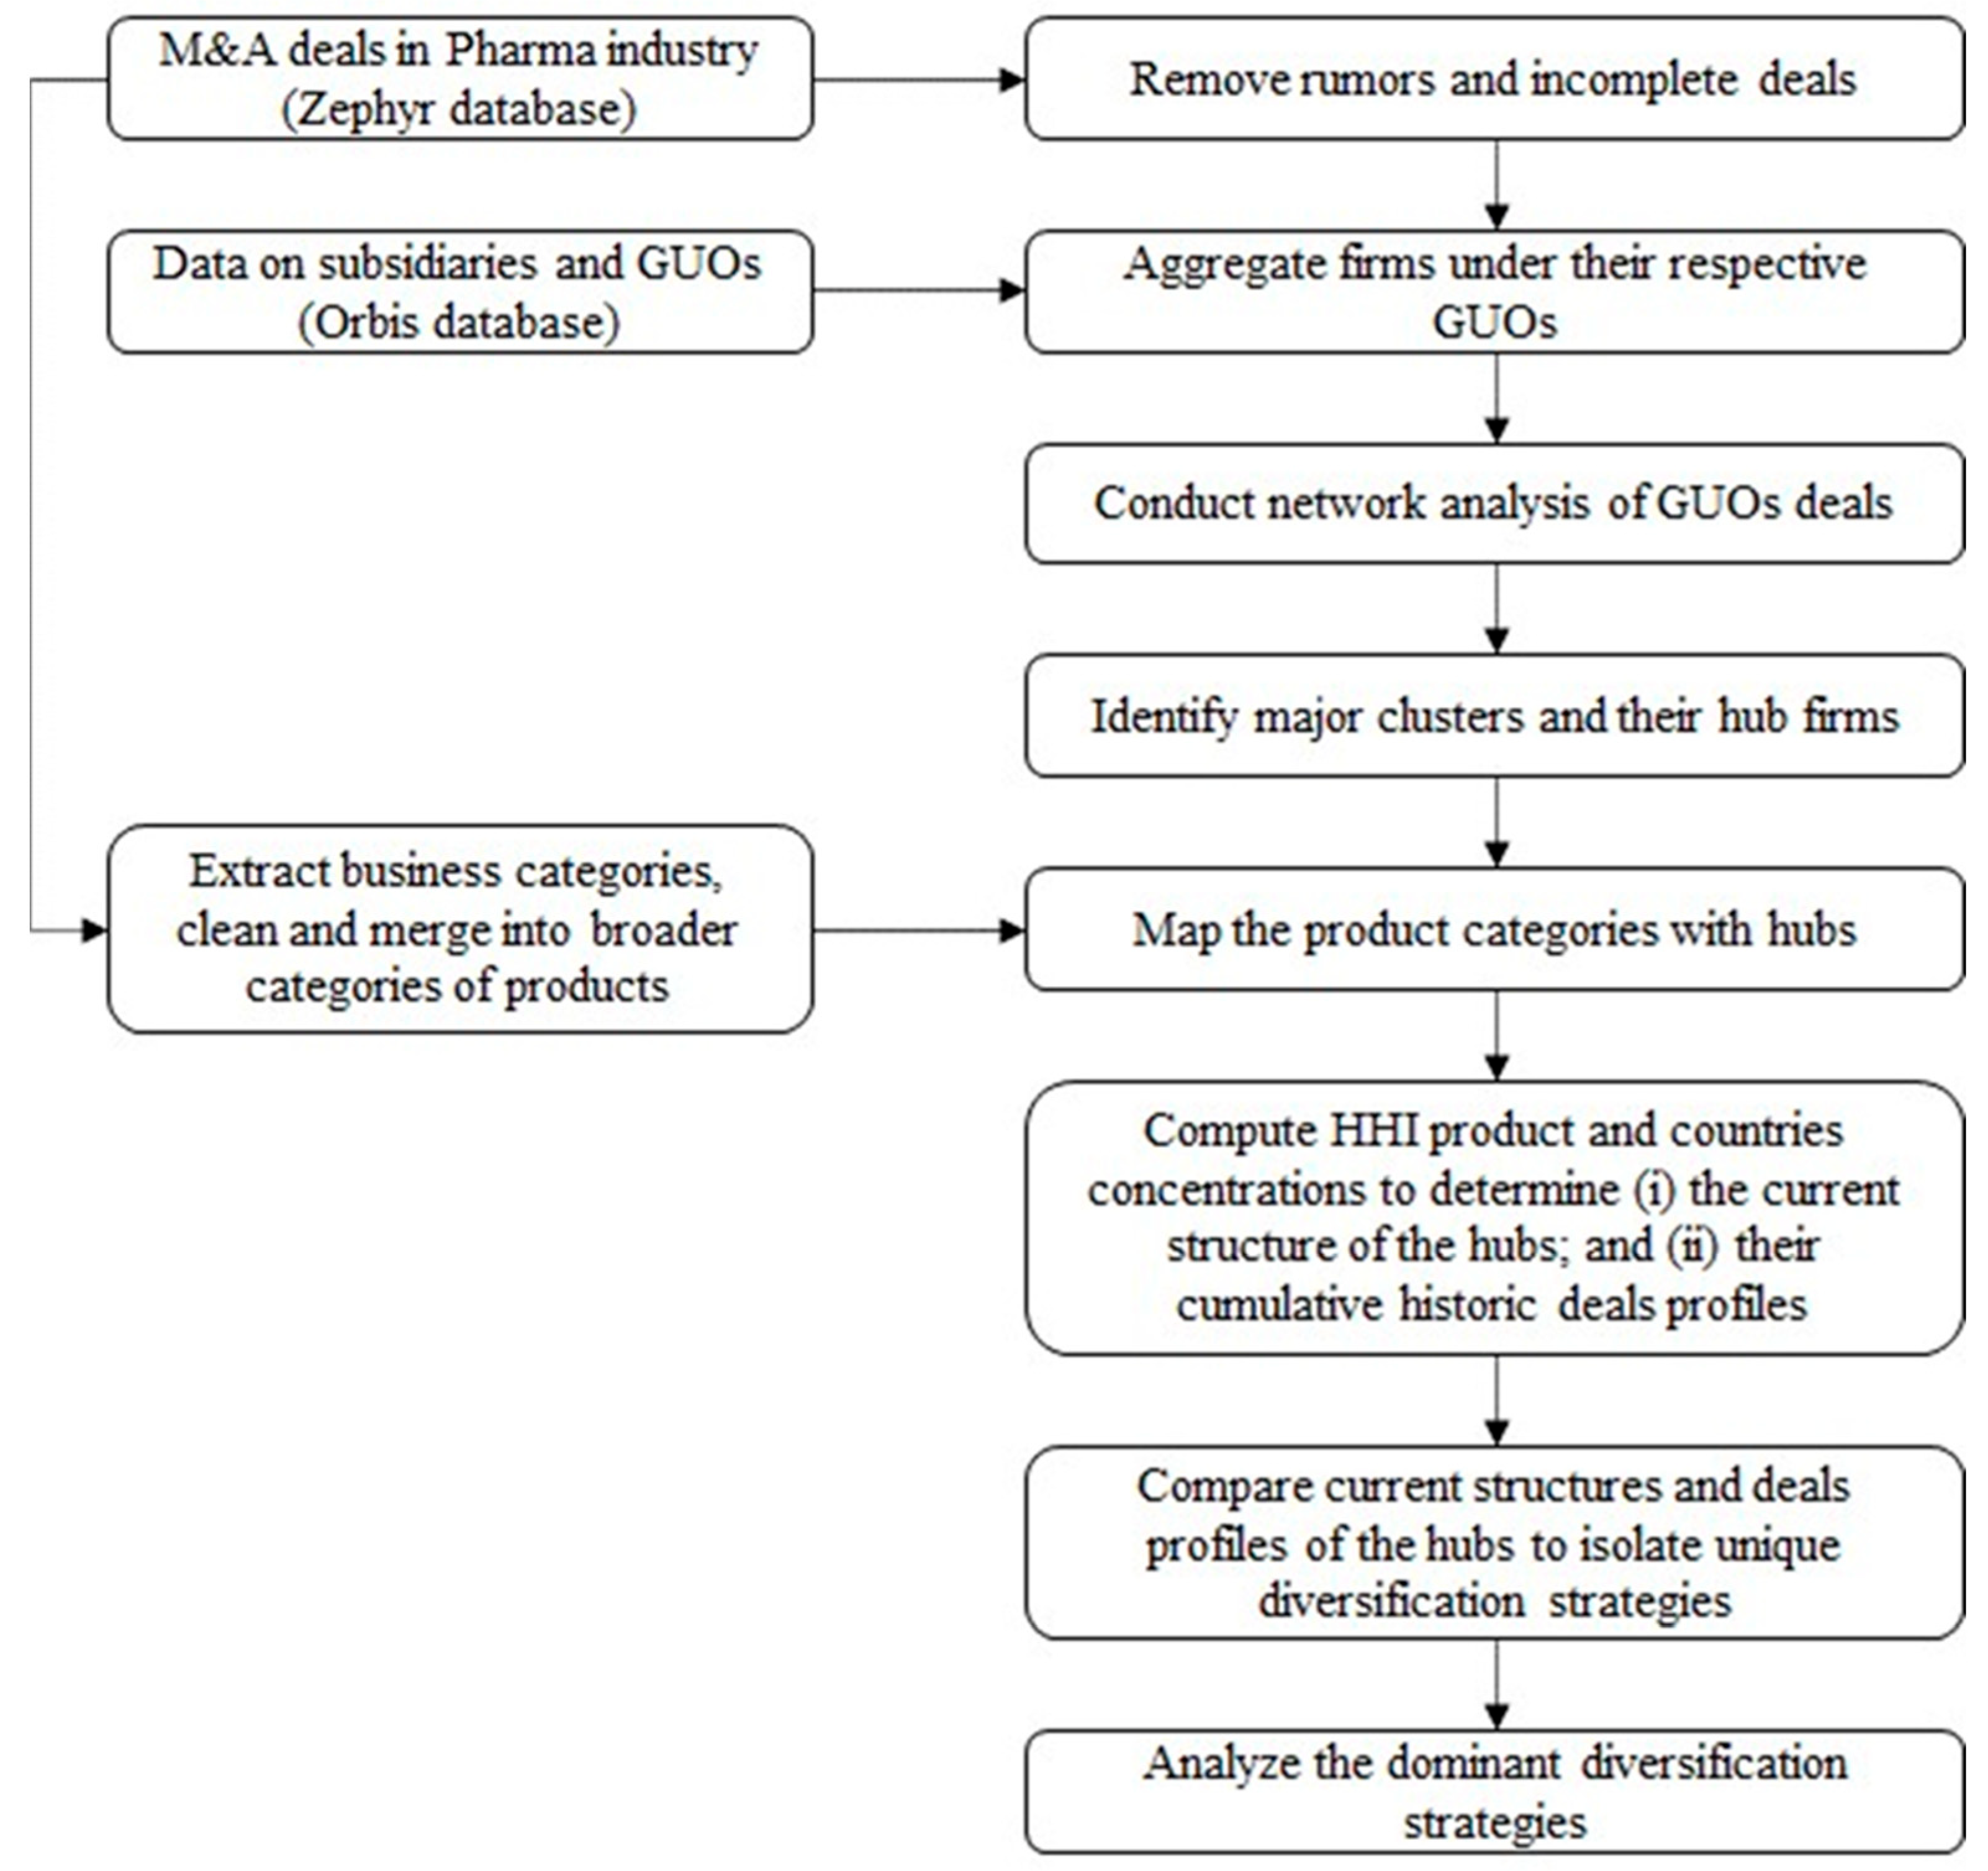
The methodology used in this work is schematically illustrated in
Figure 1. After extracting and cleansing the data, the deals network was created and clustering of the network was performed. Following this, major clusters and hub firms as GUOs were identified, and their country and product concentrations were computed and compared in a normalized manner. Representing acquirers and targets by nodes and representing deals as lines (edges) between these nodes, network analysis was conducted on the 22,763 deals among 7231 firms. The deals network was partitioned using the modularity maximization Louvain algorithm [
50]. Modularity maximization algorithms iteratively attempt to find the best partition of the network through a comparison of the strength of connected nodes within the cluster with the connected nodes outside the cluster. The modularity
Q is defined as follows:
where
is the proportion of edges that connects
and
, while
is the proportion of edges within
. Major clusters based on deal-making activity and degrees (i.e., the number of connected firms) were selected for the analysis.
Thirty (30) GUOs with degrees greater than 10 were identified as outliers. These GUOs contained 1571 firms that conducted 2970 deals and had subsidiaries outside their home country thereby qualifying them as MNEs [
51]. In addition, the hub firms in each of these major clusters were significantly larger in degree than any other firms in their respective cluster, thereby highlighting their dominance. For a group-level analysis, all the deal-making firms and their subsidiaries (where data were available) were grouped under their respective GUOs as single units or nodes. The GUOs were next quantified in terms of geographical spread (i.e., country diversity) and product diversity.
Diversity in products and services was measured by the business offerings as reported in Zephyr. The 2068 Zephyr business categories for the deal-making firms were found to contain categories that were very similar, duplications, unclassifiable and erroneous entries, as well as non-pharma and non-applicable entries. A manual data cleaning process was conducted, merging business categories with close domain similarity while retaining groupings that highlighted significant occurrences for the concerned deals to arrive at 33 business offerings. We refer to these consolidated offerings listed in
Supplementary Materials Table S1 as product categories, with the term “product” including both products and services. The quantification of countries’ diversity was based on the country locations of the GUO’s subsidiaries and targets of the deals. Countries of operation for the deal-making firms that were subsidiaries, external targets or acquirers were sourced from the Zephyr database.
For each GUO, the diversity metrics of product and countries were then normalized using the
HHI, which is a statistical measure of concentration used by antitrust regulators for initial analysis of market concentration levels resulting from mergers to determine monopolistic potential [
52]. The
HHI has been used for the determination of the concentration levels of certain parameters in manufacturing and banking [
53]. An
HHI-type metric has been used to assess product diversity by additionally taking into account the number of segments in which the firm operates and the relative importance of each segment in terms of revenue. The inverse of the
HHI or entropy measure has been applied for determining the correlation between product diversification, including for related and unrelated products with performance [
54].
While the
HHI is an established normalization method, to the best of our knowledge our study is the first use of the
HHI for investigating the integrated relationship between country concentration and products concentration. The
HHI is calculated as the sum of squares of shares of firms as below:
where
is the share of firm
i among
n firms in a given industry. The
HHI has a theoretical range from 0 to 1, from a value close to 0 when market is composed of an infinite number of firms, each with an infinitesimal share to 1 for a complete monopoly [
55].
We computed the country concentration of each GUO, with being the proportion of a country that a GUO is present in through its subsidiaries or operation of external firms with which it made deals. The country concentration was highest at an HHI of 1 (i.e., if the GUO operated in a single country) and the diversity was highest at an HHI of 0 (i.e., the GUO has operations evenly distributed over multiple countries). Product concentration was also computed in a similar manner as per Equation (2), where was the proportion of a product category reported by the subsidiaries of the GUO or external firms with which it made deals. Product category concentration was highest at an HHI of 1 (i.e., the GUO operated with a single product) and the diversity was highest at an HHI of 0 (i.e., the GUO’s products were evenly distributed over multiple categories). The two HHI values of products and countries for the current operations of the subsidiaries of the GUOs were termed “current structure”. Similarly, two diversity metrics were computed for the external firms with which the GUOs made deals, i.e., the historic cumulative deals, and were termed “deal profiles”.
We searched for GUOs having similar patterns in terms of distance and direction in the current and historic deal profiles by computing a correlation matrix on the
HHI of their countries and business categories. This matrix was then normalized and transformed into a distance matrix that serves as input for a dendrogram from where clusters were extracted using Ward’s minimum variance method [
56]. GUOs with similar tendencies were grouped and analyzed for insights.
4. Results
The deals network analysis of firms in the pharma industry revealed 30 major clusters and their respective hubs as GUOs. The network is illustrated in
Supplementary Materials Figure S1 and the characteristics of the GUO hubs are summarized in
Supplementary Materials Table S2. Two of the GUOs were renamed to properly reflect their associated firms. Six of the thirty cluster hubs represented fringe cases as they were found to be disconnected from the interactions network with the other 24 firms. These fringe cases also operated directly in less than five countries, making them rank low in “multinationalism”. These six firms were therefore screened out from this study. The profiles of the remaining 24 hub firms were analyzed for insights on their respective diversity metrics.
The current diversity metrics of the 24 GUOs were obtained from their respective subsidiaries’ countries of operation and the associated products. These diversity values, summarized in
Supplementary Materials Tables S3 and S4, were normalized as
HHI values and plotted in
Supplementary Materials Figure S2. Most of the GUOs were present in the lower half, highlighting more diversified product offerings. More of the GUOs tended to be present slightly left from the centre, suggesting a higher spread across countries. The deal diversity profiles of the 24 GUOs were obtained from the cumulative record of their historic deals. The diversity values of the countries and products of the targets and acquirers listed in
Supplementary Materials Tables S5 and S6 were also normalized as
HHI values and plotted in
Supplementary Materials Figure S3. When compared on the same scale as in
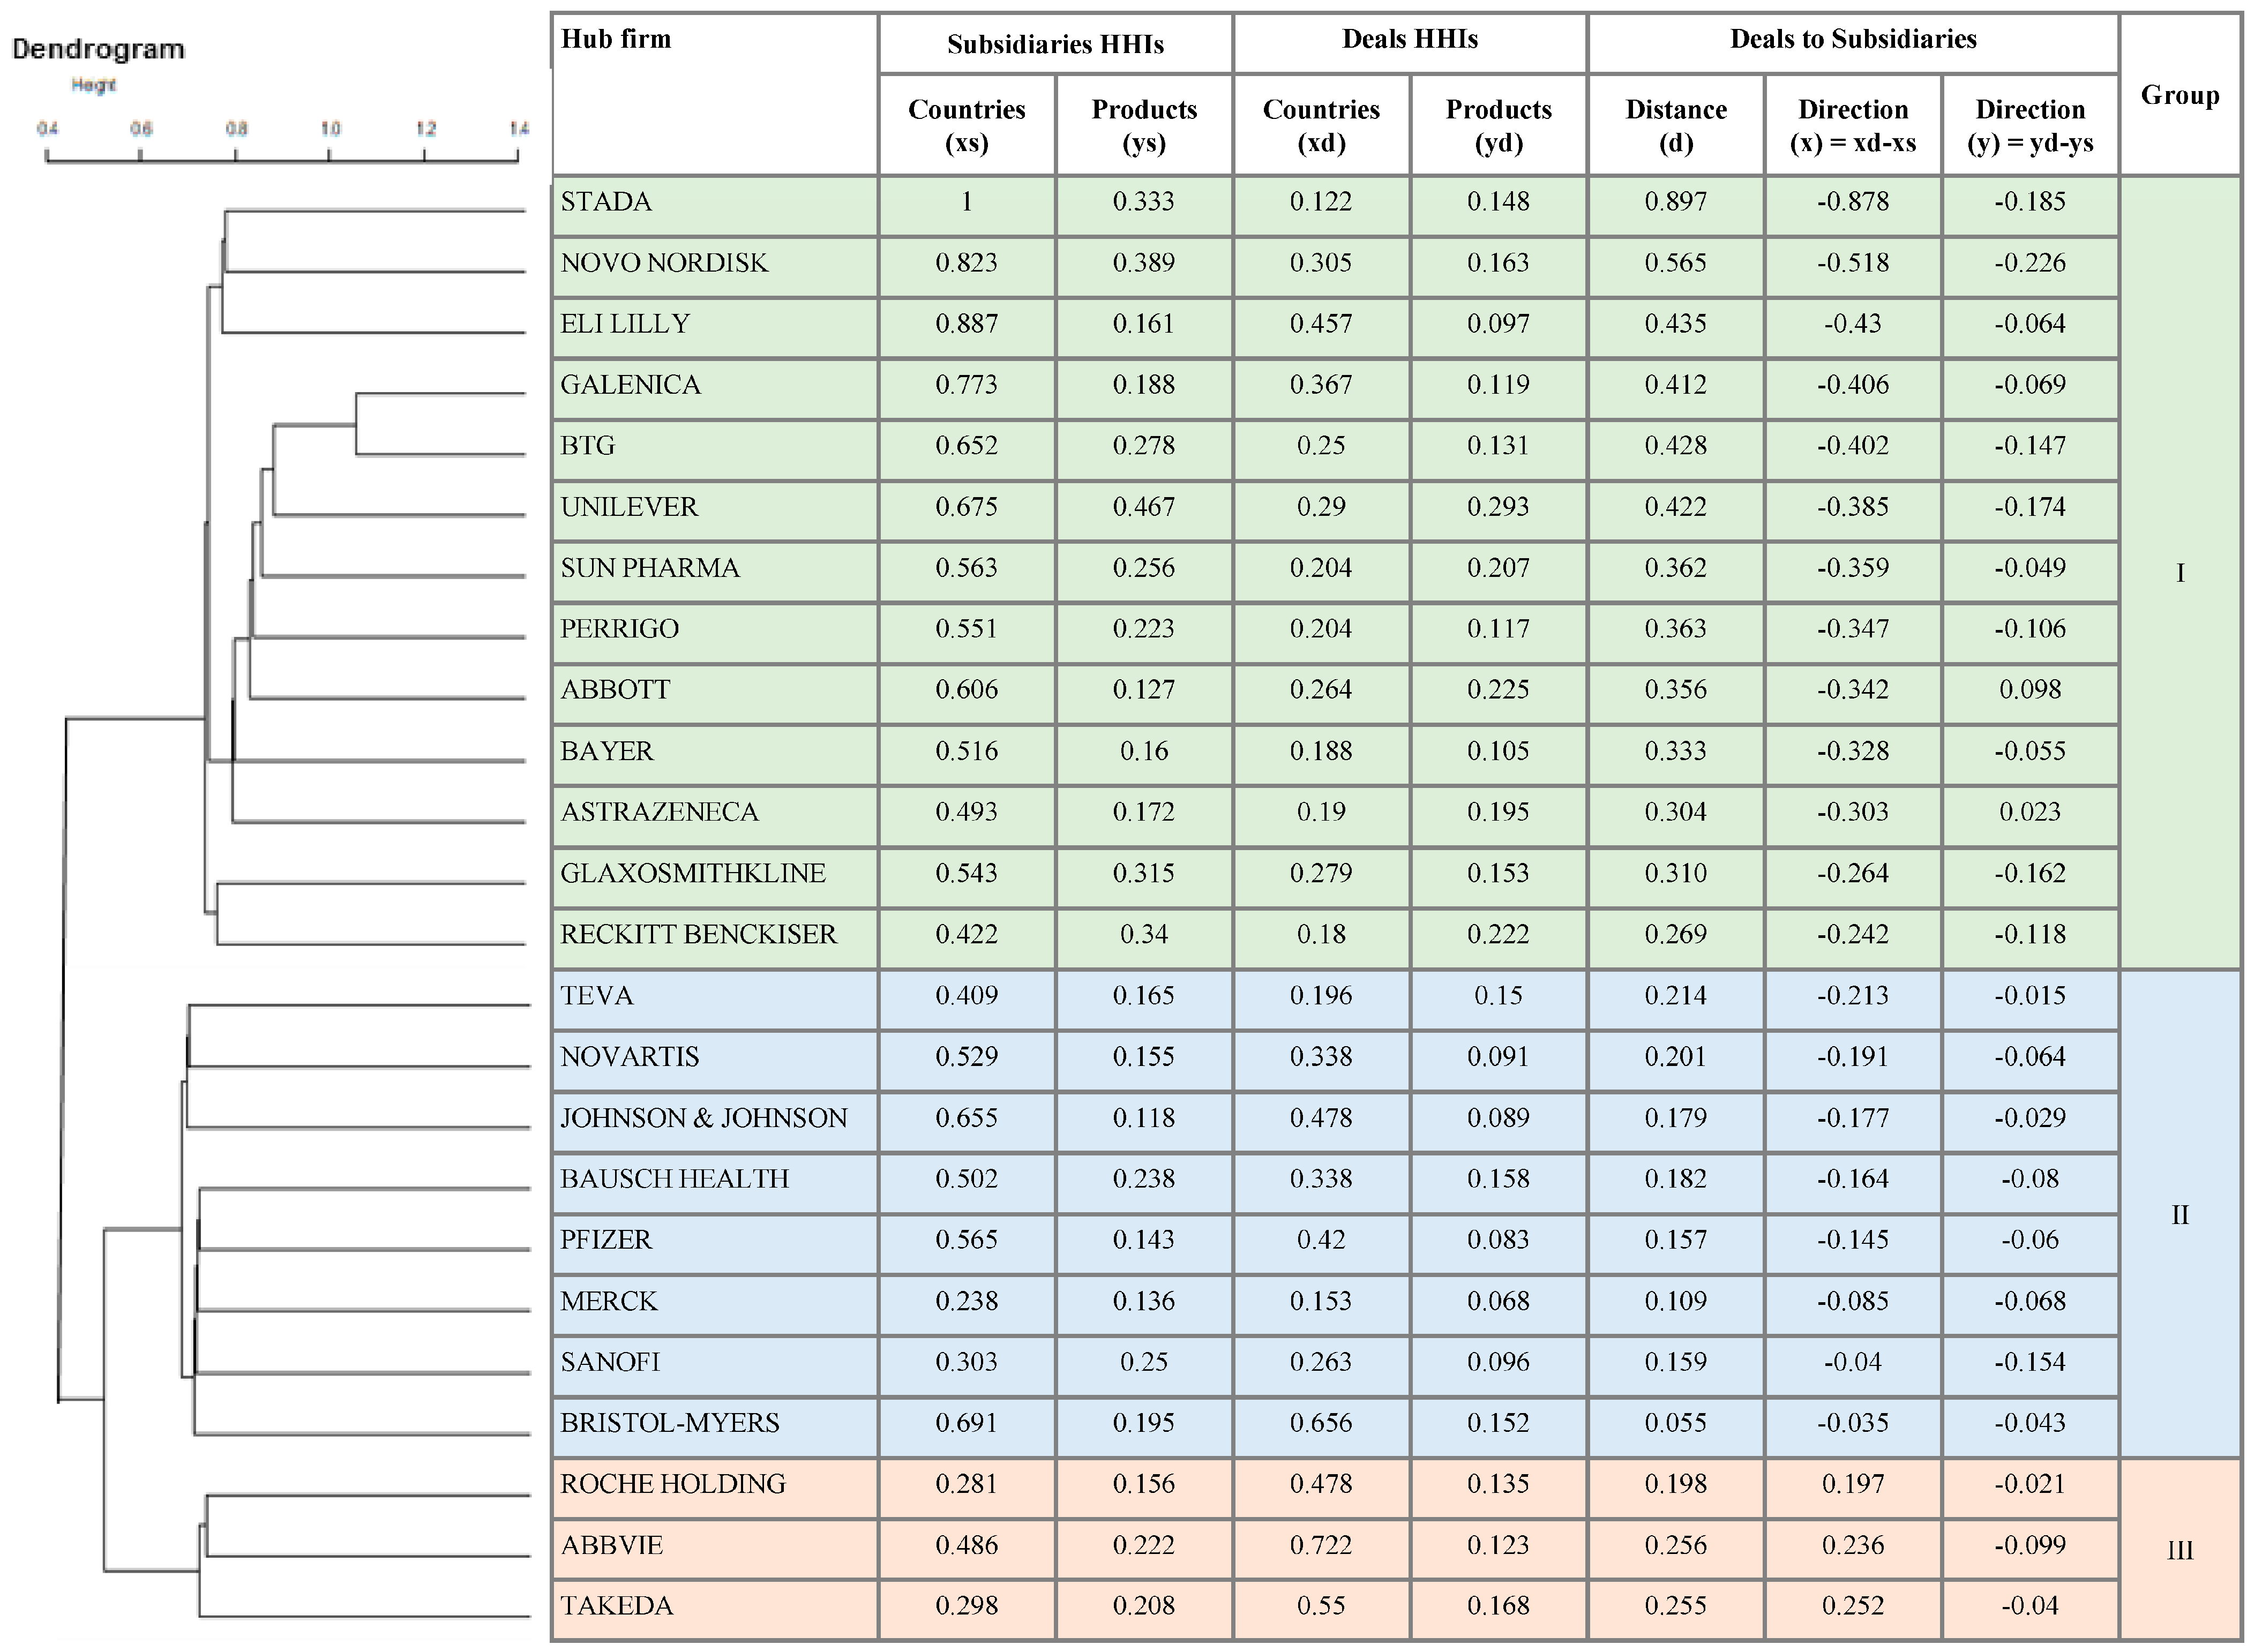
Supplementary Materials Figure S2, the deals conducted were also in the lower half, highlighting more diversified product offerings, though the differences are not easily perceptible visually. On the countries spread, a similar observation can be made. Numerical values of the distance and directional relationships between the current structure and deal profiles enabled the grouping of similar inclinations based on minimum variances. As illustrated in the combined dendrogram and tabular representation in
Figure 2, three major groups of GUOs with distinct inclinations were revealed. Groups I and II conducted deals that were significantly more diversified than their subsidiaries’ structures, but at a different pace for the time period of this study. Diversity in both product and country concentrations were more pronounced in the deal-making history of Group I compared to Group II. In contrast, Group III GUOs were diversified as subsidiaries while their deals were more concentrated and mostly in specific countries. We analyzed the GUOs in each of these groups to derive deeper insights on these relationships.
5. Group I: Niche Product Offerings in Specific Countries
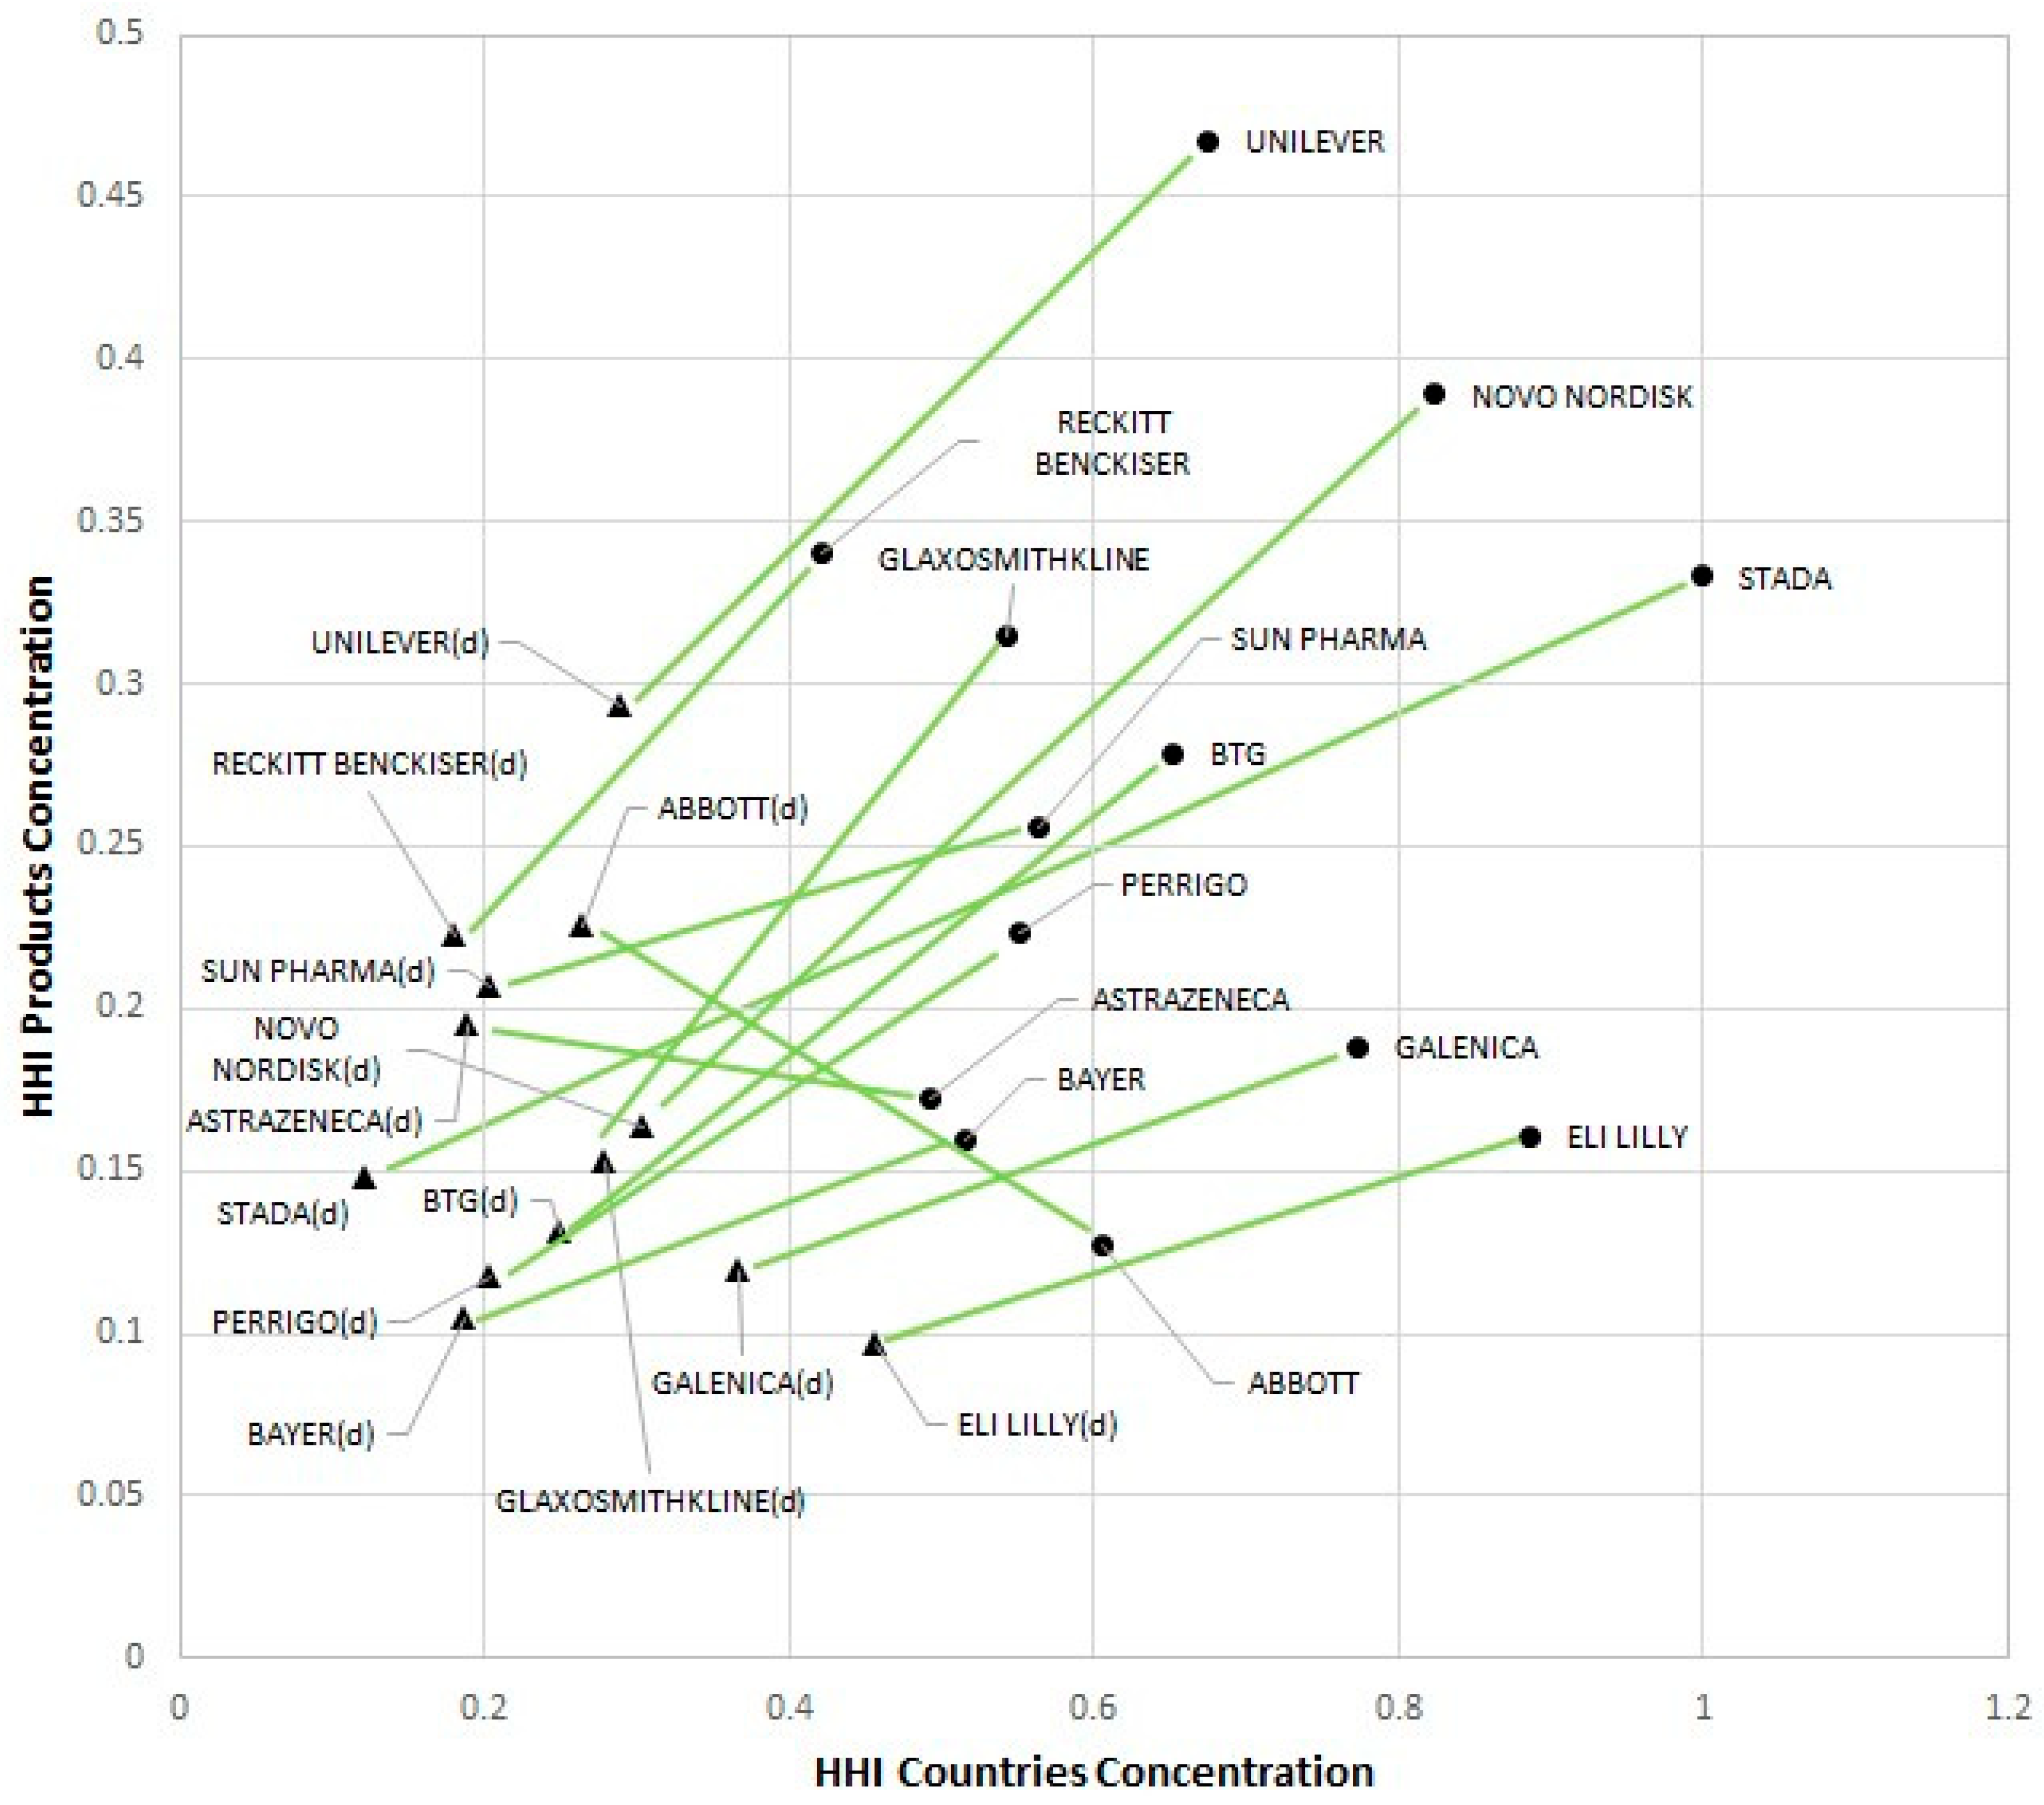
Group I GUOs goal of enhancing their portfolio of current products with presence in a few selected countries was achieved through deals in diverse products in many countries.
Figure 3 illustrates this pronounced directional inclination, which is indicative of the net effect of shedding businesses in non-core products and regions. This group included most of the companies examined in this study, and consisted of GlaxoSmithKline, Reckitt Benckiser, Sun Pharmaceutical Industries Limited (Sun Pharma), Perrigo, Galenica, Unilever, BTG, Eli Lilly and Company, STADA Arzneimittel AG (Stada), Novo Nordisk Fonden (Nova Nordisk), Bayer, AstraZeneca and Abbott Laboratories (Abbott). The directional inclinations of AstraZeneca and Abbott deviated the most from the group and could be classified as a sub-group. With some overlaps, the GUOs in this group represented certain distinct product categories, namely, diversified prescription pharmaceuticals, generics and over-the-counter (OTC), consumer healthcare products, specialized pharmaceuticals (such as diabetes, rescue medicines and psychiatric), formulations and active pharmaceutical ingredients (APIs), regional pharmacies operations and associated distribution services, and healthcare services (such as on-site diagnostics, medical devices and animal health). In their journeys to specialize in their offerings in certain countries, these GUOs acquired and shed capabilities for the net effect that is represented.
Brief profiles of current structures and deals history of some Group I GUOs as examples are summarized below:
- (i)
Perrigo develops, manufactures and distributes OTC and prescription pharmaceuticals, APIs and nutritional products [
57]. Since 2002, Perrigo’s deals have aimed to expand their current product portfolio with additional speciality and generic pharmaceutical products; nutritional products; paediatric electrolytes; enemas; feminine hygiene products; prescription pharmaceuticals including antibiotics, hormonal and ophthalmic products; infant formula and baby foods [
58]. Perrigo exited some of their consumer healthcare businesses and entered diabetes care and animal health products.
- (ii)
Stada specializes in the production of generics including specialty pharmaceuticals, biosimilars and non-prescription consumer healthcare products [
59]. Stada’s deal history from 2002 onwards has consisted primarily of the acquisitions of European generics manufacturers and Russian Nizhpharm OJSC. Stada also engaged in partnerships in Brazil and China, and divested US businesses. They also strengthened their consumer healthcare offerings through the acquisition of a manufacturer of vitamins, minerals and food supplements.
- (iii)
Novo Nordisk Fonden is a Danish foundation that provides grants for public research through its fully owned subsidiary, Novo Nordisk Holdings. The foundation owns stakes in several firms [
60] that are in the business of building health care solutions, treating diseases and promoting sustainability. The largest firm in the foundation’s corporate portfolio, Novo Nordisk AS manufactures products related to diabetes and other serious chronic conditions including obesity, haemophilia, human growth hormone disorders and hormone replacement therapy [
61]. Novo Nordisk is highly export-oriented, with 99% of sales outside Denmark. A major share of the deals was related to the acquisition of diabetes care R & D and manufacturing capabilities, with expansive geographical spread. Other deals were related to critical care, cancer, respiratory diseases and other disorders treatment.
- (iv)
Galencia is a fully-integrated healthcare provider that operates the largest network of pharmacies in Switzerland and provides on-site health services and tests for customers, as well as pre-wholesale and wholesale distribution services in the Swiss healthcare market [
62,
63]. Galenica’s deals from 2002 onwards focused on these segments of development through manufacture, logistics and retail. Their deals included adding the capability of the direct dispatch of prescription medicines, monitoring of medications to in-home care, expansion of on-site health services, customized packaging of medicines and the acquisition of other pharmacies. The location focus of subsidiaries and deals were in a few select EU countries and USA.
6. Group II: Specialized but Less Niche Product Offerings in Specific Countries
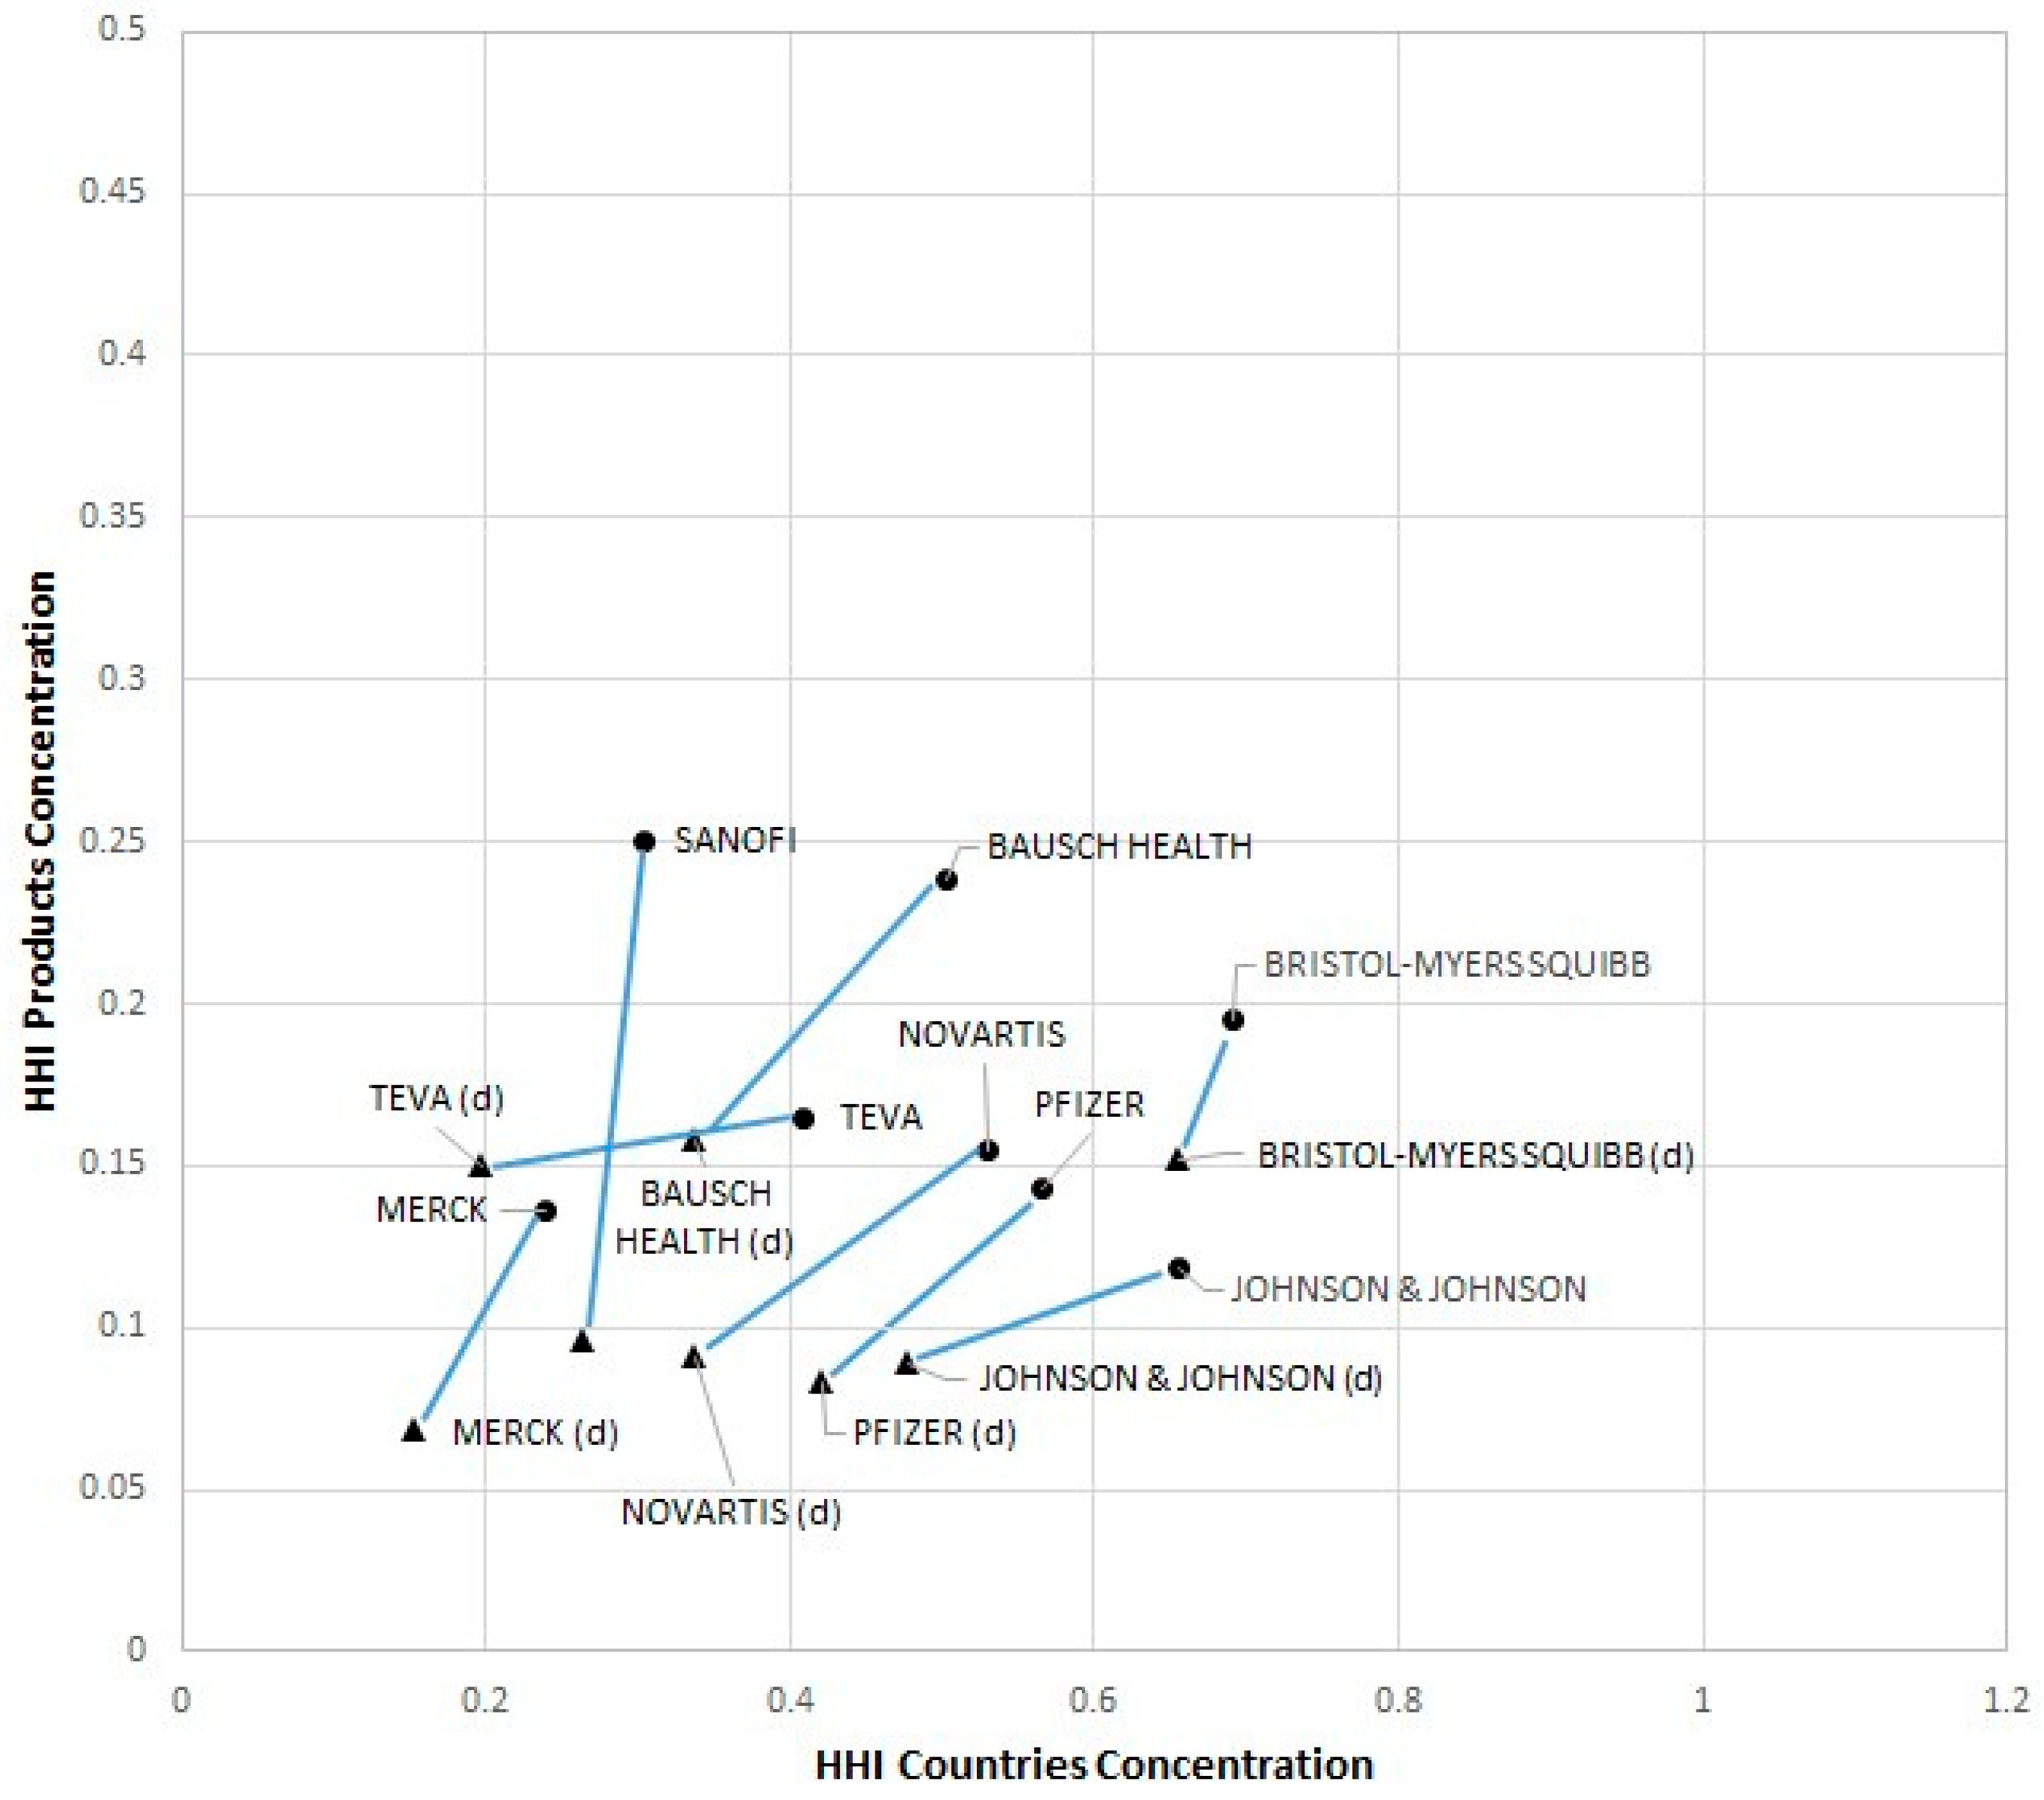
Group II GUOs focused on building higher presences in certain countries with specific products, but to a lesser degree relative to Group I hubs as represented in
Figure 4. This group consisted of Pfizer Inc. (Pfizer), Bausch Health Companies Inc. (Bausch Health), Johnson & Johnson, Novartis AG (Novartis), Teva Pharmaceutical Industries Ltd. (Teva), Bristol-Myers Squibb Co. (Bristol-Myers, BMS), Merck & Co. Inc. (Merck) and Sanofi S.A. (Sanofi). The GUOs in this group were mostly Big Pharma firms and large diversified pharmaceutical developers and manufacturers, but also included some that are specialized.
Examples of the GUOs in this group and their journey are described below:
- (i)
Bristol-Myers Squibb or BMS develops and manufactures prescription pharmaceuticals and biologics for serious diseases including cancer, HIV/AIDS, cardiovascular disease, diabetes, hepatitis, rheumatoid arthritis and psychiatric disorders. Between 2007 to 2010, BMS conducted major restructuring to transform from a diversified pharmaceutical company to a speciality biopharma company [
64]. This refocusing strategy included acquisitions for biopharma capability and the shedding of businesses such as nutrition products and other consumer healthcare businesses. The acquisitions focus was both in discrete disease areas such as hepatitis C, cancer, diabetes, cardiovascular, inflammation and fibrosis, as well as major diversified businesses.
- (ii)
Merck or Merck & Co., Inc., a US subsidiary of the Merck Group, focuses on healthcare, life Sciences and electronics [
65]. Through Merck Animal Health, a subsidiary of Merck. They provide a broad range of veterinary medicines and services for the prevention, treatment and control of disease in all major farm and companion animal species. In 2009, Merck acquired the Schering-Plough Corporation, a diversified American pharmaceutical company which added to their drugs portfolio, but mostly within their existing business offerings. Merck made a number of other acquisitions to enhance its biopharma and animal health products portfolio. Overall, it resulted in a marginal increase in countries as they already had a large global presence. Their investments enhanced their existing product portfolio and entry into new disease areas were within the same product categories selected in this study.
- (iii)
Novartis engages in the discovery, development, manufacture and marketing of prescription and generic pharmaceutical products, biosimilars and eye care products. They invest in digital and data platforms, and cell and gene therapy technologies. Post-2002, their strategic inclination has been toward the divestment of certain legacy businesses unrelated to healthcare, such as Gerber baby products and medical nutrition businesses, and the acquisition of biopharma and biosimilars development and manufacturing capabilities [
66]. We observed that Novartis focused on a consistent strategy of enhancing capabilities exclusively in healthcare and shedding unrelated businesses, with lower entries into new products. With some exceptions, the acquisitions specialized in specific disease area health care products and medical devices.
- (iv)
Teva, an example of a specialized member of this group, discovers, develops, manufactures and commercializes generic drugs and, to a lesser extent, active pharmaceutical ingredients and speciality medicines [
67]. In 2020, Teva Pharmaceuticals was globally the second-largest generic drug manufacturer by sales. From 2002 onwards, Teva’s acquisition strategy focused on global generics and biosimilars manufacturers. Teva also acquired some biopharmaceutical developers. Based on the deals, Teva’s strategic inclination was to position itself as a major global supplier of generics.
- (v)
Bausch Health, another specialized member, focusing on products for eye health, gastrointestinal, dermatology, aesthetic devices, generics, dentistry and consumer health. Bausch’s 2002 to 2015 deal history consisted of a number of acquisitions to strengthen their portfolios in generics/OTC drugs and consumer health. The period following 2015 was marked by series of divestments to reduce debt burden and focus on specific products. Bausch’s net cumulative activity considering acquisitions and divestments resulted in fewer entries into new products and countries.
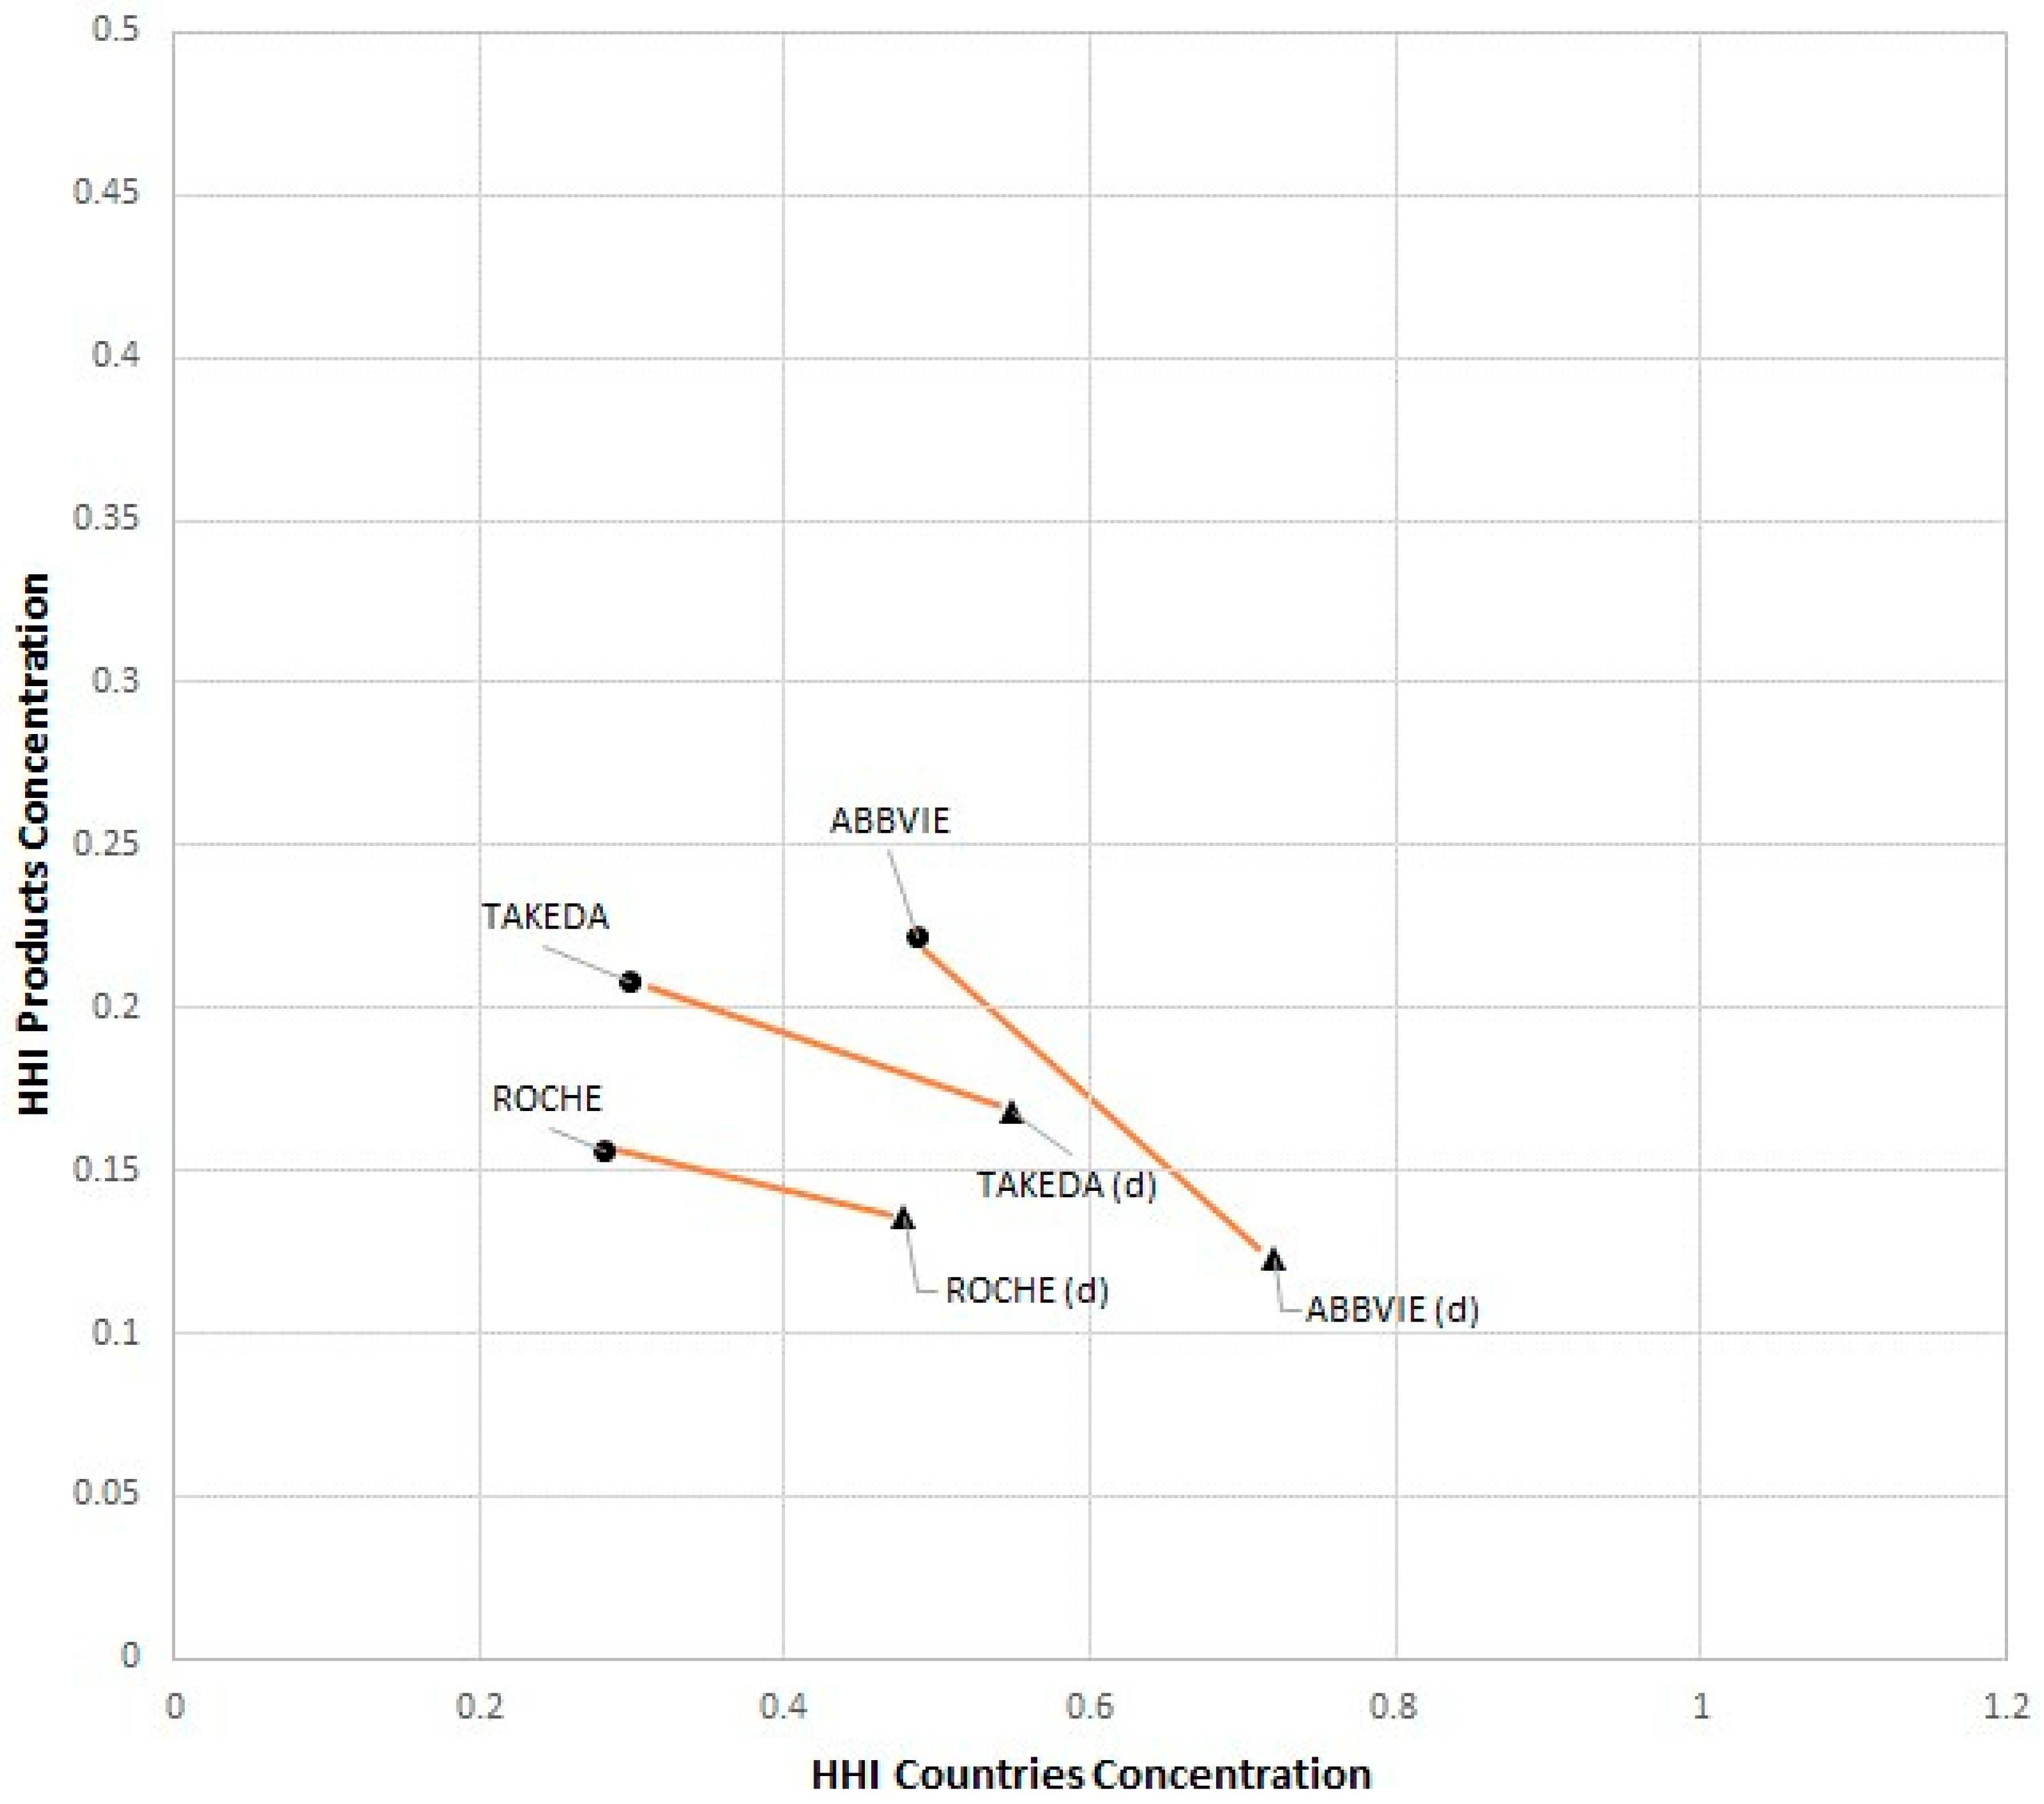
7. Group III: Niche Products for the Global Market
Group III GUOs focused on expanding their presence in more countries while reducing their product offerings to focus on certain core offerings. This group consisted of the hub firms Roche Holding AG (Roche), Takeda Pharmaceutical Company Limited (Takeda) and AbbVie, Inc. (Abbvie).
Figure 5 illustrates the characteristics of this group.
Roche’s reported strategy in the years 2000 to 2006 was to focus the two core businesses of pharmaceuticals and diagnostics towards the future vision of personalized healthcare through this combination. They divested their other product lines including fragrances and flavors, vitamins and fine chemicals. Their acquisitions were aligned with this strategy and were directed at advances in diagnostic techniques and medicines to further strengthen their globally leading biotechnological research capabilities while expanding into new countries.
Takeda focuses on discovery, development, manufacturing, marketing, commercialization, import and export of pharmaceutical drugs [
68]. Takeda’s declared strategy in the years 2001 to 2005 was the divestment of non-pharmaceutical businesses, which was visible in its shedding their products related to animal health, bulk vitamins, urethane chemicals, food, agriculture and life-environment.
AbbVie, which separated from Abbott Laboratories in 2013, is a diversified medical products company with a portfolio that includes medical devices, diagnostic equipment and nutrition products [
69,
70]. AbbVie’s declared long term strategy on its formation was to focus on maintaining a steady pipeline of mid- to late-stage clinical programs to develop therapies with attractive economic value. Aided by acquisitions, AbbVie strengthened this pipeline and increased their number of new molecular entities. For the broad business categories selected in this study, AbbVie’s focus was to be less diversified in product offerings.
Deal profiles are labelled with the suffix (d) and represented by a triangle icon whereas the current structures are represented by a circle icon.
8. Discussion and Managerial Implications
On considering the current structure of major pharma MNEs as the realization of their longer-term strategies enabled by deals, broadly four possible structural goals are uncovered in terms of product and country diversity combinations.
Figure 6 characterizes these possible goals as niche products in selected countries, niche products globally, diverse products globally and diverse products in selected countries in quadrants I to IV, respectively.
The empirical evidence in a relative scale as compared to the diversity range in historic deals suggests that diverse products globally (Quadrant III) and diverse products in selected countries (Quadrant IV) have not been an aspiration for major pharma MNEs. The challenge for Quadrant III is intuitively understandable, as all global markets with pharma products in all their broad categories would require too many core competencies in technology, operations and marketing. Even the ubiquitous Amazon Inc. functions primarily as a global retailer for one of the largest attempted product ranges, but not as a developer and manufacturer of the majority of the products. Quadrant IV’s aspiration for diverse products in selected countries is, however, easier to envision for countries with major domestic markets like China and India. Domestic firms already exist that compete with incumbent foreign MNEs in a number of “fast moving consumer goods” (FMCG) such as electronics, appliances, clothing, etc., online retail, telecommunications, energy, utilities and others. In the pharma industry, several domestically grown firms are rapidly expanding internationally but are not revealed in this study as longer-term active deal makers of the scale of the incumbent majors.
The goals of Quadrant I (niche products in selected countries) and Quadrant II (niche products globally) are validated as aspirations by the current structures of the MNEs. This suggests that over time, MNEs evolved to specialize in certain products as a core competence. Quadrant I MNEs carved out a market position in selected countries, which have ensured more than just their viability over time. These firms are likely to have secured a strong brand image and a unique offering for the specific markets in their target countries, where they are competitive and profitable. MNEs with Quadrant II goals, i.e., niche products globally, also preferred product leadership but for a more generic global market. Such firms signal comfort with consistently high quality standards, the reduced potential of imitability and region-specific pricing to sustain this goal.
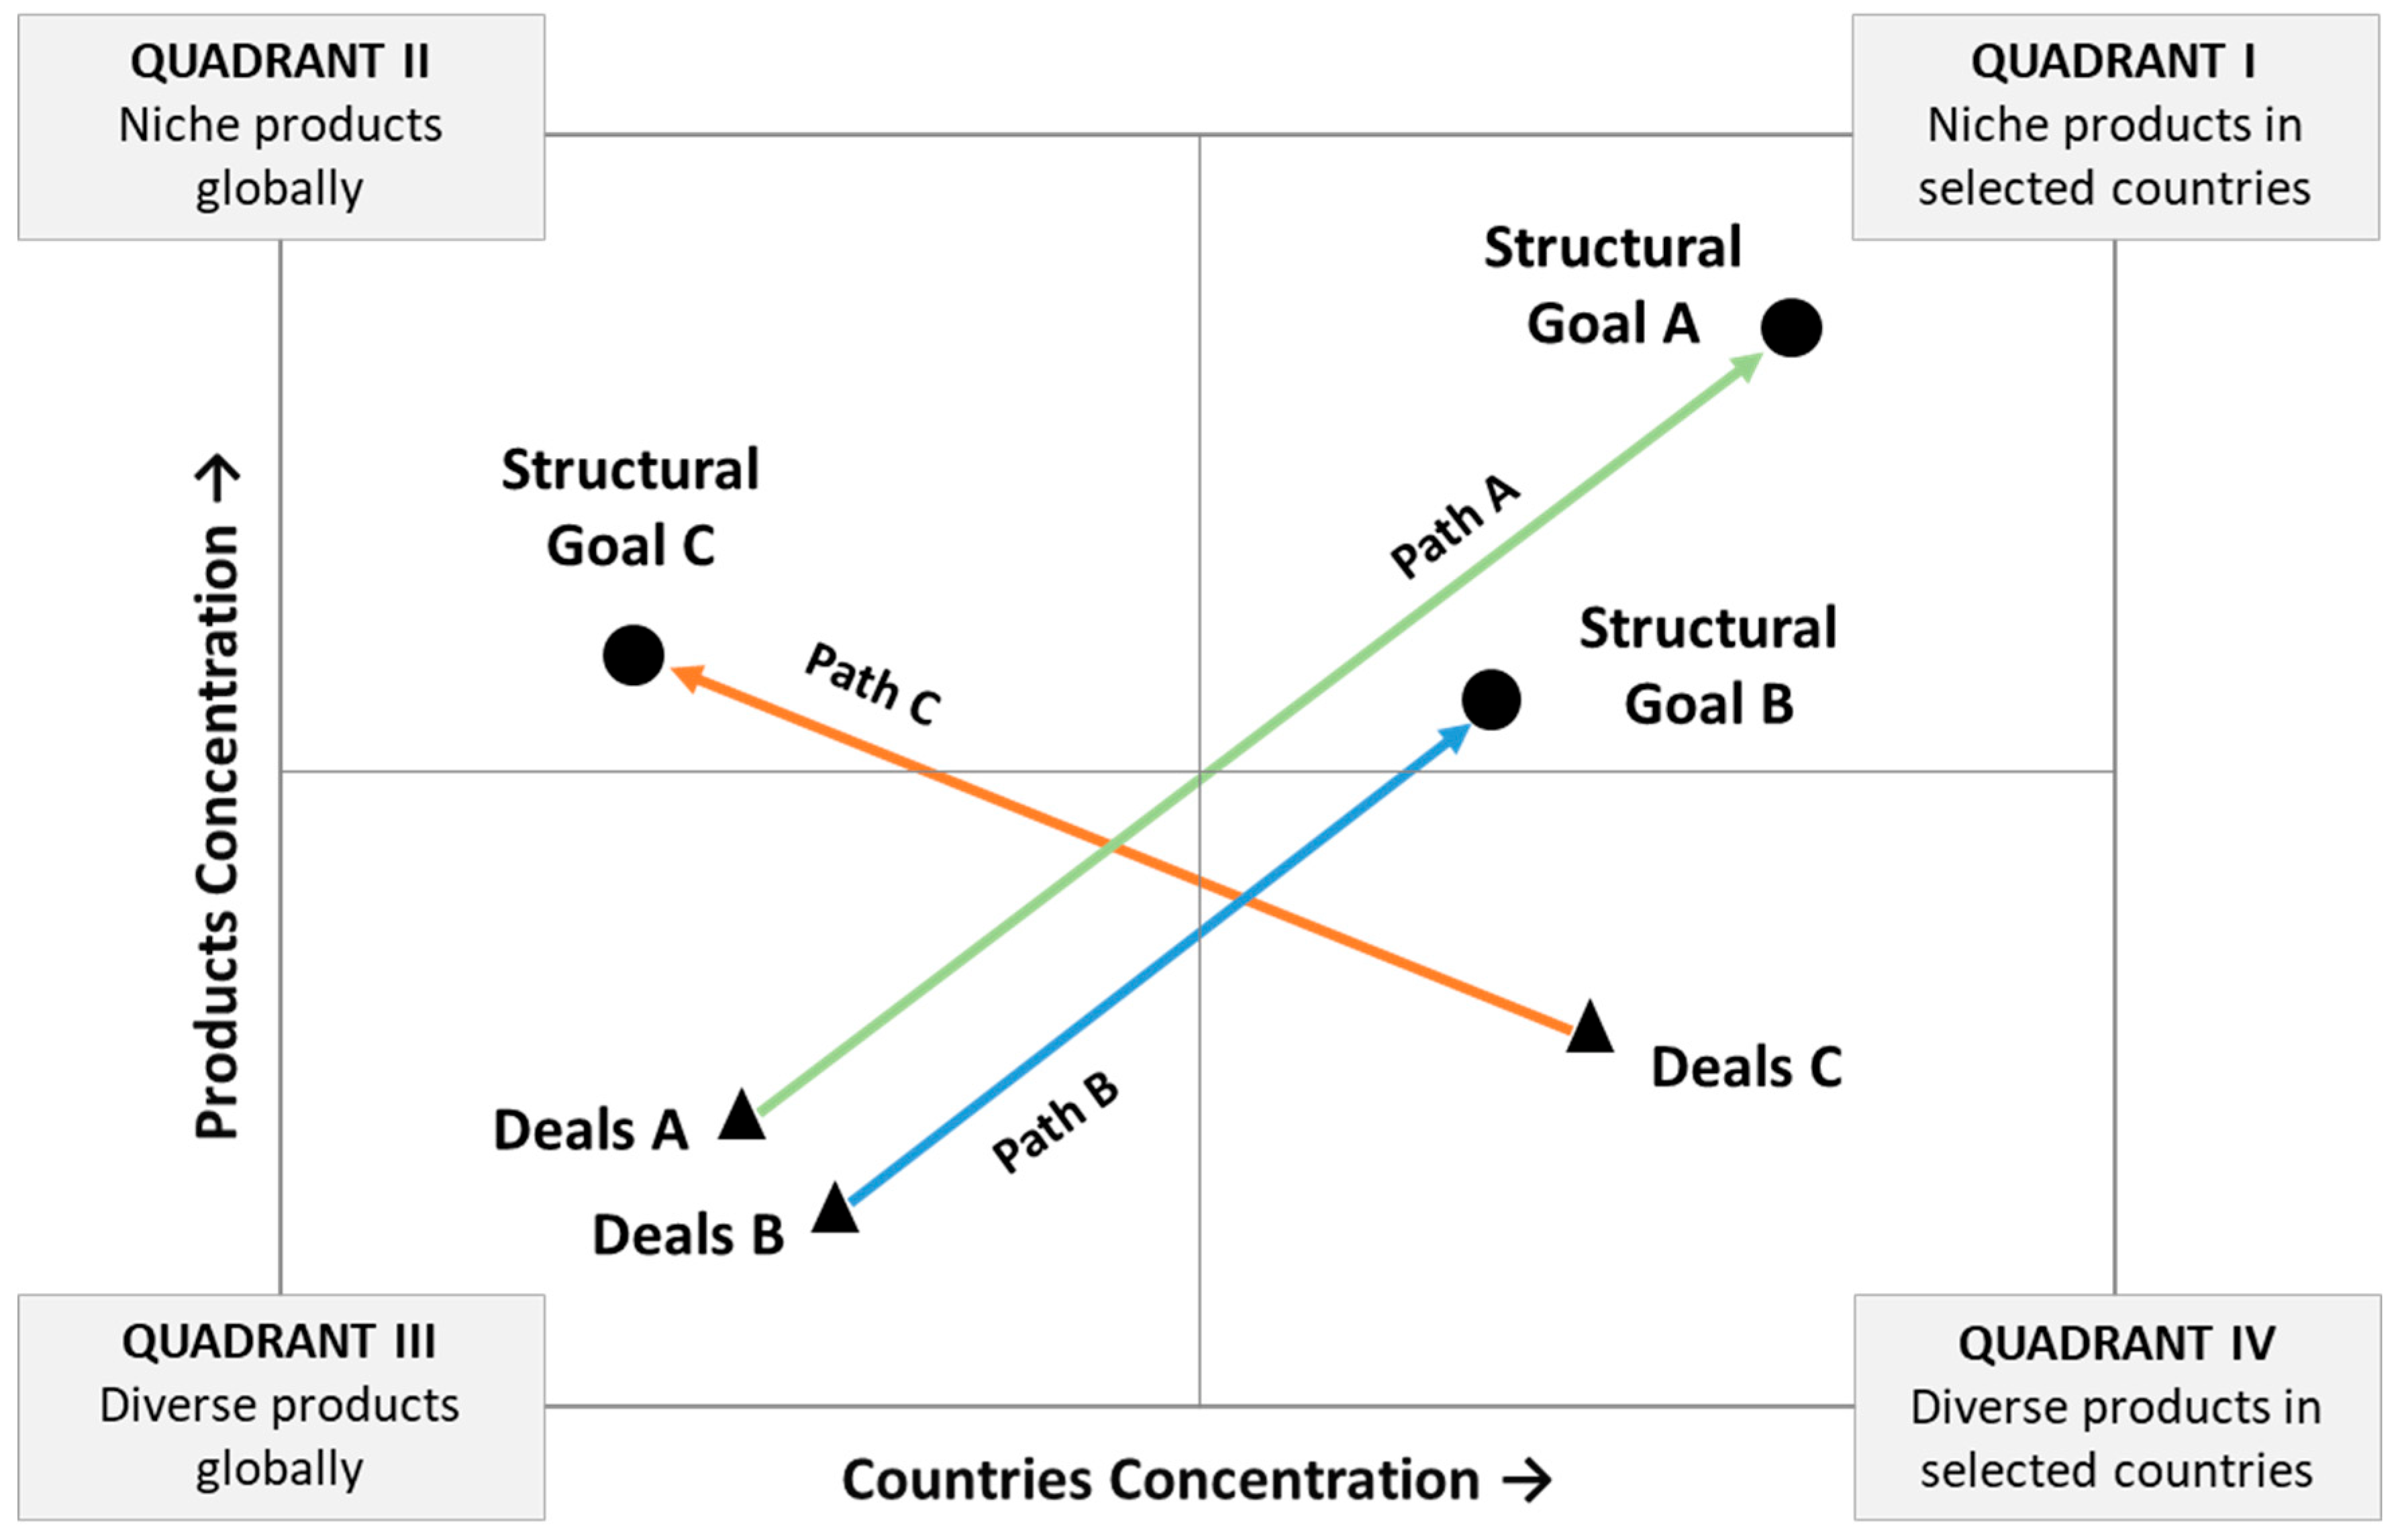
The major pharma MNEs realized their distinct goals of niche product supplies globally or in selected countries through a cumulative net effect of deals of two kinds. First, deals related to a diverse range of products globally (Quadrant III) and second, deals related to a diverse range of products from selected countries (Quadrant IV). In consolidating the findings,
Figure 7 illustrates the inverse effect observed between net cumulative deal profiles and the resulting structural goal. For the structural goal in Quadrant I or Goal A and Goal B, the deal profile was in Quadrant III while for the structural goal in Quadrant II or Goal C, the deal profile was in Quadrant IV.
It is important to note that the historic deal profiles revealed represent a cumulative effect, implying that a dominant trend was observed in the longer term on a relative scale. To rationalize the observations, we classify the possible motivations behind deals in the context of structural goals as follows:
- (i)
Acquiring or consolidating, or partnering with businesses related to the desired “niche” products (Quadrants I & II);
- (ii)
Acquiring or consolidating, or partnering with businesses in desired “selected” countries (Quadrants I & IV);
- (iii)
Shedding businesses in a wide range of “non-niche” products (Quadrants III & IV) and/or acquiring capabilities complementary to “niche” products;
- (iv)
Shedding businesses from many “non-selected” countries (Quadrants II & III).
Based on the observed results, for the Goals A and B in Quadrant I, shedding of businesses for the motivations (iii) and (iv) significantly dominated over the other motivations of enhancing niche capabilities in selected countries. This is suggestive of MNEs conducting extensive course corrections to adapt their strategy to changing market dynamics, business cycles and other possible reasons ranging from changes in socio-political conditions, leadership, ownership, technology trajectories, regional policies, etc. While appreciating the enormous practical challenges that MNEs need to overcome in their evolution, this result also highlights the importance of defining and staying the course on a longer-term strategy for niche offerings in selected countries. While correlations between MNE performance and consistency with longer-term strategy can be the subject of a separate research study, it can be recognized that deals in non-strategic directions can be beneficial. structural goals A and B differ in the degree of specialization by products and countries. The difference can be attributed to confidence in their export value chain and risk performance preferences. A Goal A GUO such as Novo Nordisk is specialized in developing treatments through advanced research for the narrow range of disease types of diabetes and some other serious chronic conditions. Due to the highly technologically specialized nature of their products with protected IP, they probably find merits in centralizing their R & D resources in a few locations as the core competence while relying on export infrastructure for global sales. MNEs that are likely to follow Path B are region-specific downstream businesses such as retailers and pharmacy operators with less lock-in on specific high margin products. They would typically expand to neighboring countries to leverage operational synergies and market familiarity. Such consumer product GUOs may also be relying on the physical presence of customers in stores to close sale of their products. Bausch Health, a Group II GUO with Goal B, specializes in eye health products, dental and other consumer health devices and products which are fast moving and require customer validations. In such cases, a high dependence on exports may restrict the full potential of sales. MNEs preferring Goal C or a specialization in niche products globally engaged in relatively more deals in specific countries. Their deals also covered a wide range of products, which could be indicative of motivation (iii). There is a preference for certain countries for enhancing their niche product portfolio due to the innovativeness credentials of those countries. Innovative pockets typically invest in R&D and foster complementary advancements, thereby offering early access to relevant technological advancements for a competitive edge with existing niche products.
The heuristic basis of linking deal-making to firm strategy for MNEs has multifold implications for practitioners. The strategy functions of incumbent MNEs can start with validating their longer-term direction as leadership in certain niche products in selected countries (structural goal A and B) or niche products globally (structural goal C). In cases of the latter, they can periodically review and align on the choice of the countries and rationale. With the high-level direction validated, they can define the nature of the deals needed to refine or extend their capabilities, and even establish a continuous watch system to evaluate suitable candidates. This study has identified the profiles of deals for the selected direction of an MNE, i.e., for structural goal A or B that jointly represent a search for deals on diverse complementary products in new geographies, as well as for structural goal C that represents a search for deals on specific products in new geographies. In cases where future deals have already been shortlisted, this guidance can serve as validation. Fast-emerging MNEs, such as those in China and India who are currently highly diversified in product portfolios, can be guided toward a longer-term matured state in which they decide on a specialization either globally or in selected countries, and the nature of deals in which to engage. MNEs formulating their global strategy could simulate the impact of certain deals through their subsidiaries to validate a structured execution plan. The net effect of global deal-making can serve as firms’ group-level guidance for mid-course corrections both for target markets and more precise product featuring. A global level assessment of which product features are optimal or minimal for the geographies of operation can mitigate the major risk of failure due to over-featuring [
2]. Competitor moves on a global scale can be better understood to adjust positioning in regions with products based on a measured competitive intensity to achieve economically more attractive transaction costs [
71]. MNEs typically influence the landscape of a region and such guidance can also aid regional policy-makers in designing governmental incentives and alignments with existing infrastructure. With the guidance from this study, policy-makers and regulators can expect the pool of incumbent MNEs operating in their regions to focus on certain niche products, which they can incentivize or disincentivize based on their criticality for the people in the region. They can observe the pace and nature of their deal-making to accordingly assign prioritized rollouts of relevant sectoral policies that benefit their region. Based on MNE maturity assessments, they can foster new local businesses with benefits that have potential to transform into attractive acquisition targets and collaborators for the MNEs. The integrated assessment of the relationship between product and geographical diversity has limited coverage in the literature. Further, the
HHI as a normalizer for diversity data can be applied to benchmark other industrial sectors and small-to-medium enterprises (SMEs) aspiring to become MNEs. This study motivates the discourse on the implications of deals as a strategy on the eventual firm structure. Identifying MNEs’ directions on specializations can highlight industry gaps that may require new policy incentives to attract firms to close the gaps. Such insights can offer guidance for designing a balanced regional product portfolio including policies to avoid market saturation or monopolistic potential.
9. Limitations
The approach used in this study has certain inherent limitations. The strength of historic deal profiles as a solitary indicator of global strategy for Pharma MNEs could benefit from additional validation. In general, a strategy involves both internal and external actions. Certain major internal actions related to reorganizations and recruitment can significantly enhance MNEs’ capabilities. However, due to the science-based, knowledge-intensive and highly regulated nature of pharma industry, we believe that impact of external deal-making is likely to be higher for capability-building as compared to such internal actions. Another consideration is that current structures of GUOs were based on their subsidiaries, which excluded revenues by businesses or countries, thereby not bringing forth their weightage or financial importance. The dynamic importance of certain countries and businesses has not been considered. For the deal profiles, the deals’ financial values data have gaps, with values either unavailable or not declared. The post-deal financial performance in the concerned businesses or countries is another dimension to validate the importance of certain M & A strategies over others, which was not assessed in this study. The financial importance trends would be a valuable topic for future research to offer empirical evidence to delve deeper into influence of deals on organizational design.
The criteria for grouping the products and services categories, i.e., Zephyr database business categories, in this study were based on a threshold of their frequency of occurrence in deals, and the groupings required some level of subjective judgement. This was because the business categories in the Zephyr database were not standardized. Moreover, the granularity in the selected groups could be higher for clearer differentiation between hub firms. For example, the groupings of ‘pharma manufacturer’, which occurs the most, could be divided between sub classes, potentially revealing new insights. As an example, the hub firm Perrigo appeared to be very concentrated due to extensive deal making within OTC manufacturers, even though their deals covered new disease areas for OTC products. In addition, Unilever’s portfolio of consumer products represents a very large umbrella of products that were added, removed or updated, but are not fully differentiable, even with the sub-classes of food and nutrition, healthcare, household and electronics.
10. Conclusions and Future Work
To investigate the relationship between MNEs, past deal-making and current business diversity structures in large, highly regulated knowledge-intensive industries and historic deals executed from the year 2002 onwards by MNEs in the pharma industry were selected for analysis. Network analysis revealed major clusters and dominant hub firms. For a group-level understanding, the subsidiaries of the MNEs were merged as a single entity under their respective GUO. The diversity structures of the top 24 pharma GUOs were studied in terms of products and countries. Quantification of the selected MNEs’ current structure was based on their subsidiaries’ products and countries of operation. Similarly, their deal profiles were computed based on the net effect of deal connections (targets or acquirers) on the MNEs’ products and countries spread. Both these measures of current and deal profile were normalized using the well-established HHI-based method. Based on the distance and direction between the deals and current structure of the hub firms, three distinct trajectories were observed. Group I hub firms, with the majority of the MNEs in this study, focused on niche offerings in specific countries with deals related to multiple products and in multiple countries to arrive at their strategic goals. Group II hub firms also chose to be specialized, but with less niche product offerings in specific countries, and with a similar deal profile. Group III hub firms chose niche products for the global market and their supporting deals were related to multiple products but in specific countries. The hub firms in the three groups consisted of several competing firms and, therefore, their trajectories can be considered to represent business agnostic strategies. These empirically derived trajectories, along with the other theoretical possibilities not appearing, were analyzed and rationalized using an integrated diversification approach, representing their evolution through shedding, acquiring and consolidating businesses. Diverse products both globally and in selected countries were found to be not longer-term aspirations of the MNEs. While the former aspiration is understandable due to the high complexity to achieve and sustain, the latter is a distinct possibility for emerging MNEs with major domestic markets such as in China and India.
Through the selection of MNEs existing today and with long histories, this study assumed that they conducted deals that ensured their sustainability. On the foundation of previous theories, research on the factors influencing their long-term sustainability can contribute to the development of a unifying theory. The insights from this study can be extended as heuristics for MNEs in similar industries for linking strategic deal-making to desired business diversity structures, such as for MNEs seeking higher geographical spread as a group, more niche product offerings with an export strategy and a defined pace of diversification. MNEs or aspiring MNEs, based on their current structure in geographical and product spread, can be guided in deal-making through subsidiaries positioned with their desired diversity structures. The MNEs can better interpret competitor moves at a global level and accordingly identify opportunities for more attractive access to resources and markets. Regional policy-makers can also be aided through interpretation of MNE deal profiles to align with their developmental goals. If the hub firms identified in this study were considered peers, a similar study of deal profiles but distinguished by peer vs. non-peer deals may offer additional dimensions of strategic inclinations.

 ,
, 


