Article

Effect of Metakaolin and Lime on Strength Development of Blended Cement Paste

by
Kosar Hassannezhad
1,
Yasemin Akyol
1,
Mehmet Can Dursun
1,
Cleva W. Ow-Yang
1,2 and
Mehmet Ali Gulgun
1,2,*
1
Materials Science and Nano Engineering Program, Sabanci University, Istanbul 34956, Turkey
2
Nanotechnology Research Center SUNUM, Sabanci University, Istanbul 34956, Turkey
*
Author to whom correspondence should be addressed.
Constr. Mater. 2022, 2(4), 297-313; https://doi.org/10.3390/constrmater2040019
Submission received: 31 July 2022 / Revised: 1 November 2022 / Accepted: 4 November 2022 / Published: 14 November 2022
(This article belongs to the Special Issue Advances in Concrete Binders and Reinforced Concrete)

Abstract

:
To develop a more reactive pozzolan for supplementary cementitious materials (SCMs), the co-calcination of kaolinite and limestone was investigated for its contribution to hydration of blended cement. Kaolinite (with ~50 wt% quartz impurity) was calcined at 700 °C, and a mixture of kaolinite and limestone was calcined at 800 °C. These activated SCMs were added to ordinary Portland cement (OPC), replacing ca. 30 wt% of the OPC. The compressive strength of these blended cement paste samples was measured after 28 and 90 days, while the hydration products and microstructural development in these blended cement pastes were analyzed by X-ray diffraction (XRD), thermogravimetric analysis (TGA), and scanning electron microscopy (SEM). The results revealed that adding free lime to OPC, together with metakaolin, led to enhanced compressive strength. The compressive strength of this new blended cement paste reached 113% and 112% of the compressed strength of pure OPC paste after 28 and 90 days of hydration, respectively. Furthermore, this study showed that the improvement was due to the increased consumption of Portlandite (CH), the formation of calcium aluminosilicate hydrate (CASH), and the reduction of porosity in the sample containing free lime and metakaolin.

1. Introduction

As far back as the Roman civilization, activated aluminosilicate, in the form of lava, was processed together with reactive lime, in the form of burnt limestone (CaO), to form extremely durable, pozzolanic cements [1,2]. More recently, metakaolin has been widely used as a source of activated aluminosilicate; and calcium hydroxide (CaO·H2O) has been used in place of burnt limestone [3]. When metakaolin in blended OPC reacted with free lime, which is one of the products of hydration reactions in OPC, additional calcium silicate hydrate (CSH) and CASH had formed [4,5,6,7,8,9,10,11,12]. These two phases offered the combined effect of increasing strength and durability, albeit over the long term [13,14,15,16,17]. Metakaolin is already being added to OPC in amounts ranging 5–30 wt% in many studies [12]. However, to use the full pozzolanic potential of this much metakaolin for forming CSH and CASH, one would need much higher amounts of free lime than what is produced by OPC hydration reactions.
To design an alternate solution, the use of schist-type materials was considered. Because pure clay minerals, such as kaolinite, are relatively scarce, using schist as an alternative clay source is more cost-effective [18]. Although the schist minerals do have a variation in their mineralogical composition, they generally contain quartz, different types of clay minerals, and feldspars in variable ratios [19,20]. Because they may additionally contain carbonates of calcium and magnesium, they already provide the two main ingredients for pozzolanic reactions in cement: aluminosilicates, i.e., clay minerals, and an abundant calcium source, limestone [19,20]. However, clays must first be activated—i.e., by calcining—before they can be used as SCMs [7]. Calcined clays as SCMs have already been adopted by the cement industry due to their good pozzolanic characteristics. In pozzolanic reactions, calcined clays consume Portlandite, which is one of the main sources of cement durability problems [4,5,6,7,21]. On the other hand, calcined limestone, i.e., lime (CaO), was converted to hydrated lime (calcium hydroxide-CH) after being mixed with water and was reported to enhance the pozzolanic reactivity of calcined clays (metakaolin) [3]. Thus, co-calcining both clays and limestone may offer synergistic potential for enhancing pozzolanicity, producing blended cement paste with higher compressive strength and durability.
As the simplest-structured clay, kaolinite has been widely used in many studies as an SCM source [4,5,6,7,8,9,10,11,12]. Its advantage over other types of clays is the simplicity of de-hydroxylation during heat-treatment. Kaolinite consists of a silicon oxide layer and an aluminum hydroxide layer [22], and this 1:1 structure facilitates the study of pozzolanic reaction mechanisms. Generally, the activation of clay minerals occurs through the de-stabilization of aluminum hydroxide layers. In the case of kaolinite, de-hydroxylation takes place in the temperature range of 400–700 °C [8]. This thermal activation leads to the transformation of kaolinite into the more disordered and unstable structure of metakaolin. Metakaolin is highly reactive in cement hydration reactions, i.e., under high pH values [7,12,23]. Ambroise et al. [24] evaluated the pozzolanic reactivity of heat-treated kaolinite in the calcination temperature range of 600–800 °C and reported that the optimum calcination temperature is 700 °C, to give maximum strength at 3, 7, and 28 days. Several groups [7,8,9,10,11,25] have used different ratios of calcined kaolinite, i.e., metakaolin, in blended cement and reported that it generally improved most of the properties of blended cement, such as strength, drying shrinkage, microstructure, and porosity. In addition, several studies [4,6,7,21,22] compared kaolinite to other clays and showed that it is the most reactive clay in pozzolanic reactions.
The addition of limestone to OPC was claimed to be another efficient way to improve compressive strength [26]. There were already several studies [27,28,29,30,31] that were focused on the use of pozzolanic materials, such as calcined clays, together with finely ground virgin limestone particles as the SCMs. This additive not only sped up the hydration at early age, but also served as a filler and influenced the hydrated structure of blended cement pastes. Pera et al. [32] observed physical and chemical changes during cement hydration, by adding different amounts of calcium carbonate to cement. They reported that calcium carbonate accelerated cement hydration and caused the formation of calcium carbosilicate hydrate phases. A mixture of pozzolanic material and limestone was also used as an efficient cement substitute, when used by the Romans as the first blended cement, based on natural volcanic ash together with limestone [1,2,33]. Recently, metakaolin was used together with calcite (limestone) in blended cement [5,12,34,35,36]. Calcite reactions with cement during hydration were claimed to impart additional benefits to the hardened paste through the formation of hemi-carboaluminate, instead of mono-sulfoaluminate. Hemi-carboaluminate subsequently converted to mono-carboaluminate [12,37], which was another strength-providing phase. In limestone calcined clay (LC3), which was introduced and developed by Scrivener et al. [18], the increased pozzolanic activity arose from adding both calcined clay and limestone to OPC. Antoni et al. [12] reported that in the LC3 method, the excess alumina provided by metakaolin reacted with limestone, leading to stabilization of ettringite, and enabled elevated levels of substitution.
In previous studies [18,19], schist-type materials, containing several types of clays, were combined with calcium carbonate and evaluated as a partial replacement for cement. Calcite was decomposed over the temperature range of 700–900 °C [38]. The calcination of calcium carbonate produced free lime and carbon dioxide, suggesting that co-activation of clay minerals together with calcium carbonate could lead to using the full pozzolanic potential of calcined clays [19,20]. Furthermore, Weise et al. [3] reported an enhanced pozzolanic reactivity of metakaolin when adding calcium hydroxide (CH) to a metakaolin and Portland cement mixture. The use of CH with activated complex-structured clays was shown to be feasible. The next logical step would be co-activation of limestone with clays for pozzolanic reactions, which has not been reported previously in the literature.
Several factors affecting the compressive strength of cement are well known, such as the amount of Portlandite and CSH and CASH phases. Portlandite alone is a weak phase in terms of mechanical properties and does not contribute to compressive strength in a cement paste [39]. The CSH gel is the major strength provider in cement paste and concrete [13,14,15]. CASH is an additional hydrate phase that contributes additional compressive strength to cement paste [14,15,16,17]. Another factor strongly affecting the compressive strength of cement paste is porosity. It is known that the strength of any solid material, including cement paste, decreases with an increase of porosity [40,41,42,43]. The amount of macro-porosity in cement paste is a function of the water-to-cement (w/c) ratio [44].
In this study, the improvement in the compressive strength of blended cement pastes by using co-calcined kaolinite and limestone as an SCM is reported. The role of limestone in cement pozzolanic reactions was investigated by making a simple schist-like compound of kaolinite and limestone to be used as an SCM after calcination. To this end, blended cement paste samples were produced by including 30 wt% of SCMs in OPC. The pozzolanic reactivity of the SCMs were determined by quantifying the Portlandite consumption with XRD and TGA methods and measuring the compressive strength of cubic blended cement paste samples after 28 and 90 days of hydration.

2. Materials and Methods

2.1. Materials

Kaolinitic clay with ~50 wt% purity was provided by Şişecam company in Istanbul, Turkey. Limestone ( C C ¯ ) powder and OPC (ENS 197-1 CEM 42.5 R type) were provided by AkçanSA Cement Manufacturing Company (Istanbul, Turkey). The phase composition of ground kaolinite (K), Limestone (L), and OPC samples were determined by using the characterization methods described in detail below. Table 1 summarizes the phase composition of these three samples. The chemical compositions of the three starting materials are given in Table S1 in the Supplementary Materials section. The limestone-added kaolinite sample (KL) was prepared by mixing 15 wt% of limestone with 85 wt% of kaolinite.

2.2. Calcination Process

Thermal treatment was performed on K and KL samples to activate their pozzolanic potential. Using a heating rate of 10 °C/min., the K samples were calcined at 700 °C, and the KL samples at 800 °C. These temperatures were determined according to the thermal decomposition behavior of the respective SCM, and were chosen based on the end temperature of each total weight loss step. For example, the decomposition reaction, de-hydroxylation, occurred at 700 °C in K samples, while de-hydroxylation and calcination took place at 800 °C in KL samples. The calcination steps were the following: 150 g of each powder was put into an alumina crucible, and then heated to 300 ℃ and held for 1 h to eliminate absorbed water; subsequently, the powders were heated up to the final calcination temperature and held for 2 h, followed by air quenching to room temperature. Calcined K and KL samples were re-evaluated with TGA and XRD to monitor the progress of calcination. The calcined K and KL samples were further analyzed with a particle size analyzer to evaluate the effect of particle size on the compressive strength of blended cement paste samples.

2.3. Composite Cement Paste Samples

Calcined K or KL samples were added to OPC at ca. 30 wt% and mixed with water, such that the water-to-solid ratio (w/s) was 0.5. This replacement ratio and w/s were chosen to provide a basis for comparison with most of the other reports in the literature [12]. The blended cement paste samples were designated as K-OPC and KL-OPC. The composition of each cement paste sample was listed in Table 2. The samples were then prepared for compressive strength measurement in cubic molds with dimensions of 40 mm × 40 mm × 40 mm. As a benchmark for strength measurements, a pure OPC paste was prepared with the same procedure. After 24 h, the samples were separated from the molds and held in circulating water at 23 °C for 28 and 90 days. Compressive strength tests were performed on the cubic samples after the predetermined days of hydration. In addition, the amount of Portlandite was assessed after 28 and 90 days in each hydrated, blended cement sample with the aid of XRD (Bruker D2 phaser, Bruker AXS GmbH, Karlsruhe, Germany) and TGA (TGA/DTA; Netzsch STA 449 Jupiter, Netzsch GmbH, Selb, Germany) methods. The microstructure of the blended cement pastes was also analyzed in an SEM (LEO Supra 35VP, Zeiss GmbH, Oberkochen, Germany).

2.4. Characterization

To investigate the temperature-dependent chemical and structural evolution, simultaneous thermal analysis—thermogravimetric analysis and differential thermal analysis (TGA/DTA; Netzsch STA 449 Jupiter, Netzsch GmbH, Selb, Germany)—was performed on the samples, over a temperature range of 30 to 1000 °C, under nitrogen gas, and with a heating rate of 10 K/min. Based on the TGA of each kaolinite sample, the temperature ranges and weight-loss amounts were determined for clay de-hydroxylation and C C ¯ decomposition.
Changes in the crystalline phase content were analyzed in K or KL samples before and after the calcination process by XRD analysis (Bruker D2 phaser, Bruker AXS GmbH, Karlsruhe, Germany). Cu-Kα (λ = 1.54 Å) radiation was used. The divergence slit size was fixed at 0.5°. Samples were scanned between 5 to 90 ° 2   θ , using a step size of 0.02 ° 2   θ and a dwell time per step of 1 s. Moreover, OPC, K-OPC, and KL-OPC pastes were also analyzed with XRD to determine the hydration products, and to quantify relative Portlandite amount of each sample after 28 and 90 days. In the case of quantifying the Portlandite amount, rutile was used as an external standard. Rietveld quantitative phase analysis was performed on the XRD patterns using the TOPAS-Academic V5 [45] in the launch mode jointly with the Jedit text editor.
To investigate the spatial distribution and morphology of the hydration products in OPC, K-OPC, and KL-OPC, microstructures of hydrated samples were imaged using a scanning electron microscope (SEM; LEO Supra 35VP field emission, ZEISS GmbH) equipped with an energy dispersive X-ray microanalyzer (EDS; Roenteg, Xflash; Bruker AXS GmbH, Karlsruhe, Germany). Imaging of samples was done by using an Everhart–Thornley secondary electron detector and an aperture size of 30 µm. Porosity measurements were performed by applying Fiji (ImageJ, National Institutes of Health, Bethesda, MD, USA) [46] software to binary images generated from the SEM micrographs. In addition to total porosity being determined, macroporosity was also obtained from the total areal fraction of pores with effective diameters larger than 1 micrometer.
The average particle size in OPC, calcined K, and calcined KL samples was measured to determine reactive surface area using a particle size analyzer (Mastersizer 3000, Malvern, UK) with a laser micro-analysis detector and a measurement range of 100 nm to 2 mm. Ethanol was used as the solvent.
The load-bearing performance of blended-cement paste samples was evaluated by performing compressive strength measurements. These measurements were carried out on 40 mm × 40 mm × 40 mm cubes of composite cement paste samples of OPC, K-OPC, and KL-OPC, using a compression testing machine (MATEST E161N Servo-plus Evolution, Treviolo (BG), Italy). Samples were subjected to uniaxial loading in compression until fracture. Average compressive strength values were determined from 3 measurements on cube samples.

3. Results

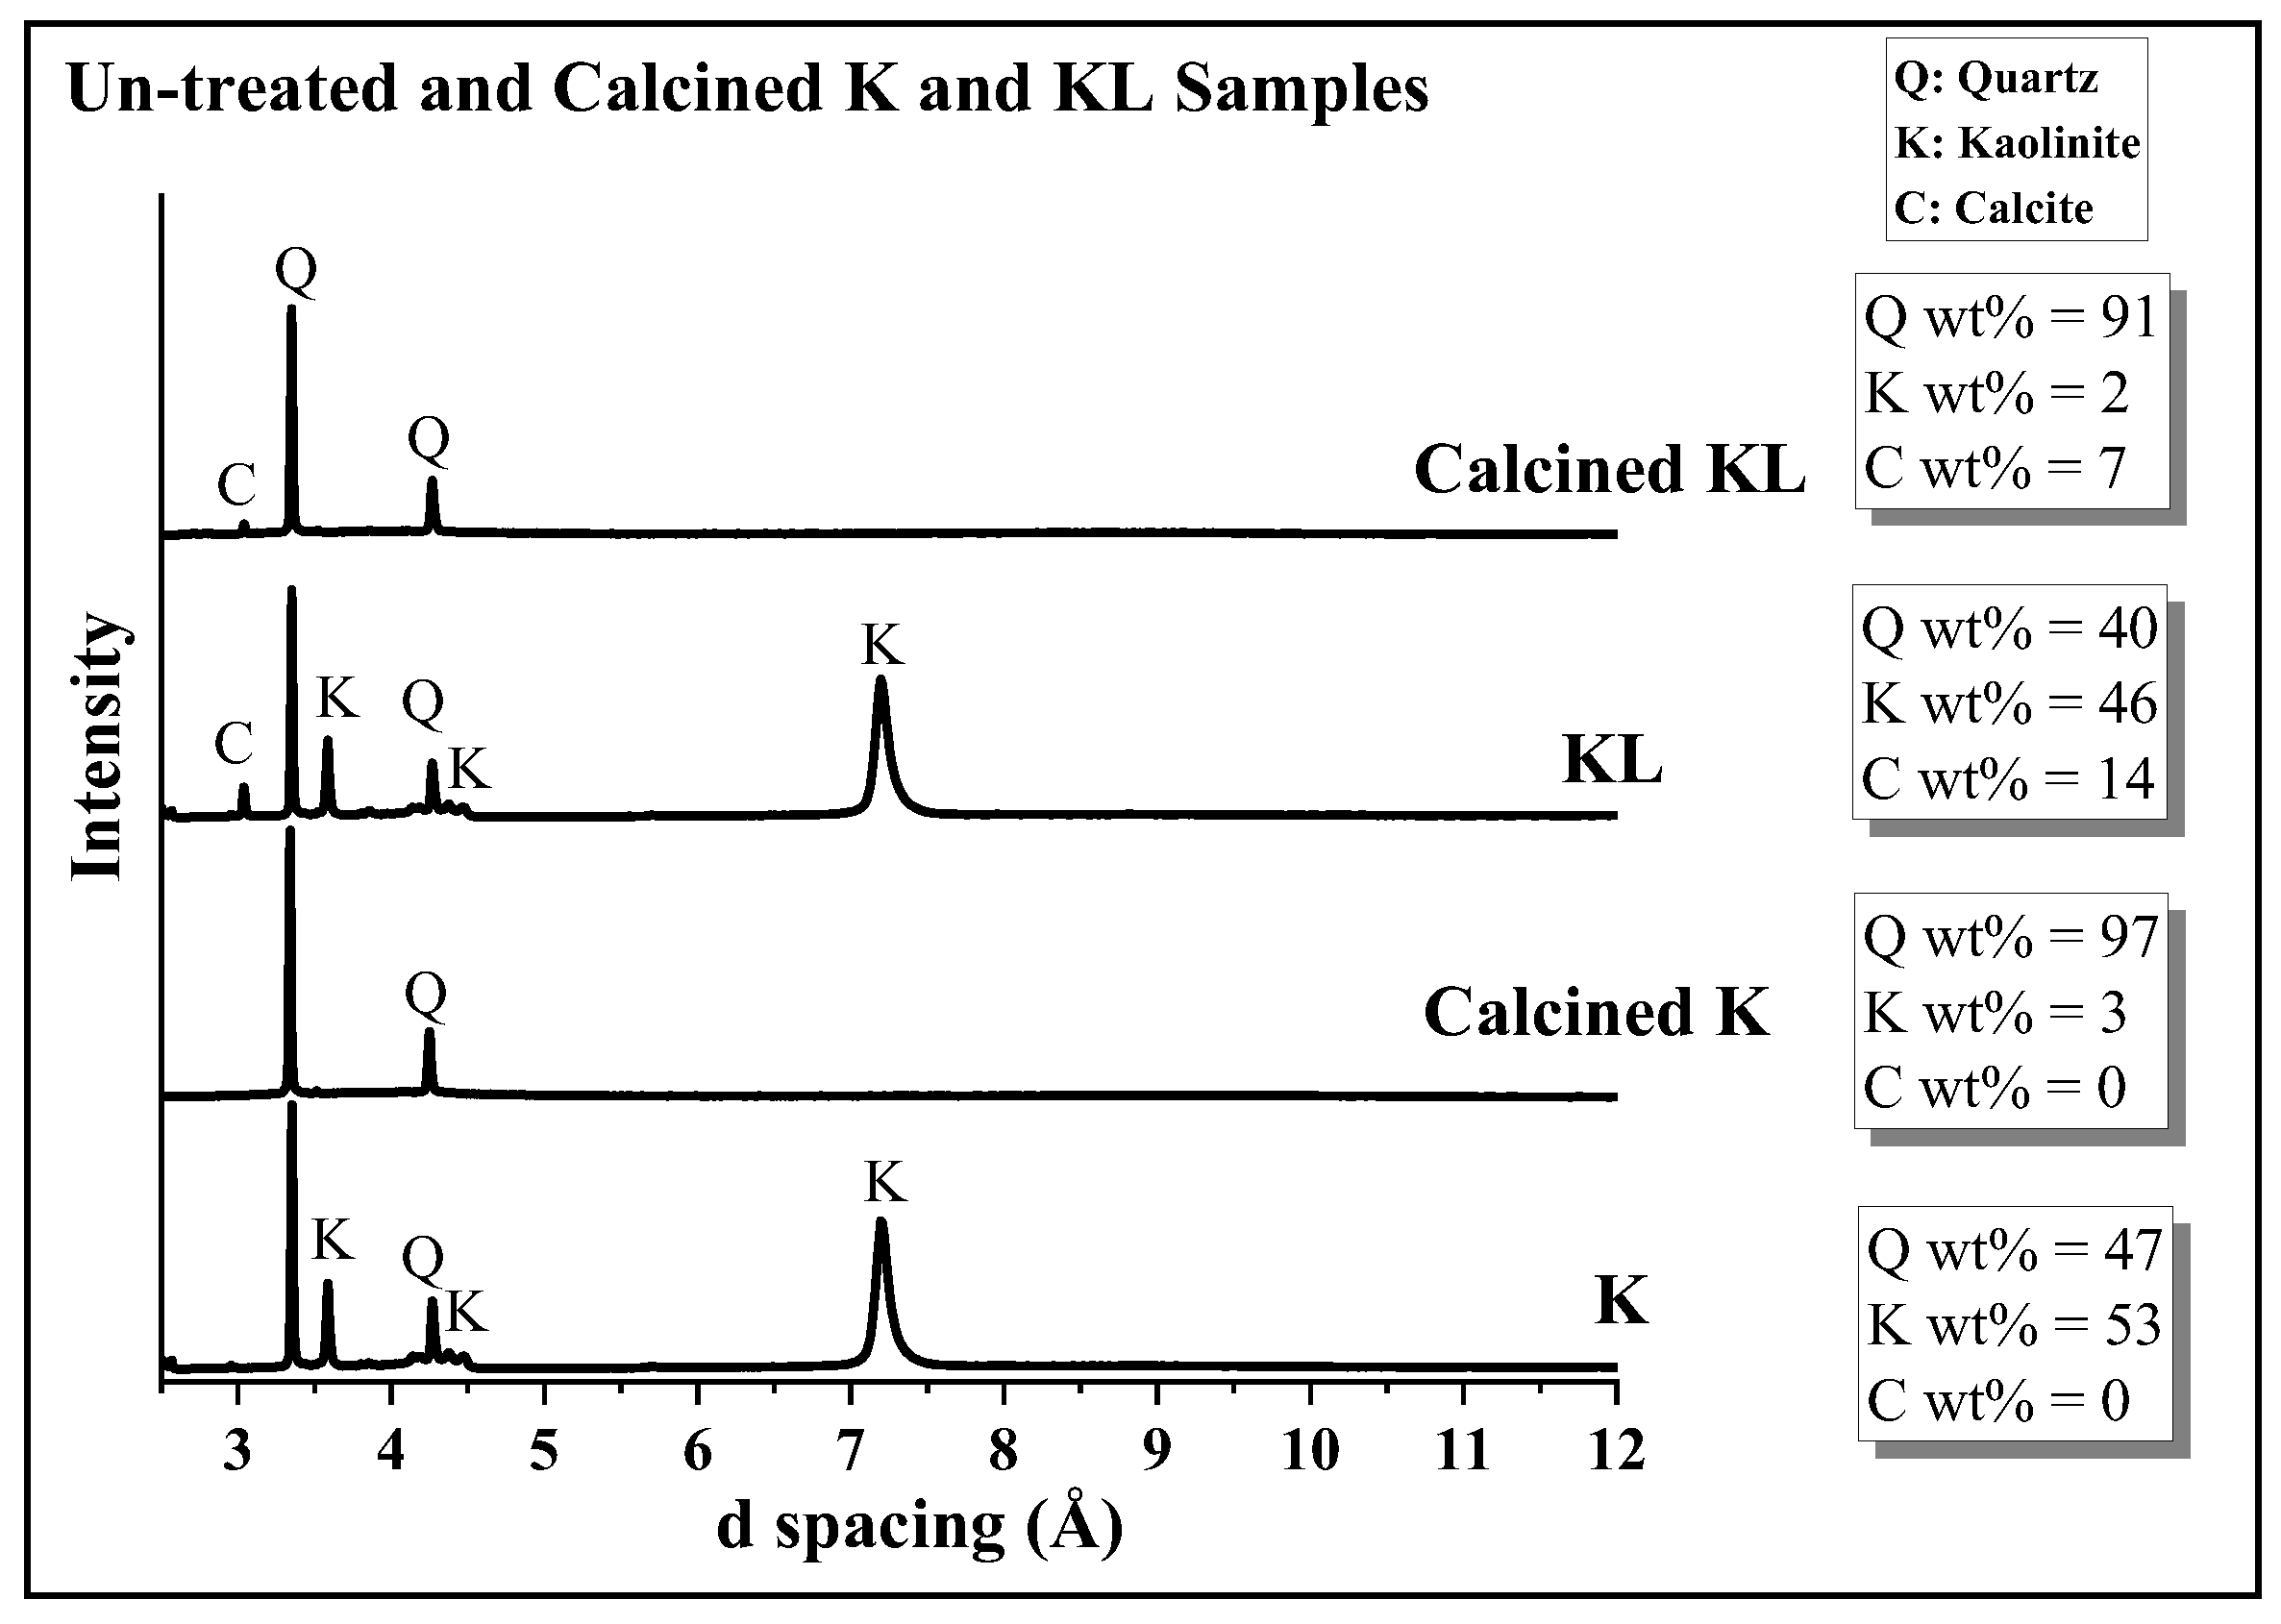
3.1. Phase Analysis of Un-Treated and Calcined Kaolinite Samples with and without Limestone Additions

K and KL samples were analyzed by XRD before and after calcination to determine the phase composition. Figure 1 shows the XRD diffractograms of un-treated and calcined K and KL samples. The XRD patterns revealed that in both K and KL samples, only the crystalline quartz peaks (as an inert phase) remained unchanged during calcination. Therefore, the quartz peak at a d-spacing of 3.35 Å was used as the basis for an internal comparison to estimate the relative amounts of crystalline phases. Crystalline kaolinite peaks disappeared after the calcination process. In addition, there was a relative decrease in calcite peak intensity after calcination of the KL sample. Rietveld phase analysis of the XRD patterns revealed changes in phase composition with calcination in both K and KL samples. While the Kaolinite phase content decreased from 53 to 3 wt%, quartz increased from 47 to 97 wt% in the K sample (Figure 1). A similar result for calcination of KL was obtained from Rietveld phase analysis of the XRD patterns: kaolinite content decreased from 46 to 2 wt%, and calcite content decreased from 14 to 7 wt%, while the quartz amount increased from 40 to 92 wt%. During calcination, the crystalline amounts in the K and KL powders decreased from 81.2 to 46% and 79.1 to 62%, respectively. These results indicate that crystalline kaolinite was successfully de-hydroxylated and amorphized during calcination. In addition, a portion of limestone was also decomposed after calcination of the KL sample.

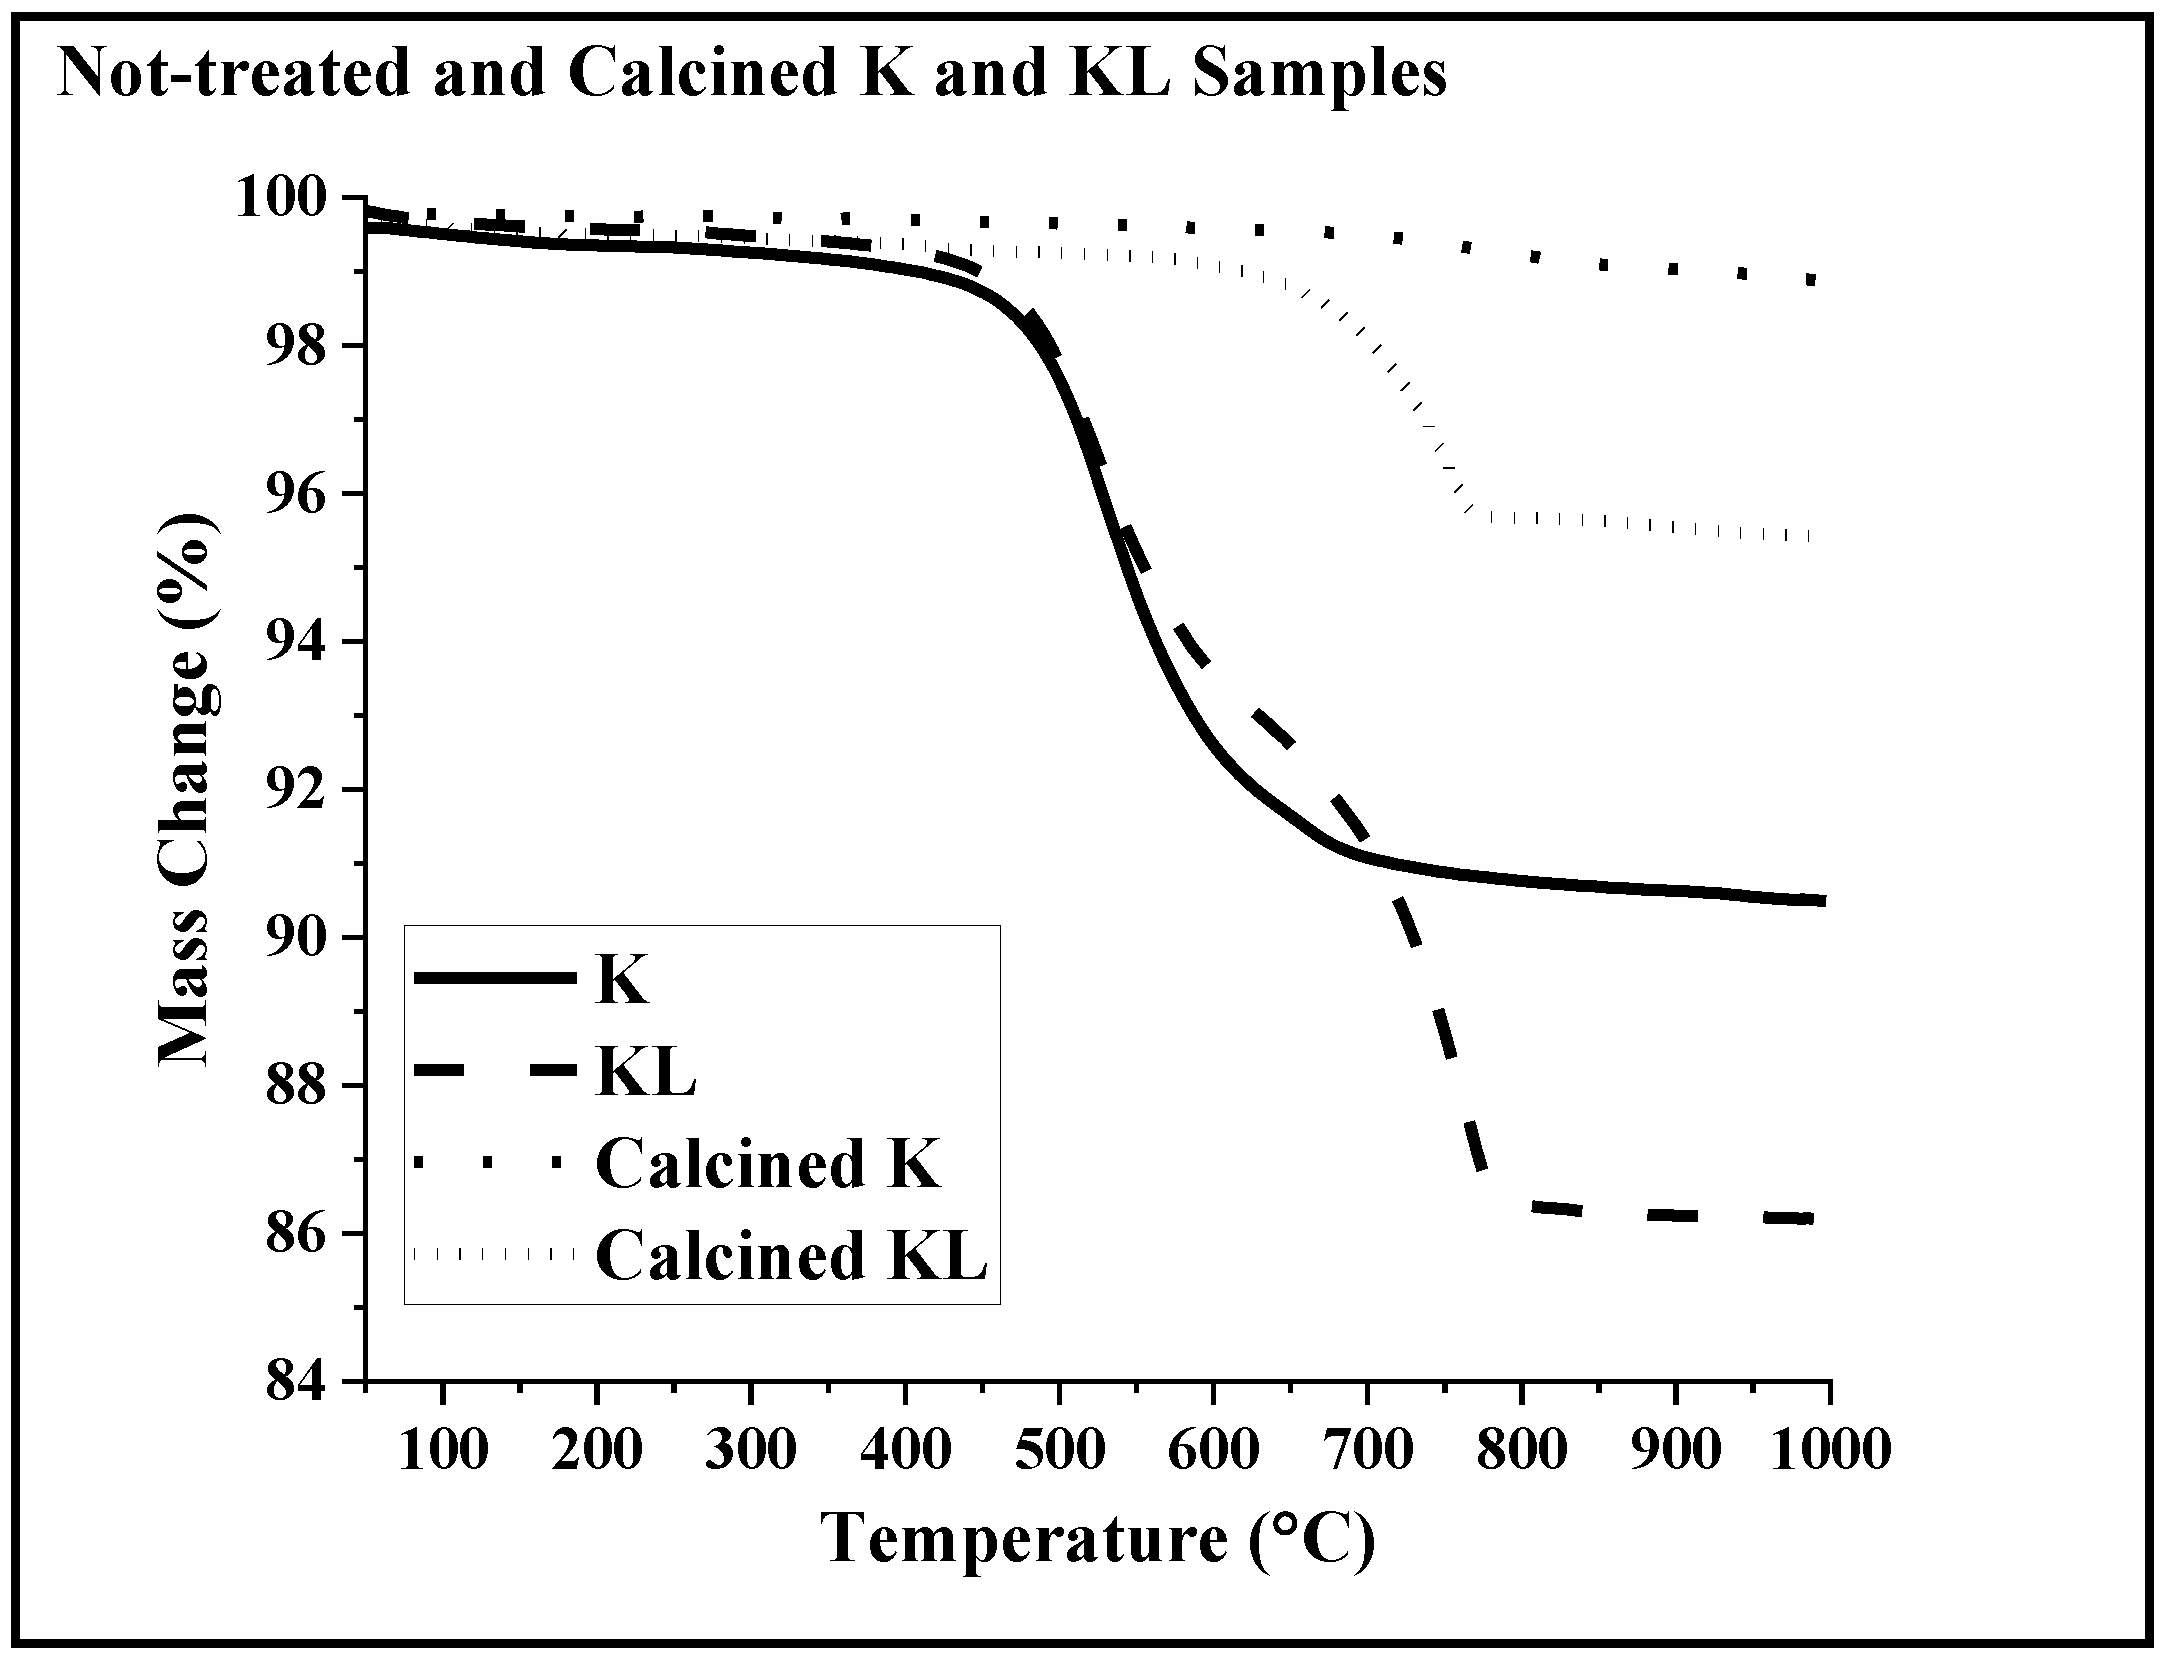
3.2. Thermal Analysis of Un-Treated and Calcined Kaolinite Samples with and without Limestone Additions

TGA analyses was performed on un-treated K and KL samples to assess the thermal decomposition behavior. To check the effectiveness of calcination, calcined K and KL samples were also analyzed with TGA. Figure 2 summarizes the TGA thermograms of un-treated and calcined samples in the temperature range 25–1000 °C. The TGA curve of the K sample showed a single weight loss in the temperature range 400–700 °C. This temperature range corresponds to the de-hydroxylation of kaolinite [47]. However, there was an additional weight loss stage in the KL sample thermogram, in the temperature range 650–800 °C corresponding to decomposition of calcium carbonate (limestone) [48]. This diagram also revealed that there was a delay in the end temperature of kaolinite decomposition in the KL sample. It should be noted that decomposition of kaolinite in the KL sample did not reach completion at 700 °C, as it did in the K sample. Instead, in the KL sample, the decomposition of kaolinite slowed down, as reflected by a change in slope of the TG curve in this temperature range (600° to 700 °C). When the decomposition of calcium carbonate started at higher temperatures, the weight loss curve became steeper again, indicating faster weight loss.
The total weight losses, due to de-hydroxylation of clay and decomposition of calcium carbonate, were extracted from the TGA thermograms.
Table 3 summarizes the weight loss in each sample in the two temperature ranges associated with the decomposition ranges of kaolinite (300–650 °C) and calcium carbonate (650–800 °C). The TGA results of calcined samples revealed that the amount of remnant (undecomposed) kaolinite in the K sample was 0.8 wt%. This value was 0.4 wt% in the calcined KL sample. The amount of left-over calcium carbonate in the KL sample associated with weight loss in the temperature range of 650–800 °C was 3.5 wt%. Calcium carbonate is known to lose 44% of its initial weight during calcination [38]. Therefore, the amount of undecomposed limestone in the calcined KL sample was ca. 8%. These results confirmed the complete decomposition of kaolinite and partial decomposition of limestone during calcination.

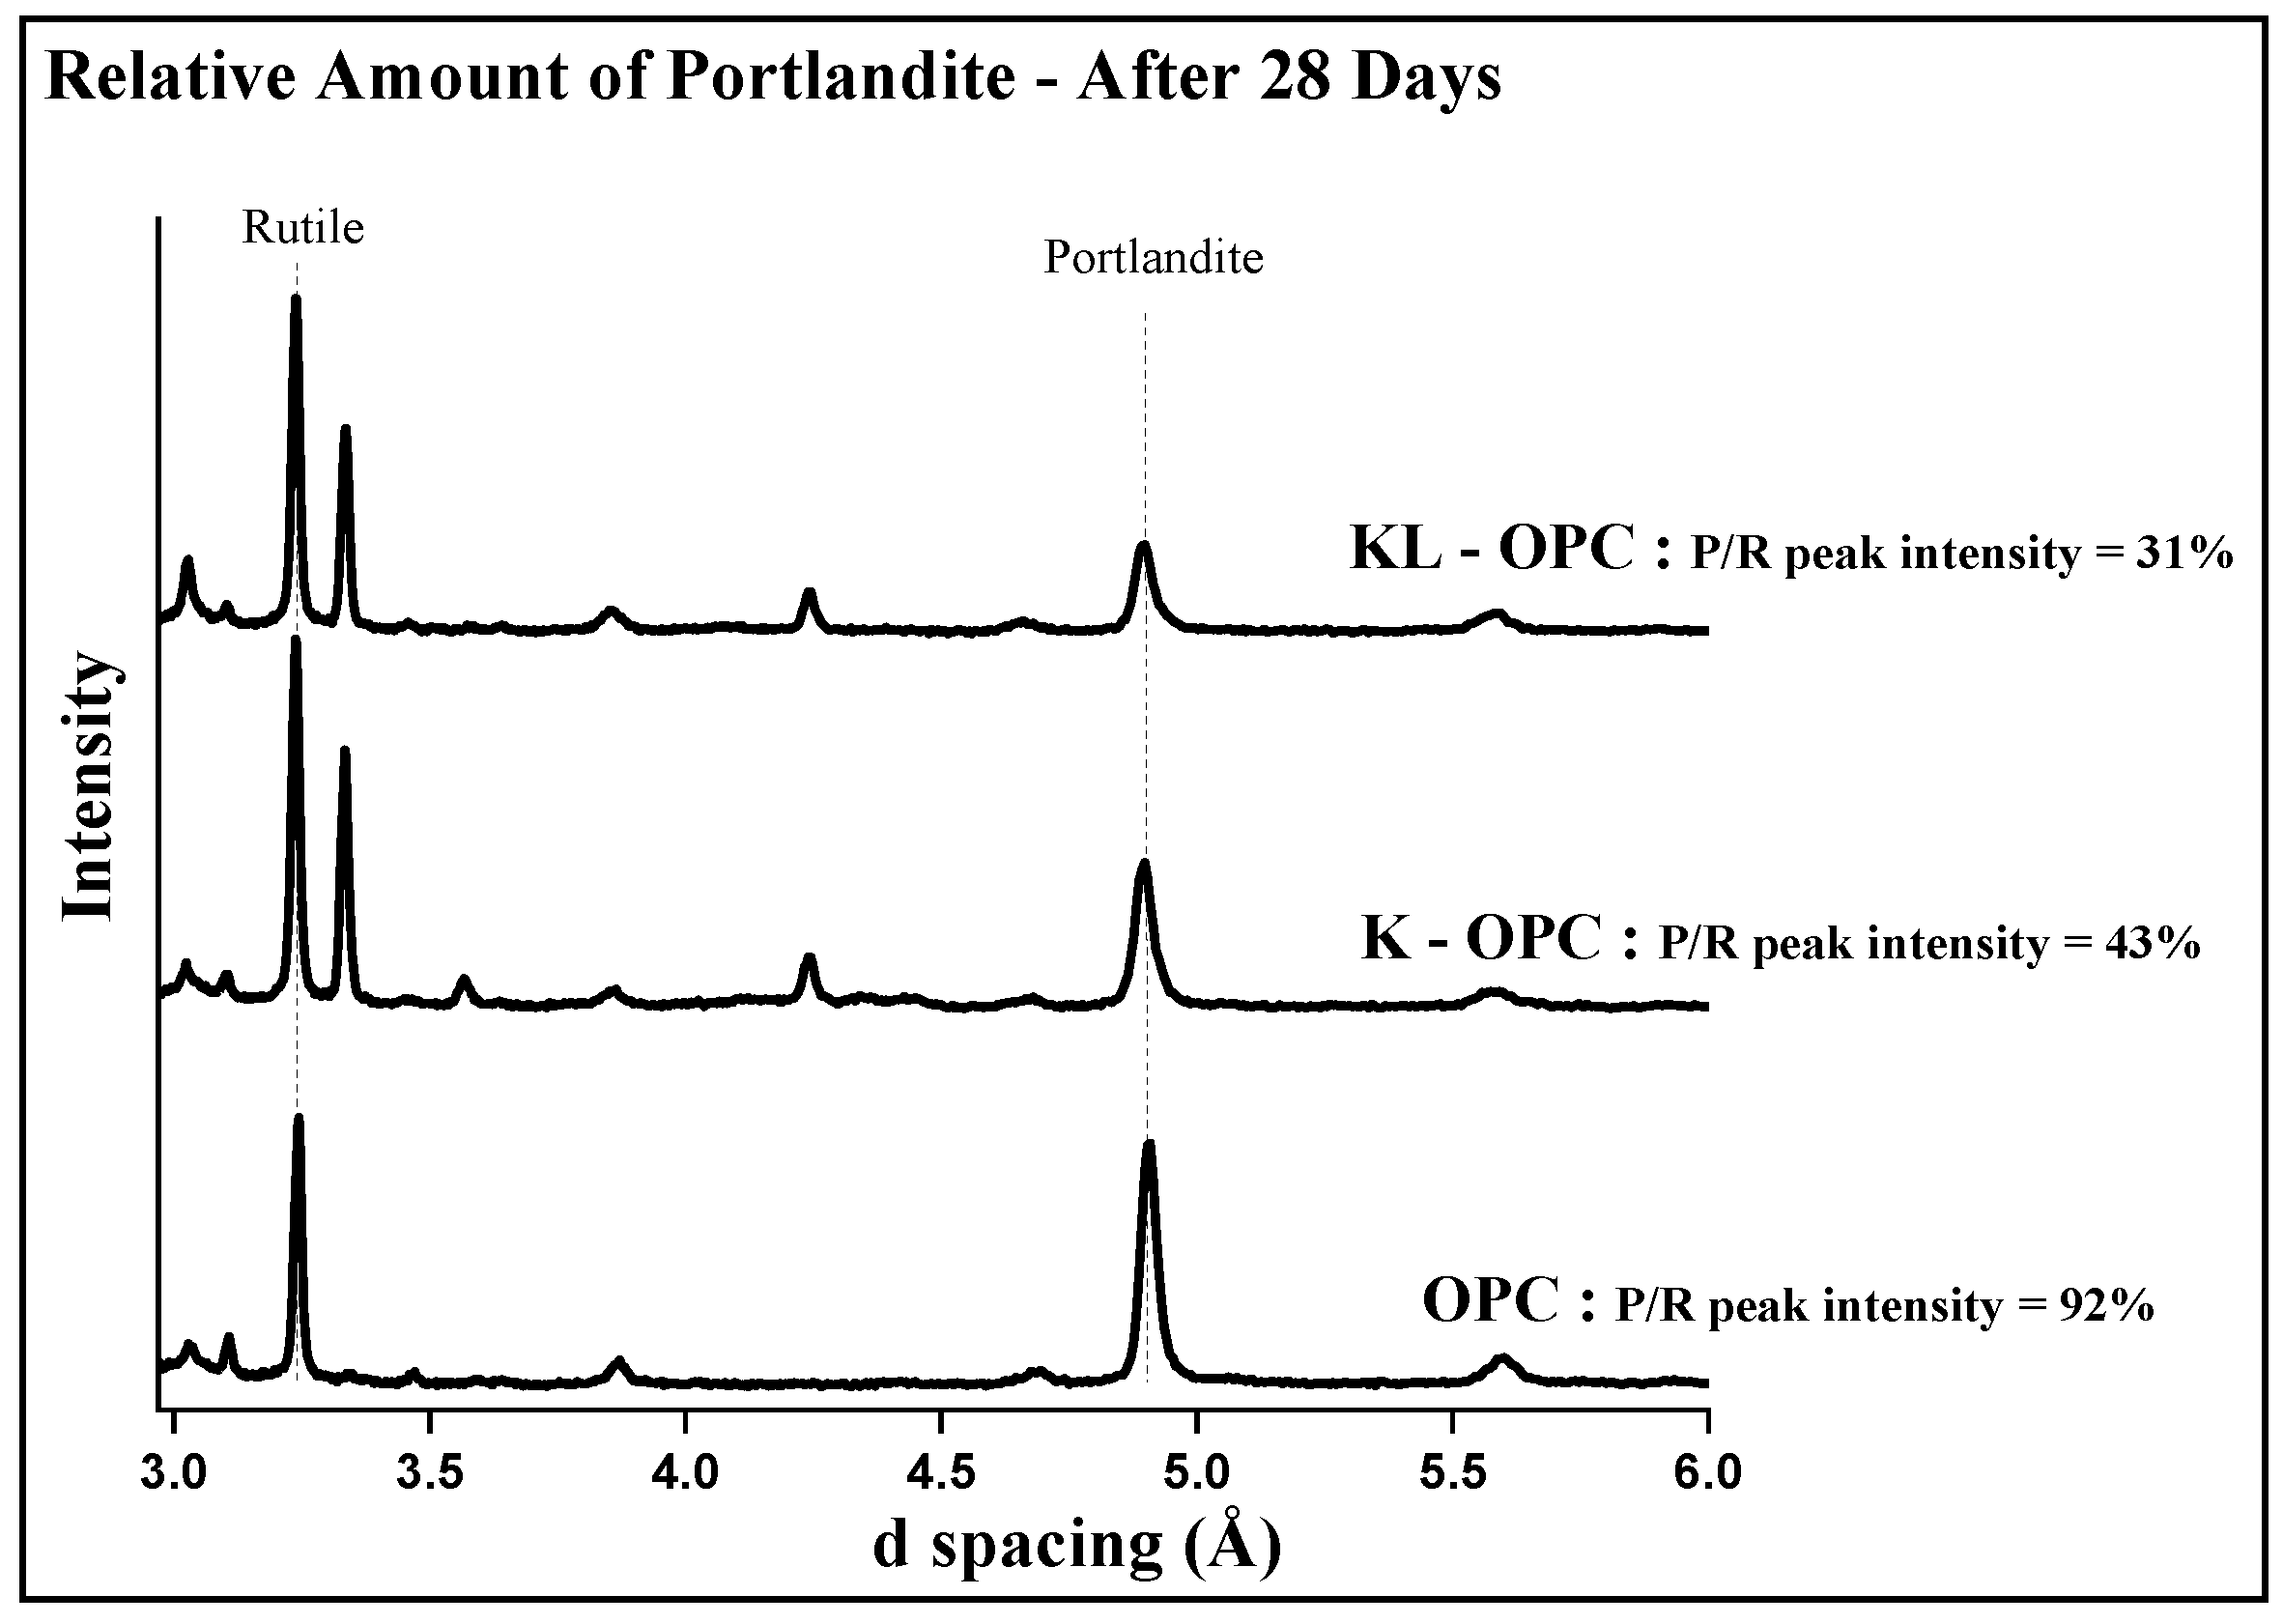
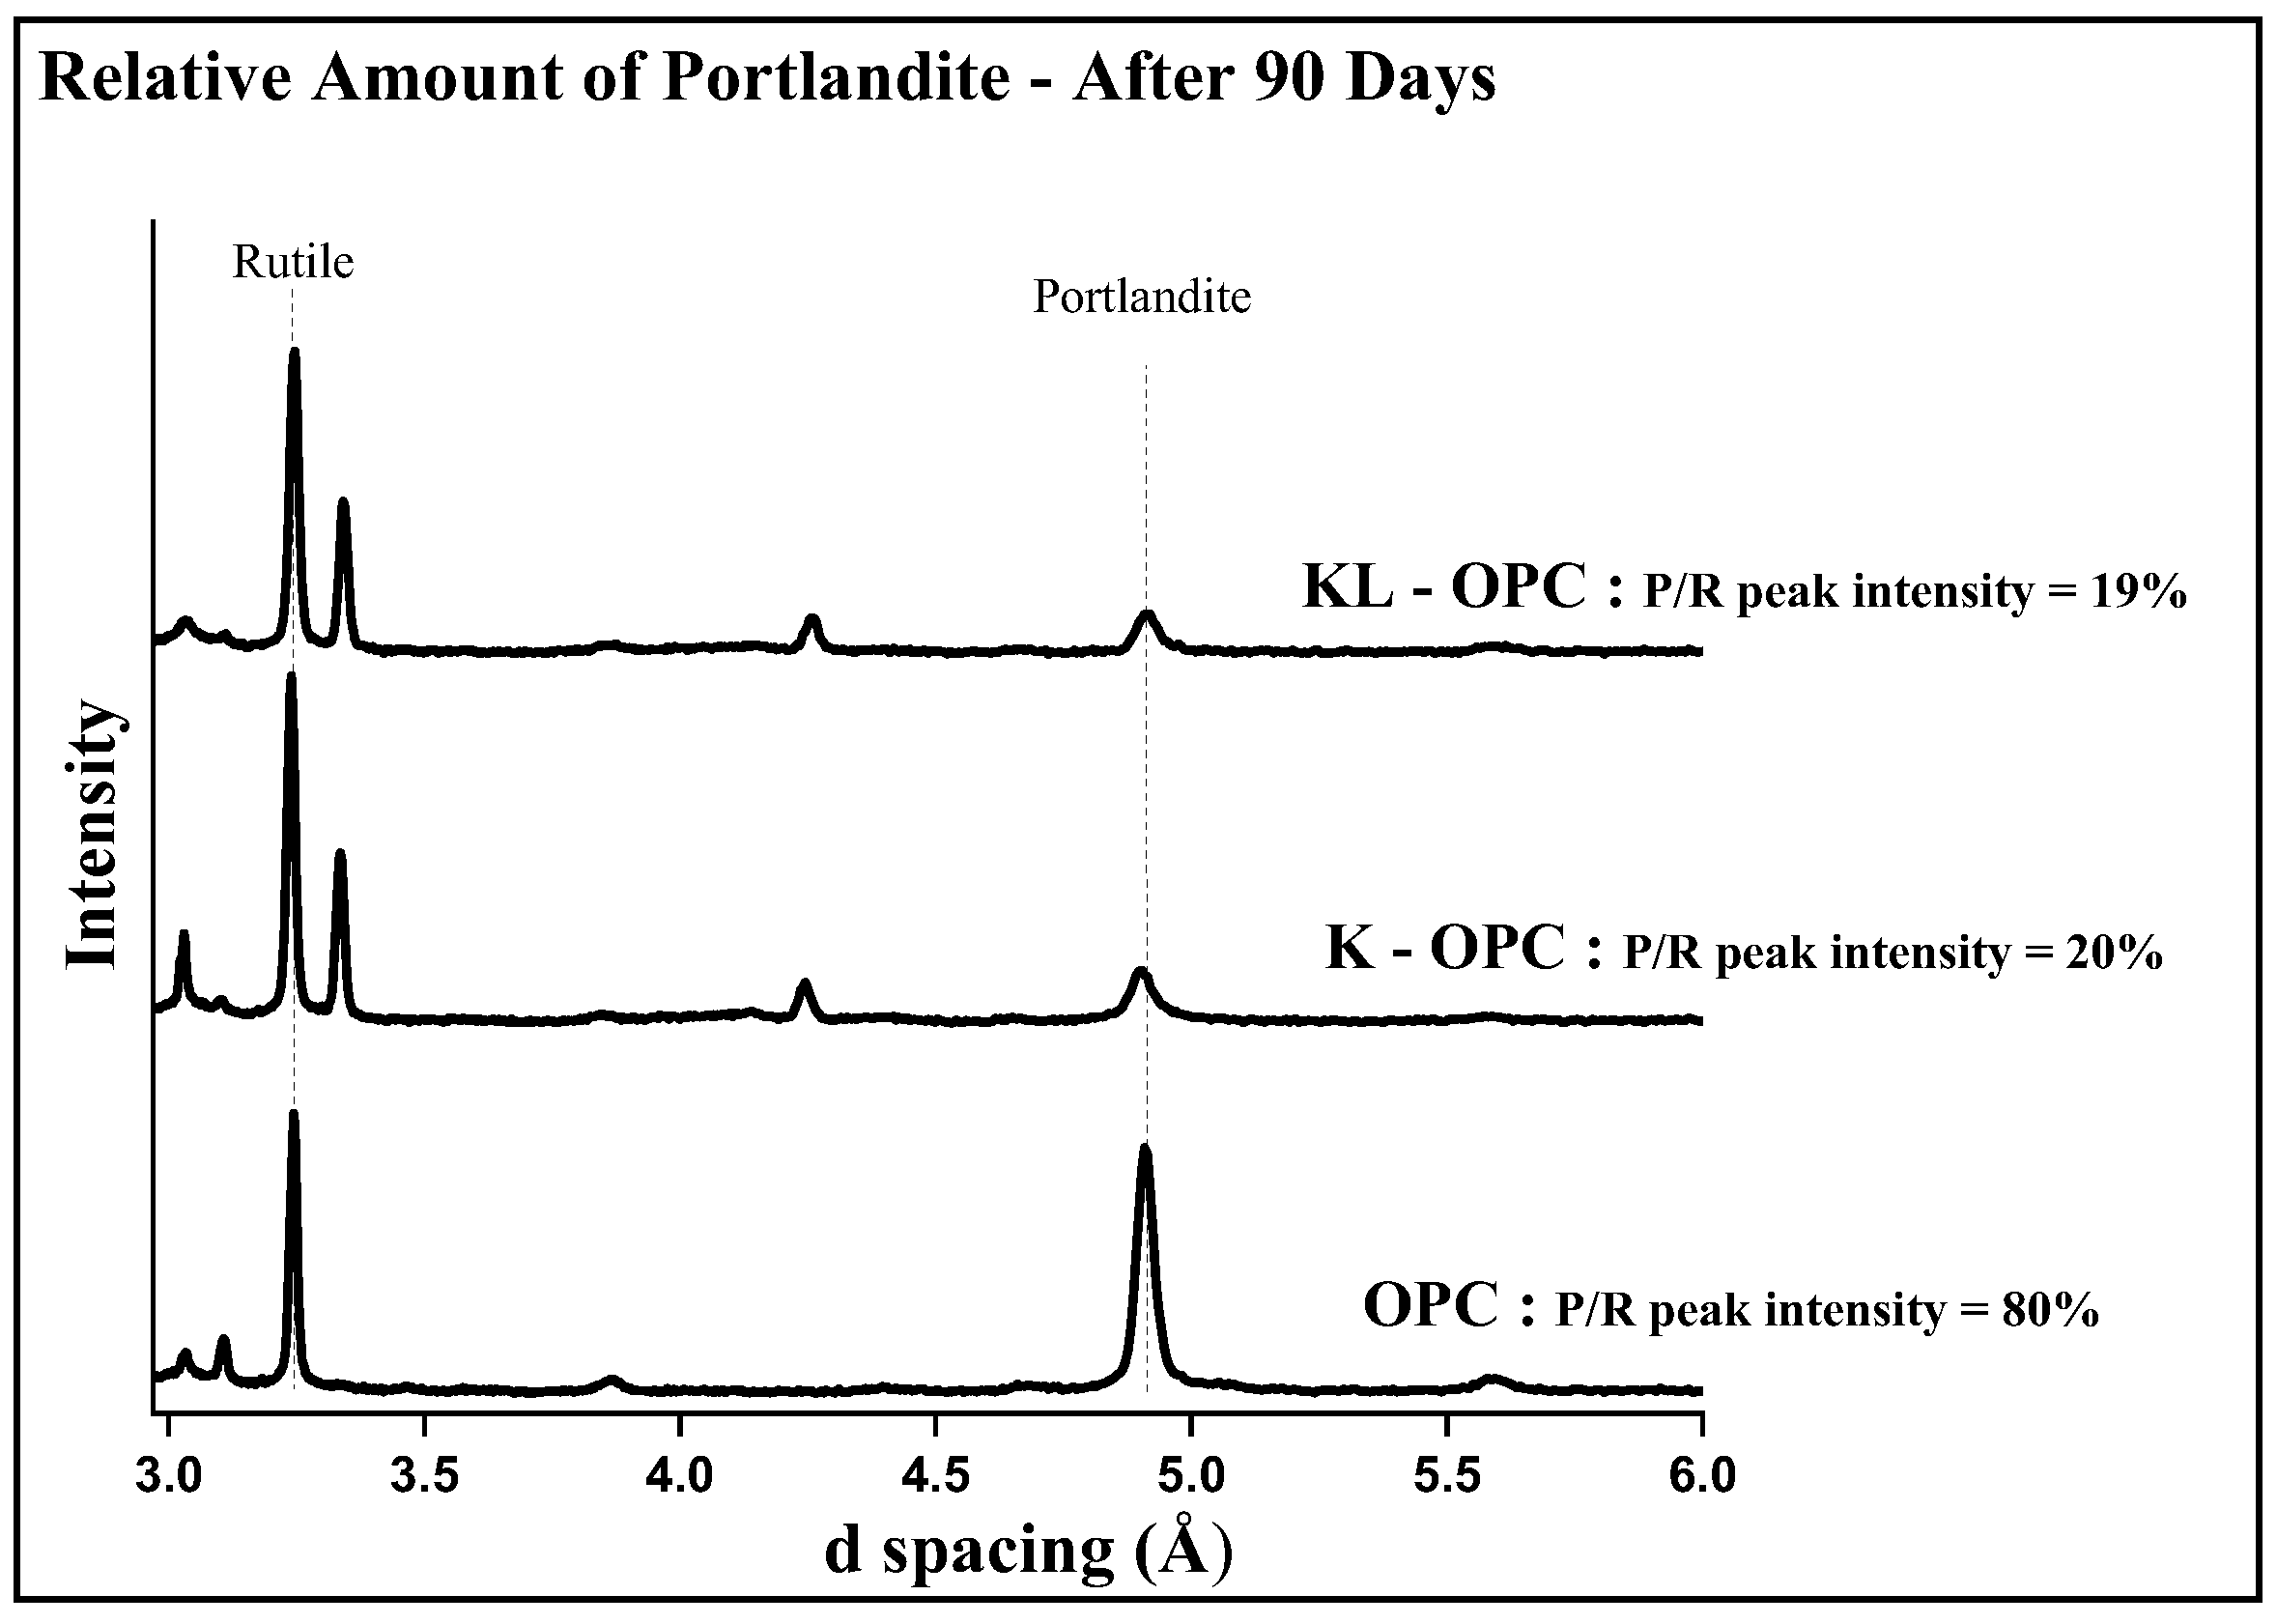
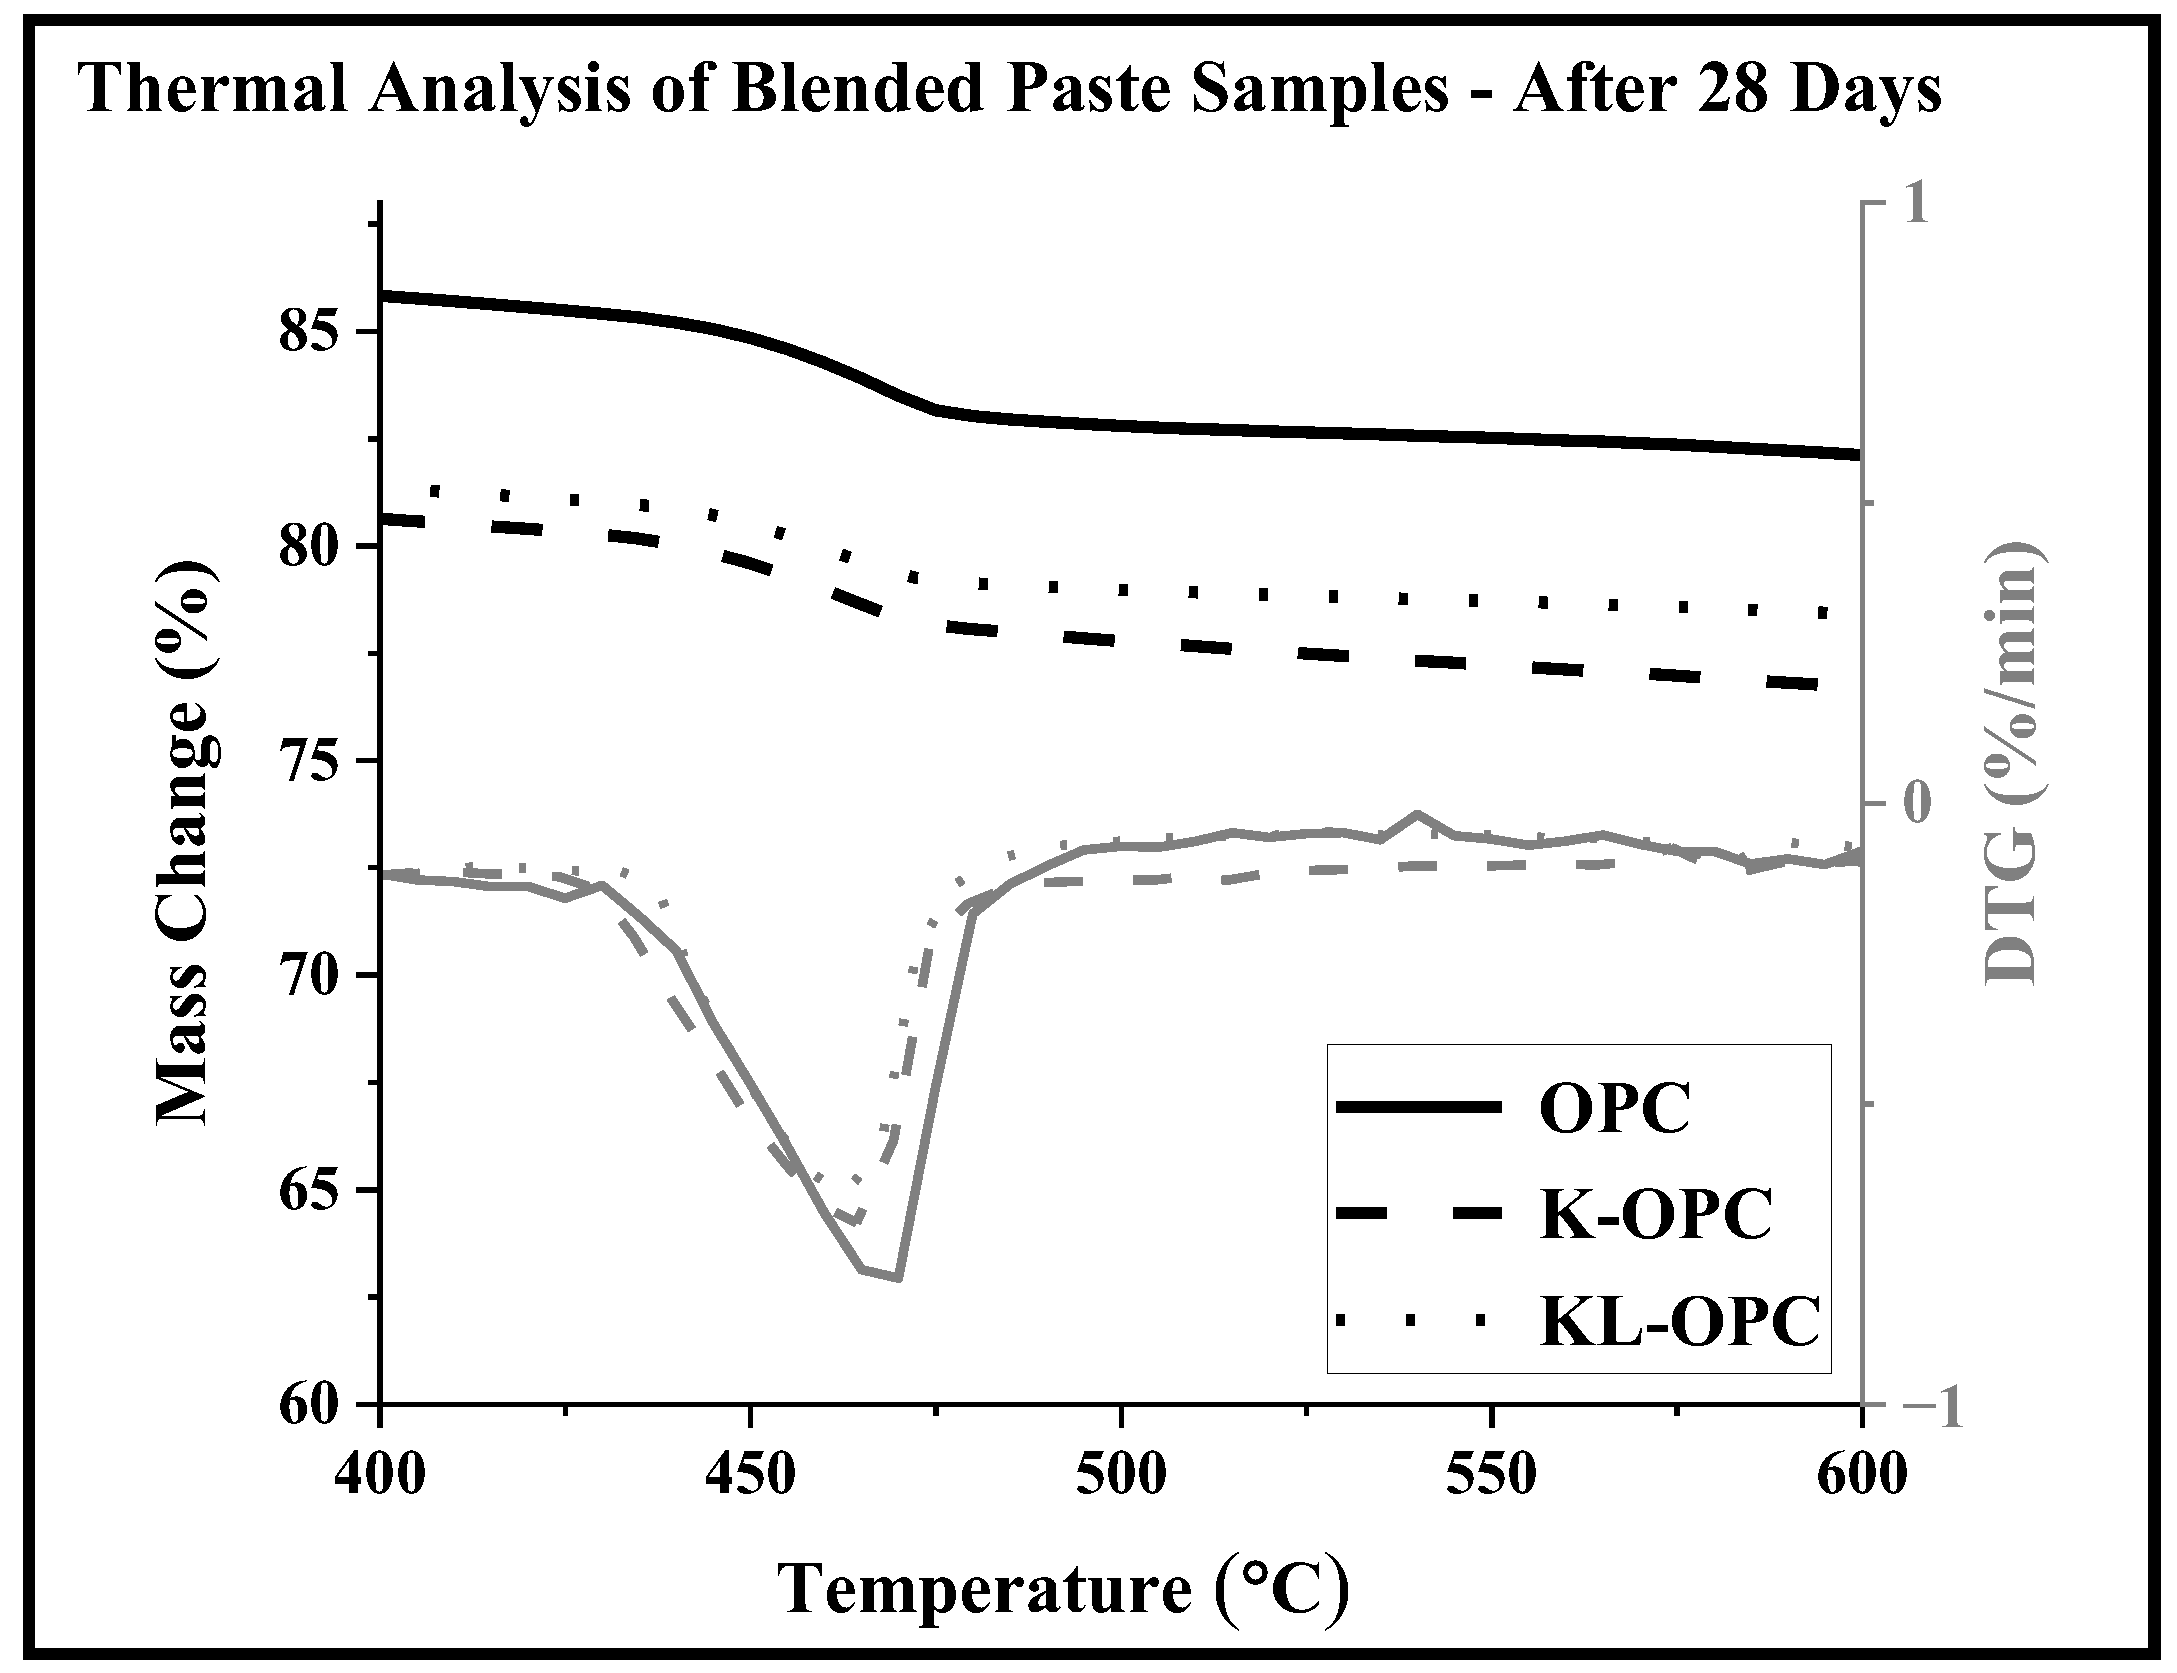
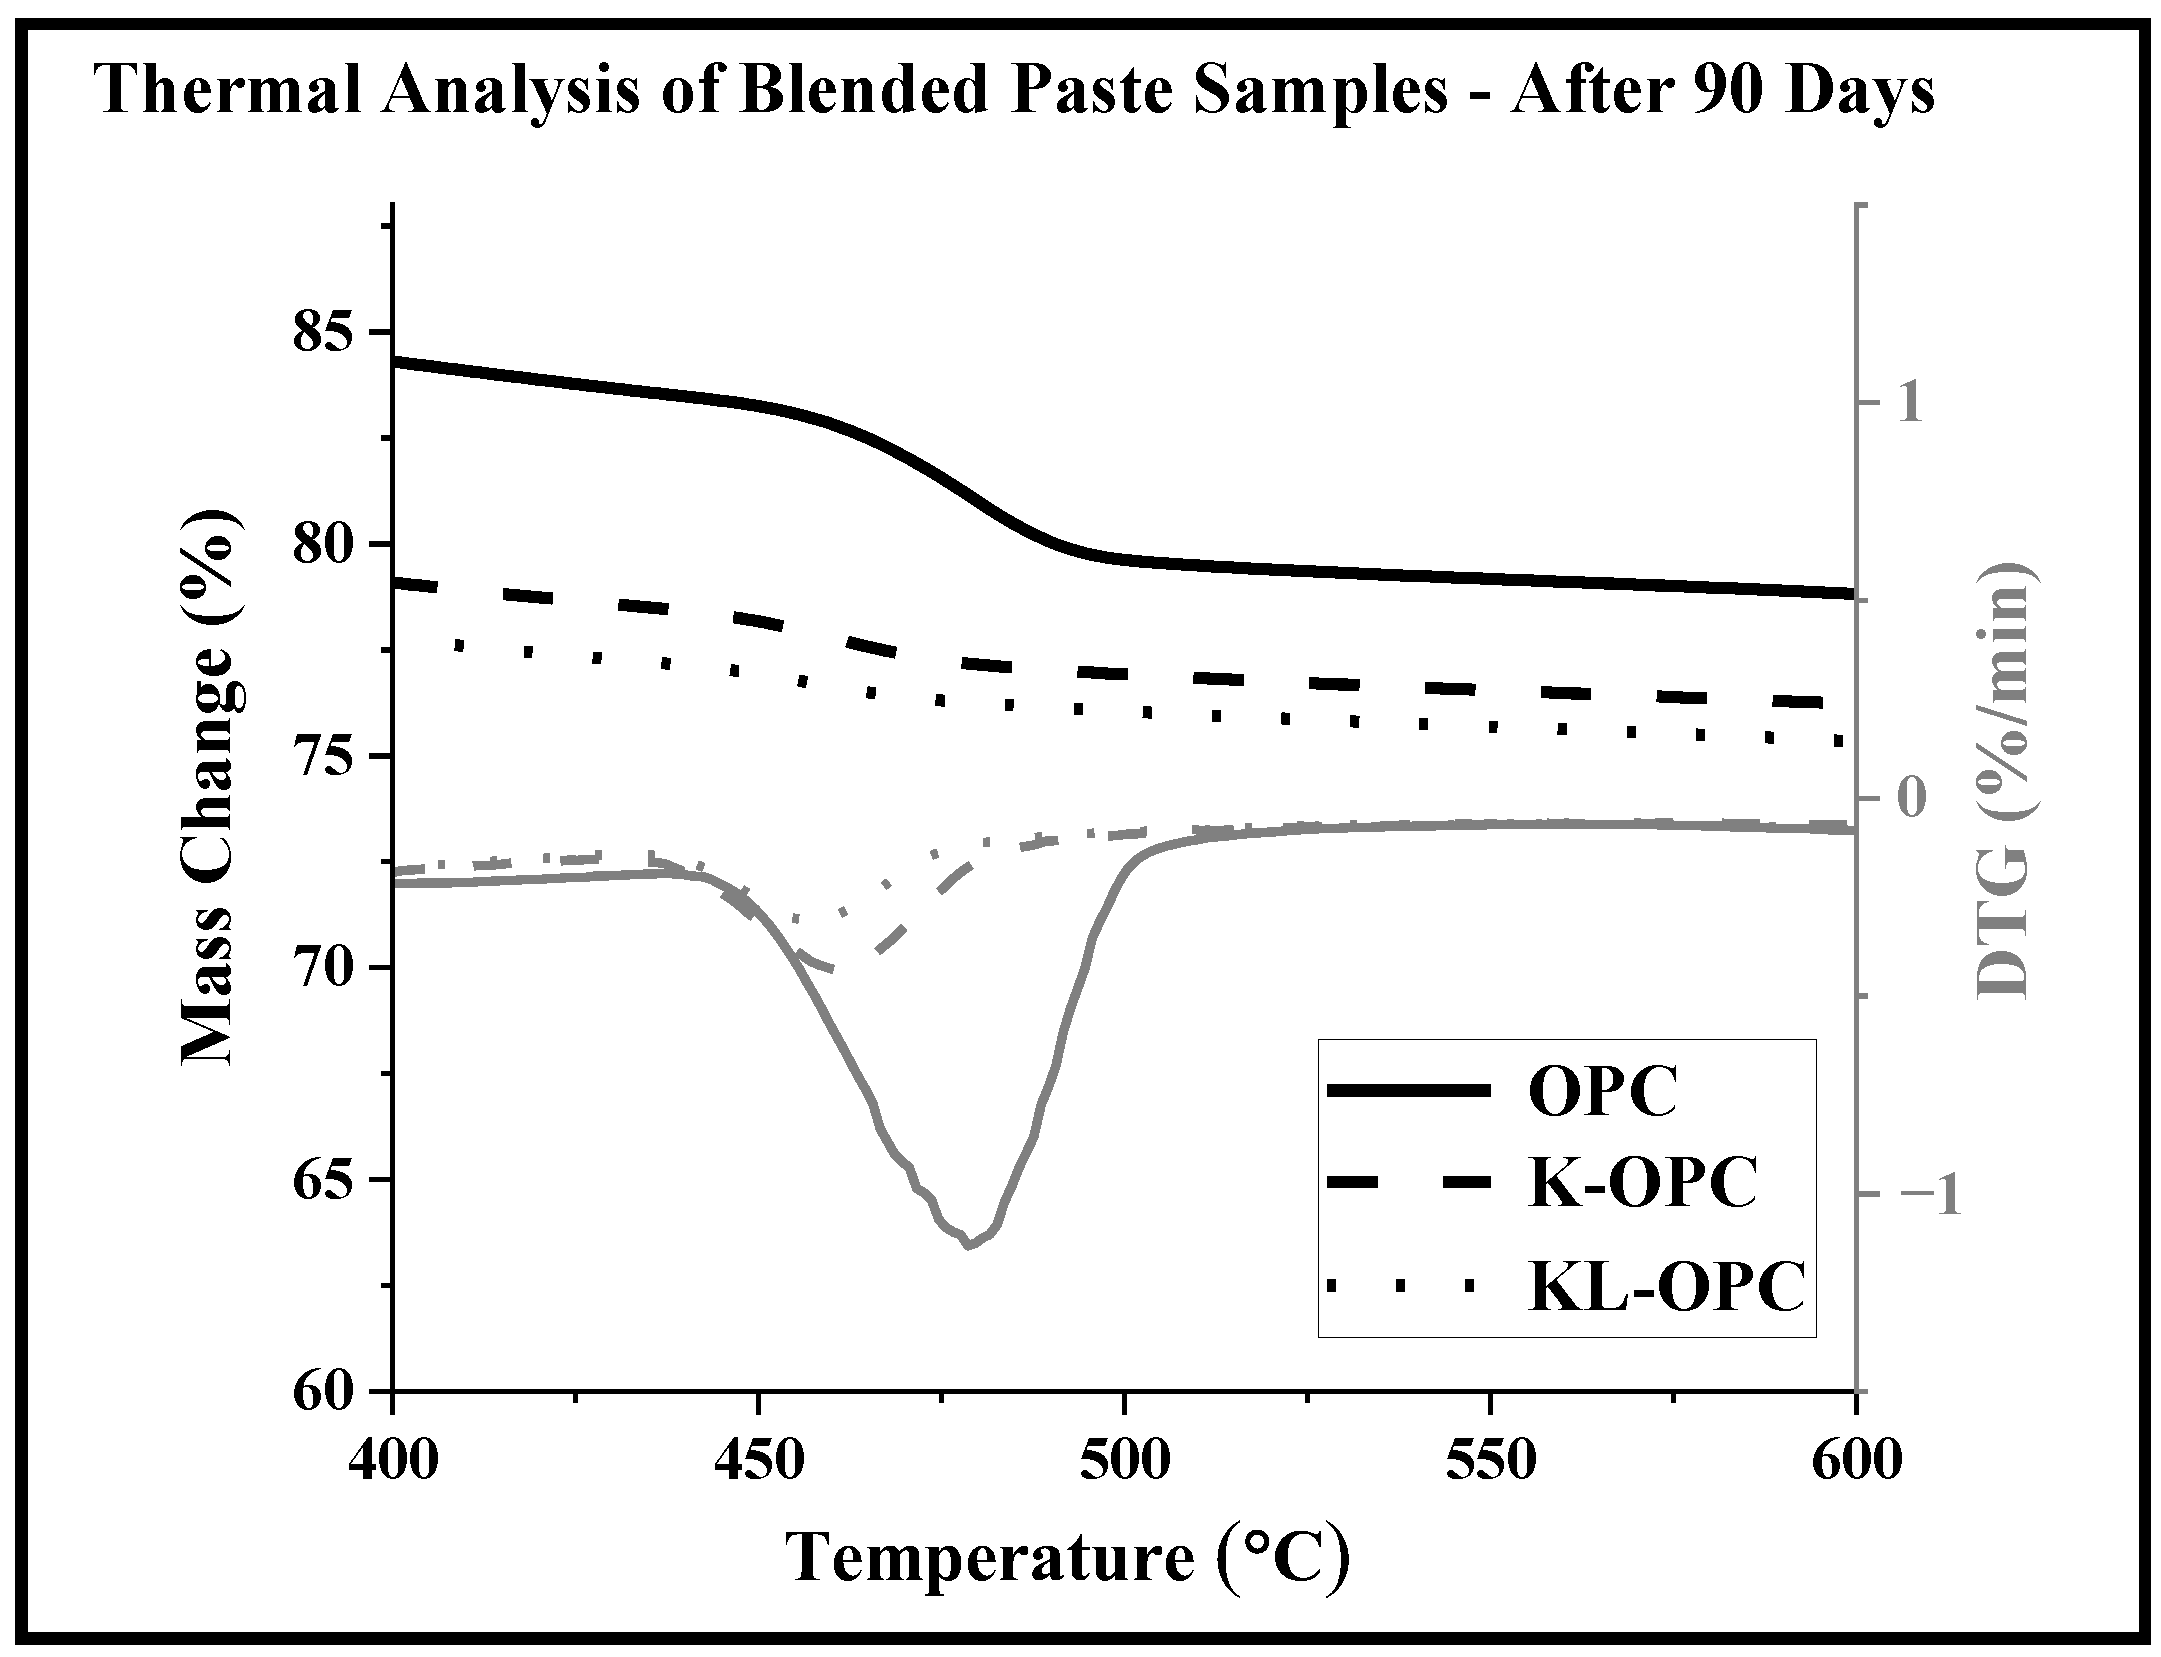
3.3. Amount of Portlandite in Blended Cement Paste Samples

The relative amount of Portlandite in blended cement pastes was measured by using XRD, with rutile added as an external standard reference [49]. Since the amount of rutile was fixed in the three samples, it was possible to compare the amount of Portlandite in the blended pastes by calculating the peak intensity ratio of Portlandite/rutile [49]. Figure 3 and Figure 4 show the main peaks of rutile and Portlandite in the XRD diffractograms of OPC and blended cement pastes. The Portlandite/rutile peak intensity ratio in each sample was also calculated and shown. These calculations indicated a significant decrease in the Portlandite content in the blended pastes, when compared to that in the OPC paste. In addition, the calculations showed that the amount of Portlandite in KL-OPC was less than in K-OPC samples. Therefore, it was concluded that calcined KL showed a better pozzolanic reactivity than calcined K at both 28 and 90 days.
The amount of Portlandite in hydrated blends and reference OPC paste was also measured by using thermogravimetric analysis and quantified from the dehydration weight loss between 400–500 °C, using the tangent method [49]. The quantification results of all samples are summarized in Table 4. Amount of Portlandite after 28 and 90 days in OPC, OPC blended with calcined kaolinite (K-OPC), and OPC blended with calcined kaolinite/limestone (KL-OPC) pastes, obtained from the TGA-determined weight loss amounts. There was a small decrease in Portlandite content in the blended pastes (compared to OPC paste) after 28 days. However, these two samples (K-OPC and KL-OPC) showed a remarkable pozzolanic reactivity at 90 days, such that there was a significant consumption of Portlandite in these samples compared to the pure OPC paste. These measurements confirmed that the KL-OPC blend showed better pozzolanic reactivity than K-OPC at both 28 and 90 days. Figure 5 and Figure 6 present the TGA and derivative of TGA (DTG) diagrams of all three samples after 28 and 90 days.

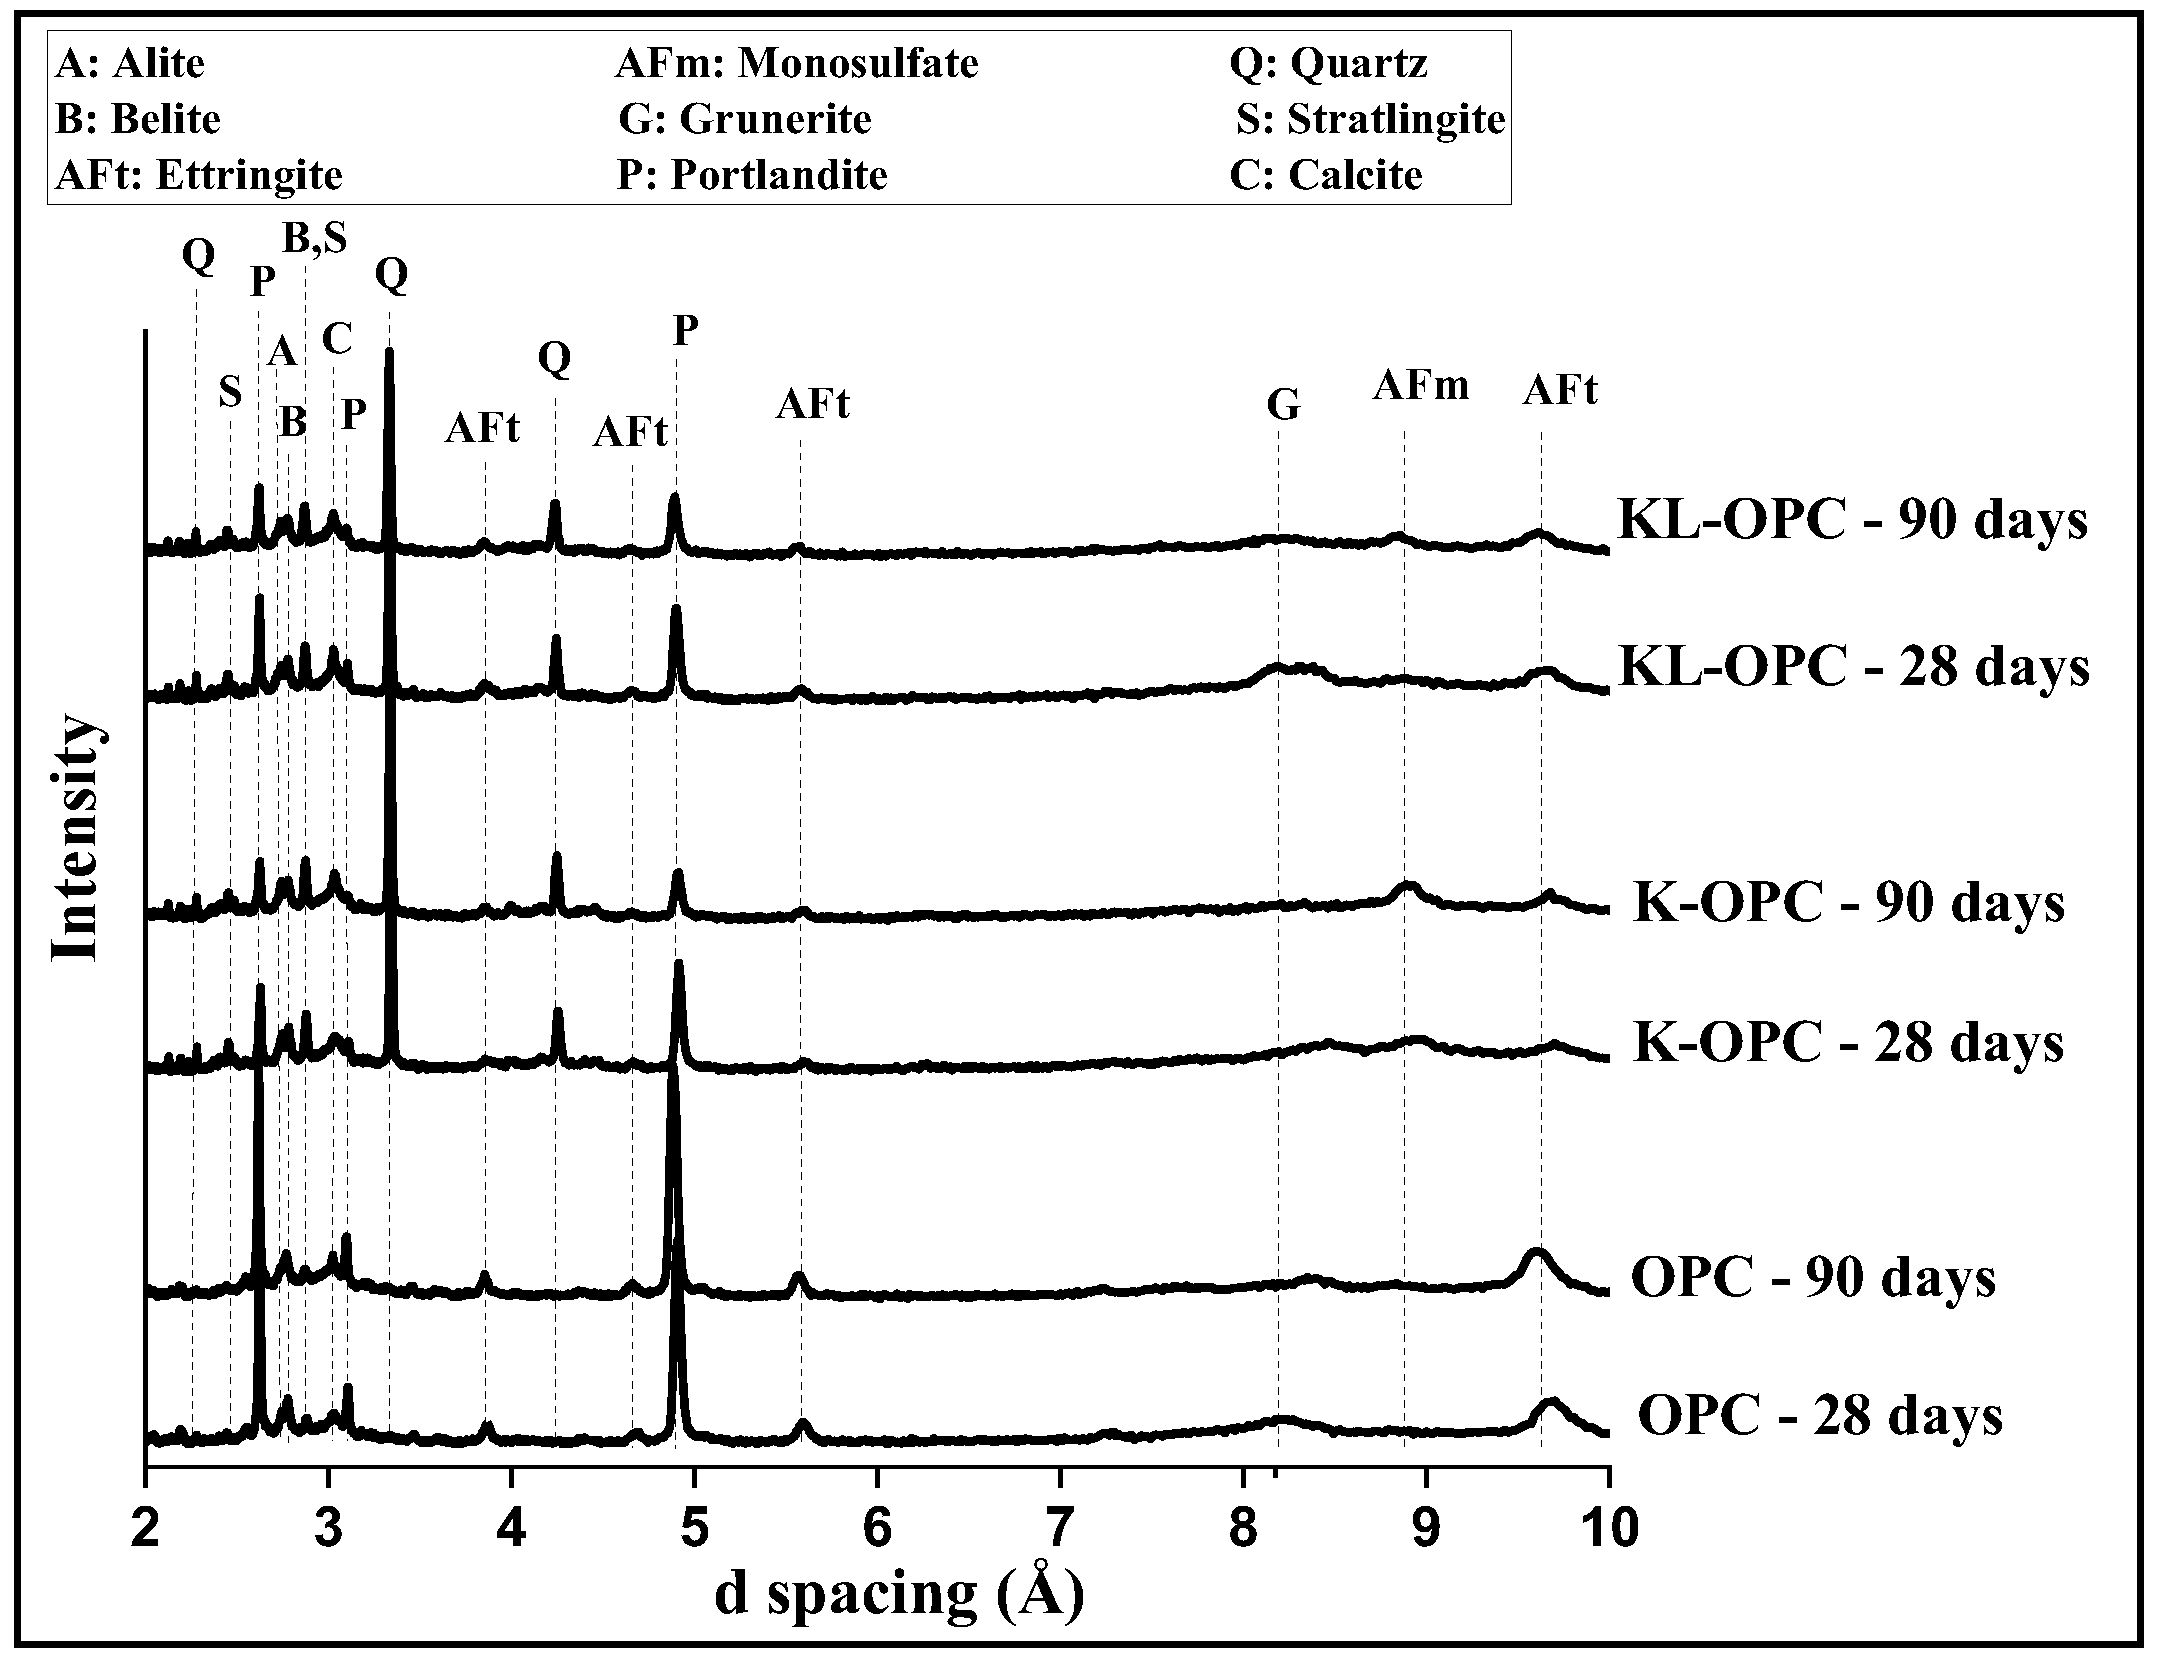
3.4. Hydration Products of Blended Cement Paste Samples

To determine the phase composition of the hydrated samples, the OPC and blended cement pastes were analyzed using XRD. First, the amorphous vs. crystalline content of each sample was determined. The amount of each crystalline phase was also quantified with Rietveld analysis. It should be noted that no external standard reference (rutile) was used in these measurements.
Table 5 summarizes the results of Rietveld quantitative analysis of the XRD data. Quantitative phase analysis of the diffractograms (shown in Figure 7) revealed a decrease in ettringite content by the addition of SCMs to the OPC paste after both 28 and 90 days. The rate of this decrease in the K-OPC paste was slightly higher than in the KL-OPC after 28 and 90 days. The amount of monosulfate (aFm) phase increased with the decrease in ettringite, as expected. The results showed that the maximum amount of monosulfate phase was found in K-OPC after 28 days, and in KL-OPC after 90 days. Stratlingite (CASH) appeared only in the blended cement pastes. The amount of this phase in the K-OPC and KL-OPC pastes increased as the hydration time increased from 28 to 90 days.

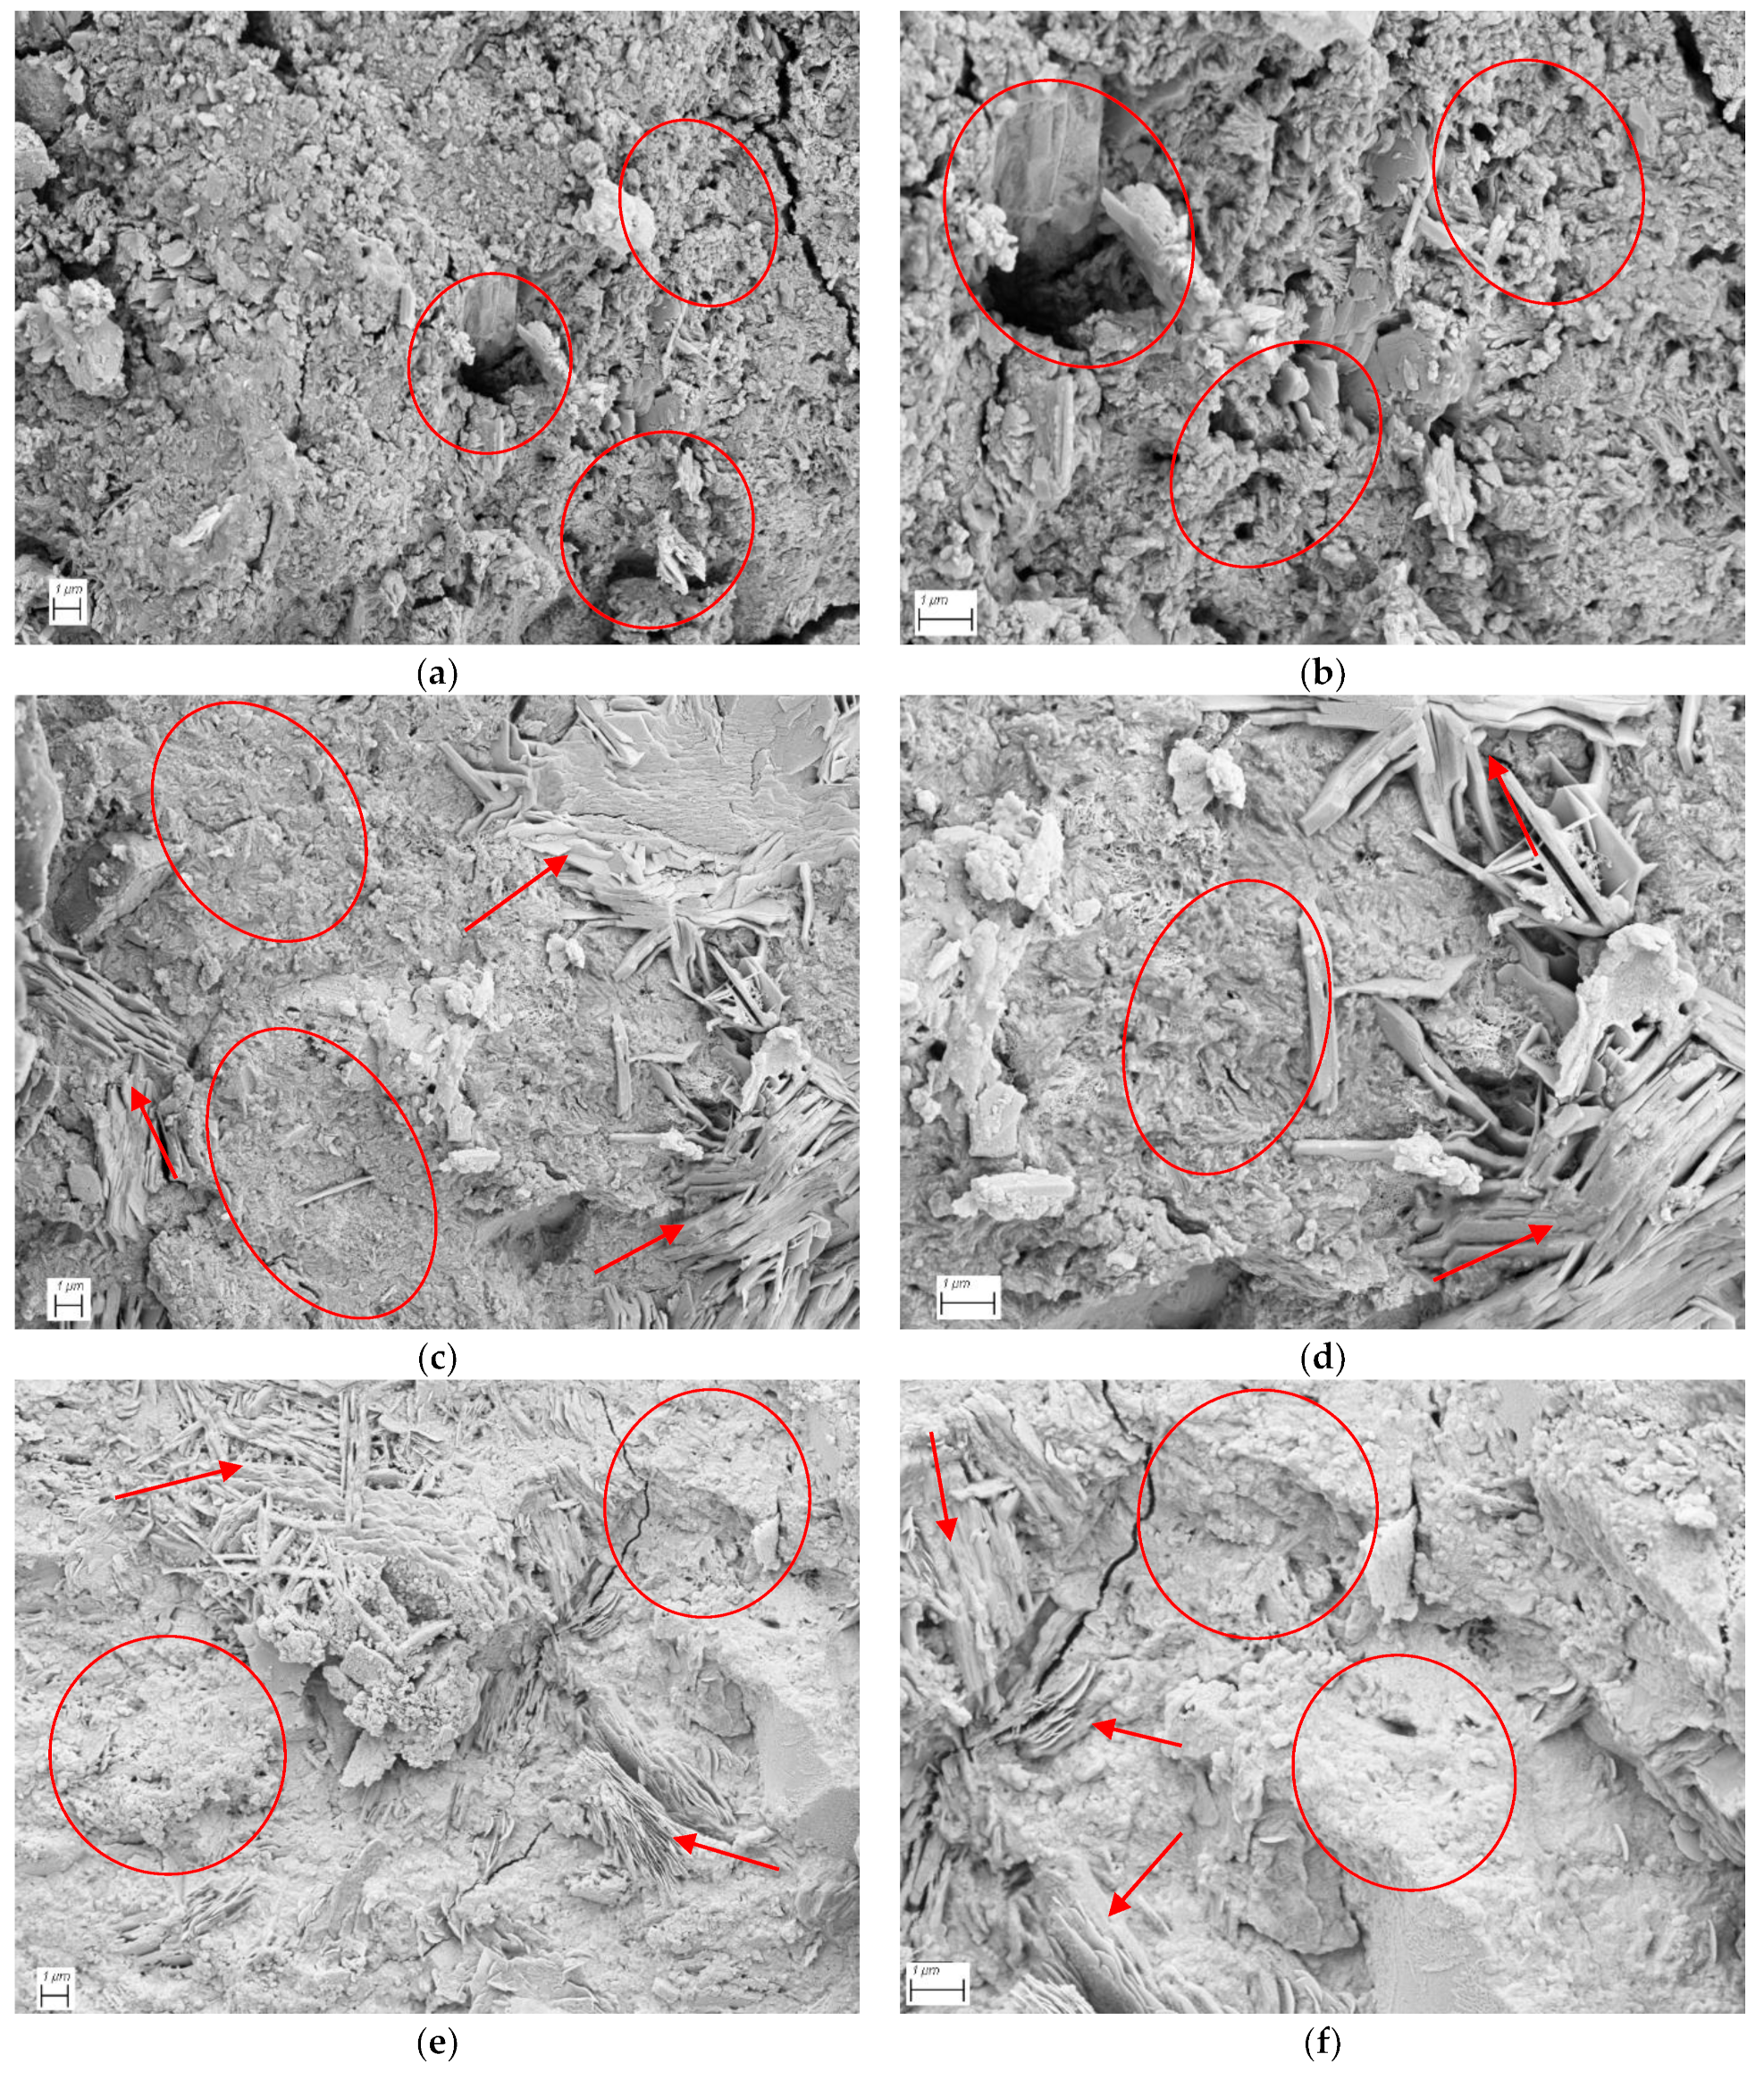
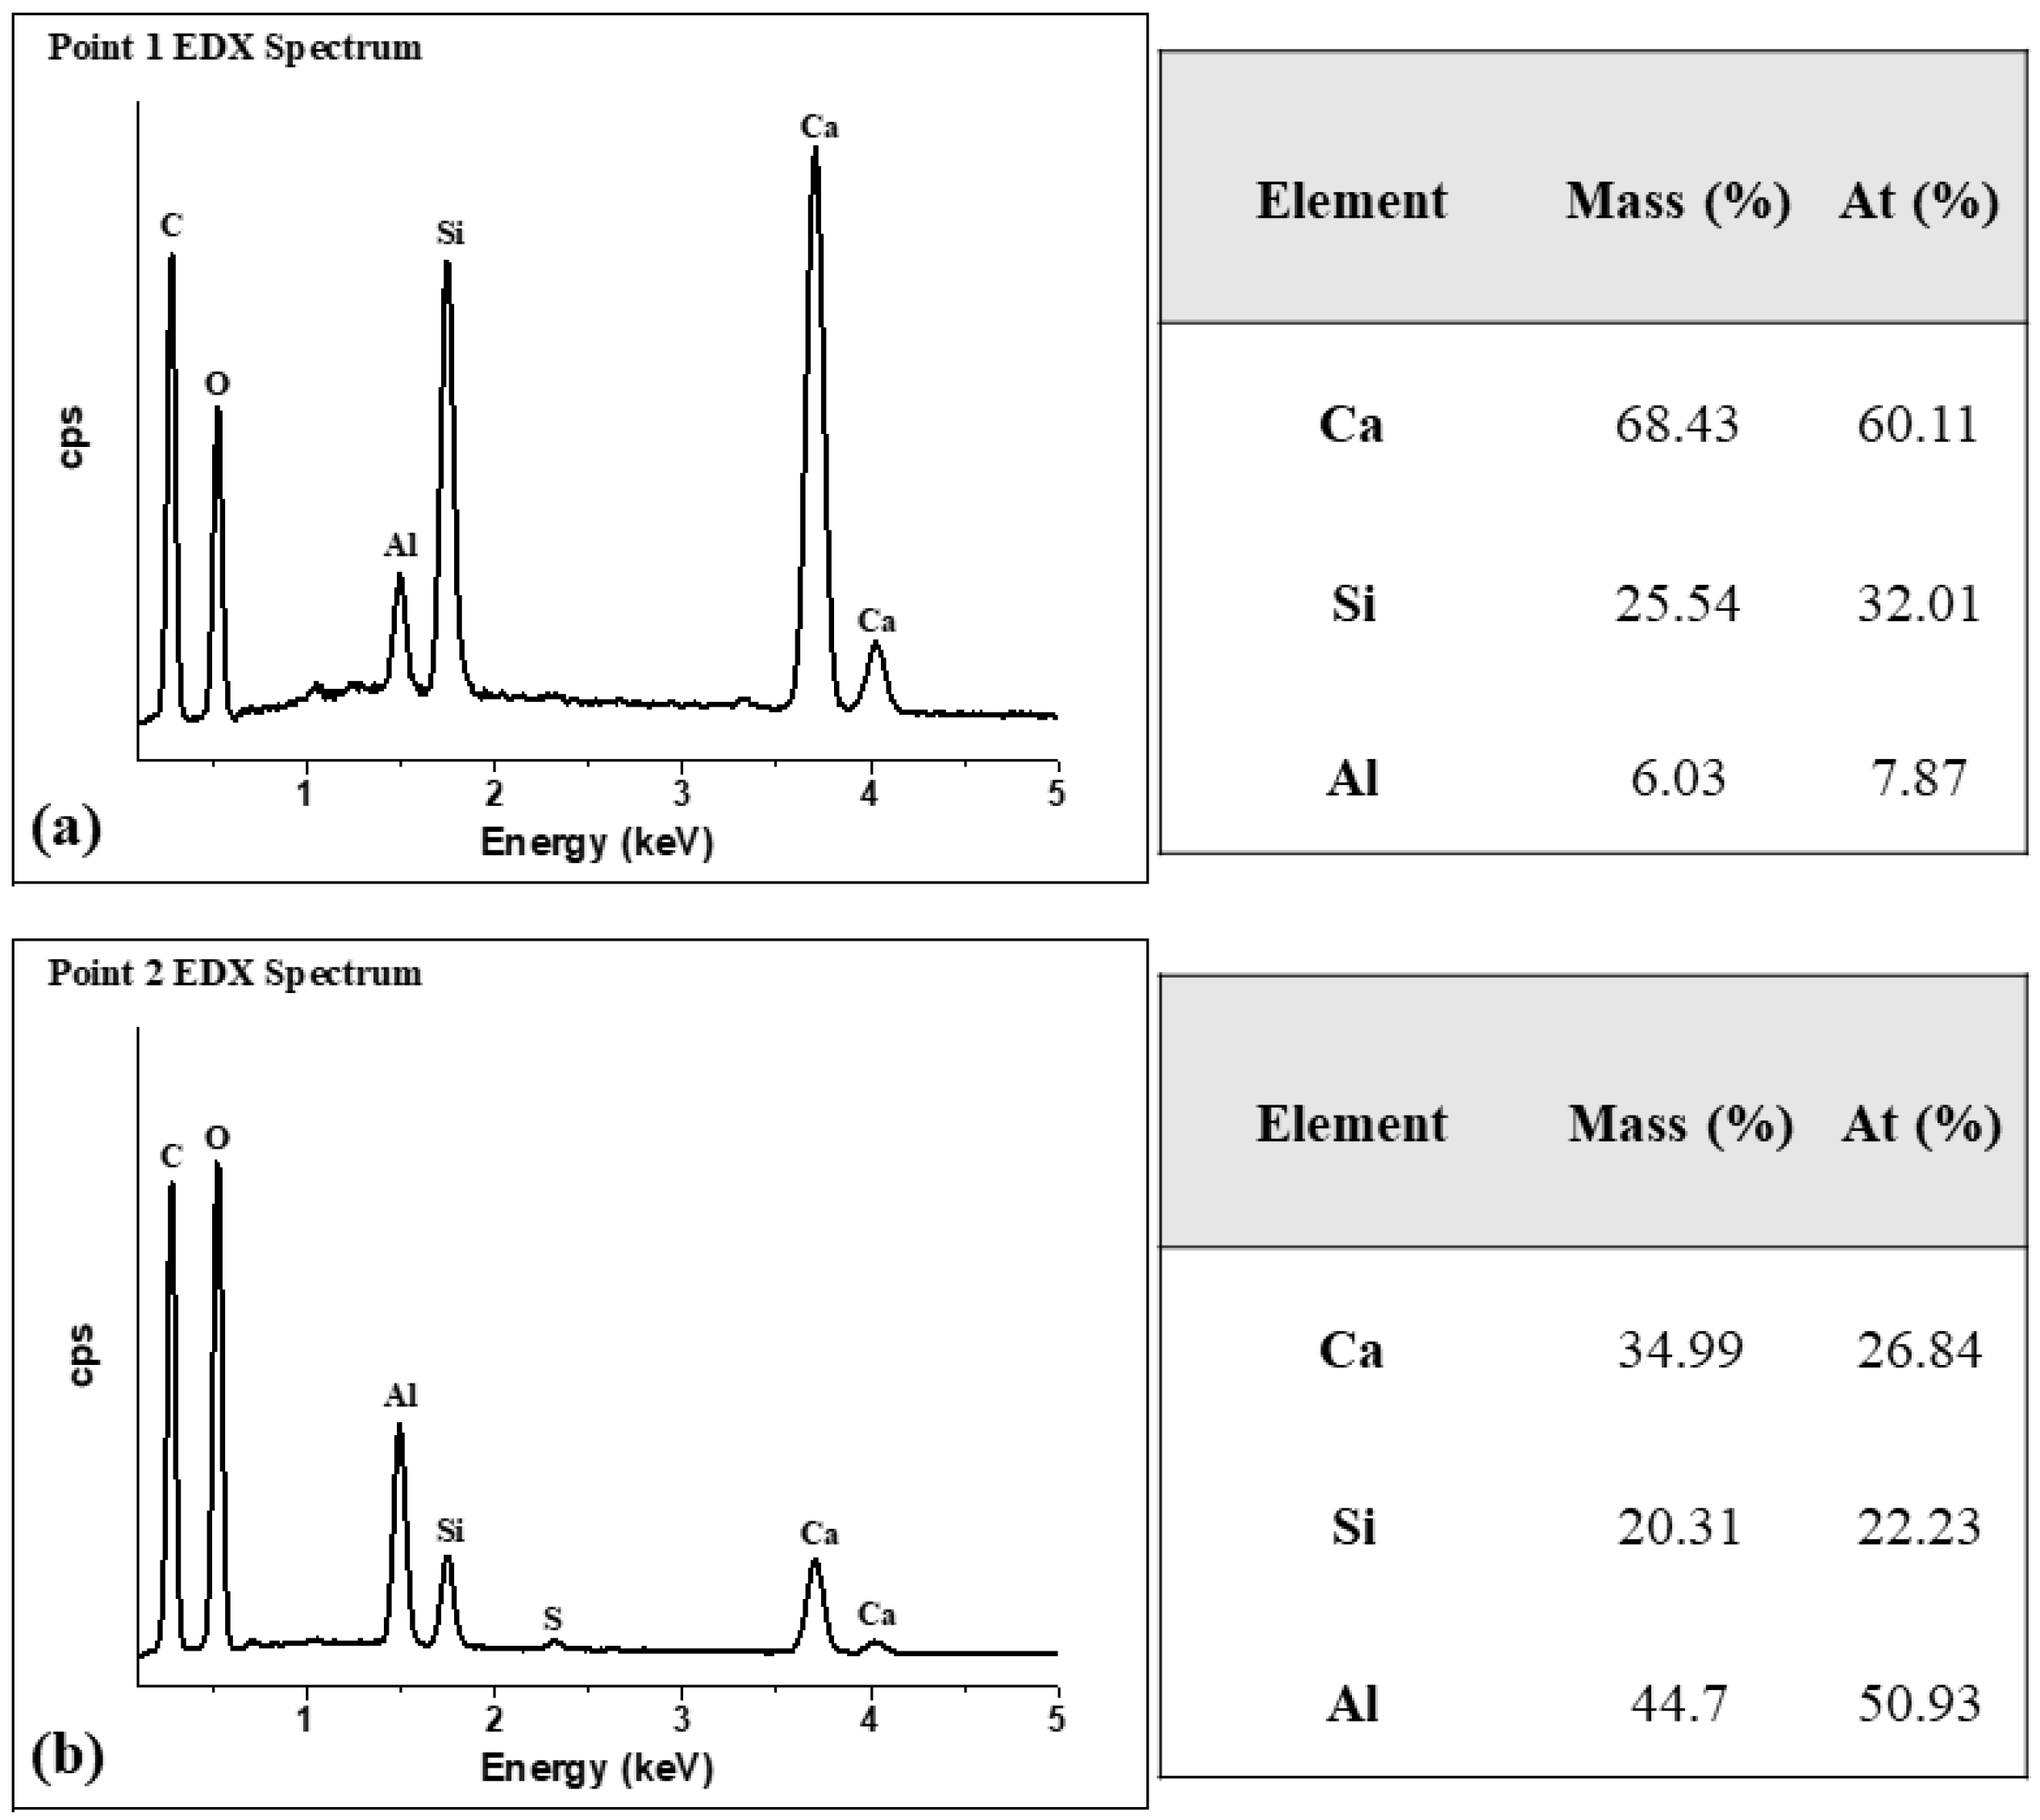
3.5. Evaluating Microstructural Changes Due to Co-Calcined Kaolinite and Limestone in Blended Cement Paste Samples

Figure 8 shows the SEM secondary electron (SE) images of OPC (a,b), K-OPC (c,d), and KL-OPC (e,f) pastes after 90 days of hydration at two different magnifications. The OPC paste images showed the typical CSH formation, which had already developed crystalline regions (late-age CSH) containing significant fine porosity. The microstructure of K-OPC and KL-OPC pastes showed the presence of an additional platy habit phase in addition to CSH, which was identified as CASH through EDS analysis. Moreover, both SCM-blended samples—i.e., K-OPC and KL-OPC—had a much smoother surface—i.e., less porosity—than the OPC one. In particular, in the KL-OPC sample, the macropores (i.e., pores with diameter >1 μm) occupied half of the area fraction observed in pure OPC or K-OPC microstructures.
To confirm the assumption that the platy grains in K-OPC and KL-OPC microstructures were CASH, EDS elemental analysis was performed on the KL-OPC sample containing both CSH and CASH. Two regions with different morphologies, as indicated with circles labeled with point 1 and point 2 in Figure 9, were analyzed to elucidate their chemistry. Figure 10 shows the EDS spectra and the relative amounts of Ca, Si and Al at (a) point 1 (CSH) and (b) point 2 (CASH). The Al/Si ratio was 0.24 at point 1 and 2.29 at point 2. The significant amount of Al at point 2 with platy morphology confirmed the existance of CASH in the microstructure. The Ca/Si and Ca/Al ratios at point 1 were calculated as 1.87 and 7.63, respectively. These ratios were also calculated for platy region at point 2 as 1.2 and 0.53, respectively.

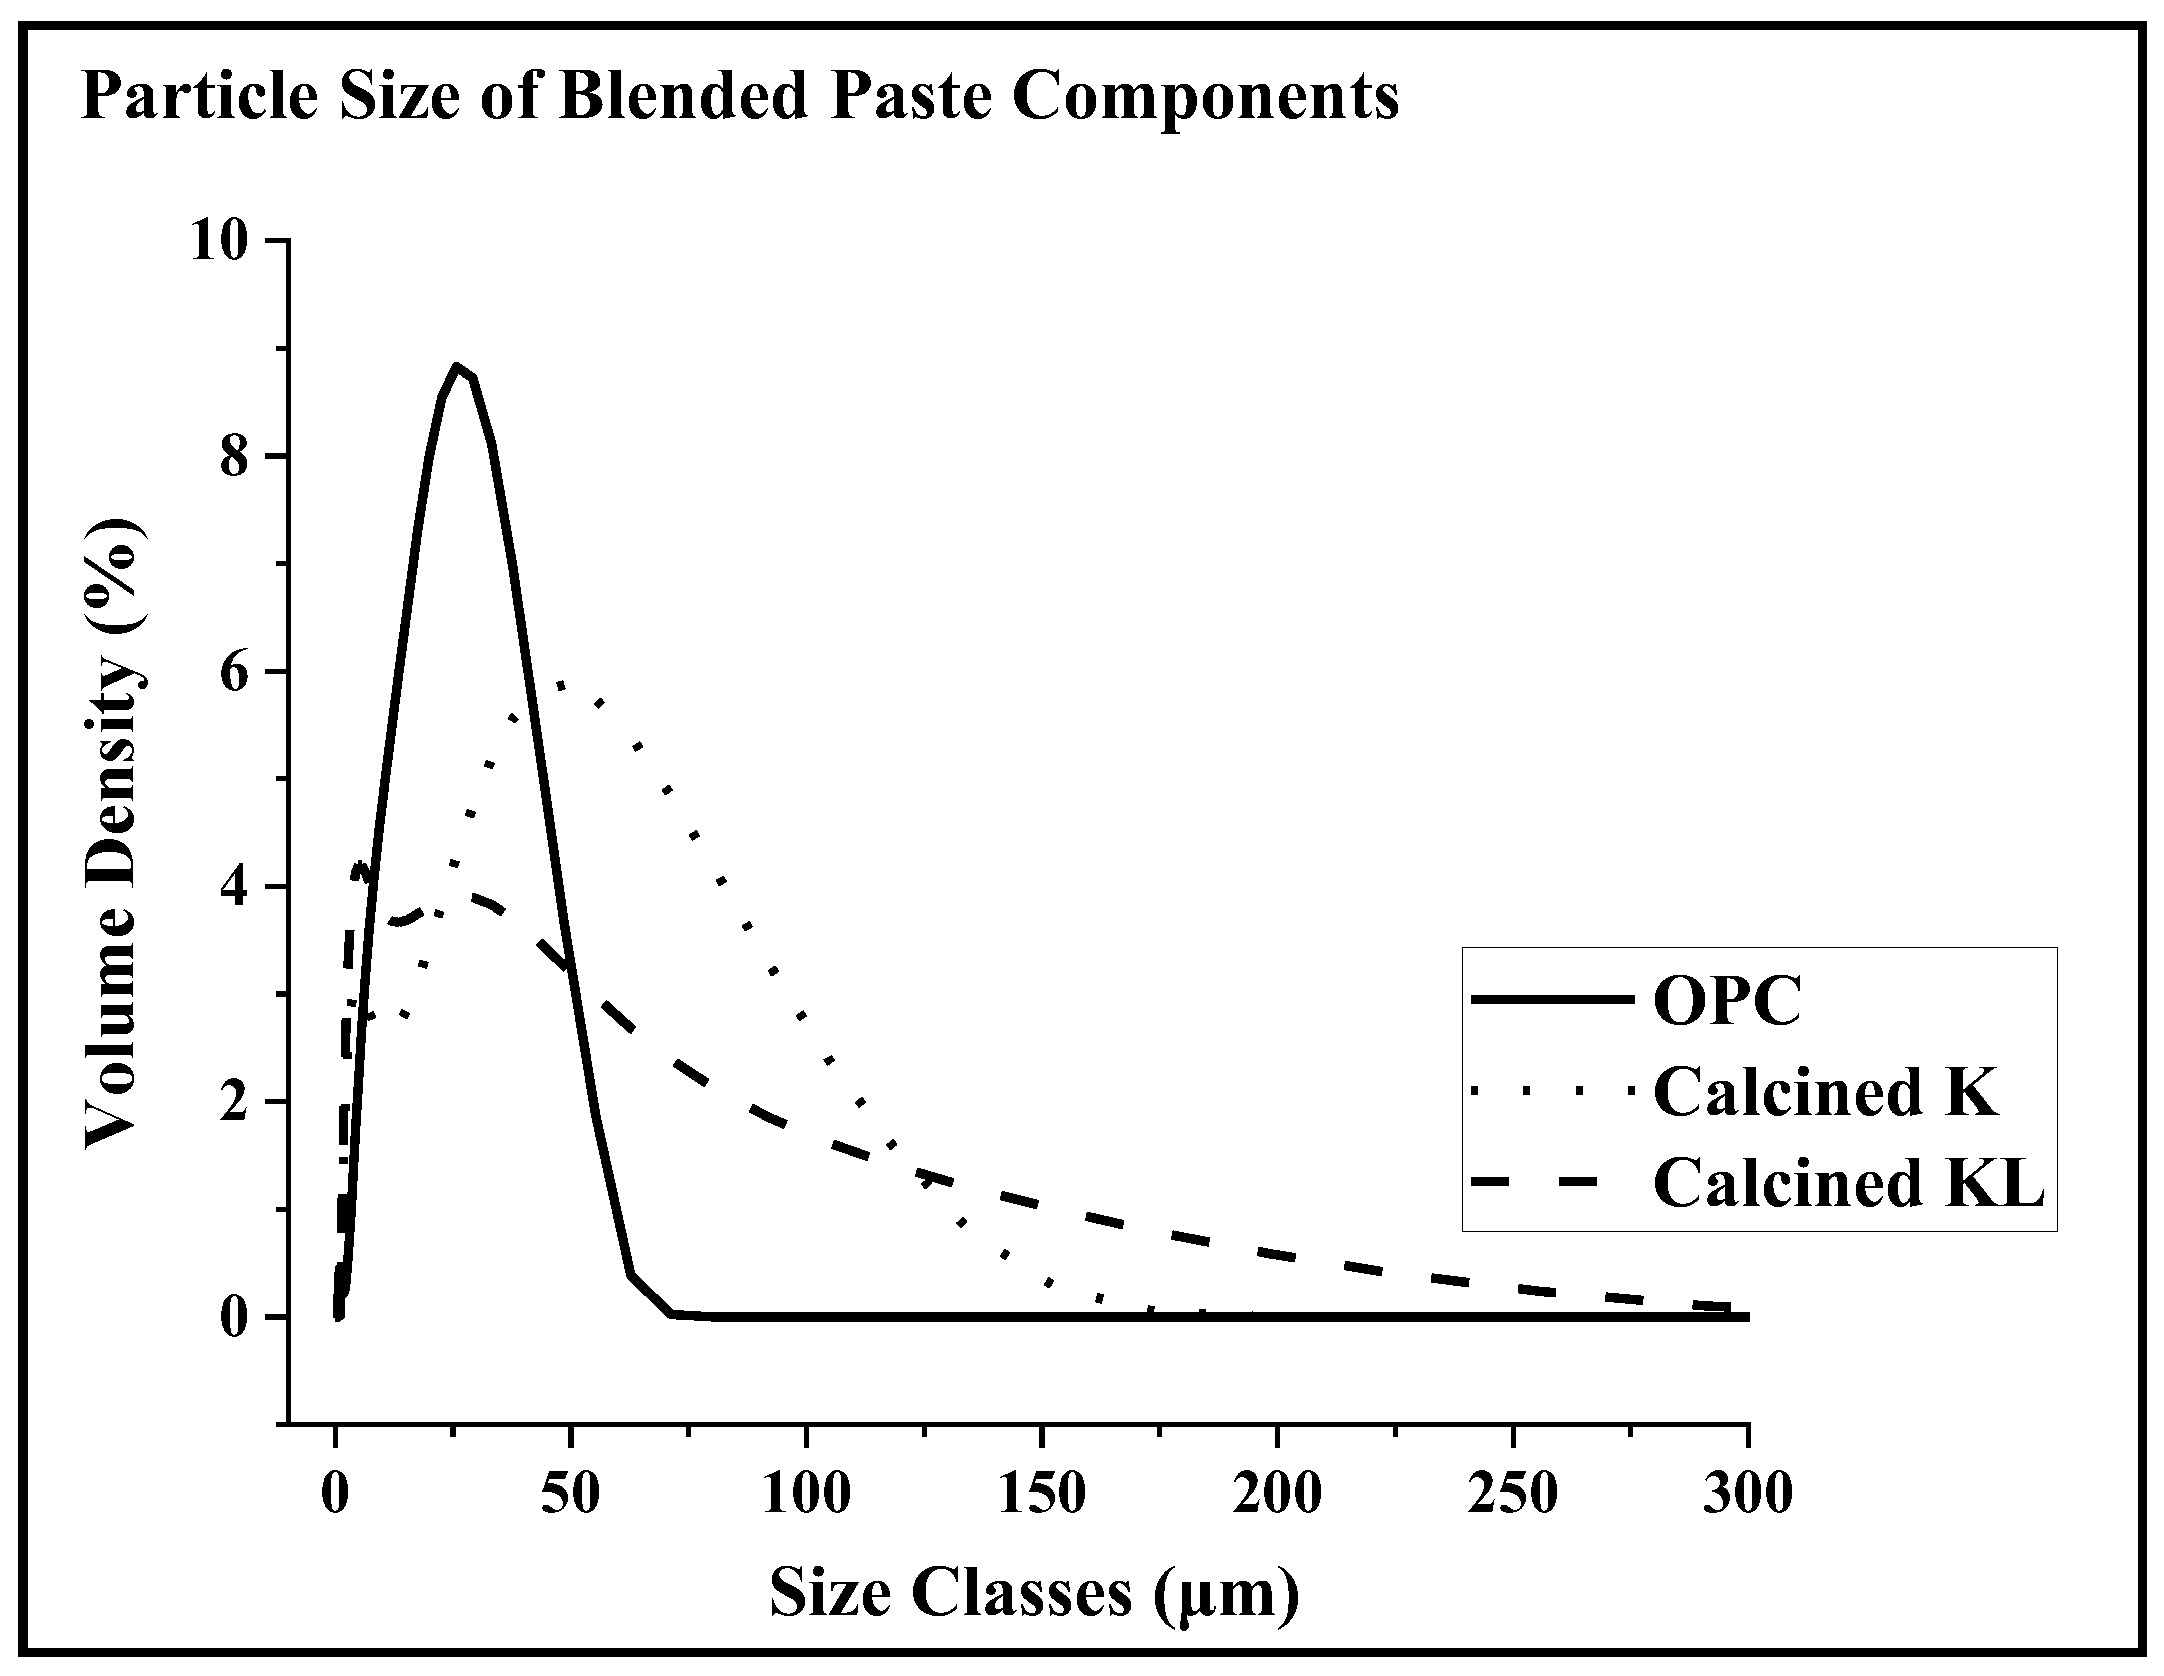
3.6. Particle Size Analysis of Calcined SCM Samples

Particle size analyses of OPC, calcined K, and calcined KL powders indicated that all ingredients of the blended cement paste samples had similar particle size distributions, as shown in Figure 11. The particle size distribution of an SCM impacts the amount of absorbed water and, consequently, the compressive strength of blended cement paste samples.

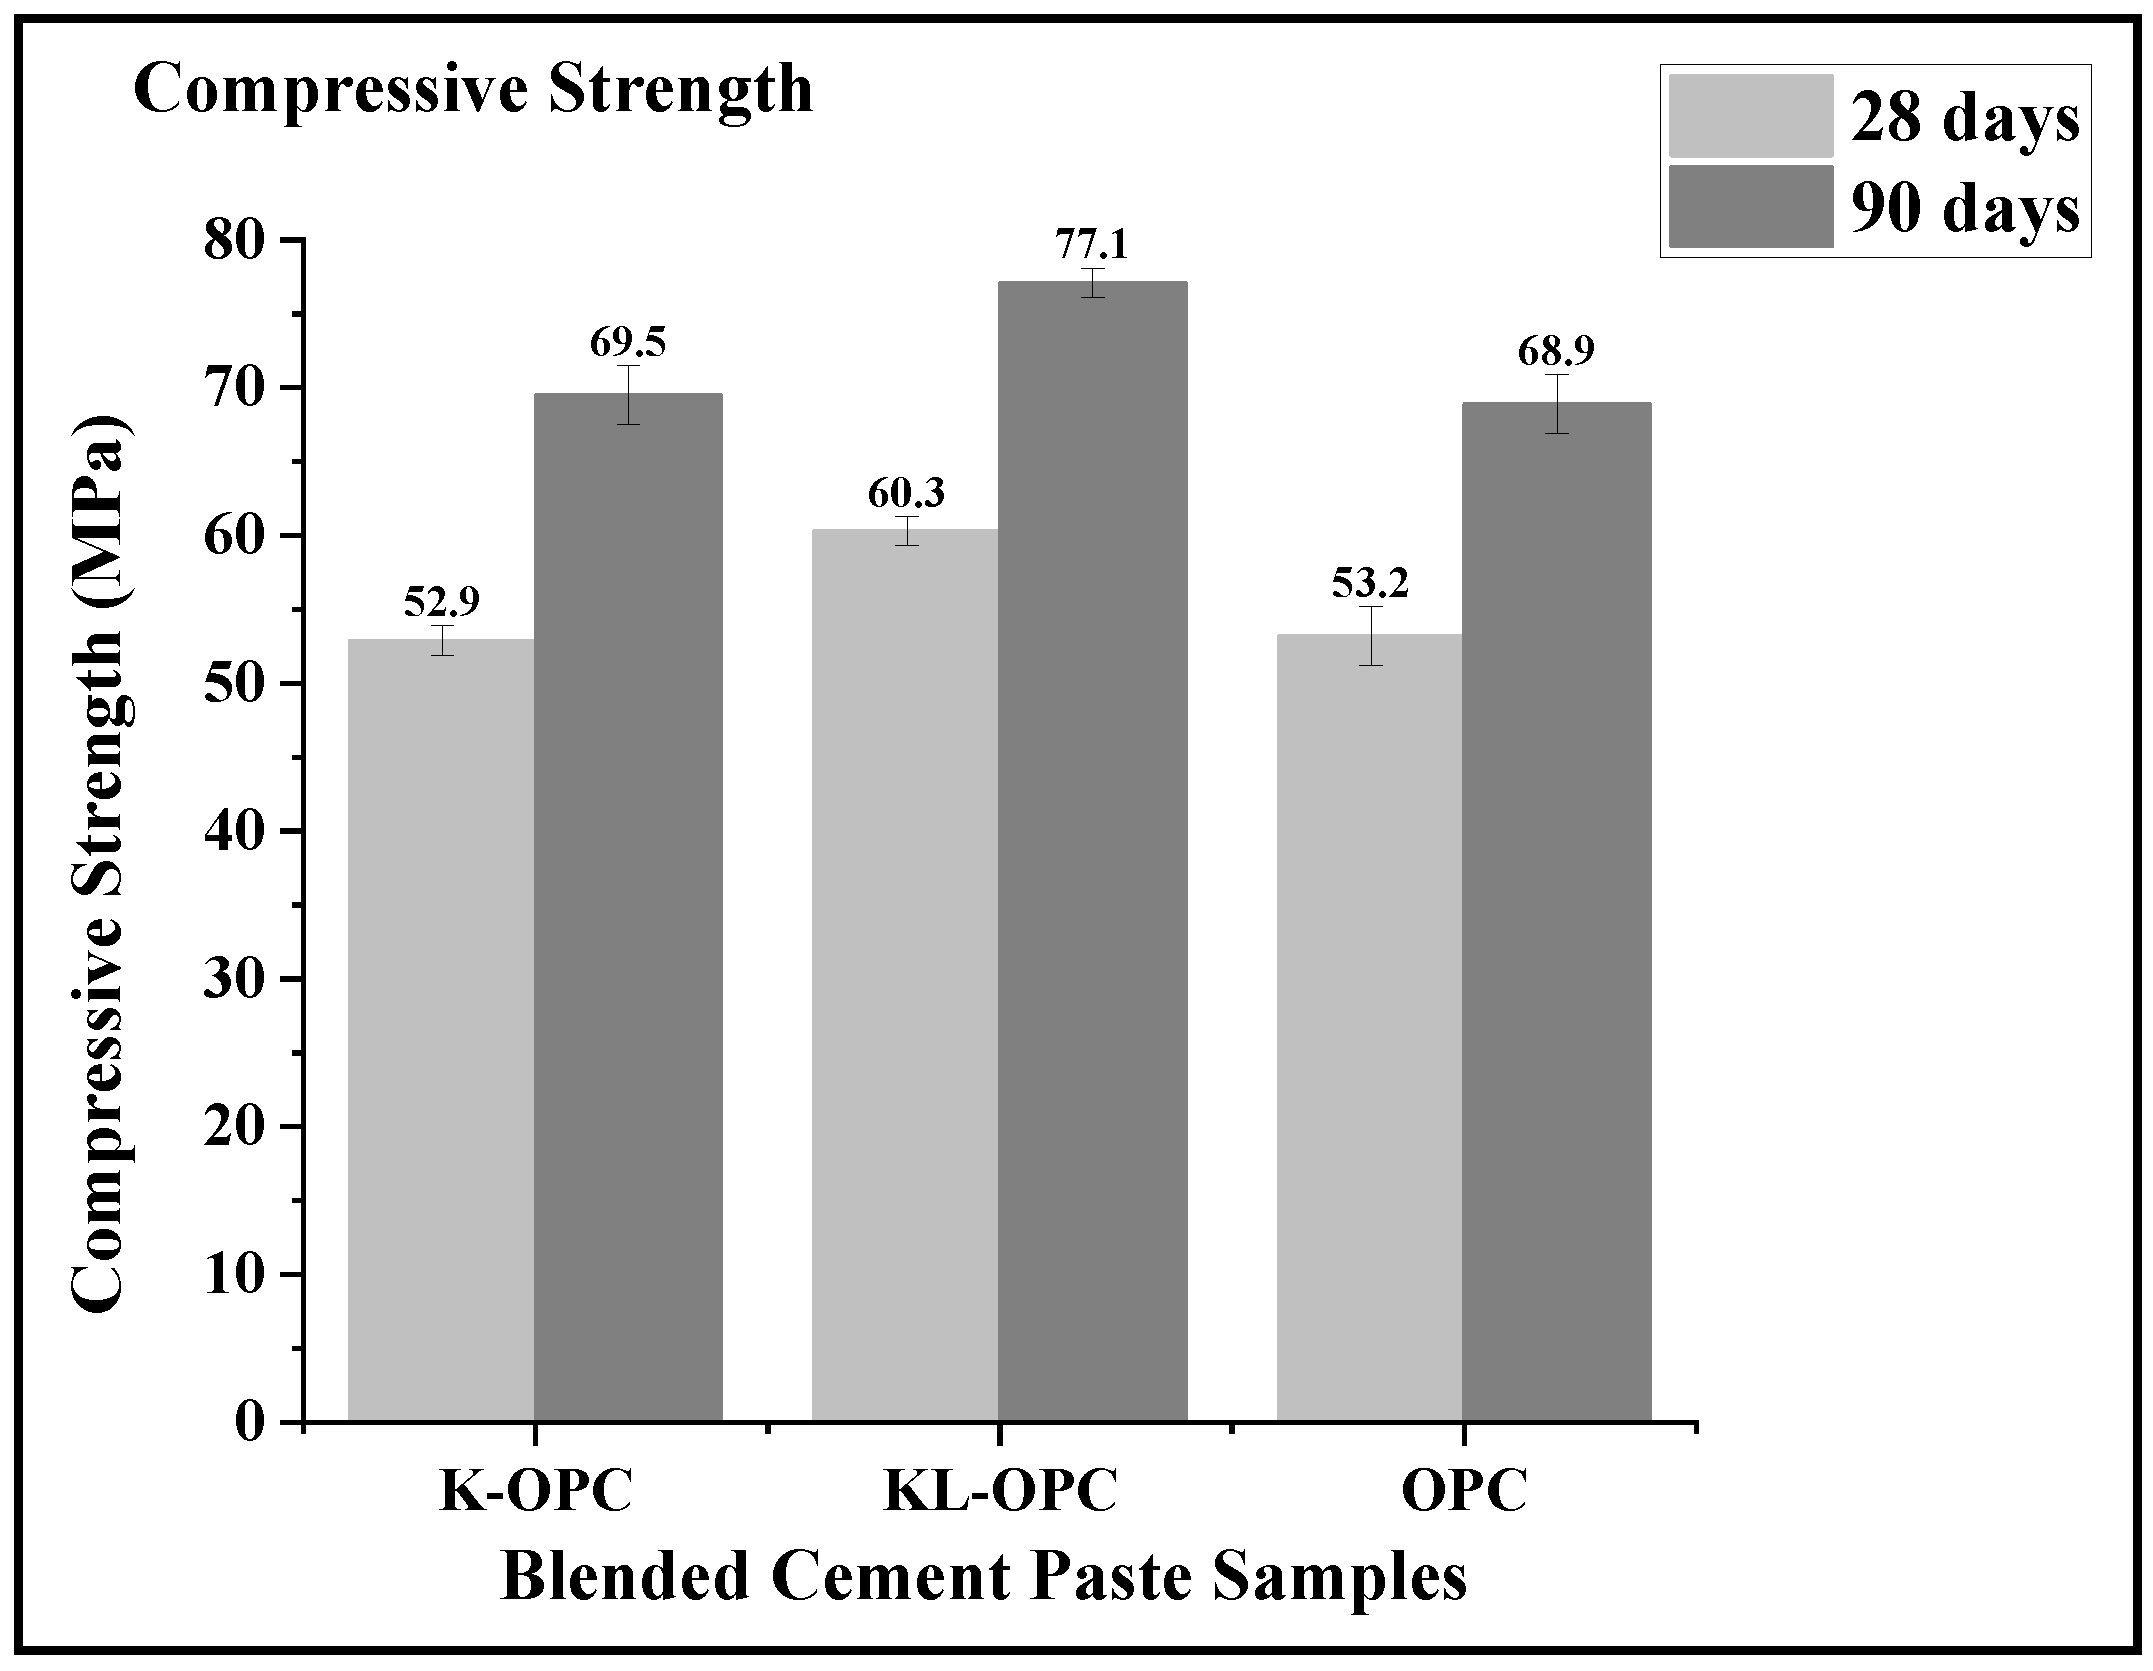
3.7. Compressive Strength of Blended Cement Paste Samples

The mechanical performance of blended cement paste samples was investigated by compressive strength measurements. Figure 12 shows the compressive strengths of SCM-blended samples compared to the pure OPC paste reference. The results showed that K-OPC reached 99% and 101% of the compressive strength of pure OPC after 28 and 90 days of hydration, respectively. By contrast, the compressive strength values of KL-OPC samples surpassed the one of pure OPC reaching 113% and 112% of the pure OPC strength, respectively. The best compressive strength value was exhibited by the KL-OPC sample after both 28 and 90 days. The compressive strength per weight of OPC (fc/Wcement) were calculated for all cement pastes. For pure OPC, fc/Wcement was taken as 100%. After 28-days of hydration (fc/Wcement)K-OPC was 141% and (fc/Wcement)KL-OPC was 162%. After 90 Days of hydration the values were 144% and 159% for K-OPC and KL-OPC, respectively.

4. Discussion

4.1. Using the Full Pozzolanic Potential of Metakaolin

The goal in this study was to develop a more reactive SCM for exploiting the full pozzolanic potential of metakaolin by co-calcining kaolinite together with limestone. As revealed by SEM imaging (Figure 8) and XRD analysis (Figure 7), the additional free lime reacted with more metakaolin in the presence of water, yielding a less porous microstructure. Even though an increased amount of calcium hydroxide in a cement paste is known to weaken the strength and durability of OPC [39], in metakaolin-blended cements, it reacted with metakaolin and yielded higher strength values (Figure 12).
The simultaneous decomposition of kaolinite and limestone through co-calcination at 800 °C produced a reactive amorphous precursor, i.e., a mixture of activated kaolinite (metakaolin) and reactive lime, as confirmed by using XRD (Figure 1) and TGA (Figure 2). Even though activating limestone through calcium carbonate decomposition required a higher temperature than that of kaolinite, it should be noted that exposing metakaolin to this higher calcination temperature that was required for the decomposition of CaCO3 did not lead to sintering or a loss of pozzolanicity of metakaolin. The consequence was that kaolinite was allowed to survive, even at temperatures under which it would have sintered when alone. This delay is significant because sintering of metakaolin annihilates its reactivity.
Forming cement paste samples by blending the new pozzolan with OPC provided the basis for demonstrating the full pozzolanic potential of metakaolin. As verified by XRD (Figure 3 and Figure 4) and TGA (Figure 5 and Figure 6) results of the blended cement paste samples, less Portlandite remained in the KL-OPC paste compared to that in the K-OPC and OPC ones after both 28 and 90 days of hydration. Furthermore, Rietveld analysis (Table 5) revealed that the amount of CASH in the KL-OPC paste was slightly higher than in the K-OPC after 90 days. There was no CASH present in the OPC paste. Because the amount of poorly crystalline CSH cannot be quantified through Rietveld analysis of XRD data, the increase in the amorphous-to-crystalline ratio served as the indicator of CSH increase in K-OPC. The amount of CSH also increased in the KL-OPC sample. These results confirmed the increase in pozzolanic reaction in the KL-OPC paste compared to the one in the K-OPC paste, especially after 90 days of hydration. The intentional addition of CaO (lime) to the system impacted the progress of pozzolanic reactions through increasing Portlandite consumption by metakaolin. The excess amount of CaO reacted with water, increasing [OH] and consequently, the pH of the hydration solution. It has been reported that the addition of CH to blended cement enhanced the reactivity of metakaolin [3]. It appeared that the extra Ca2+ ions and increased basicity provided by the calcined limestone (CaO) led to a more reactive metakaolin, forming more CSH and CASH. The full potential of metakaolin was used by the consumption of Portlandite produced by OPC hydration reactions and added Ca2+ ions from co-activated limestone.

4.2. Increased Compressive Strength in Blended Cement Pastes

The compressive strength of KL-OPC cement paste after 90 days of hydration was 12% higher than that of pure OPC and 11% higher than that of K-OPC (Figure 12). In contrast, K-OPC paste only improved compressive strength by 1% over that of pure OPC. The superior mechanical performance of KL-OPC was attributed to several factors. One reason was the lower amount of Portlandite in KL-OPC, as shown in TGA measurements (Figure 5 and Figure 6). Portlandite, which is known to be detrimental to compressive strength [39], was consumed significantly by co-calcined kaolinite and limestone to form extra (secondary) CSH and CASH. The amount of this consumption after 90 days of hydration was 36% higher than in the K-OPC cement paste—i.e., the one in which only calcined kaolinite was added—according to the TGA results in Figure 6.
The second reason for the compressive strength improvement in the KL-OPC cement paste was associated with the increased amount of CSH and CASH in the new SCM—i.e., the calcined KL. CSH and CASH determine the mechanical performance of cement pastes [13,14,15,16,17]. As revealed by the Rietveld analysis results of XRD spectra of hydrated samples (shown in Table 5), the addition of metakaolin or metakaolin/CaO mixture to OPC not only altered the amounts of the hydration products, but also led to the formation of new phases. The XRD (Figure 7) and SEM (Figure 8) results showed the formation of a new phase, CASH, in SCM-added pastes. The amount of this new phase in the KL-OPC sample was slightly more than in K-OPC. The amount of CSH gel also increased in the KL-OPC sample due to the conversion of Portlandite into additional, “secondary” CSH in this sample. As a confirmation of the XRD results, the presence of a platy phase in SEM images (Figure 8) also indicated the formation of CASH in SCM-blended pastes.
Porosity is a major factor affecting the mechanical performance of cement pastes. The pure OPC paste microstructure (Figure 8a,b) had a mesoporous matrix, with the typical, late-age CSH phase. Further development of the microstructure in the OPC paste is rather slow and is not expected to significantly contribute to durability. On the contrary, the microstructure of the K-OPC (Figure 8b,c) and KL-OPC (Figure 8e,f) pastes revealed an amorphous appearance with less porosity. The implication is that the CSH phase in these two samples was expected to continue its crystallization, giving higher strength to the pastes over the long term and making them more durable. Comparison between the microstructures of the two blended cement pastes suggests that the KL-OPC sample with a higher amount of amorphous content and less porosity is expected to be more durable than K-OPC paste. Porosity gives rise to strength and durability issues in cement and concrete [40,41,42,43]. Because the metakaolin-added K-OPC and metakaolin/CaO-added KL-OPC pastes contained less porosity than the OPC paste, the microstructure images could serve as a confirmation of the higher compressive strength of these two samples compared to that of OPC. The denser microstructure in K-OPC and KL-OPC could be explained by the presence of SCMs facilitating water ingression and the lower w/s ratio that led to the reduction in porosity [50]. In addition, the KL-OPC sample, which showed almost no porosity, yielded the highest compressive strength value.
The new, co-activated kaolinite/limestone pozzolan demonstrated increased compressive strength in a blended cement paste, due to:
(1)
the formation of CASH and secondary CSH,
(2)
the additional consumption Portlandite,
(3)
the increased ettringite conversion to monosulfate and
(4)
the reduction in porosity.
In previous work, limestone (CaCO3) was used without calcination, because the additional CaO was expected to increase the amount of Portlandite. In the current study, it was demonstrated that co-calcination of limestone and kaolinite produced lime, which enhanced metakaolin reactivity. Although the production of lime added excess Ca2+ ions to the blended cement paste, the enhanced metakaolin reactivity, combined with using the full pozzolanic potential of metakaolin, consumed these extra Ca2+ ions, in addition to the existing Portlandite (from OPC hydration). Hence, it was demonstrated that co-calcination of kaolinite and limestone produces a more reactive pozzolan and a blended cement of 12% higher compressive strength compared to pure OPC.

5. Conclusions

This study demonstrated enhancement and acceleration of pozzolanic reactions for metakaolin/OPC mixtures when active calcium ions were added to the system. In previous studies, calcined kaolinite—i.e., metakaolin—was shown to react with Portlandite to form more CSH and CASH during OPC hydration. Co-calcined kaolinite and limestone were incorporated as an SCM to OPC, and it was shown that the addition of active calcium ions, along with metakaolin, to OPC improved the compressive strength of the resulting blended cement paste. The positive impact of the new SCM was attributed to (i) the increased consumption of Portlandite by metakaolin, (ii) the formation of more CSH and CASH, (iii) the reduction of macro and meso-porosity in the microstructure, and (iv) the enhancement of the conversion of ettringite to mono-sulfate.

Supplementary Materials

The following are available online at https://www.mdpi.com/article/10.3390/constrmater2040019/s1, Table S1: Chemical composition of the raw materials.

Author Contributions

Conceptualization, K.H., Y.A., C.O., M.A.G.; data acquisition and analysis, K.H., Y.A., M.C.D.; writing—original draft preparation, K.H.; writing—review and editing, Y.A., C.O., M.A.G.; visualization, K.H.; supervision, M.A.G., C.O.; funding acquisition, M.A.G. All authors have read and agreed to the published version of the manuscript.

Funding

This research was funded by AkçanSA Cement Manufacturing Company, Istanbul, Turkey [E.A.CF-13-01163, E.A.CF-15-01517, E.A.CF-18-01844].

Data Availability Statement

The data presented in this study are available on request from the corresponding author.

Acknowledgments

Financial support from AkçanSA cement manufacturer is acknowledged by the authors. K.H. is indebted to Kalekim Construction Chemicals Co. for her financial support.

Conflicts of Interest

The authors declare no conflict of interest.

References

  1. Delatte, N.J. Lessons from Roman cement and concrete. J. Prof. Issues Eng. Educ. Pract. 2001, 127, 109–115. [Google Scholar] [CrossRef] [Green Version]
  2. Brandon, C.J.; Hohlfelder, R.L.; Jackson, M.D.; Oleson, J.P. Building for Eternity: The History and Technology of Roman Concrete Engineering in the Sea; Oxbow Books: Oxford, UK, 2014. [Google Scholar]
  3. Weise, K.; Ukrainczyk, N.; Duncan, A.; Koenders, E. Enhanced Metakaolin Reactivity in Blended Cement with Additional Calcium Hydroxide. Materials 2022, 15, 367. [Google Scholar] [CrossRef] [PubMed]
  4. Fernandez, R.; Martirena, F.; Scrivener, K.L. The origin of the pozzolanic activity of calcined clay minerals: A comparison between kaolinite, illite and montmorillonite. Cem. Concr. Res. 2011, 41, 113–122. [Google Scholar] [CrossRef]
  5. Avet, F.; Scrivener, K. Investigation of the calcined kaolinite content on the hydration of Limestone Calcined Clay Cement (LC3). Cem. Concr. Res. 2018, 107, 124–135. [Google Scholar] [CrossRef]
  6. Murat, M.; Comel, C. Hydration reaction and hardening of calcined clays and related minerals III. Influence of calcination process of kaolinite on mechanical strengths of hardened metakaolinite. Cem. Concr. Res. 1983, 13, 631–637. [Google Scholar] [CrossRef]
  7. Sabir, B.; Wild, S.; Bai, J. Metakaolin and calcined clays as pozzolans for concrete: A review. Cem. Concr. Compos. 2001, 23, 441–454. [Google Scholar] [CrossRef]
  8. Siddique, R.; Klaus, J. Influence of metakaolin on the properties of mortar and concrete: A review. Appl. Clay Sci. 2009, 43, 392–400. [Google Scholar] [CrossRef]
  9. Güneyisi, E.; Gesoğlu, M.; Mermerdaş, K. Improving strength, drying shrinkage, and pore structure of concrete using metakaolin. Mater. Struct. 2008, 41, 937–949. [Google Scholar] [CrossRef]
  10. Ramezanianpour, A.A.; Jovein, H.B. Influence of metakaolin as supplementary cementing material on strength and durability of concretes. Constr. Build. Mater. 2012, 30, 470–479. [Google Scholar] [CrossRef]
  11. El-Diadamony, H.; Amer, A.A.; Sokkary, T.M.; El-Hoseny, S. Hydration and characteristics of metakaolin pozzolanic cement pastes. HBRC J. 2018, 14, 150–158. [Google Scholar] [CrossRef]
  12. Antoni, M.; Rossen, J.; Martirena, F.; Scrivener, K. Cement substitution by a combination of metakaolin and limestone. Cem. Concr. Res. 2012, 42, 1579–1589. [Google Scholar] [CrossRef]
  13. Mujedu, K.A.; Ab-Kadir, M.A.; Sarbini, N.N.; Ismail, M. Microstructure and compressive strength of self-compacting concrete incorporating palm oil fuel ash exposed to elevated temperatures. Constr. Build. Mater. 2021, 274, 122025. [Google Scholar] [CrossRef]
  14. Cao, Y.; Wang, Y.; Zhang, Z.; Ma, Y.; Wang, H. Recent progress of utilization of activated kaolinitic clay in cementitious construction materials. Compos. Part B Eng. 2021, 211, 108636. [Google Scholar] [CrossRef]
  15. Dung, T.N.; Chang, T.-P.; Chen, C.-T. Hydration process and compressive strength of slag-CFBC fly ash materials without portland cement. J. Mater. Civ. Eng. 2015, 27, 04014213. [Google Scholar] [CrossRef]
  16. Menchaca-Ballinas, L.; Martinez-Lopez, R.; Escalante-Garcia, J. Compressive strength and microstructure of alkali-activated waste glass-slag cements. J. Sustain. Cem.-Based Mater. 2022, 11, 1–12. [Google Scholar] [CrossRef]
  17. Lothenbach, B.; Scrivener, K.; Hooton, R. Supplementary cementitious materials. Cem. Concr. Res. 2011, 41, 1244–1256. [Google Scholar] [CrossRef]
  18. Scrivener, K.; Martirena, F.; Bishnoi, S.; Maity, S. Calcined clay limestone cements (LC3). Cem. Concr. Res. 2018, 114, 49–56. [Google Scholar] [CrossRef]
  19. Hassan Nezhad, K. Activation of Aluminosilicate Materials. Master’s Thesis, Sabancı University, Istanbul, Turkey, 2020. [Google Scholar]
  20. Mokhtari, P. New Low Cost and Green Composite Binder for Construction. Ph.D. Thesis, Sabancı University, Istanbul, Turkey, 2019. [Google Scholar]
  21. Hollanders, S.; Adriaens, R.; Skibsted, J.; Cizer, Ö.; Elsen, J. Pozzolanic reactivity of pure calcined clays. Appl. Clay Sci. 2016, 132, 552–560. [Google Scholar] [CrossRef]
  22. He, C.; Osbaeck, B.; Makovicky, E. Pozzolanic reactions of six principal clay minerals: Activation, reactivity assessments and technological effects. Cem. Concr. Res. 1995, 25, 1691–1702. [Google Scholar] [CrossRef]
  23. Sperinck, S.; Raiteri, P.; Marks, N.; Wright, K. Dehydroxylation of kaolinite to metakaolin—A molecular dynamics study. J. Mater. Chem. 2011, 21, 2118–2125. [Google Scholar] [CrossRef]
  24. Ambroise, J.; Martin-Calle, S.; Pera, J. Pozzolanic behavior of thermally activated kaolin. Spec. Publ. 1992, 132, 731–748. [Google Scholar]
  25. Bredy, P.; Chabannet, M.; Pera, J. Microstructure and porosity of metakaolin blended cements. MRS Online Proc. Libr. 1988, 136, 275–280. [Google Scholar] [CrossRef]
  26. Lothenbach, B.; Le Saout, G.; Gallucci, E.; Scrivener, K. Influence of limestone on the hydration of Portland cements. Cem. Concr. Res. 2008, 38, 848–860. [Google Scholar] [CrossRef]
  27. De Weerdt, K.; Haha, M.B.; Le Saout, G.; Kjellsen, K.O.; Justnes, H.; Lothenbach, B. Hydration mechanisms of ternary Portland cements containing limestone powder and fly ash. Cem. Concr. Res. 2011, 41, 279–291. [Google Scholar] [CrossRef]
  28. Carrasco, M.F.; Menéndez, G.; Bonavetti, V.; Irassar, E.F. Strength optimization of “tailor-made cement” with limestone filler and blast furnace slag. Cem. Concr. Res. 2005, 35, 1324–1331. [Google Scholar] [CrossRef]
  29. Güneyisi, E.; Gesoğlu, M. Properties of self-compacting portland pozzolana and limestone blended cement concretes containing different replacement levels of slag. Mater. Struct. 2011, 44, 1399–1410. [Google Scholar] [CrossRef]
  30. Menéndez, G.; Bonavetti, V.; Irassar, E. Strength development of ternary blended cement with limestone filler and blast-furnace slag. Cem. Concr. Compos. 2003, 25, 61–67. [Google Scholar] [CrossRef]
  31. Mounanga, P.; Khokhar, M.I.A.; El Hachem, R.; Loukili, A. Improvement of the early-age reactivity of fly ash and blast furnace slag cementitious systems using limestone filler. Mater. Struct. 2011, 44, 437–453. [Google Scholar] [CrossRef]
  32. Pera, J.; Husson, S.; Guilhot, B. Influence of finely ground limestone on cement hydration. Cem. Concr. Compos. 1999, 21, 99–105. [Google Scholar] [CrossRef] [Green Version]
  33. Jackson, M.D.; Chae, S.R.; Mulcahy, S.R.; Meral, C.; Taylor, R.; Li, P.; Emwas, A.H.; Moon, J.; Yoon, S.; Vola, G.; et al. Unlocking the secrets of Al-tobermorite in Roman seawater concrete. Am. Mineral. 2013, 98, 1669–1687. [Google Scholar] [CrossRef] [Green Version]
  34. Krishnan, S.; Kanaujia, S.K.; Mithia, S.; Bishnoi, S. Hydration kinetics and mechanisms of carbonates from stone wastes in ternary blends with calcined clay. Constr. Build. Mater. 2018, 164, 265–274. [Google Scholar] [CrossRef]
  35. Krishnan, S.; Emmanuel, A.C.; Bishnoi, S. Hydration and phase assemblage of ternary cements with calcined clay and limestone. Constr. Build. Mater. 2019, 222, 64–72. [Google Scholar] [CrossRef]
  36. Zunino, F.; Scrivener, K.L. The Effect of Calcite and Gibbsite Impurities in Calcined Clay on Its Reactivity. In Calcined Clays for Sustainable Concrete; Springer: Berlin/Heidelberg, Germany, 2020; pp. 357–362. [Google Scholar]
  37. Dhandapani, Y.; Sakthivel, T.; Santhanam, M.; Gettu, R.; Pillai, R.G. Mechanical properties and durability performance of concretes with Limestone Calcined Clay Cement (LC3). Cem. Concr. Res. 2018, 107, 136–151. [Google Scholar] [CrossRef]
  38. Karunadasa, K.S.; Manoratne, C.H.; Pitawala, H.M.T.G.A.; Rajapakse, R.M.G. Thermal decomposition of calcium carbonate (calcite polymorph) as examined by in-situ high-temperature X-ray powder diffraction. J. Phys. Chem. Solids 2019, 134, 21–28. [Google Scholar] [CrossRef]
  39. Aïtcin, P.-C. Portland Cement. In Science and Technology of Concrete Admixtures; Elsevier: Amsterdam, The Netherlands, 2016; pp. 27–51. [Google Scholar]
  40. Chen, X.; Wu, S.; Zhou, J. Influence of porosity on compressive and tensile strength of cement mortar. Constr. Build. Mater. 2013, 40, 869–874. [Google Scholar] [CrossRef]
  41. Yudenfreund, M.; Hanna, K.M.; Skalny, J.; Older, I.; Brunauer, S. Hardened Portland cement pastes of low porosity V. Compressive strength. Cem. Concr. Res. 1972, 2, 731–743. [Google Scholar] [CrossRef]
  42. Auskern, A.; Horn, W. Capillary porosity in hardened cement paste. J. Test. Eval. 1973, 1, 74–79. [Google Scholar]
  43. Pantazopoulou, S.J.; Mills, R. Microstructural aspects of the mechanical response of plain concrete. Mater. J. 1995, 92, 605–616. [Google Scholar]
  44. Chindaprasirt, P.; Hatanaka, S.; Chareerat, T.; Mishima, N.; Yuasa, Y. Cement paste characteristics and porous concrete properties. Constr. Build. Mater. 2008, 22, 894–901. [Google Scholar] [CrossRef]
  45. Coelho, A.A. TOPAS and TOPAS-Academic: An optimization program integrating computer algebra and crystallographic objects written in C++. J. Appl. Crystallogr. 2018, 51, 210–218. [Google Scholar] [CrossRef] [Green Version]
  46. Schindelin, J.; Arganda-Carreras, I.; Frise, E.; Kaynig, V.; Longair, M.; Pietzsch, T.; Preibisch, S.; Rueden, C.; Saalfeld, S.; Schmid, B.; et al. Fiji: An open-source platform for biological-image analysis. Nat. Methods 2012, 9, 676–682. [Google Scholar] [CrossRef] [PubMed] [Green Version]
  47. Shvarzman, A.; Kovler, K.; Grader, G.S.; Shter, G.E. The effect of dehydroxylation/amorphization degree on pozzolanic activity of kaolinite. Cem. Concr. Res. 2003, 33, 405–416. [Google Scholar] [CrossRef]
  48. Galan, I.; Glasser, F.P.; Andrade, C. Calcium carbonate decomposition. J. Therm. Anal. Calorim. 2013, 111, 1197–1202. [Google Scholar] [CrossRef]
  49. Scrivener, K.; Snellings, R.; Lothenbach, B. A Practical Guide to Microstructural Analysis of Cementitious Materials; CRC Press: Boca Raton, FL, USA, 2016; Volume 540. [Google Scholar]
  50. Chen, X.; Wu, S. Influence of water-to-cement ratio and curing period on pore structure of cement mortar. Constr. Build. Mater. 2013, 38, 804–812. [Google Scholar] [CrossRef]
Figure 1. XRD diffractograms and Rietveld analysis results of un-treated and calcined kaolinite (K) and kaolinite/limestone (KL), showing full de-hydroxylation of kaolinite and partial decomposition of calcite during calcination process.
Constrmater 02 00019 g001
Figure 2. TGA thermograms of weight loss as a function of temperature of un-treated and calcined kaolinite (K) and kaolinite/limestone (KL).
Constrmater 02 00019 g002
Figure 3. XRD diffractograms of OPC, OPC blended with calcined kaolinite (K-OPC), and OPC blended with calcined kaolinite/limestone (KL-OPC) pastes at 28 days showing Portlandite-to-rutile (P/R) peak intensity ratio, where rutile was added with a fixed amount to these three samples as external standard reference.
Constrmater 02 00019 g003
Figure 4. XRD diffractograms of OPC, OPC blended with calcined kaolinite (K-OPC), and OPC blended with calcined kaolinite/limestone (KL-OPC) pastes at 90 days showing Portlandite-to-rutile (P/R) peak intensity ratio, where rutile was added with a fixed amount to these three samples as external standard reference.
Constrmater 02 00019 g004
Figure 5. TGA/DTG thermograms of OPC, OPC blended with calcined kaolinite (K-OPC), and OPC blended with calcined kaolinite/limestone (KL-OPC) pastes at 28 days in the temperature range of 400–600 °C (Portlandite dehydration range)—Left axis: TGA (mass change), Right axis: DTG.
Constrmater 02 00019 g005
Figure 6. TGA/DTG thermograms of OPC, OPC blended with calcined kaolinite (K-OPC), and OPC blended with calcined kaolinite/limestone (KL-OPC) pastes at 90 days in the temperature range of 400–600 °C (Portlandite dehydration range)—Left axis: TGA (mass change), Right axis: DTG.
Constrmater 02 00019 g006
Figure 7. XRD patterns of OPC, OPC blended with calcined kaolinite (K-OPC), and OPC blended with calcined kaolinite/limestone (KL-OPC) pastes at 28 and 90 days.
Constrmater 02 00019 g007
Figure 8. Blended cement pastes microstructures at two different magnifications; (a,b) pure OPC, (c,d) K-OPC, (e,f) KL-OPC. Porosity in the microstructures is circled, and the CASH hydration products are indicated with arrows.
Constrmater 02 00019 g008
Figure 9. Microstructure of the KL-OPC paste showing CSH at region Point 1 and CASH at Point 2.
Constrmater 02 00019 g009
Figure 10. EDS spectra of (a) Point 1 and (b) Point 2 in Figure 9, showing CSH and CASH, respectively, and the relative amounts of Ca, Si, and Al at Point 1 and Point 2.
Constrmater 02 00019 g010
Figure 11. Particle size distribution of ingredients of blended cement samples; OPC, calcined kaolinite (K) and calcined kaolinite/limestone (KL).
Constrmater 02 00019 g011
Figure 12. Compressive strength of OPC blended with 30 wt% of calcined kaolinite (K-OPC) or calcined kaolinite/limestone (KL-OPC), compared to pure OPC.
Constrmater 02 00019 g012
Table 1. Phase composition of the raw materials.
SamplePhase Composition (wt%)
C3SC2SC3AC4AFGypsumKaoliniteQuartzCalcite
OPC7114285---
Kaolinite-----5347-
Limestone------199
Table 2. Composition of cement paste samples.
Cement Paste SampleCement (wt%)Calcined Kaolinite
(Metakaolin) (wt%)
Co-Calcined Limestone (wt%)
OPC100--
K-OPC7030-
KL-OPC7025.54.5
Table 3. Weight loss amounts of un-treated and calcined kaolinite (K) and kaolinite/limestone (KL) samples at the temperature ranges of 300–650 °C (kaolinite decomposition range) and 650–800 °C (calcium carbonate decomposition range).
SampleWeight Loss (300–650 °C)Weight Loss (650–800 °C)
K8%0%
KL6.8%6.6%
Calcined K0.8%0%
Calcined KL0.4%3.5%
Table 4. Amount of Portlandite after 28 and 90 days in OPC, OPC blended with calcined kaolinite (K-OPC), and OPC blended with calcined kaolinite/limestone (KL-OPC) pastes, obtained from TGA weight loss amounts.
SamplePortlandite Amount after 28 DaysPortlandite Amount after 90 Days
OPC9.8%16.3%
K-OPC9.1%6.8%
KL-OPC7.7%5%
Table 5. Quantitative phase composition of OPC, OPC blended with calcined kaolinite (K-OPC), and OPC blended with calcined kaolinite/limestone (KL-OPC) pastes at 28 and 90 days, obtained from Rietveld analysis.
Chemical PhasesOPC 28 DaysK-OPC 28 DaysKL-OPC 28 DaysOPC 90 DaysK-OPC 90 DaysKL-OPC 90 Days
Amorphous50.7%52.3%50%57.4%55.5%61.8%
Ettringite11.8%3.5%4.4%10%2.2%3.1%
Grunerite2.8%3.1%2.2%1.3%3.3%2.5%
Monosulfate1.2%5.6%3.2%1.6%5.2%3.8%
Portlandite22%6.8%6.8 %20.6%4.7%3.7%
Alite4.2%3.5%7.9%8%4.4%3.1%
Belite7.3%8.1%7.8%4.9%7.2%6.2%
Stratlingite-1.1%1%-2.5%2.9%
Quartz-16%14%-15%10.6%
Calcite--2.7%--2.3%
Publisher’s Note: MDPI stays neutral with regard to jurisdictional claims in published maps and institutional affiliations.

