1. Introduction
When sand or non-plastic silt is subjected to cyclic loading without drainage, a change in pore water pressure occurs due to energy being dissipated in the soil during particle rearrangement. Because this change in pore pressure can lead to a loss of strength or even liquefaction of the soil, it is important for the engineer to have a clear understanding of the patterns of energy dissipation and pore pressure generation.
One way to gain such insight is to plot the pore pressure changes generated during loading against either the cycles of loading or the energy dissipated during loading. To generalize these patterns, they are typically plotted with the pore pressure ratio on the vertical axis and either the cycle ratio or the dissipated energy ratio on the horizontal axis.
A number of factors were examined in order to determine what, if any, effect that they have on energy dissipation and pore pressure generation patterns. These factors include both soil parameters such as density and non-plastic fine contents and test parameters such as load shape and application. Silver et al. [
1] and Townsend [
2] have provided excellent reviews of many of these factors.
The next section of this paper will provide background information on energy dissipation and pore pressure generation. This will be followed by a section explaining the soils used and tests performed to generate the figures that were evaluated. Finally, the pore pressure and dissipated energy patterns generated will be discussed and conclusions drawn.
2. Background
When subjected to a cyclic loading such as an earthquake, saturated sands and non-plastic silts generate changes in pore pressure if the loading is rapid enough to prevent the soils from draining. If the soil is loose, the cyclic loading will cause the pore pressures in the soil to increase and will cause the effective stress in the soil to decrease. As a result, its strength will decrease [
3,
4,
5,
6]. If the strength acting on the soil becomes low enough, a flow liquefaction failure may be triggered, resulting in the development of very large strains, which may continue even after the cessation of loading.
If the soil is dense, the cyclic loading will cause the pore pressures in the soil to increase early in the loading cycle as the soil attempts to contract and then to decrease later in the cycle as the soil attempts to dilate [
6]. During this loading, the effective stress acting on the soil first decreases and then increases. These alternating effective stresses may lead to a cyclic mobility failure in which strains gradually increase during loading and cease shortly after the end of loading.
In both cases, the changes in the pore pressure developed as a result of the energy dissipated in the soil during the cyclic loading. The energy that is dissipated is the energy used to rearrange the soil grains. Energy dissipation and pore pressure change are directly related, as much of the energy dissipated is used to permanently deform the soil skeleton. In a loose, saturated soil, these deformations (most commonly quantified by either axial or shear strain) result in a decrease in void ratio with no change in pore pressures if drainage is allowed. If drainage is not allowed during loading, the voids cannot change size and as a result, the pore pressures increase.
Conversely, in a dense, saturated soil, these deformations result in an increase in the void ratio with no change in pore pressures if the soil is drained. If drainage is prevented, the voids cannot change size due to the presence of the water and as a result, the pore pressures decrease.
2.1. Normally Dissipated Energy per Unit Volume
The pore pressures generated in soils subjected to cyclic loadings have been shown to be proportional to the energy dissipated in the soil during that loading. This behavior is interpreted through the use of energy-based pore pressure models. In the laboratory, stress-controlled and strain-controlled cyclic triaxial and cyclic direct simple shear tests are used both to perform liquefaction evaluations and to develop the inputs required for the energy-based models [
7,
8,
9,
10,
11,
12,
13].
As explained by Polito and Moldenhauer [
14]:
“The normalized unit energy per unit volume, Ws, is the energy dissipated per unit volume of soil divided by the initial mean effective stress acting on the soil. The energy dissipated during a cyclic laboratory test can be determined from the stresses and strains measured during the test and then used to predict pore pressure generation in the field. The level of excess pore pressures developed under cyclic loading is proportional to the amount of energy dissipated in the soil”.
For any general loading, changes in W
s can be calculated from the changes in the stress that are applied to the soil element and the resulting increments of strain (or vice versa) using Equation (1) [
15]:
where dW
s is the change in dissipated energy normalized by the initial effective stress; dε
v is the change in vertical strain; dε
h is the change in radial strain; σ′
v is the effective vertical stress; σ′
h is the effective horizontal stress; τ
vh is the horizontal shear stress; dγ
vh is the change in shear strain resulting from τ
vh; τ
v is the vertical shear stress; dγ
hv is the change in shear strain resulting from τ
hv; and σ′
o is the initial effective stress.
For undrained cyclic triaxial test loadings, the normalized dissipated energy per unit volume, W
s, can be computed using Equation (2) [
15]:
where n is the number of load increments applied to cause liquefaction; σ′
o is the initial mean effective confining stress; σ
d,i and σ
d,i+1 are the applied deviator stresses at load increments i and i + 1, respectively; and ε
a,i and ε
a,i+1 are the axial strains at load increments i and i + 1, respectively.
For undrained cyclic direct simple shear test loadings, the normalized dissipated energy per unit volume, W
s, can be computed using Equation (3) [
15]:
where n is the number of increments of loading applied to cause liquefaction; σ′
o is the initial effective confining stress; τ
i and τ
i+1 are the applied shear stresses at load increments i and i + 1, respectively; and γ
i and γ
i+1 are the axial strains at load increments i and i + 1, respectively.
2.2. Ratios
Three ratios are commonly used when plotting and evaluating pore pressure generation data. They are the pore pressure ratio, ru, the cycle ratio, N/NL, and the dissipated energy ratio, Ws/WsL. When used in this article, they are defined as follows:
(1) The pore pressure ratio, r
u, relates the residual pore pressure in the specimen to the initial effective stress acting on the specimen [
16]. Residual pore pressure is the change in pore pressure above or below the initial pore pressure that is generated in the specimen during loading; it is measured when the applied stress or strain is equal to zero. Residual pore pressures are caused by the permanent deformation of the soil skeleton.
(2) The cycle ratio, N/N
L, relates the current cycle of loading (N) to the number of cycles of loading required to initiate liquefaction, (N
L) [
16]. It varies from zero at the start of the loading to 1.0 at cycle N
L, when the liquefaction criterion is first met (e.g., if 1% single-amplitude axial strain is chosen as the liquefaction criterion, N
L = 1.0 when the specimen first achieves 1% single-amplitude axial strain).
(3) The dissipated energy ratio, Ws/WsL, relates Ws, the cumulative amount of normalized dissipated energy per unit volume that has been dissipated at a given point during loading, to the total normalized dissipated energy per unit volume required to initiate liquefaction in the soil mass, WsL.
3. Data Sources and Lab Testing
The results of 307 cyclic triaxial and 60 cyclic direct simple shear tests collected from the first author’s files were used to evaluate dissipated energy and pore pressure generation patterns in cyclically loaded, non-plastic soils. They consist of both published [
17,
18,
19] and unpublished data. These studies are summarized in
Table 1 (Note: some tests appear in more than one publication).
The soils used consisted of five sands and one non-plastic silt. The major properties of the six soils are summarized in
Table 2.
The tests performed to generate the data used in this study consisted of cyclic triaxial [
4,
20,
21,
22] and cyclic direct simple shear tests [
23,
24,
25]. Cyclic triaxial tests were performed in conformance with ASTM D5311 [
22] and cyclic direct simple shear tests were performed in conformance with ASTM D8296-19 [
25]. All cyclic triaxial tests were isotropically consolidated to an effective stress of 100 kPa and all cyclic direct simple shear tests were subjected to an initial normal stress of 100 kPa. Both stress- and strain-controlled loadings (i.e., load- and displacement-controlled loadings) were applied to the specimens using a variety of load shapes, including sinusoidal, triangular and square shapes. Additionally, some specimens were subjected to either symmetric or asymmetric irregular loadings.
For this study, initial liquefaction [
26] was chosen as the liquefaction criterion. Initial liquefaction occurs when the excess pore pressure generated is first equal to the initial effective confining pressure (i.e., when the effective confining stress acting on the soil first equals zero). This is the most commonly used definition of liquefaction for laboratory-based studies.
4. Results
The results of the tests performed were plotted in two different ways, (pore pressure ratio versus cycle ratio and pore pressure ratio versus dissipated energy) to evaluate the effects of different factors on the patterns of energy dissipation and pore pressure generation observed. An interpretation of the results will be provided in the next section. The factors examined include the method of load application, test type, sand type, non-plastic silt content, soil density, and the uniformity of loading. These factors are described below and the results of the evaluations are presented.
4.1. Method of Load Application
In a laboratory test, the loading applied to a specimen is controlled either by applying a stress (stress- or load-controlled) or by applying a strain (strain- or displacement-controlled).
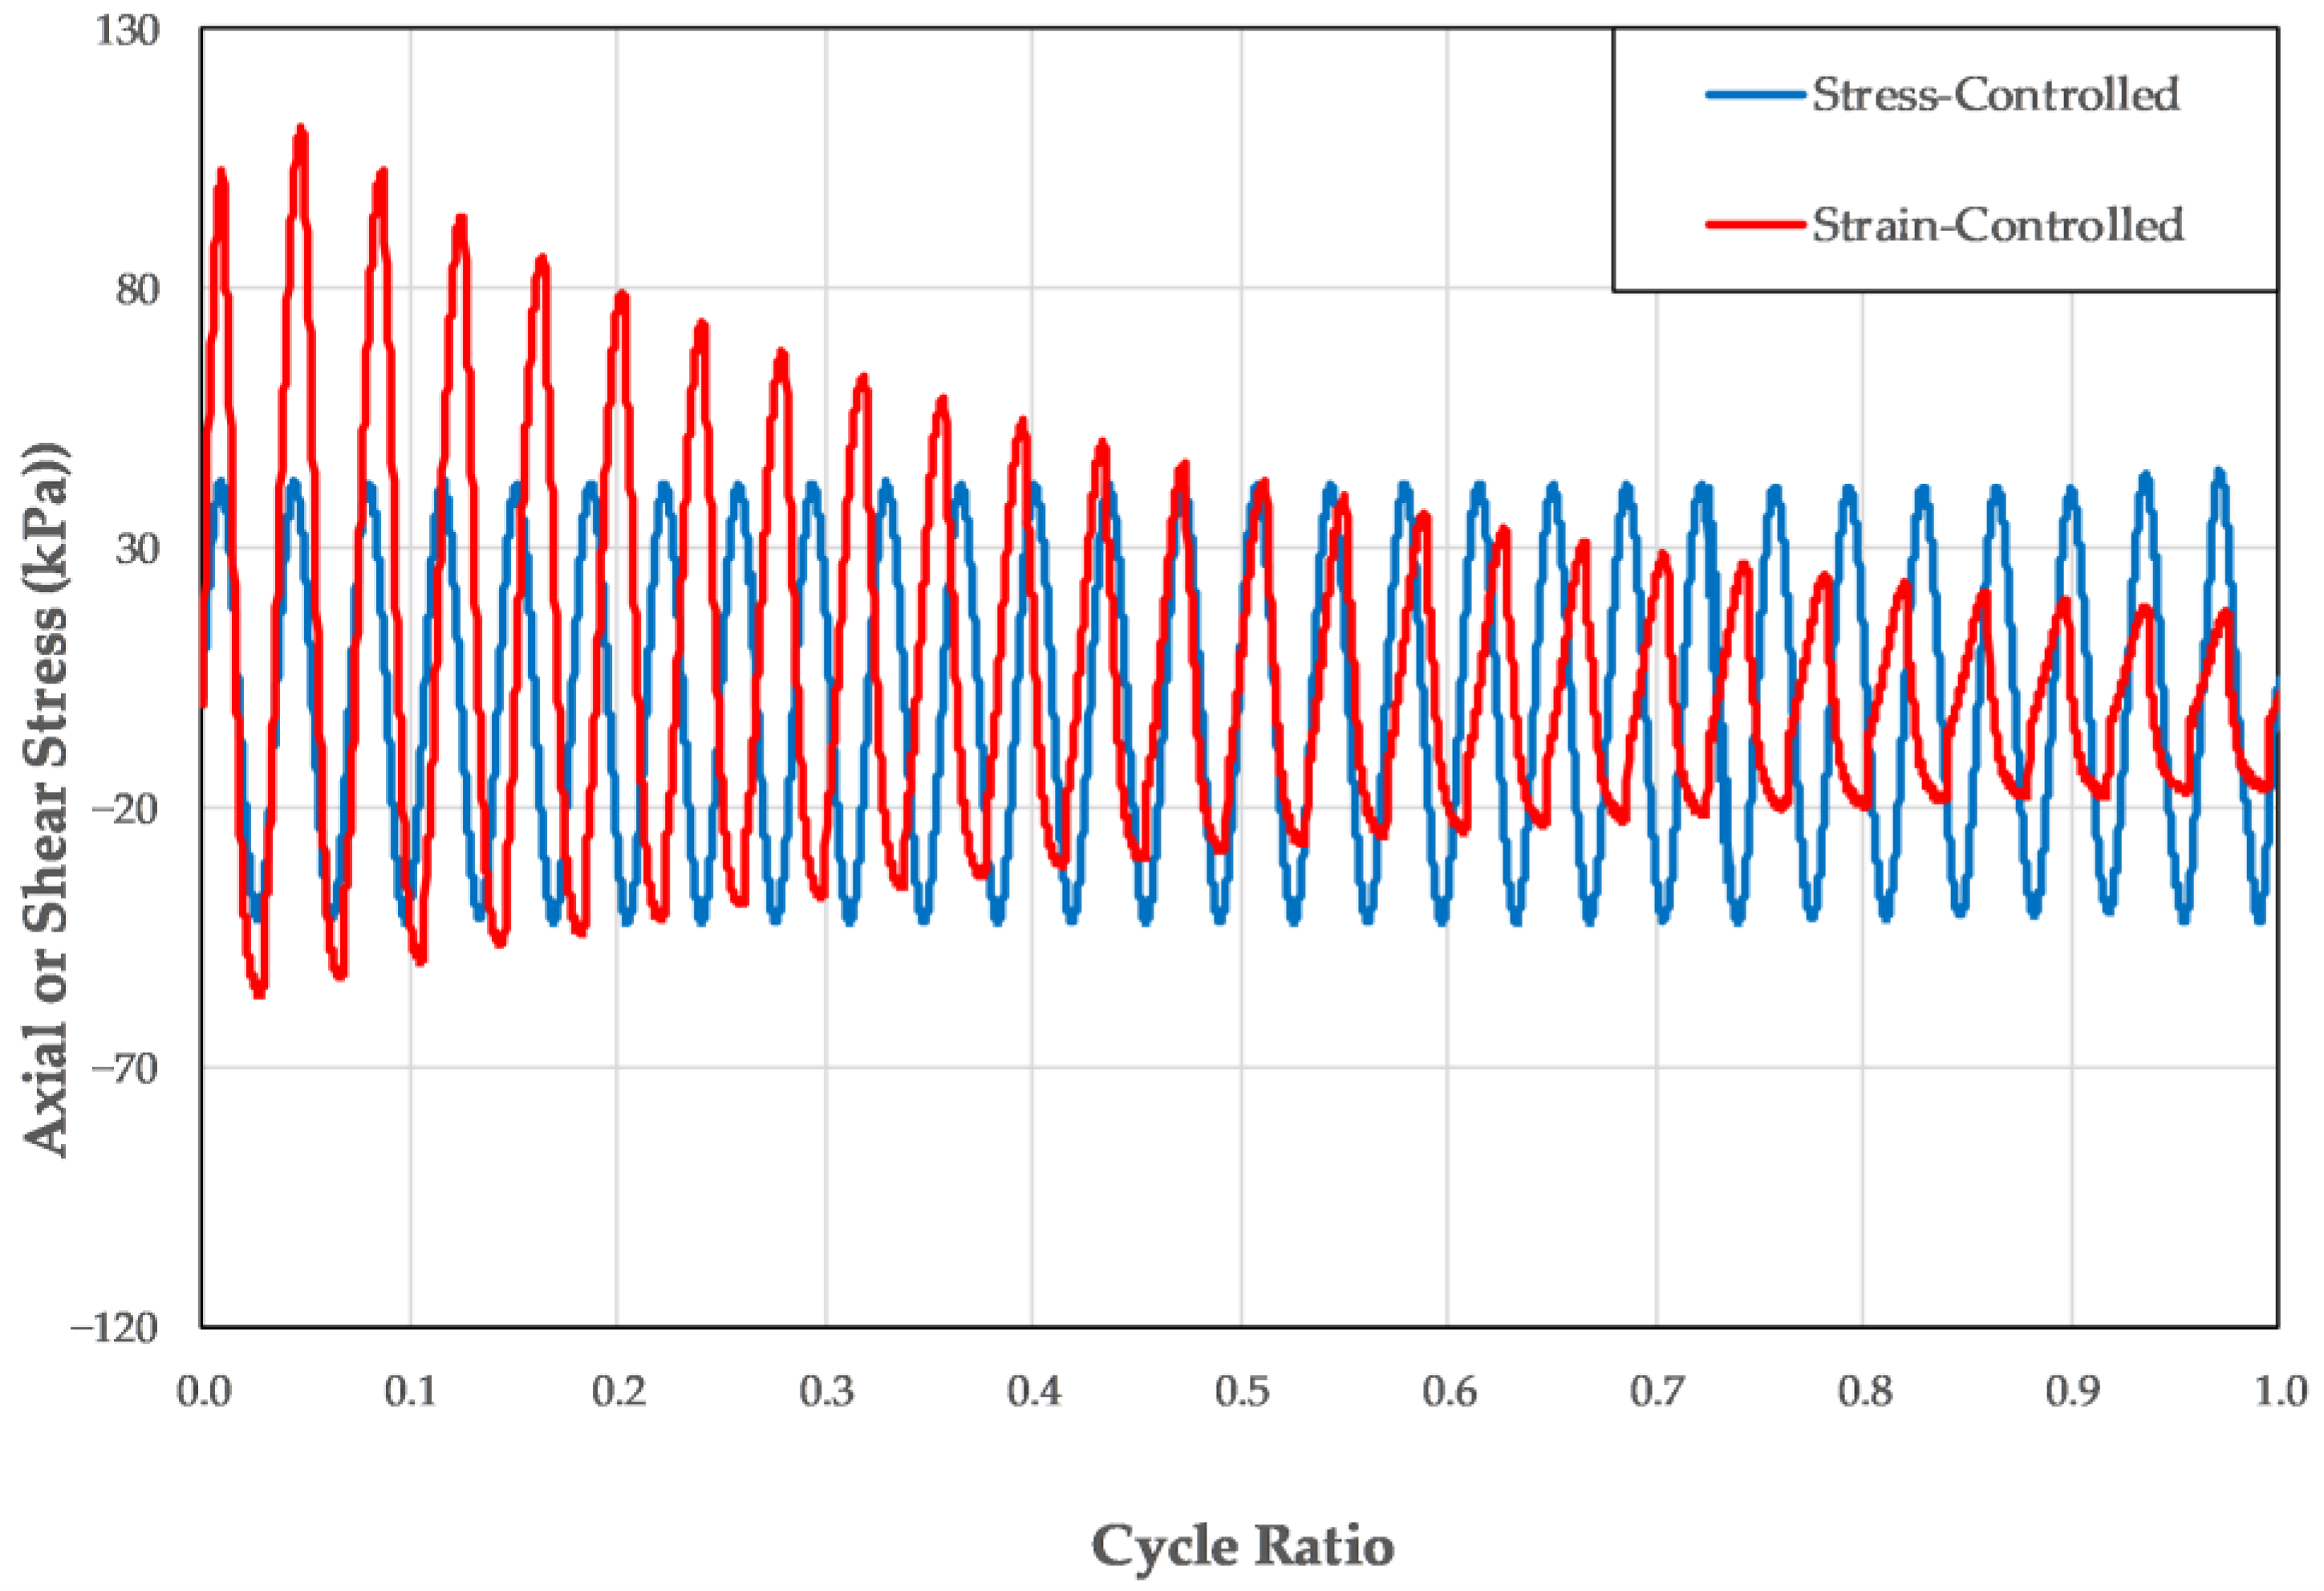
As may be seen in
Figure 1, in a stress-controlled cyclic triaxial or a stress-controlled cyclic direct simple shear test, the applied stress’s maximum amplitude is held constant throughout the test. Because the applied stress’s maximum amplitude remains constant, it is the amplitude of the resulting strain that controls energy dissipation and pore pressures generation in the specimen. As pore pressures are generated in response to the loading, the effective stress acting on the specimen and its ability to resist deformations decreases. This leads to increasing levels of strain within the specimen as the maximum amplitude of the stress applied to the specimen remains constant. Because of this, only a small amount of energy is dissipated during the early part of the test as a result of the small levels of strain produced; however, in the later stages of the test, larger amounts of energy are dissipated in the soil due to the increased strain levels.
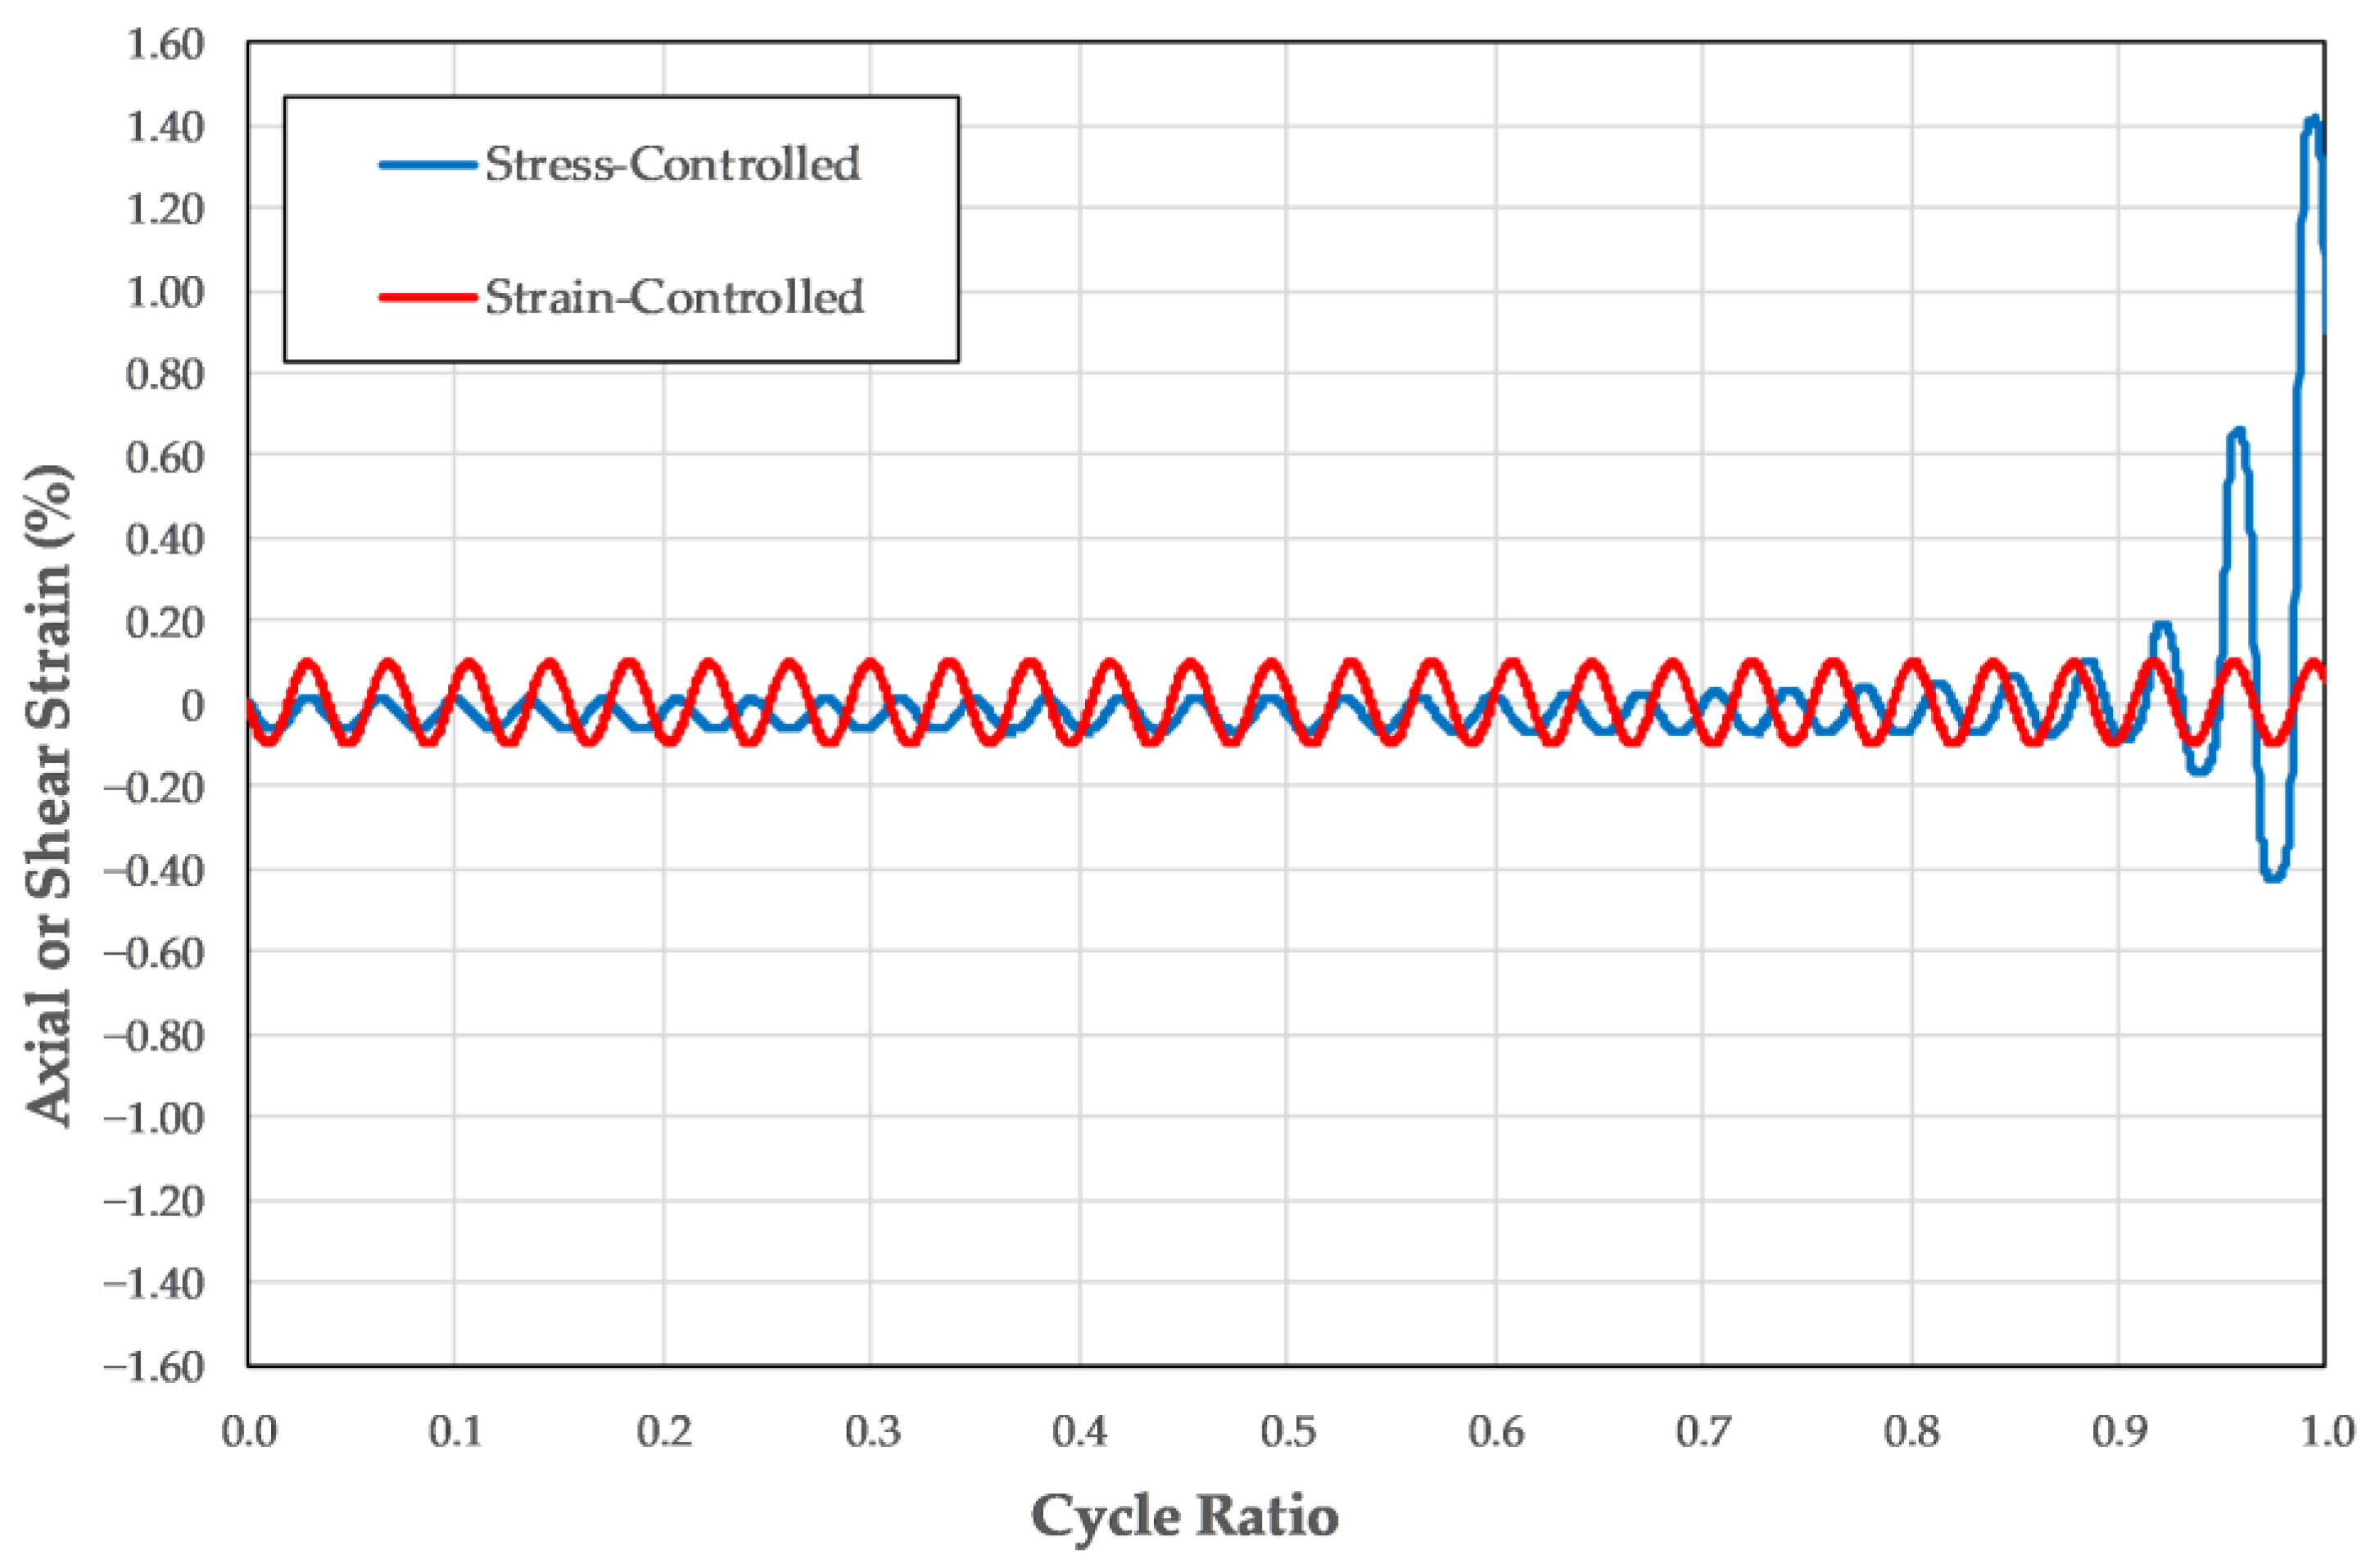
As may be seen in
Figure 2, the maximum amplitude of the applied strain remains constant throughout a strain-controlled cyclic triaxial test or a strain-controlled cyclic direct simple shear test. Because of this, the amount of energy dissipated and excess pore pressure generated are controlled by the resistance to deformation produced by the soil (i.e., the axial or shear stress). As the cyclic loading generates excess pore pressures, both the effective stress and its strength decrease. Because of the strength loss, a decreasing amount of resistance is required to maintain the maximum level of straining as it continues to be applied at a constant level. As a result, during the early part of the test a relatively large amount of energy is dissipated because the soil has the strength required to resist the applied displacements. Later in the test, when the strength is lower, smaller amounts of energy are dissipated in the soil in response to the applied deformations.
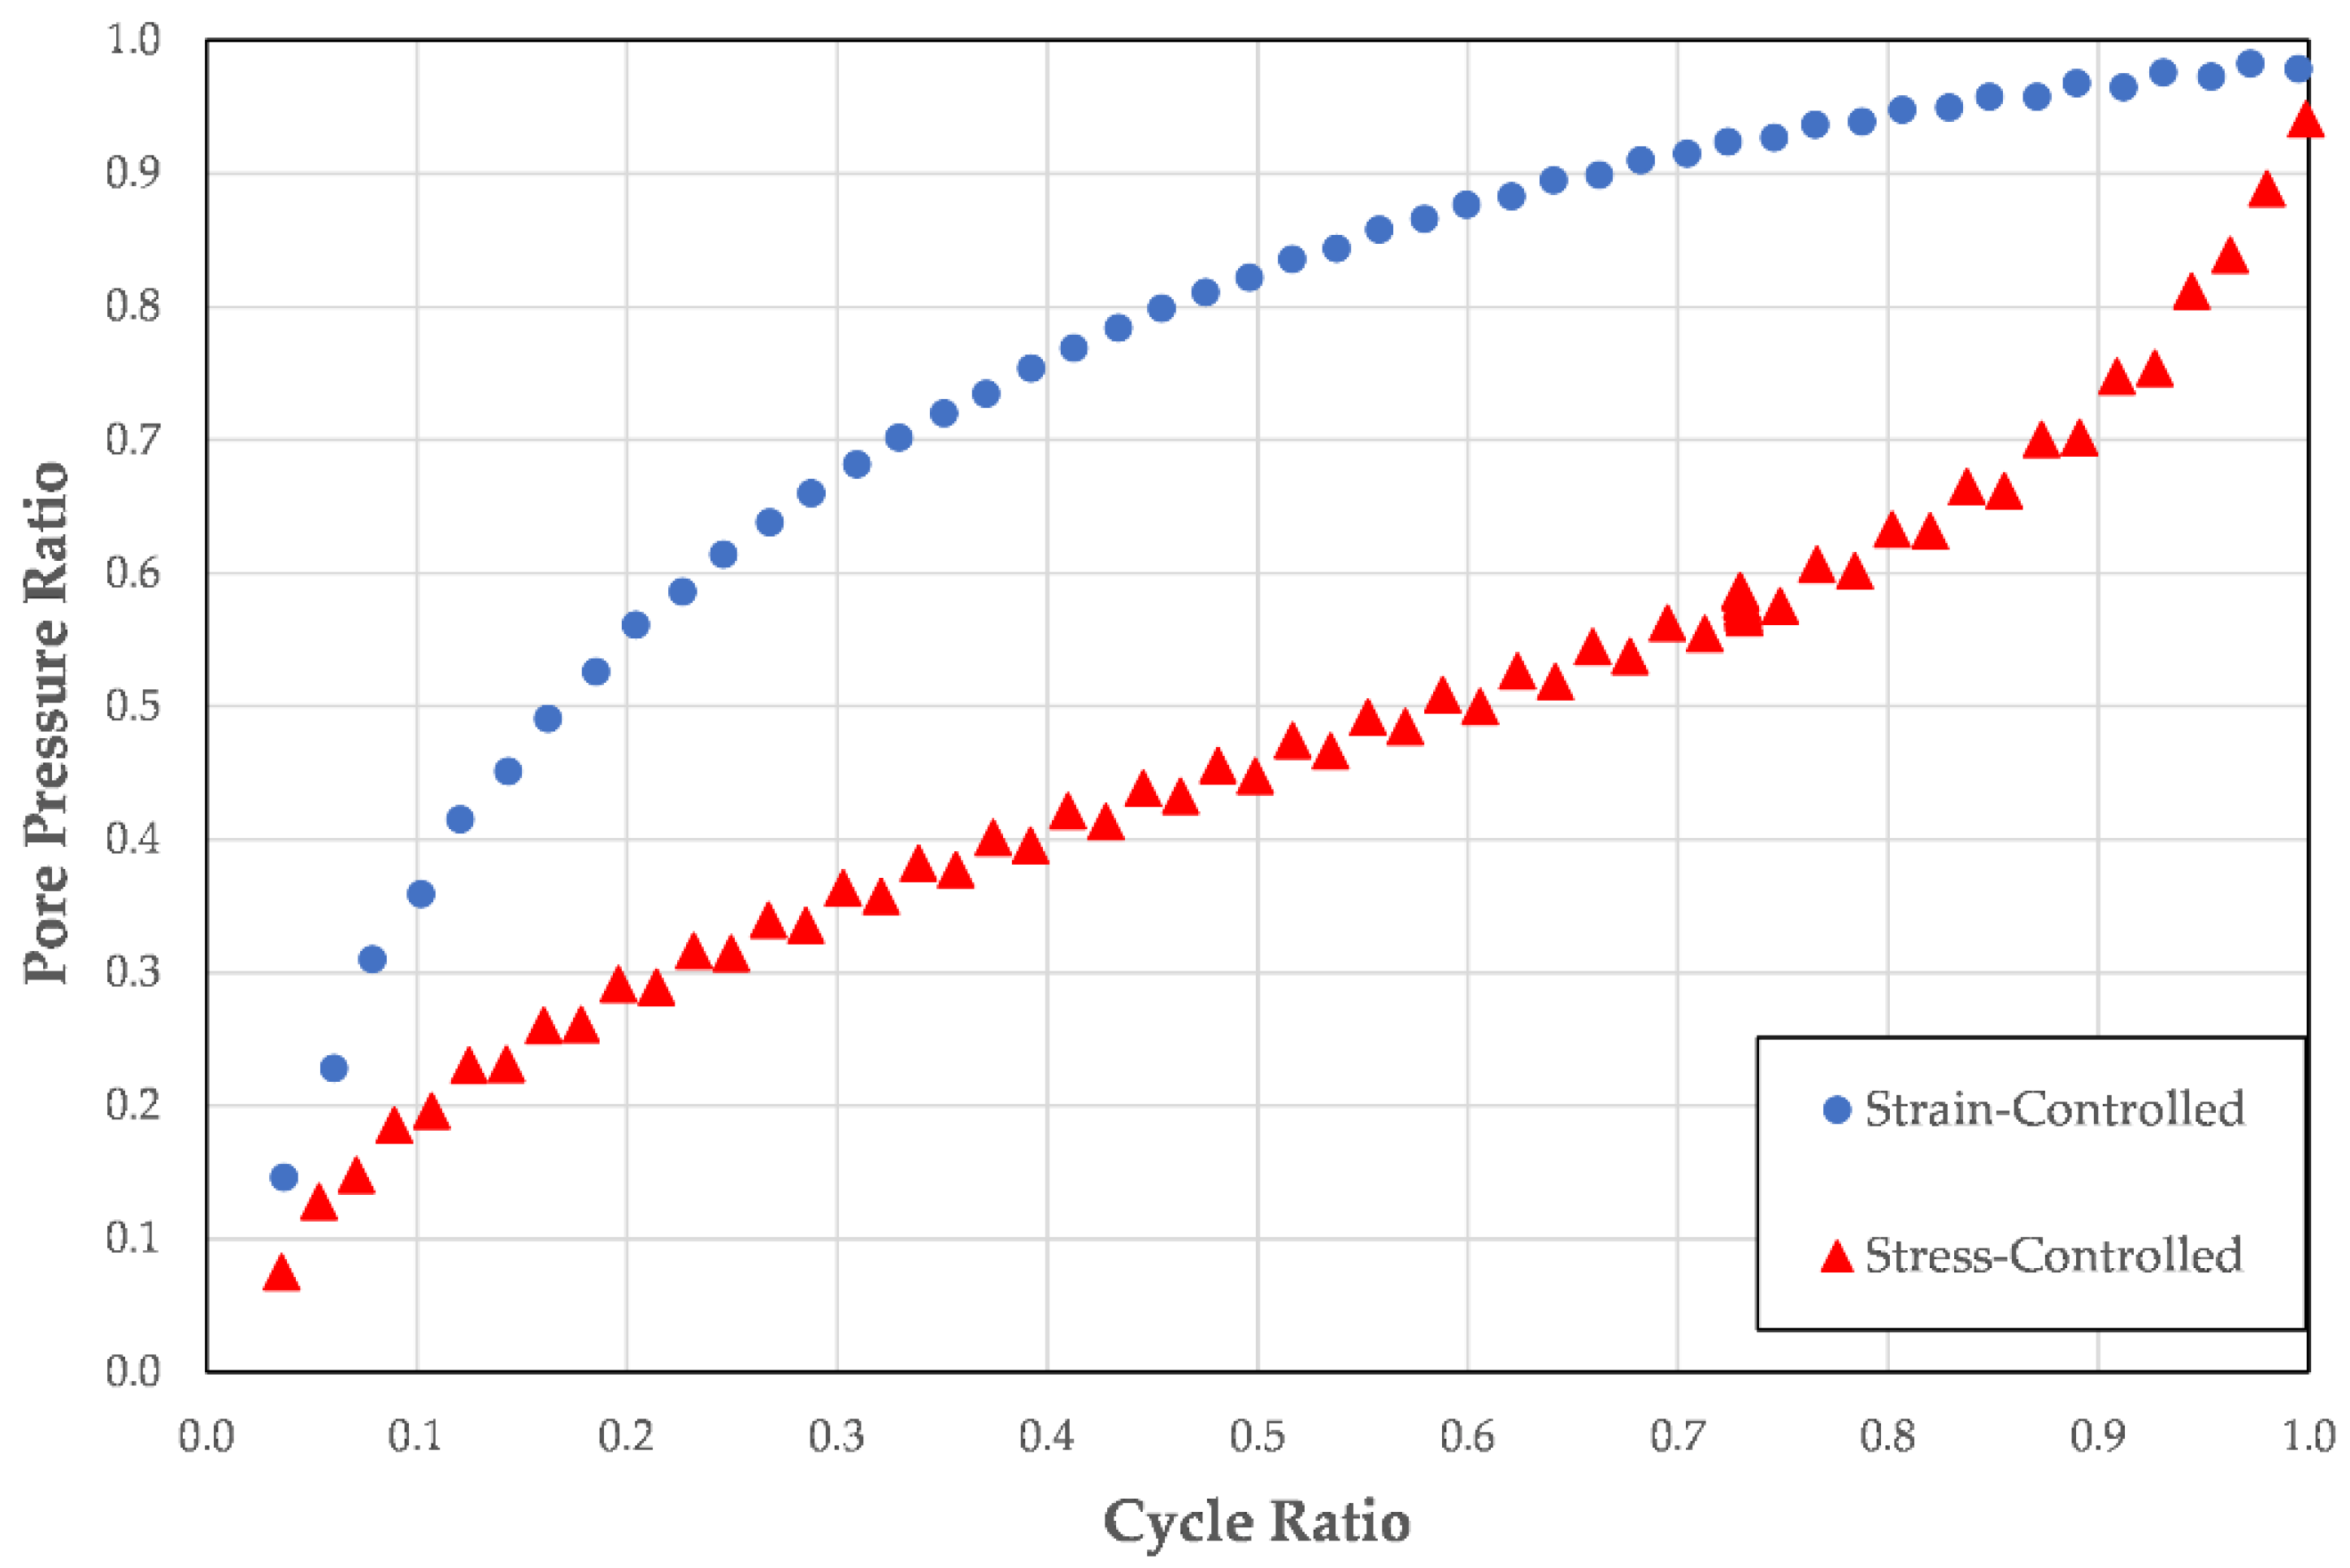
Figure 3 presents the pore pressure ratio plotted against the cycle ratio for one stress-controlled cyclic triaxial test and one strain-controlled cyclic triaxial test performed on specimens of C-109 sand prepared to 40% relative density [
14]. Both tests used sinusoidal loading patterns and the specimens achieved initial liquefaction in 28.1 cycles of loading for the stress-controlled test and 24.0 cycles of loading for the strain-controlled test.
As shown in
Figure 3, in the stress-controlled test, there is little energy dissipation and little pore pressure generation early in the loading due to the small strain levels produced. As loading continues and pore pressure generation leads to lower effective stresses, lower strength and larger strains, the rate of energy dissipation and pore pressure generation increases.
Conversely, it is clear that, when viewed in terms of cycle ratio, the stress-controlled and strain-controlled tests produce very different patterns of pore pressure development. This is a result of the manner in which the load is applied to the soil. For the strain-controlled loading, the energy is largely generated in the early portion of the loading when the soil is still capable of producing strong resistance to the applied strain. As the loading continues, the soil is less capable of resisting the applied strain due to the increased pore pressure and the corresponding decrease in effective stress and strength; as a result, the rate of energy dissipation decreases, as does the rate of pore pressure generation.
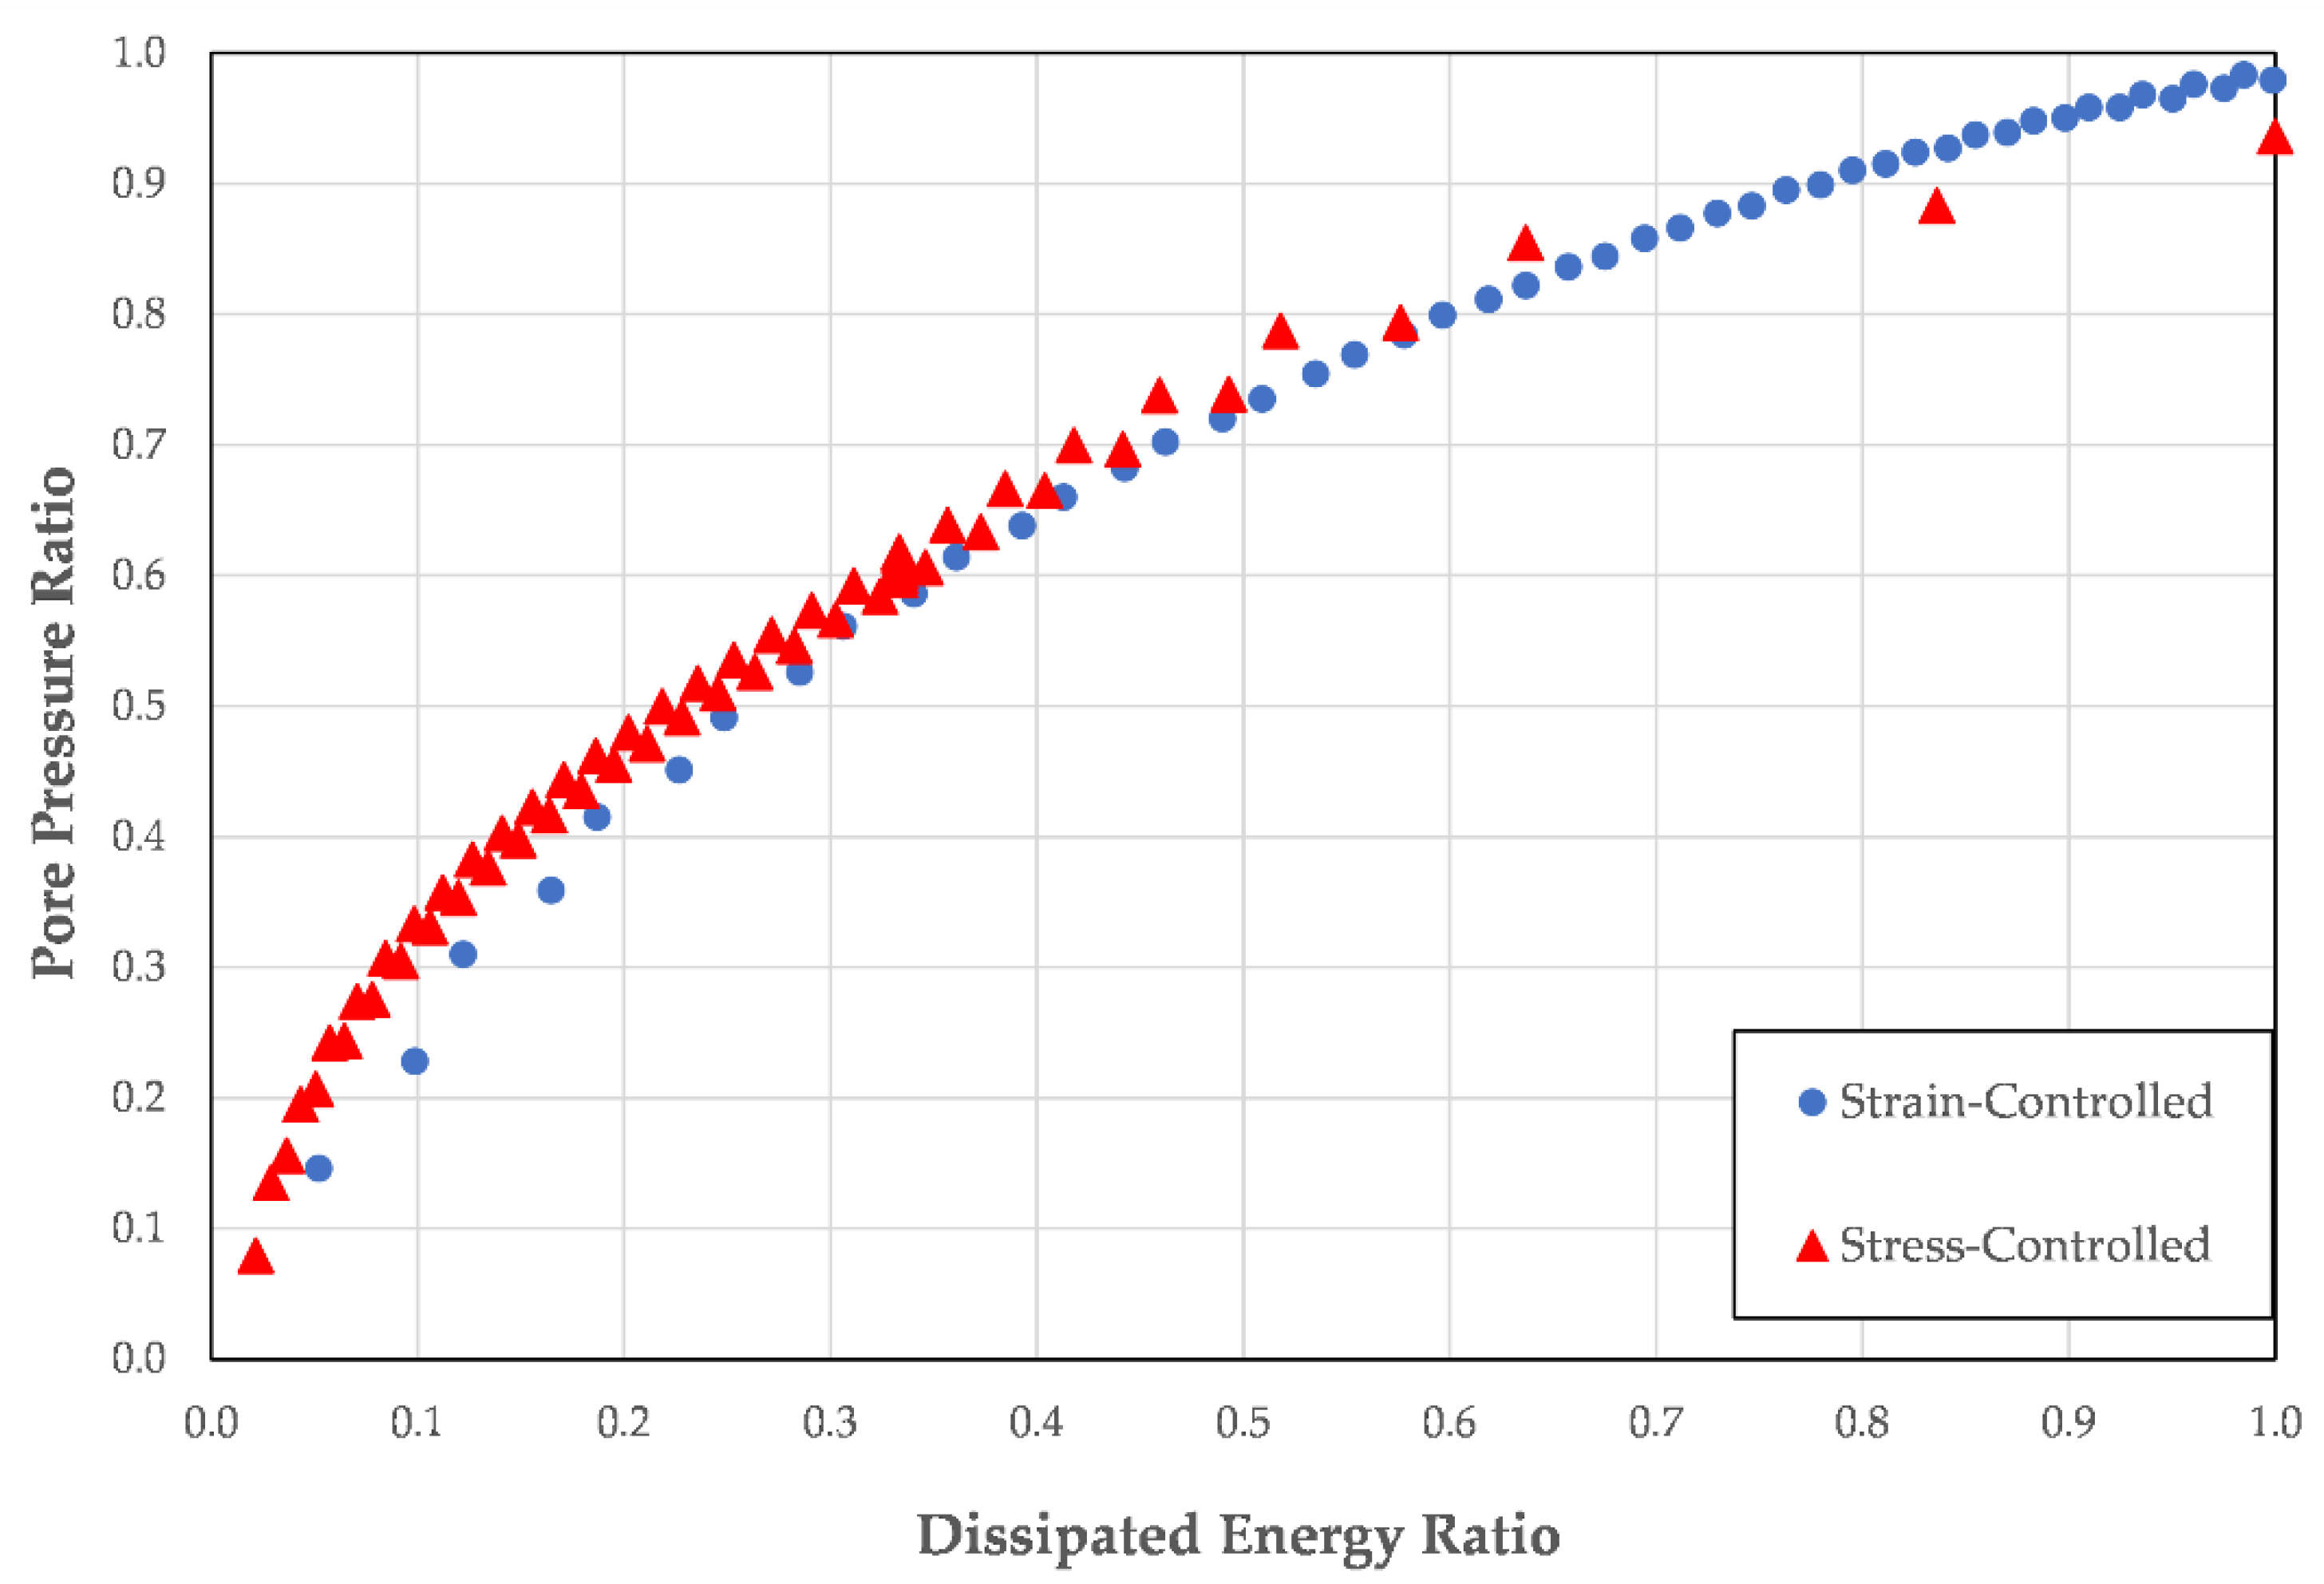
Figure 4 presents the pore pressure ratio plotted against the dissipated energy ratio for the stress-controlled and the strain-controlled cyclic triaxial tests performed on specimens of C-109 sand. It can be seen that, when viewed in terms of dissipated energy ratio, the two tests have nearly identical pore pressure generation patterns.
When viewed in terms of dissipated energy ratio, the similarity of the two pore pressure generation patterns is a result of the direct link between energy dissipation and pore pressure generation. There is no inherent link between energy dissipation and cycle ratio, therefore there is no inherent link between cycle ratio and pore pressure generation.
When plotted against the dissipated energy ratio, the pore pressure ratio is plotted against the fraction of the total energy that is dissipated during the test. Because the dissipated energy ratio is based on the total amount of energy dissipated in the entire test, it does not matter where in the loading the energy dissipation occurs. Conversely, when plotted against cycle ratio, the pore pressure ratio is a function of how many cycles of loading have occurred, regardless of how much energy has been dissipated in those cycles.
4.2. Test Type
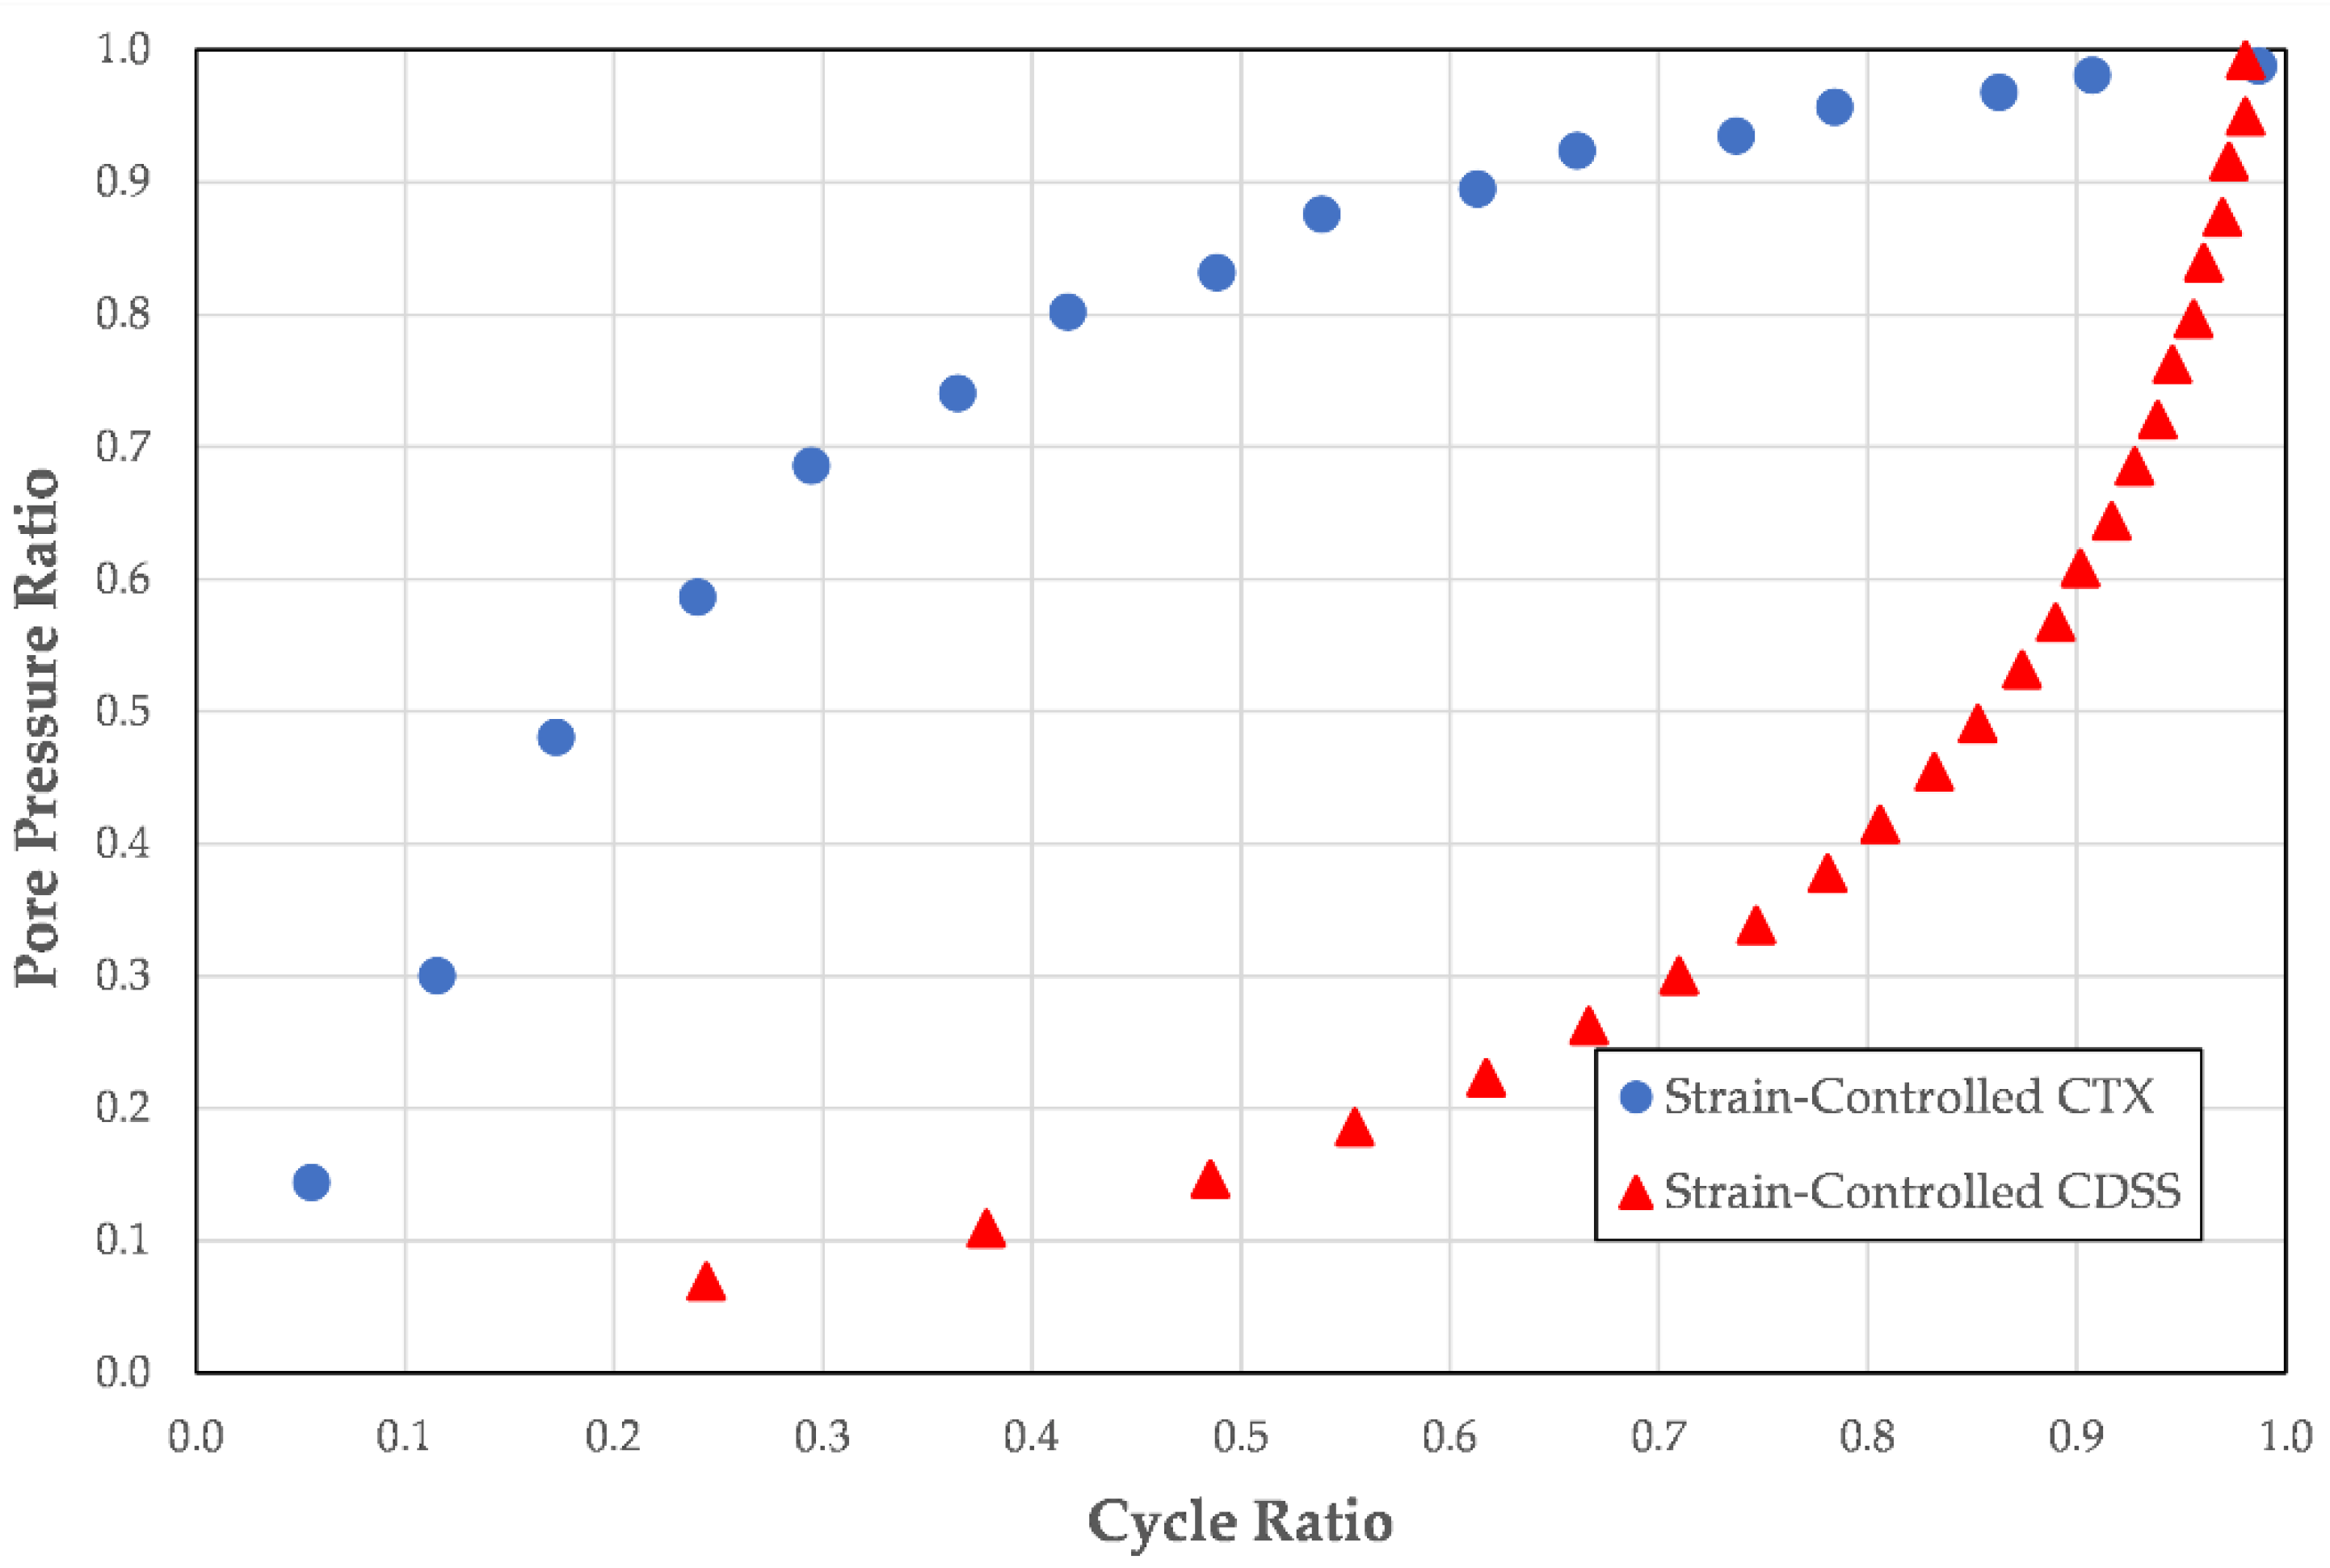
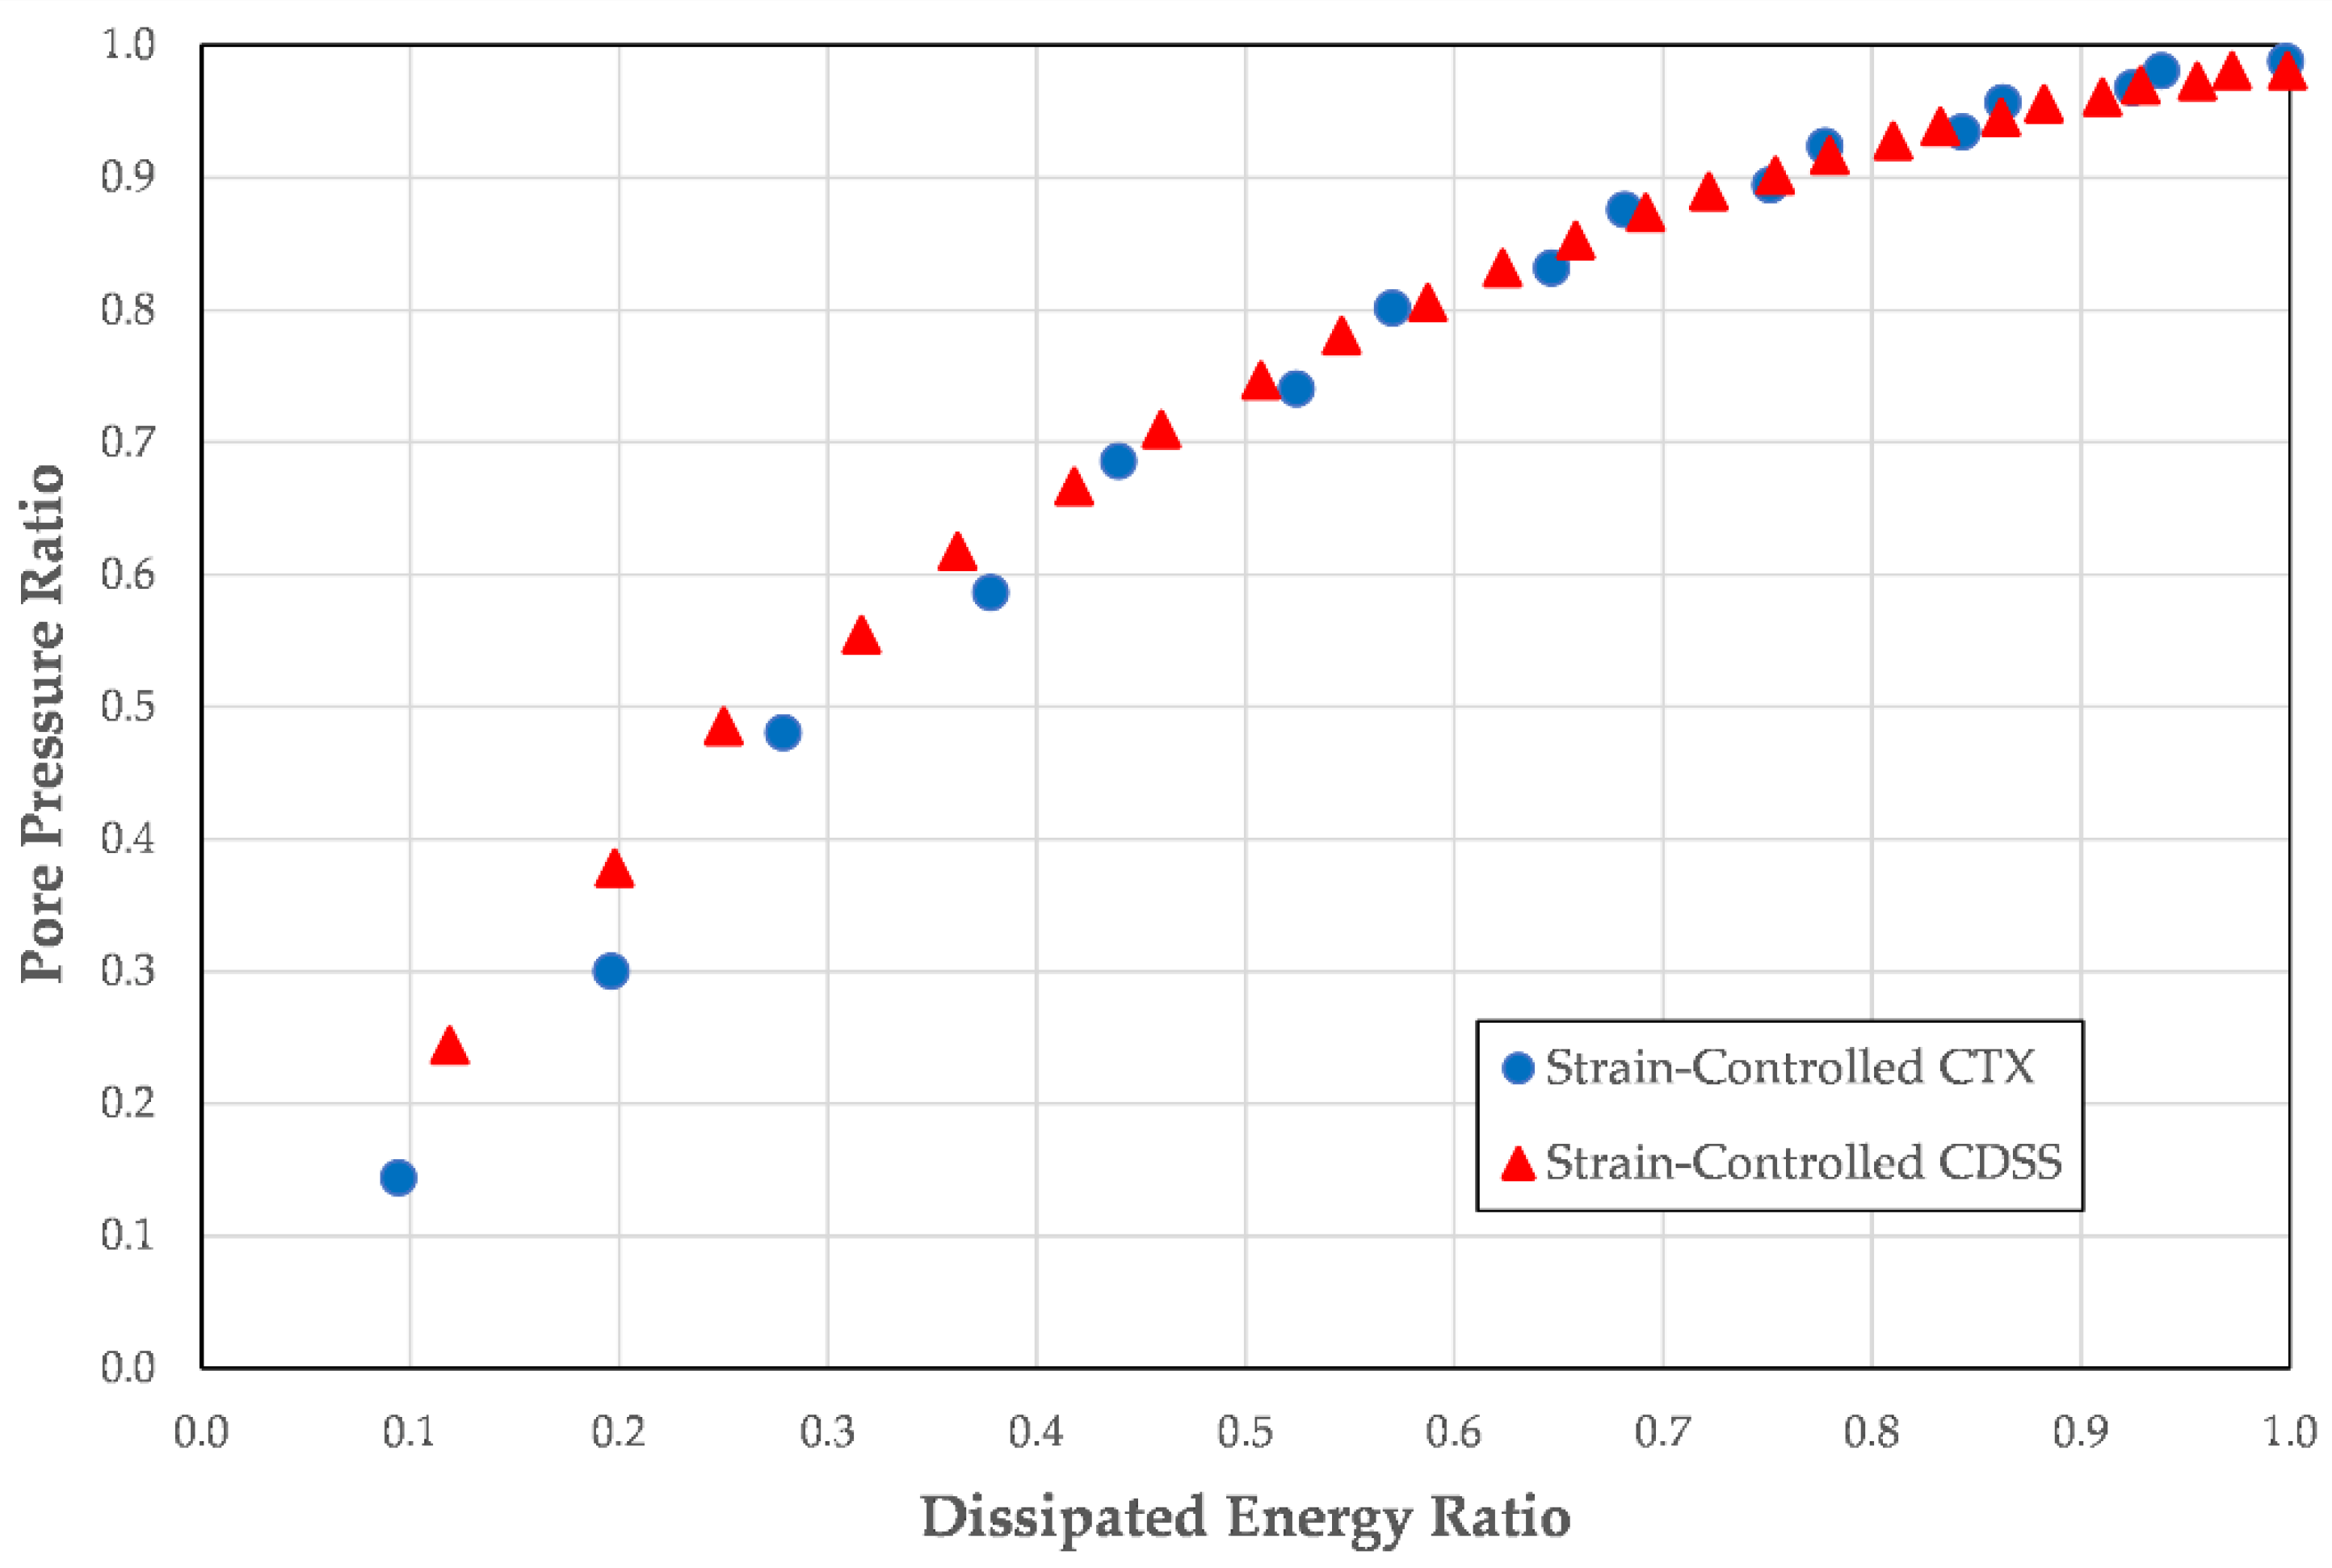
One strain-controlled cyclic triaxial test [unpublished] and one strain-controlled cyclic direct simple shear test [
14] were selected from a series of tests performed on specimens of C-109 sand prepared to 40% relative density. The specimen tested in the cyclic triaxial test reached initial liquefaction in eight cycles of loading and the specimen tested in the cyclic direct simple shear test reached initial liquefaction in 12 cycles of loading.
Figure 5 presents the pore pressure ratio plotted against the cycle ratio for the tests, while
Figure 6 presents the pore pressure ratio plotted against the dissipated energy ratio for the same tests.
As may be seen in
Figure 5, the cyclic triaxial and cyclic direct simple shear tests produce very different pore pressure generation patterns when plotted as a function of the cycle ratio.
Figure 6 reveals that, similar to the stress-controlled and strain-controlled triaxial tests, the two tests produce very similar pore pressure generation patterns when plotted in terms of their dissipated energy ratios.
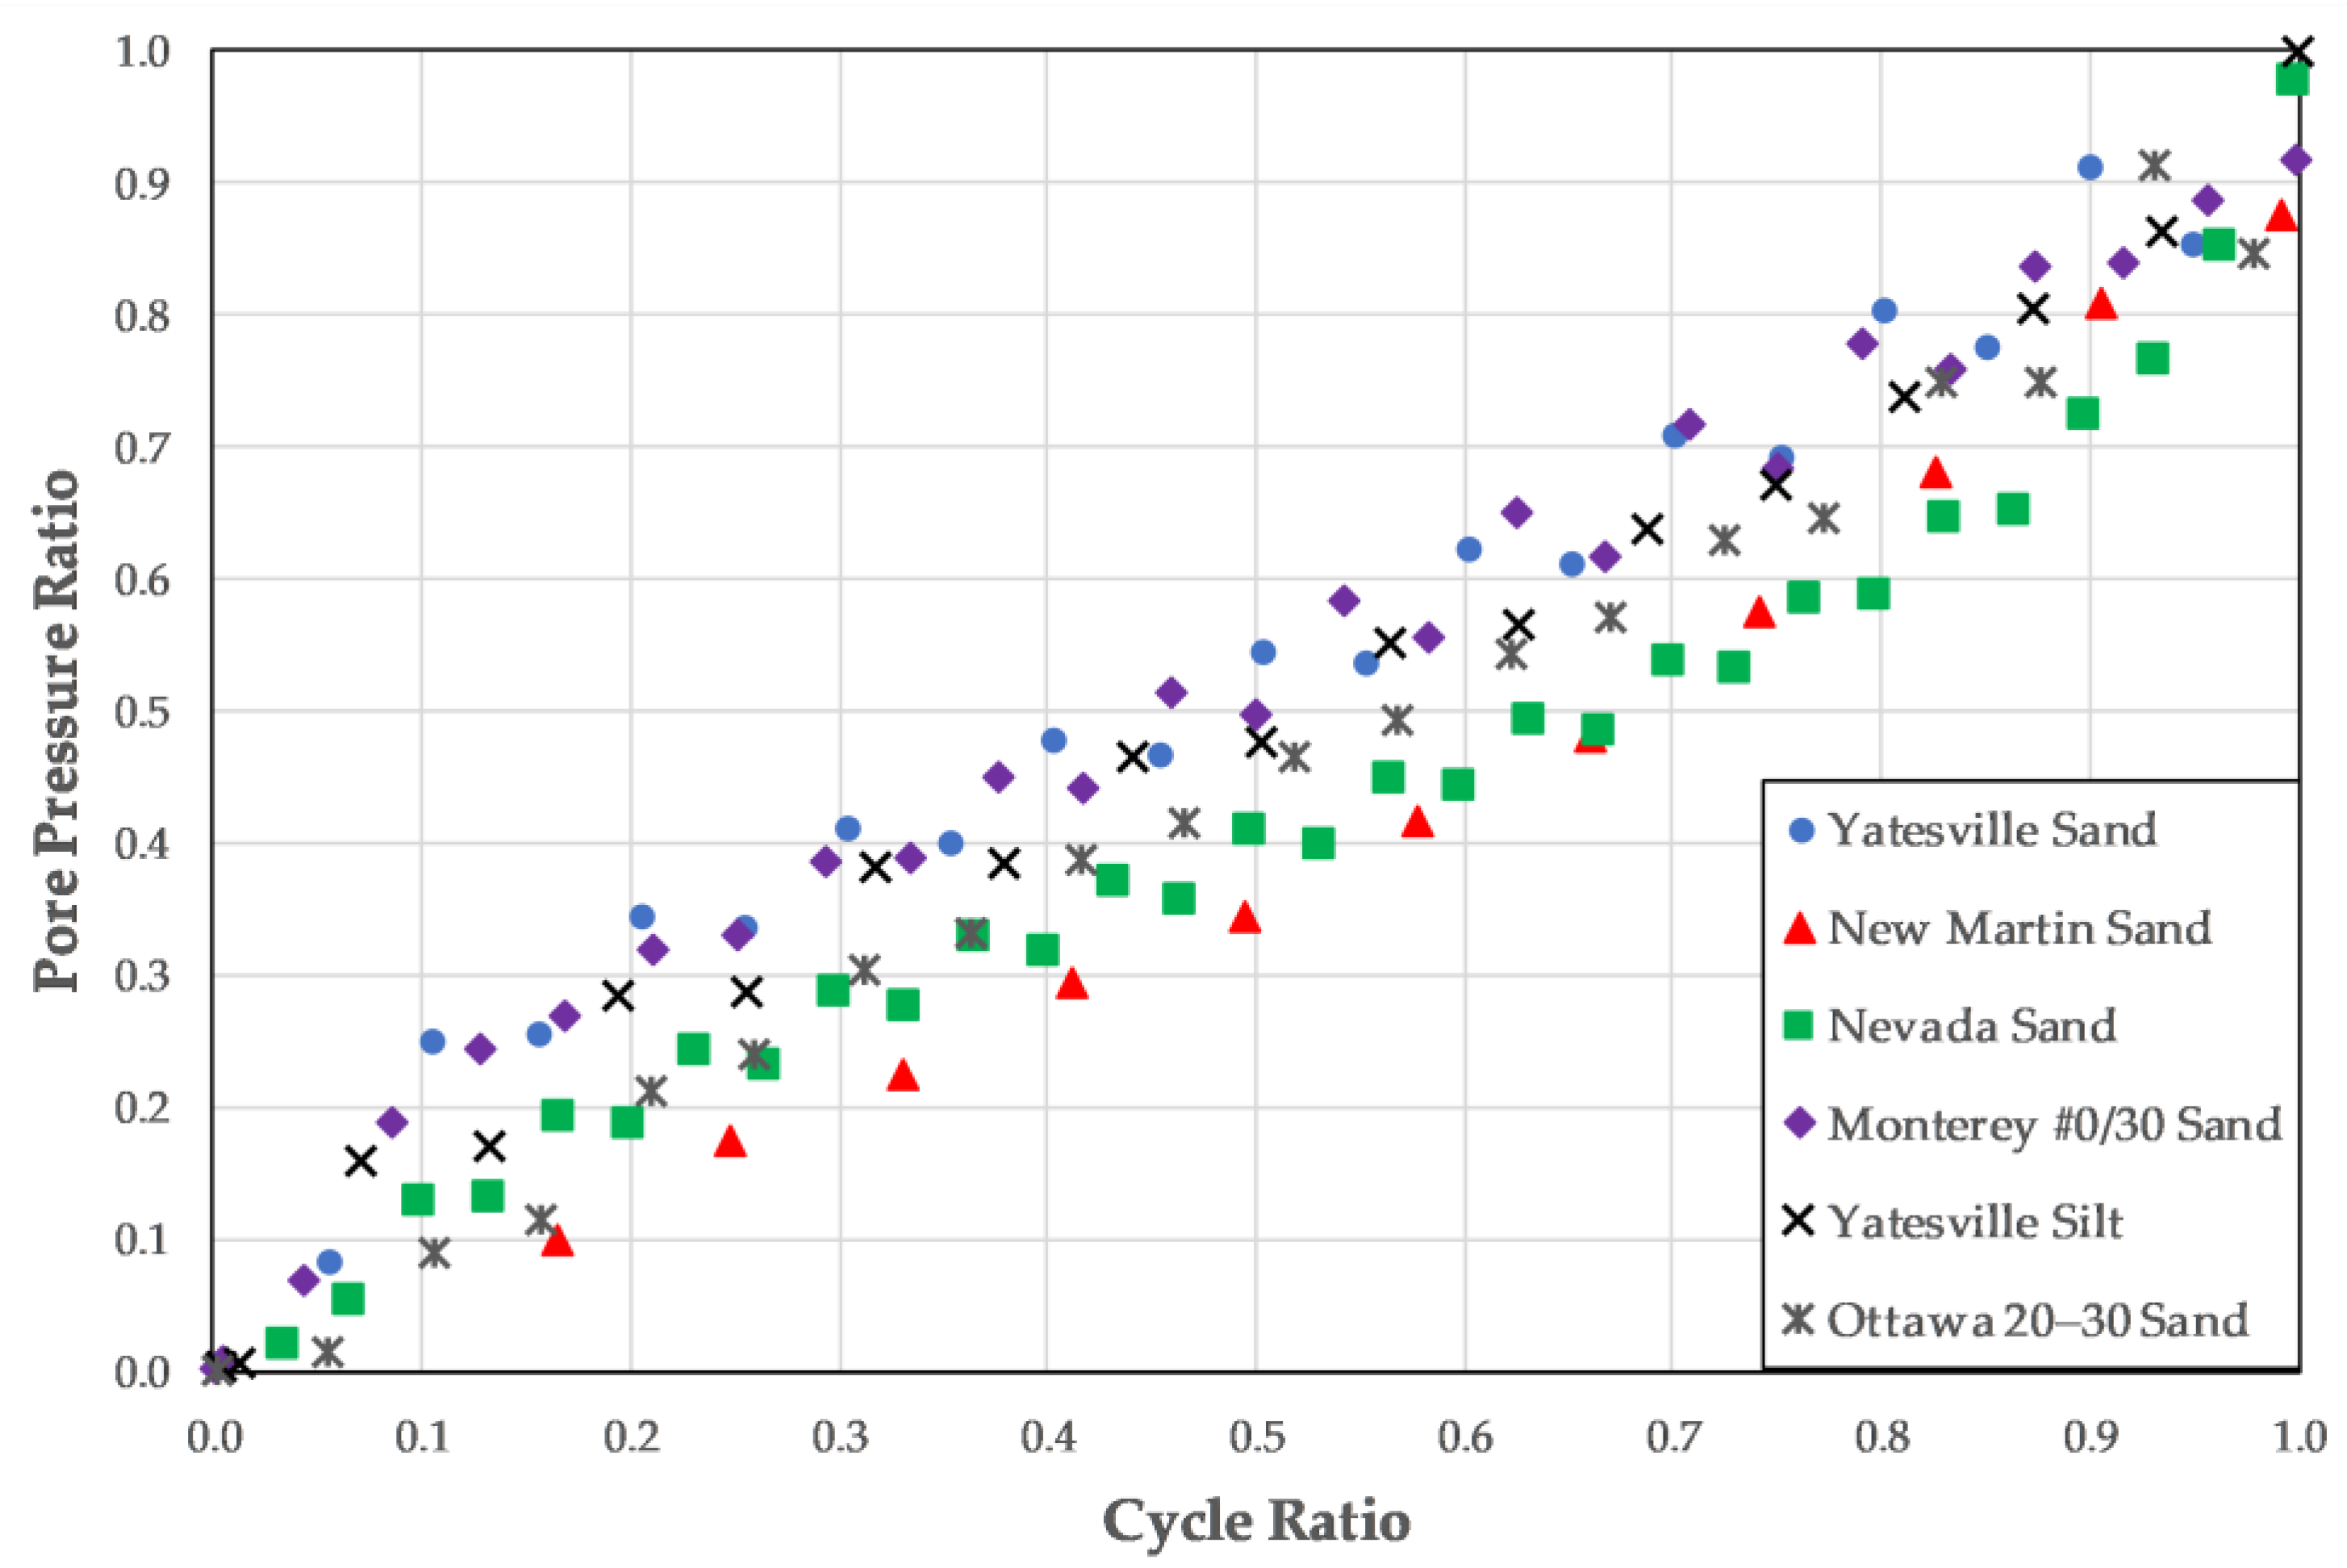
4.3. Soil Type
The results of six stressed-controlled cyclic triaxial tests selected from a series of tests performed on five different sands and one silt were used to evaluate the effect of soil type on pore pressure generation patterns [
14,
17,
18,
19]. All of the tests liquefied at between 6 and 14 cycles of loading.
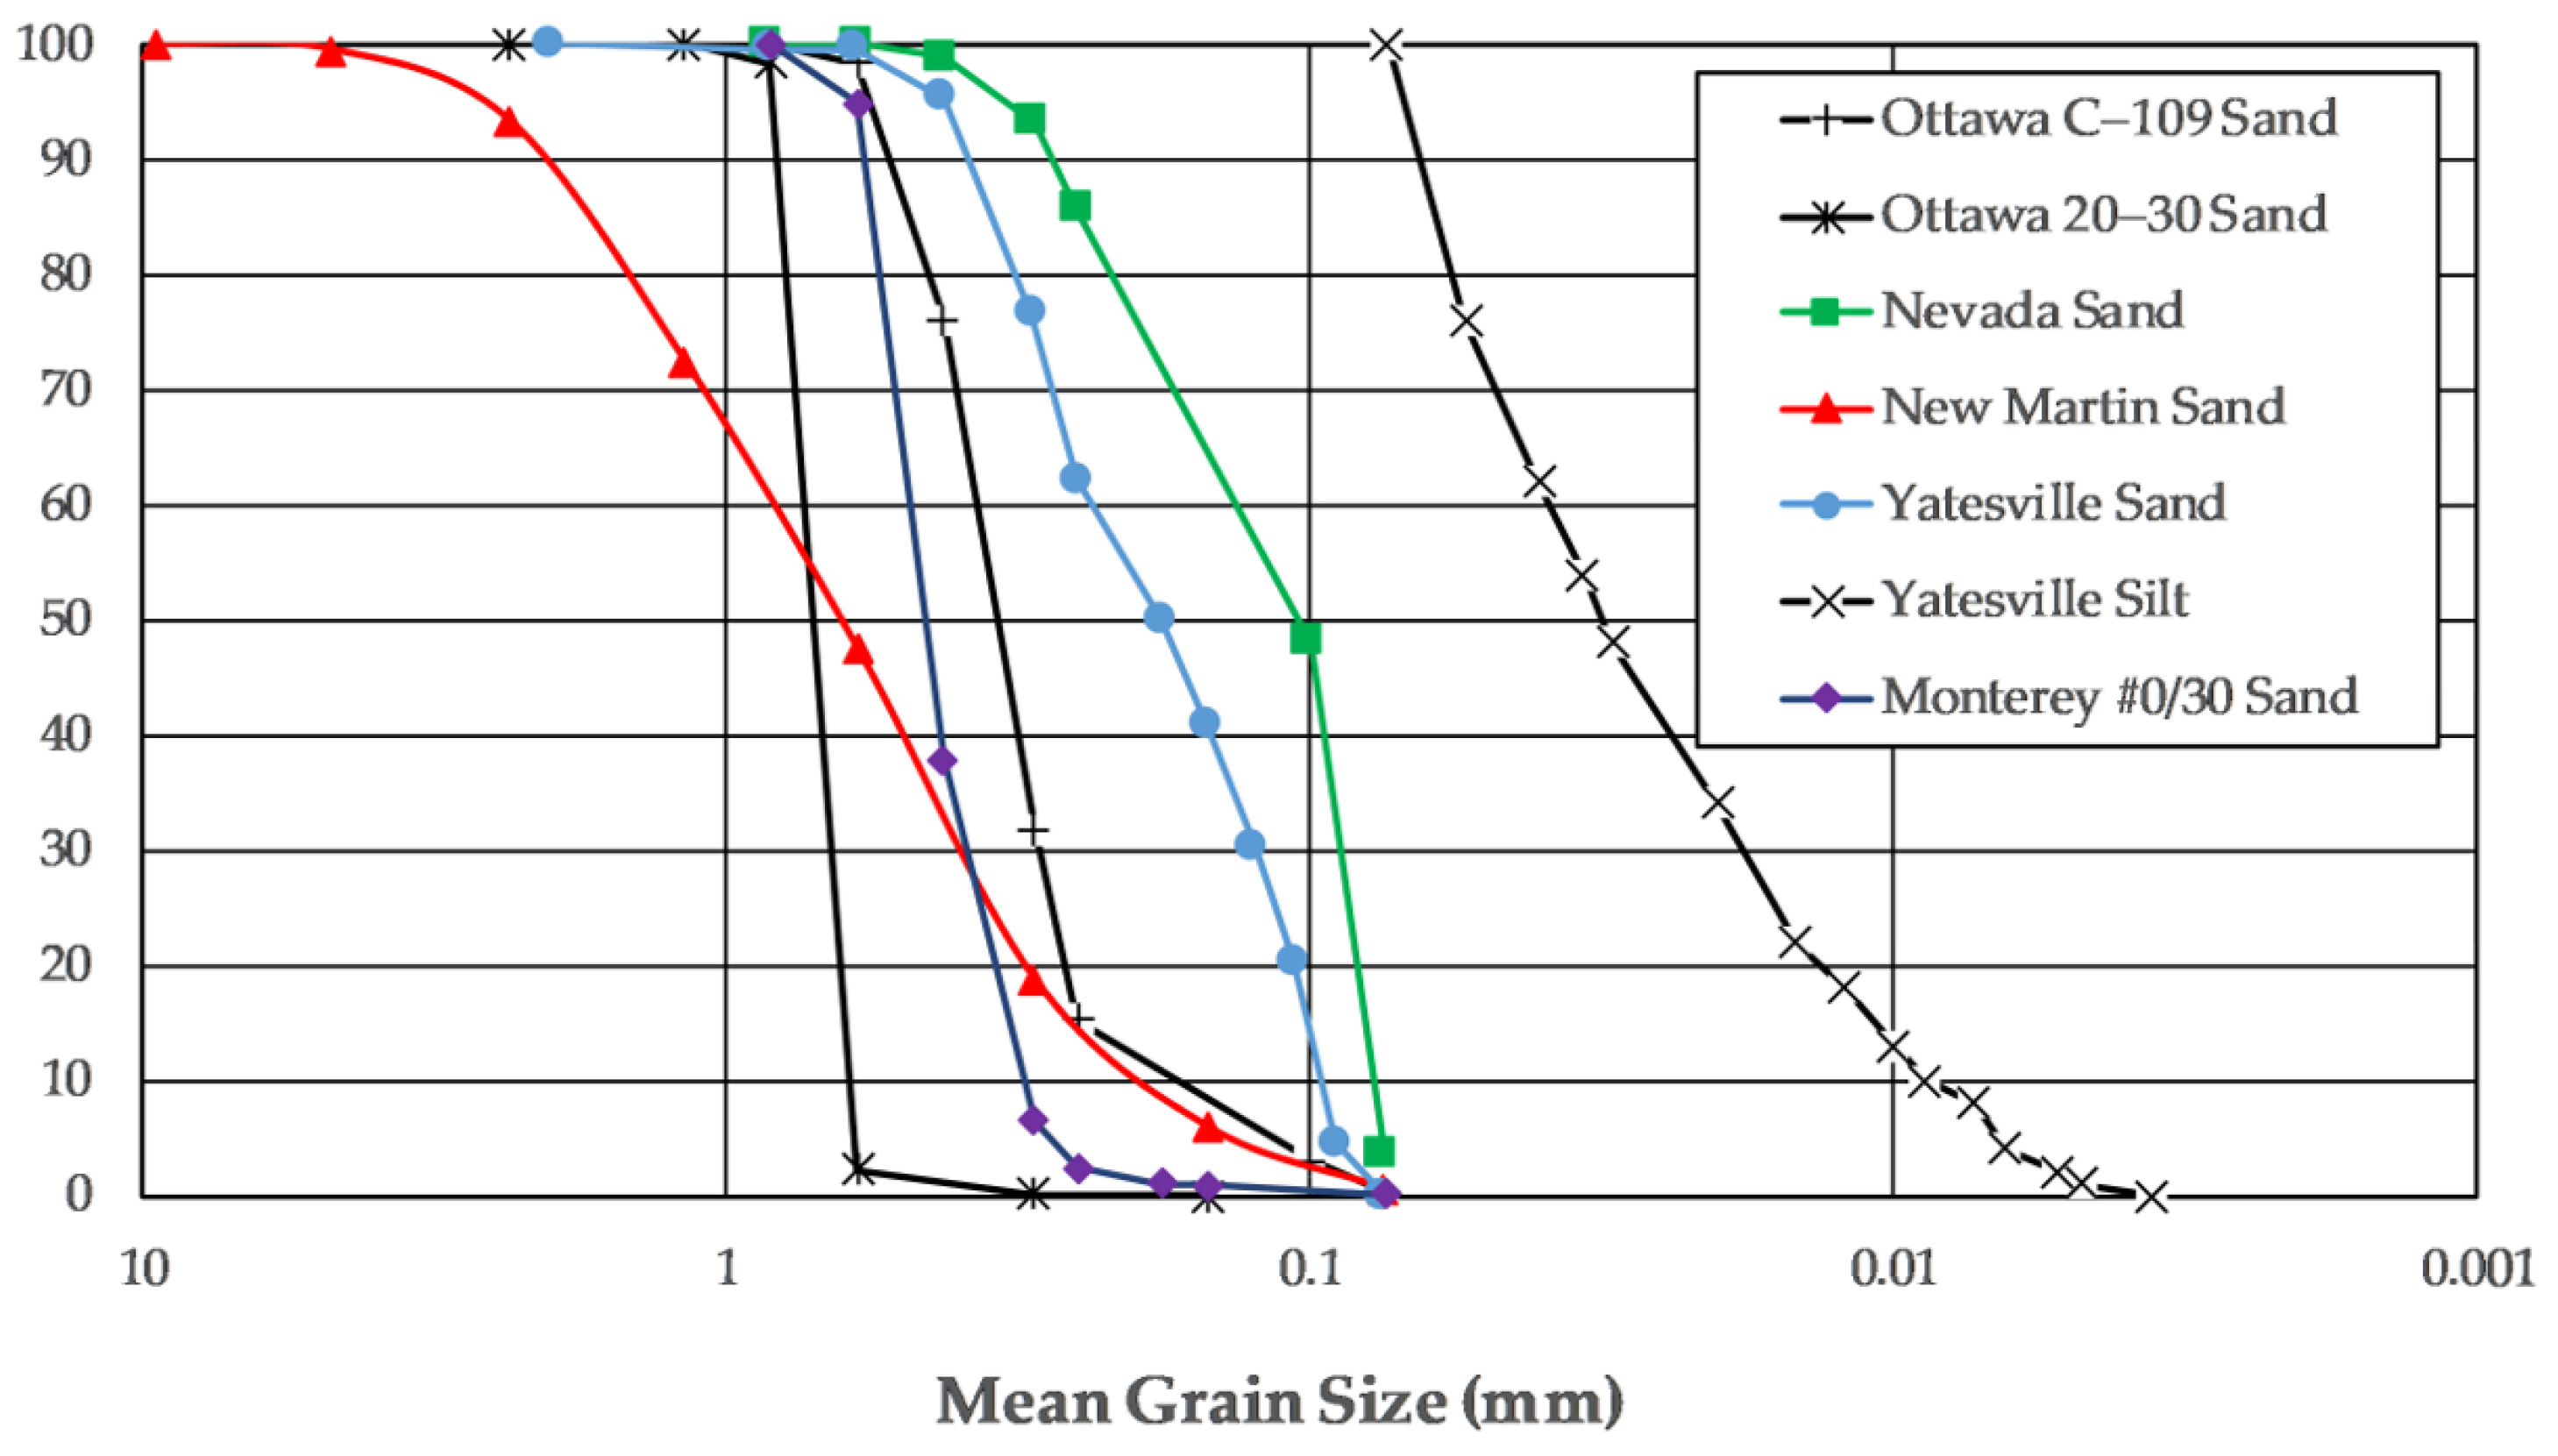
The sands tested varied in gradation from well graded to poorly graded; in median grain size, D
50, from 0.03 mm to 0.71 mm; in coefficient of uniformity, C
u, from 1.20 to 4.61; in coefficient of curvature, C
c, from 0.77 to 1.04; in maximum index void ratio, e
max, from 0.547 to 1.723; and in minimum index void ratio, e
min, from 0.337 to 0.727. The grain size distribution curves for these soils are presented in
Figure 7.
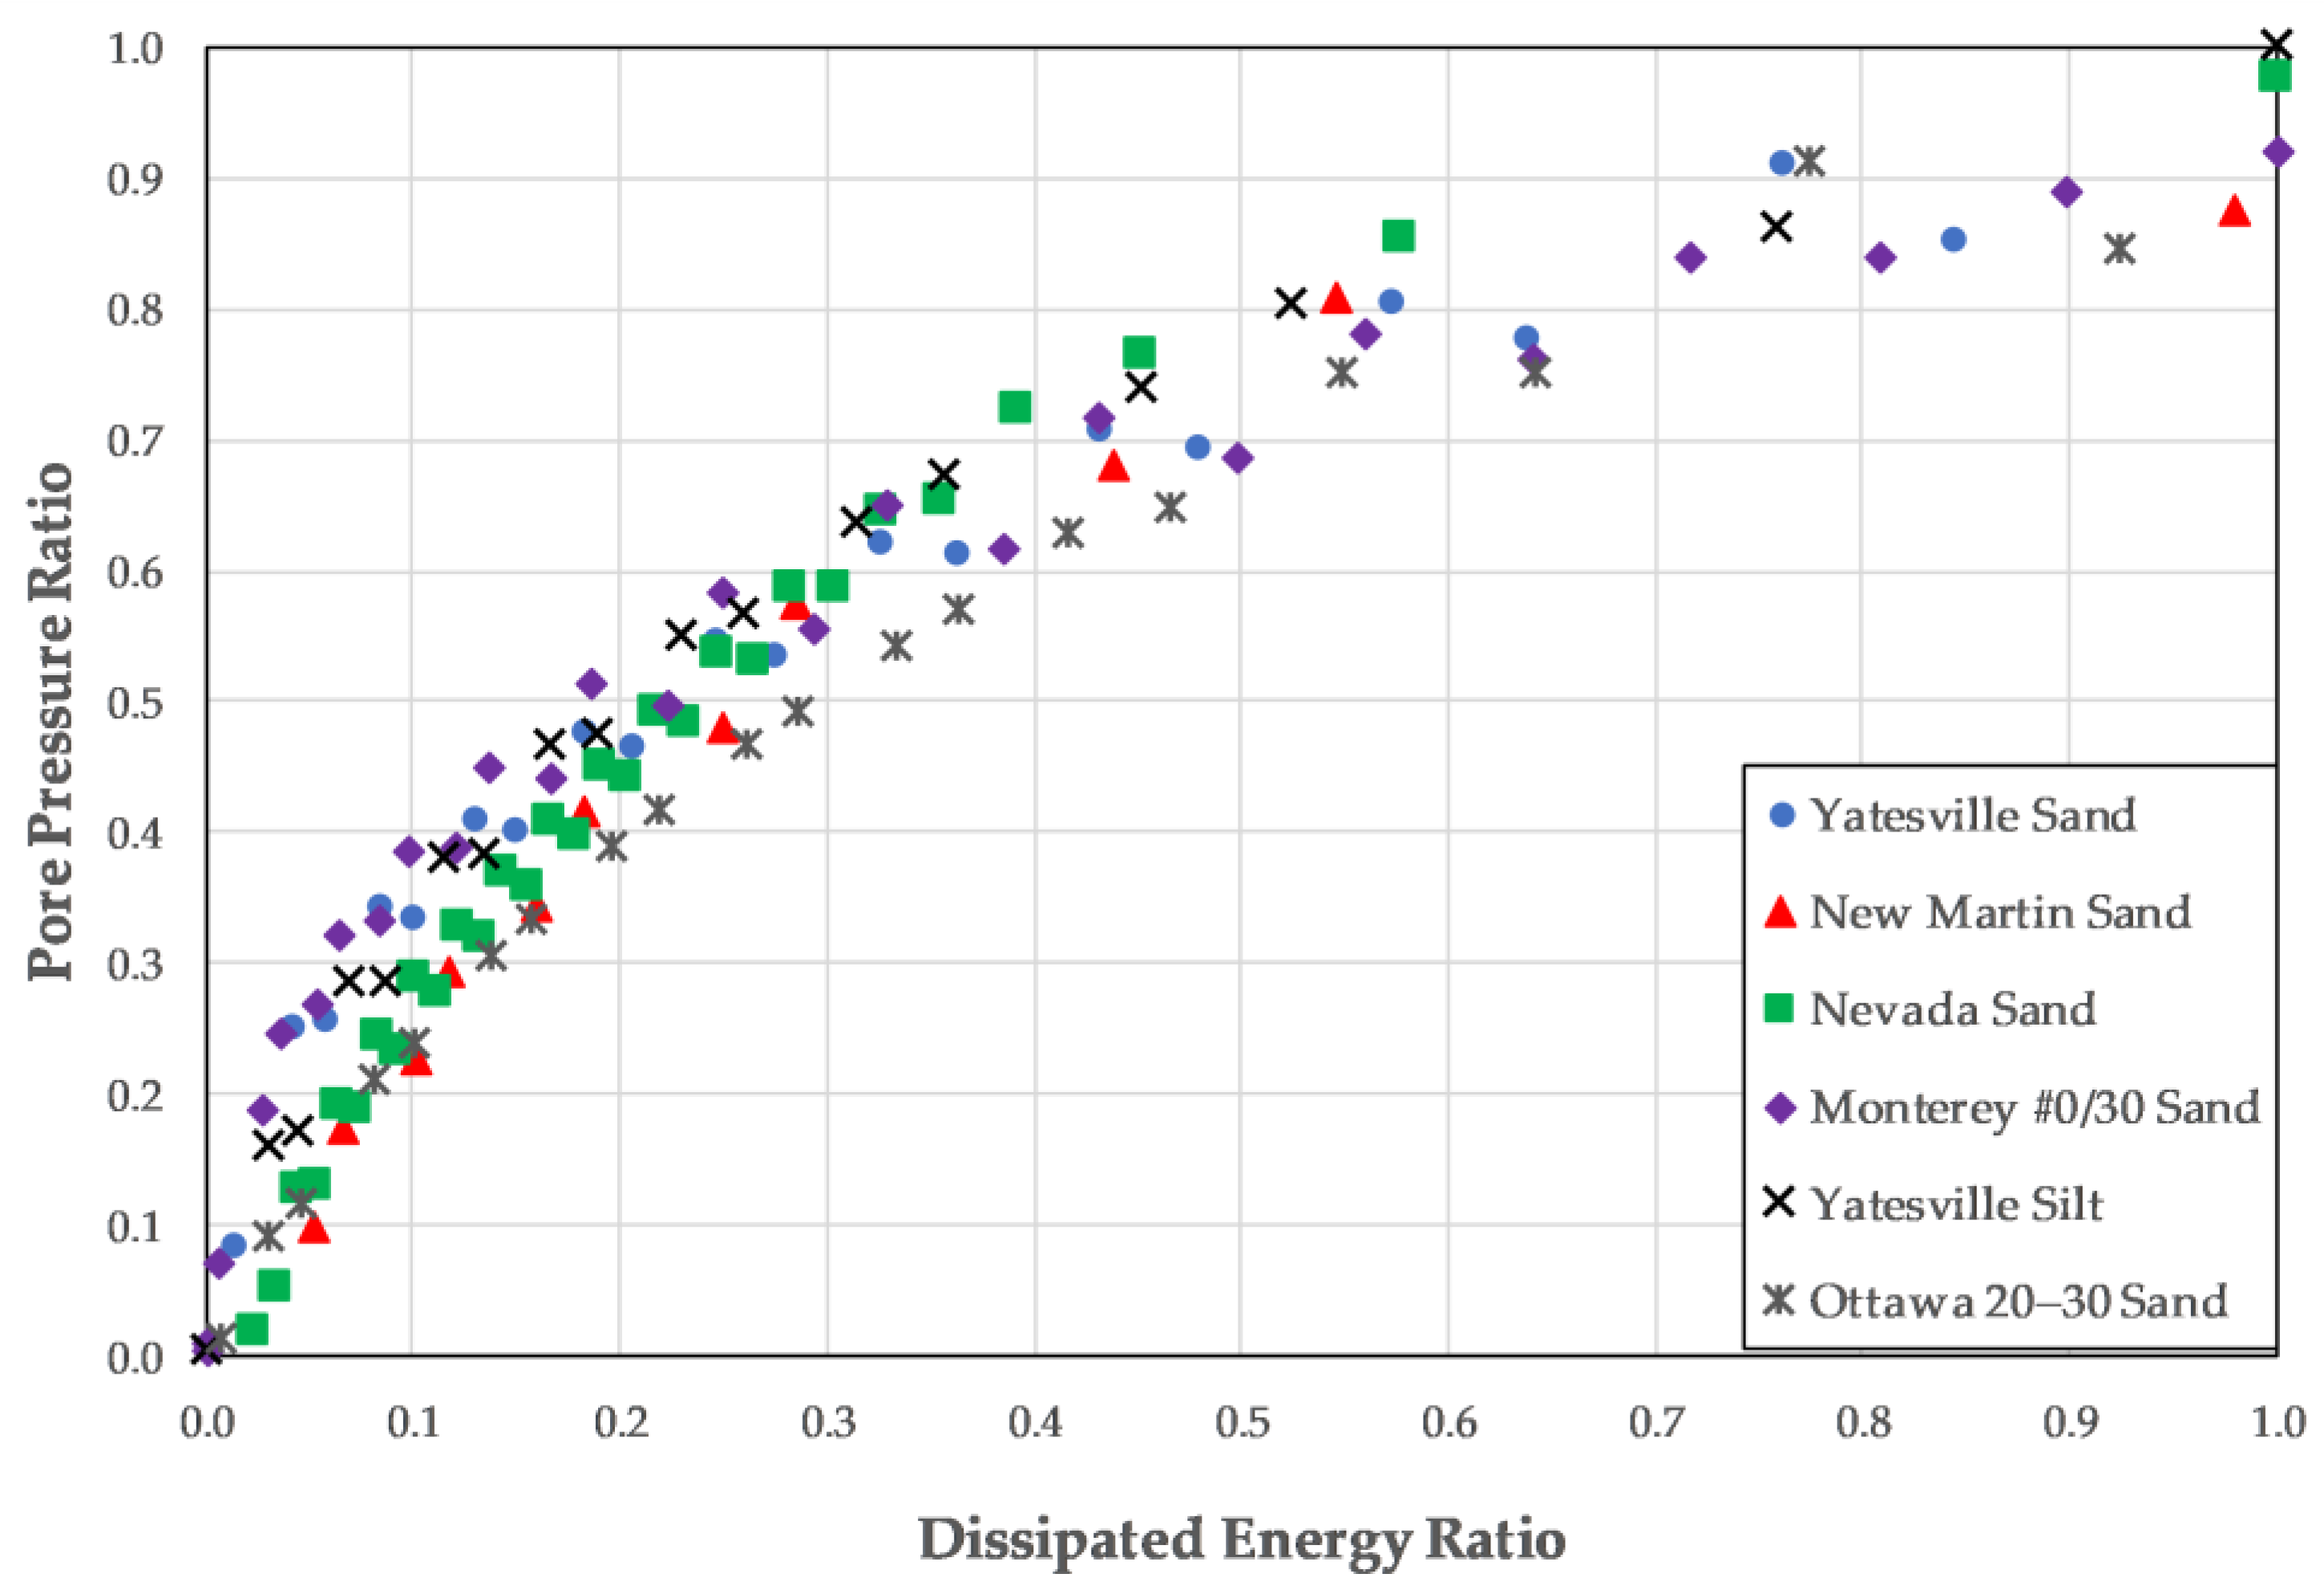
Figure 8 presents the pore pressure ratio plotted against the cycle ratio for the six tests, while
Figure 9 presents the pore pressure ratio plotted against the dissipated energy ratio for the same tests.
As may been seen in
Figure 8 and
Figure 9 for sands and non-plastic silts, soil type does not play a significant role in either the energy dissipation or the pore pressure generation pattern of the soil. This holds true whether the pore pressure ratio is plotted against the cycle ratio or dissipated energy ratio.
4.4. Non-Plastic Silt Content
The results of 10 stress-controlled cyclic triaxial tests performed on mixtures of Yatesville sand and Yatesville silt with non-plastic silt contents ranging from 0 to 100% were examined [
17,
18]. All specimens were prepared to relative densities of approximately 26%, which required that the specimen at each non-plastic silt content was prepared to a different void ratio. The test results were examined to gain insight into the effects of non-plastic silt content on pore pressure generation and energy dissipation patterns.
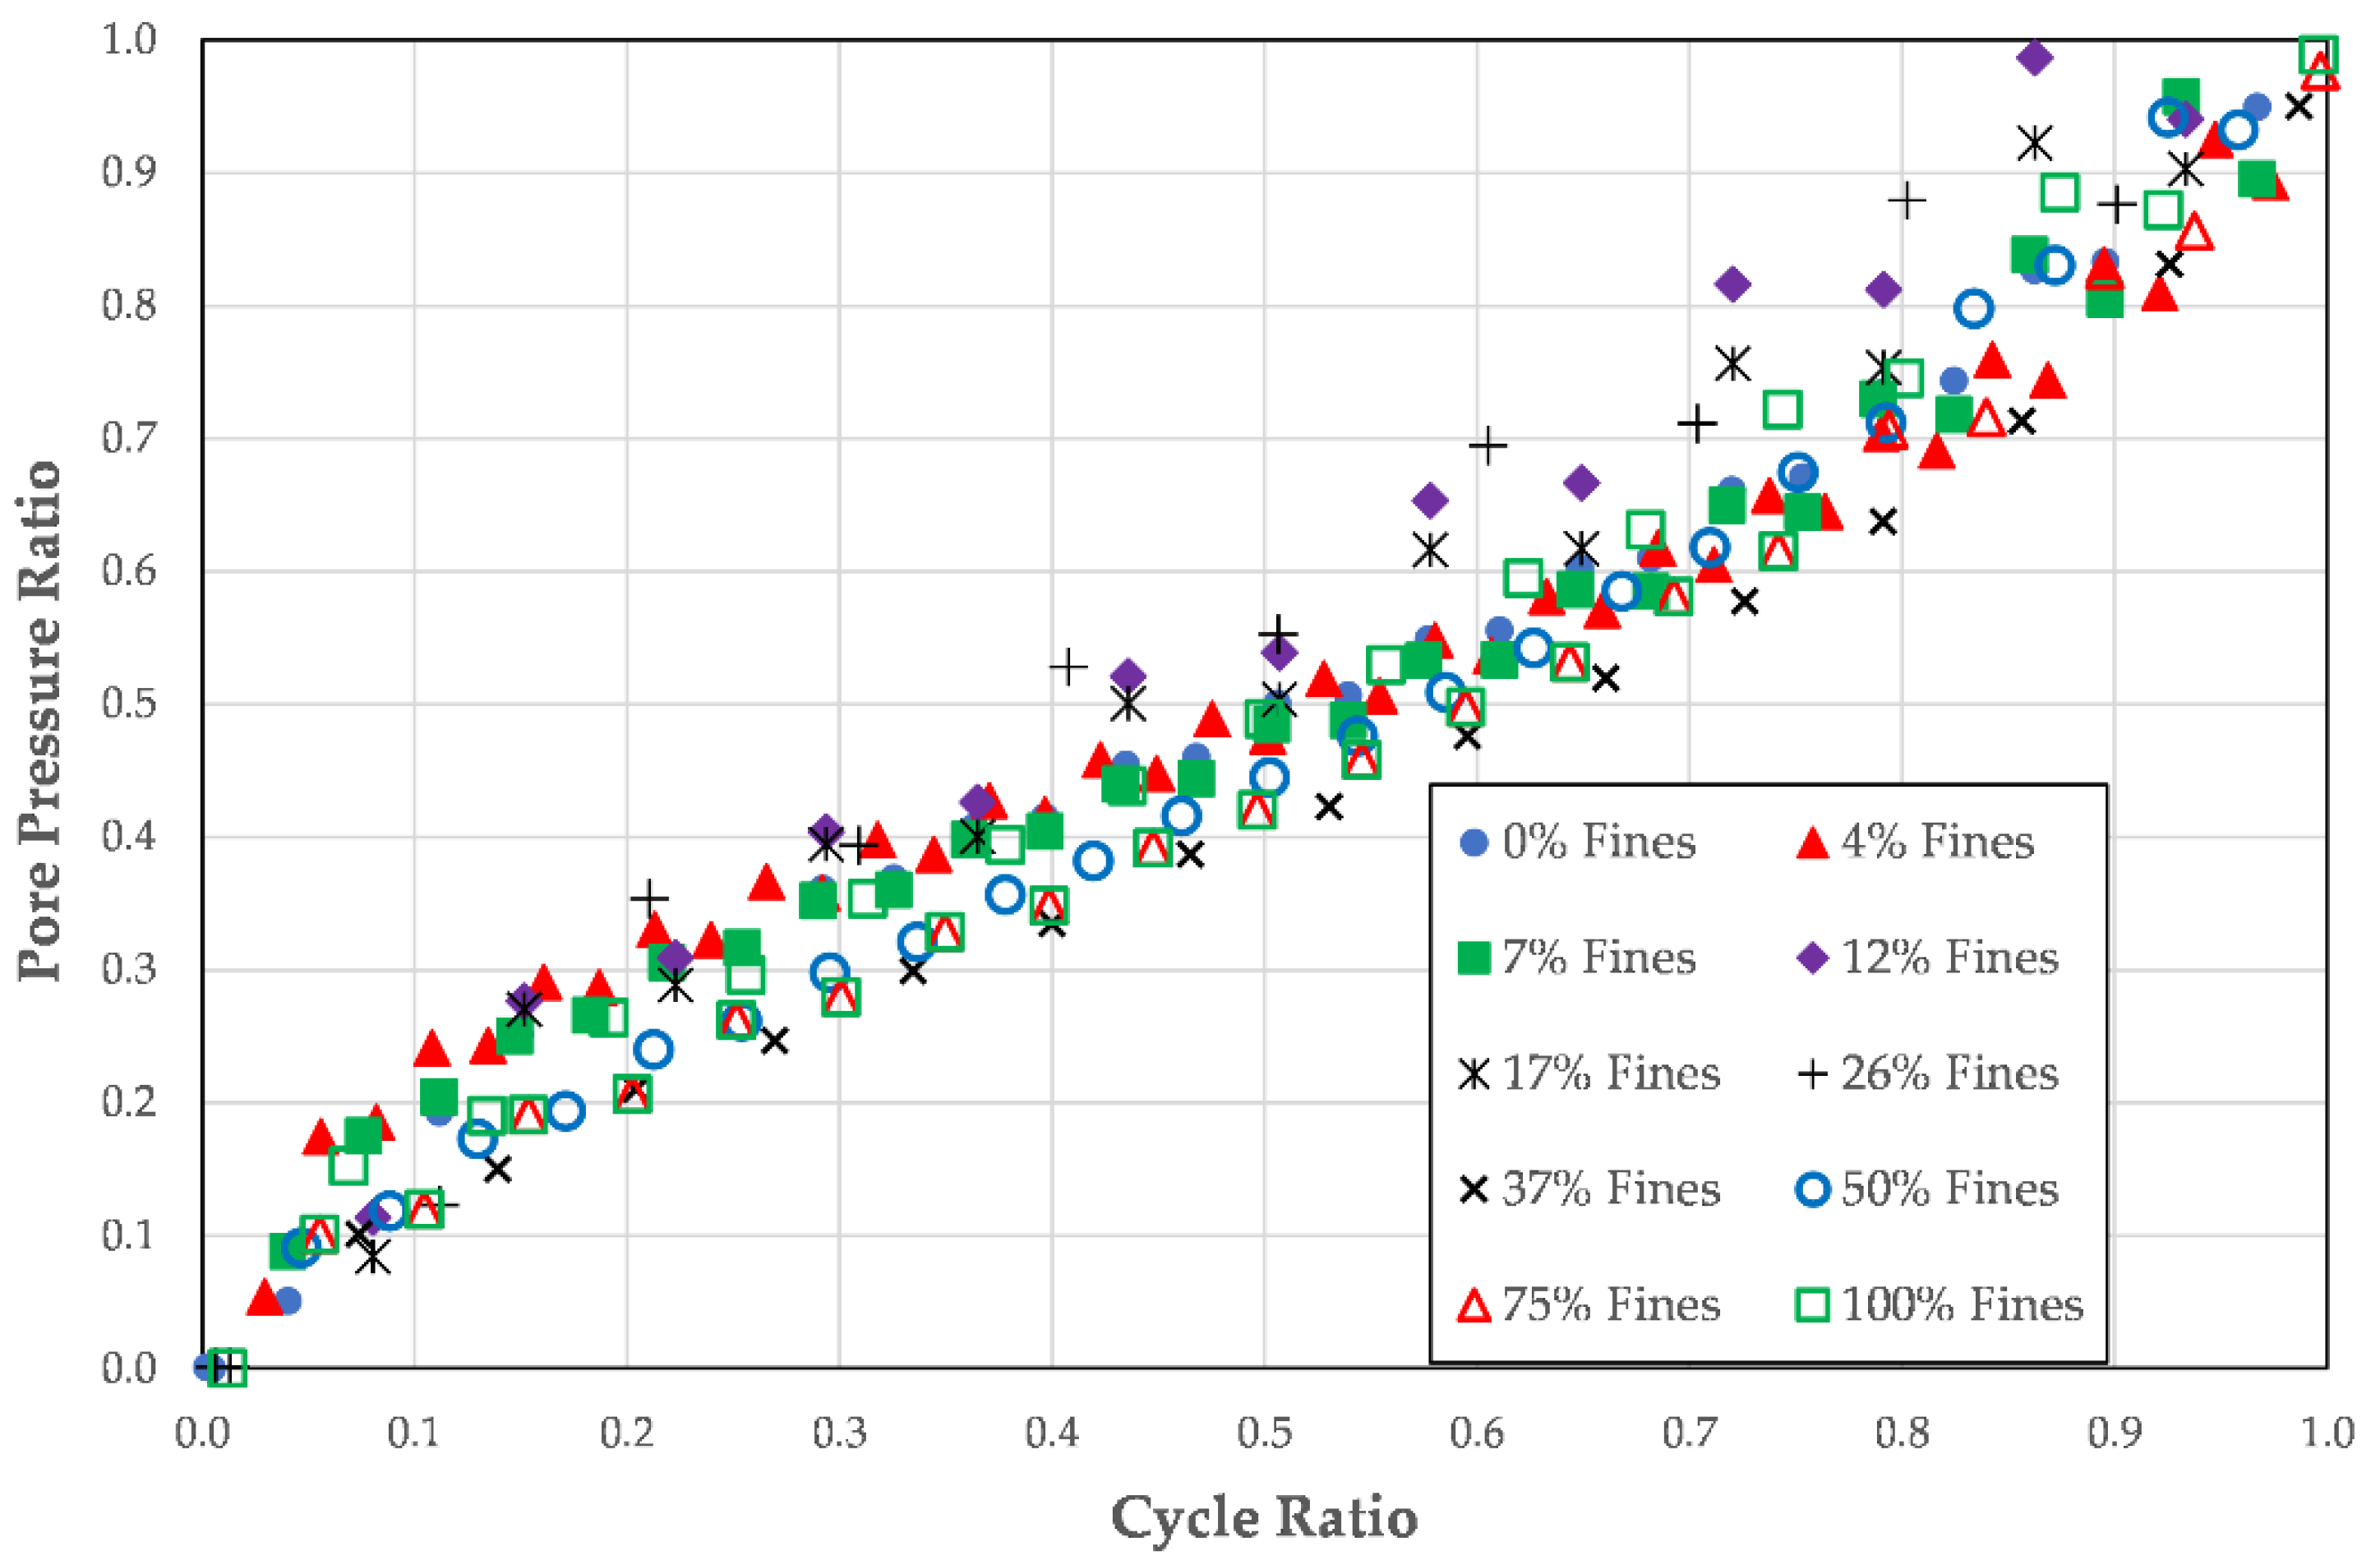
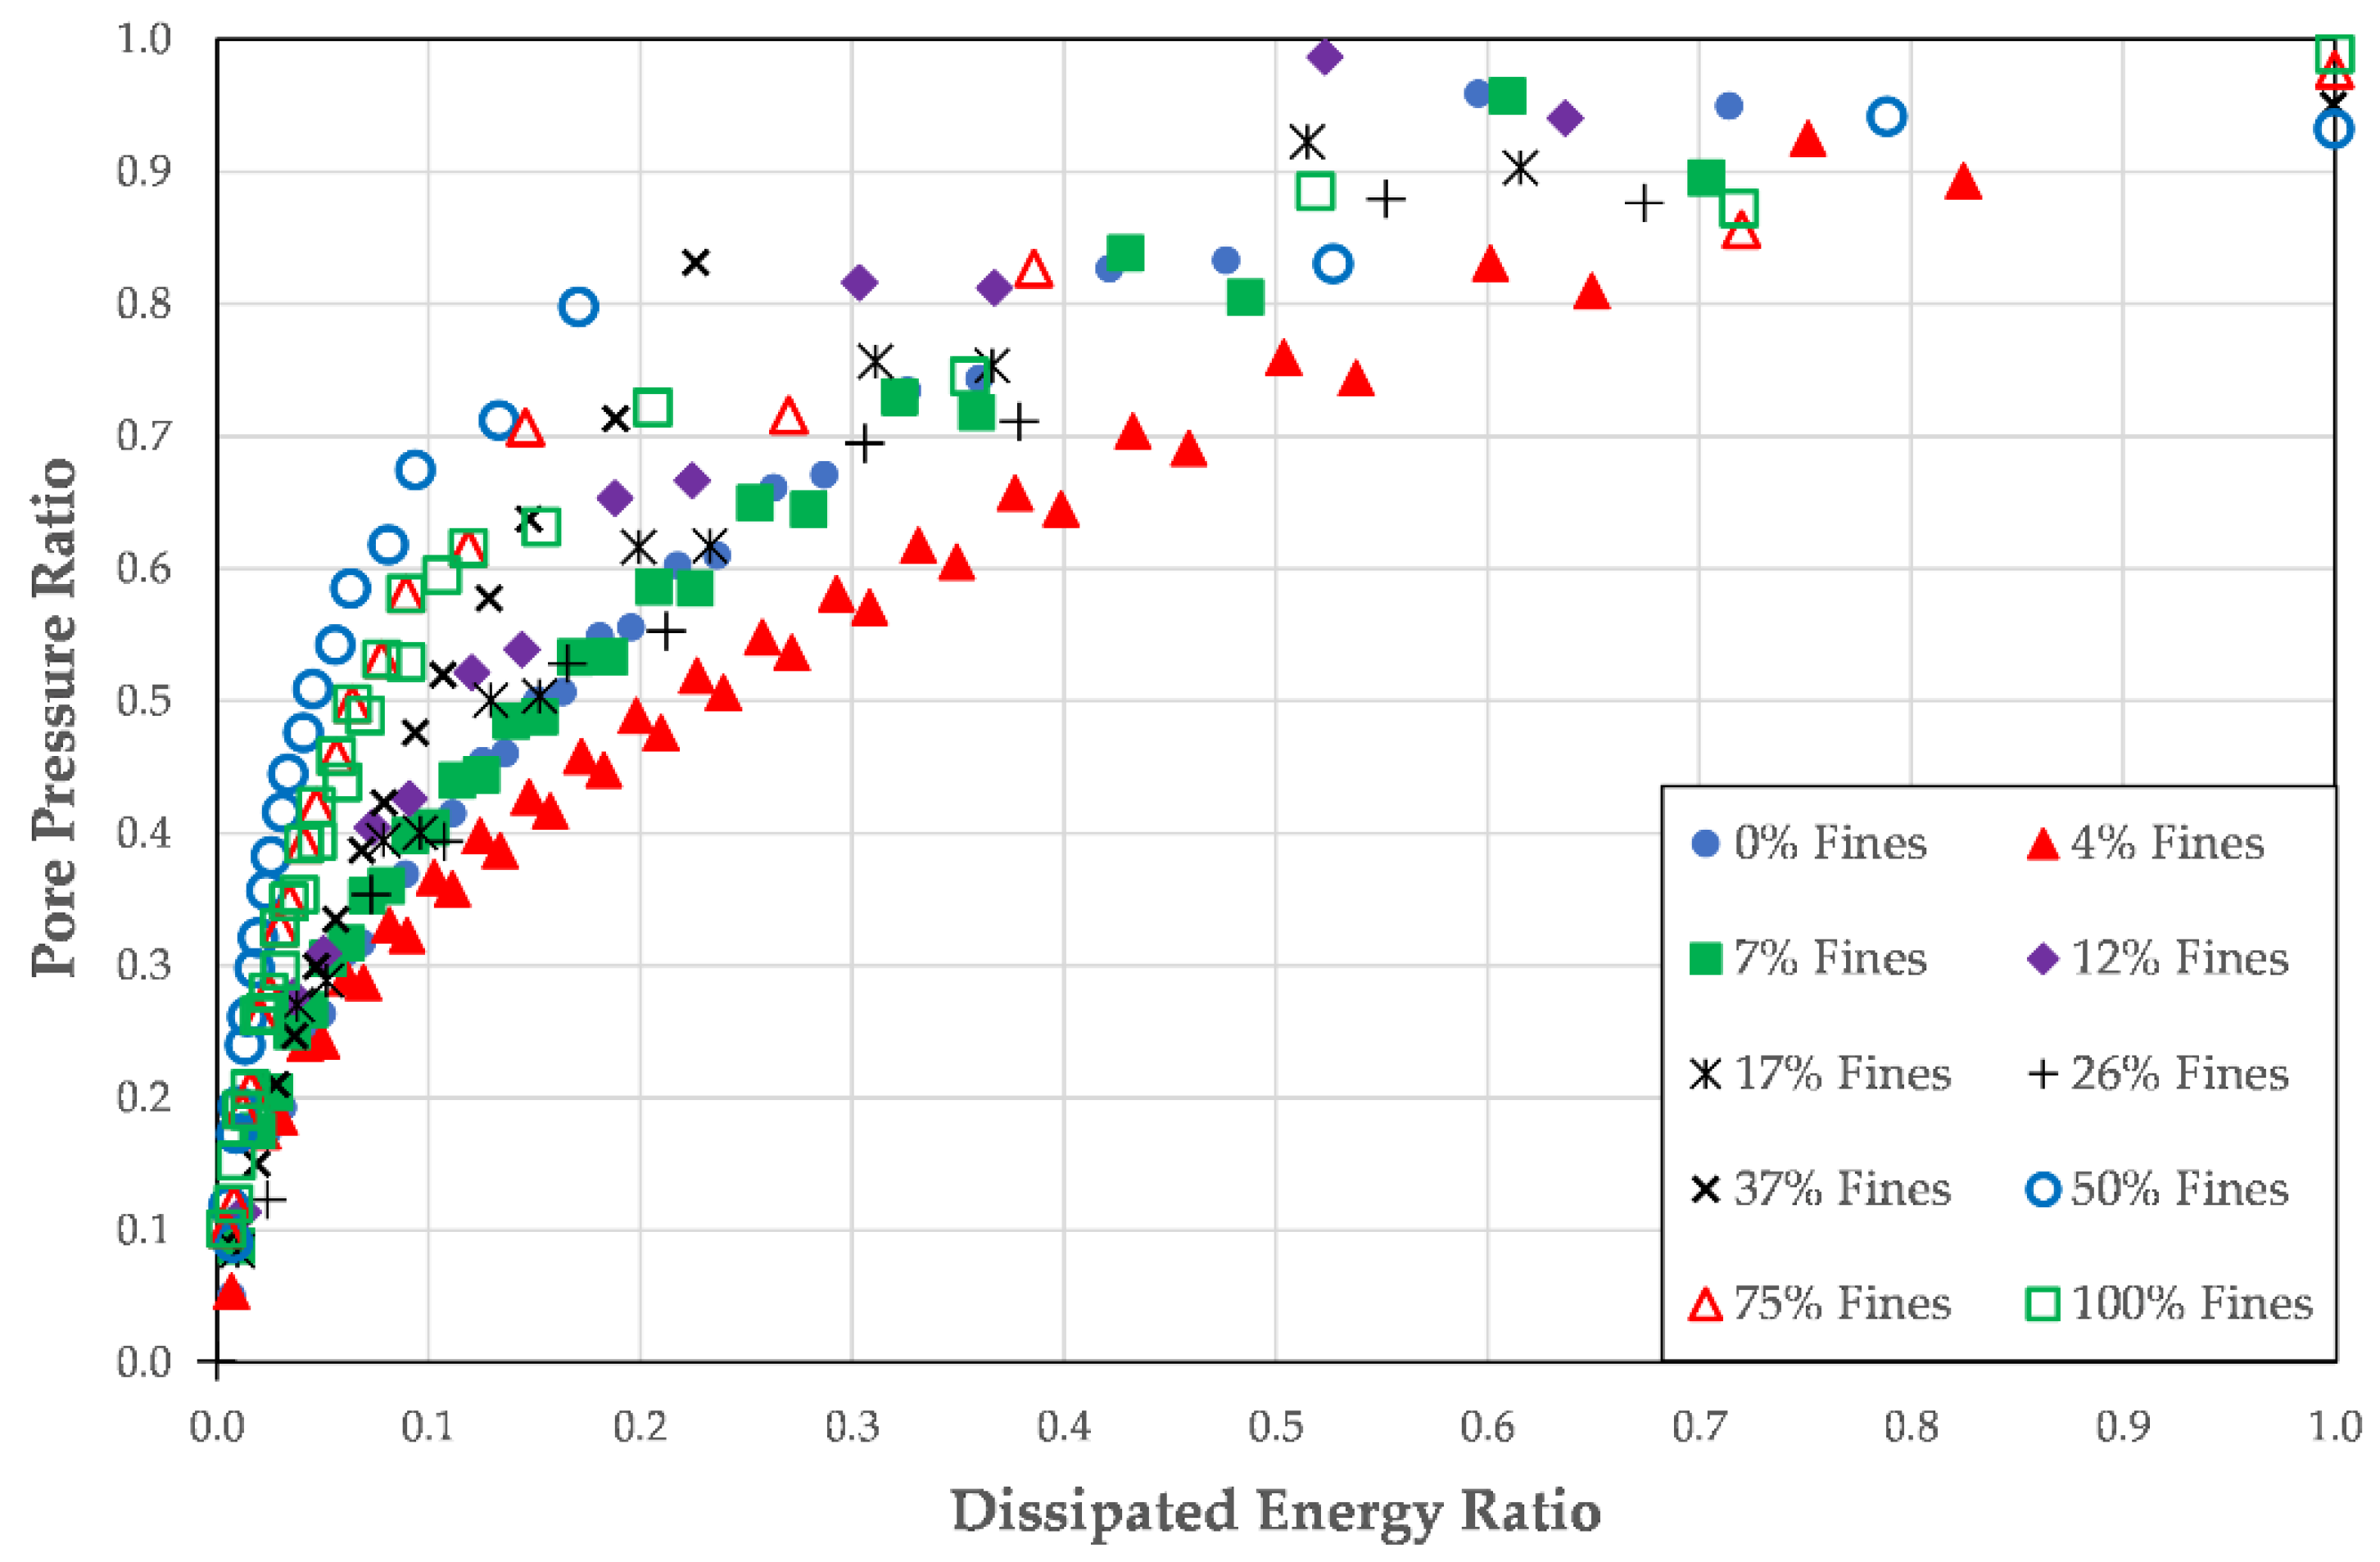
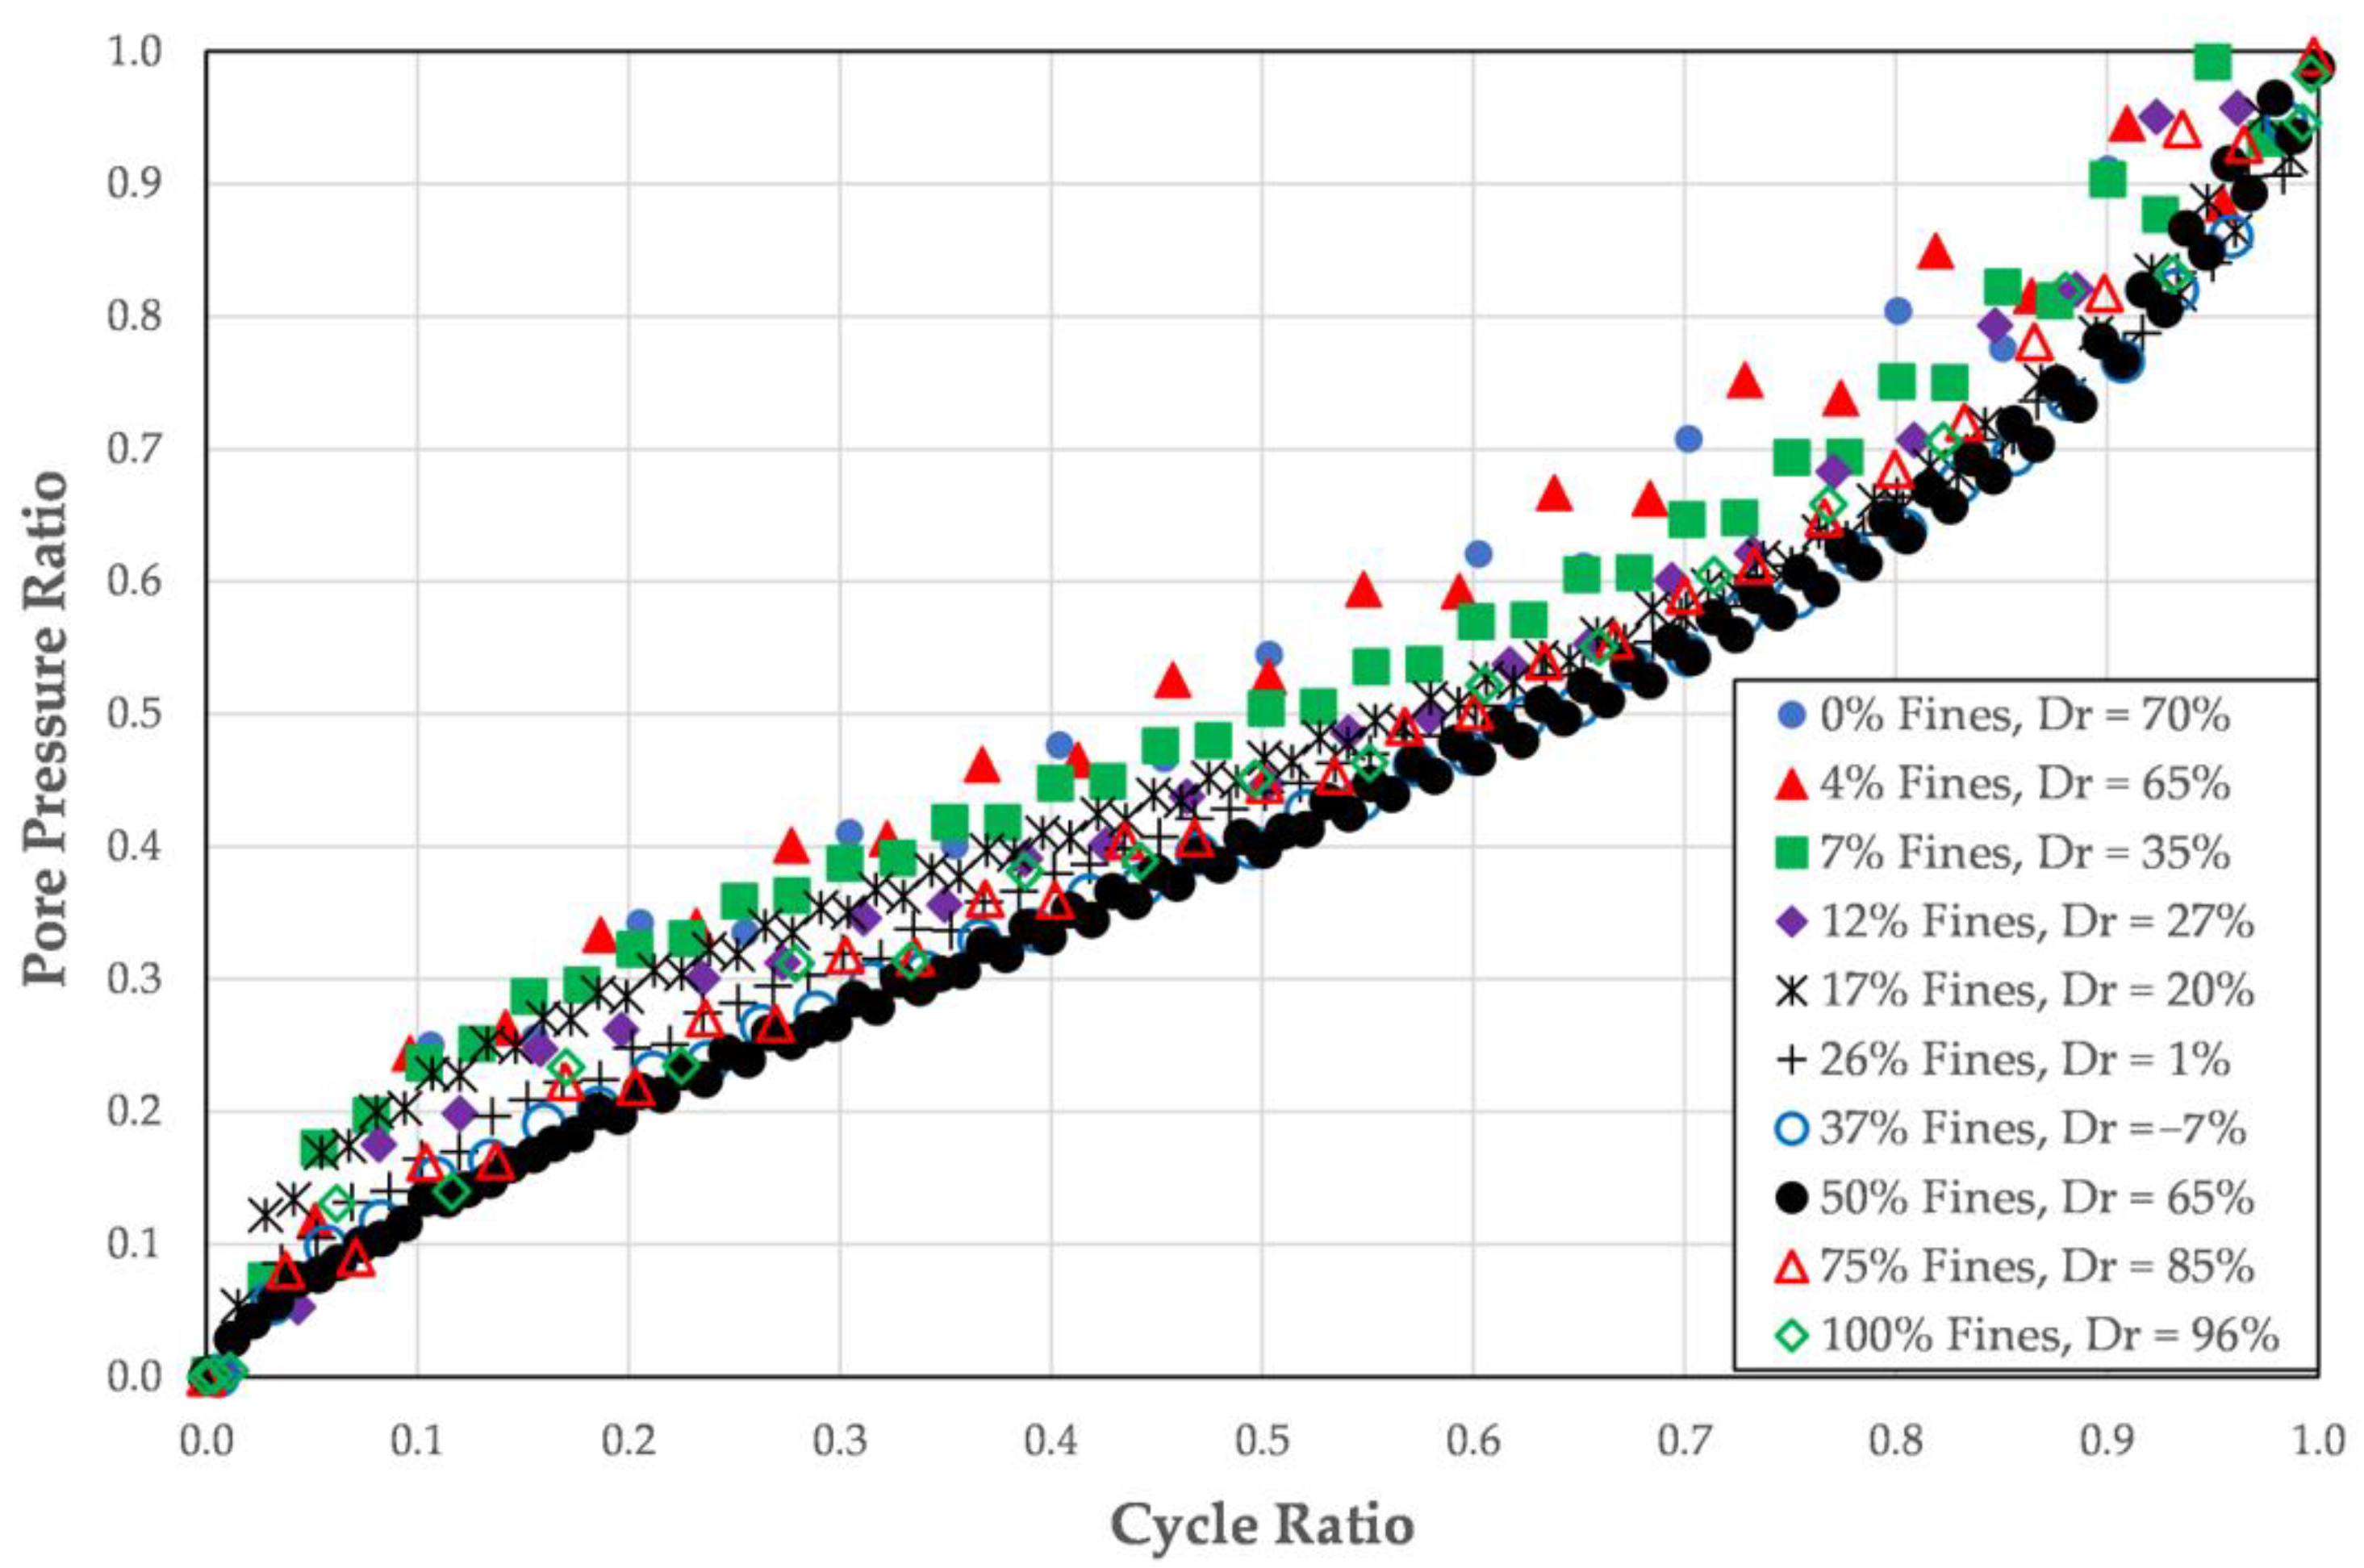
Figure 10 presents the pore pressure ratio plotted against the cycle ratio for the soils, while
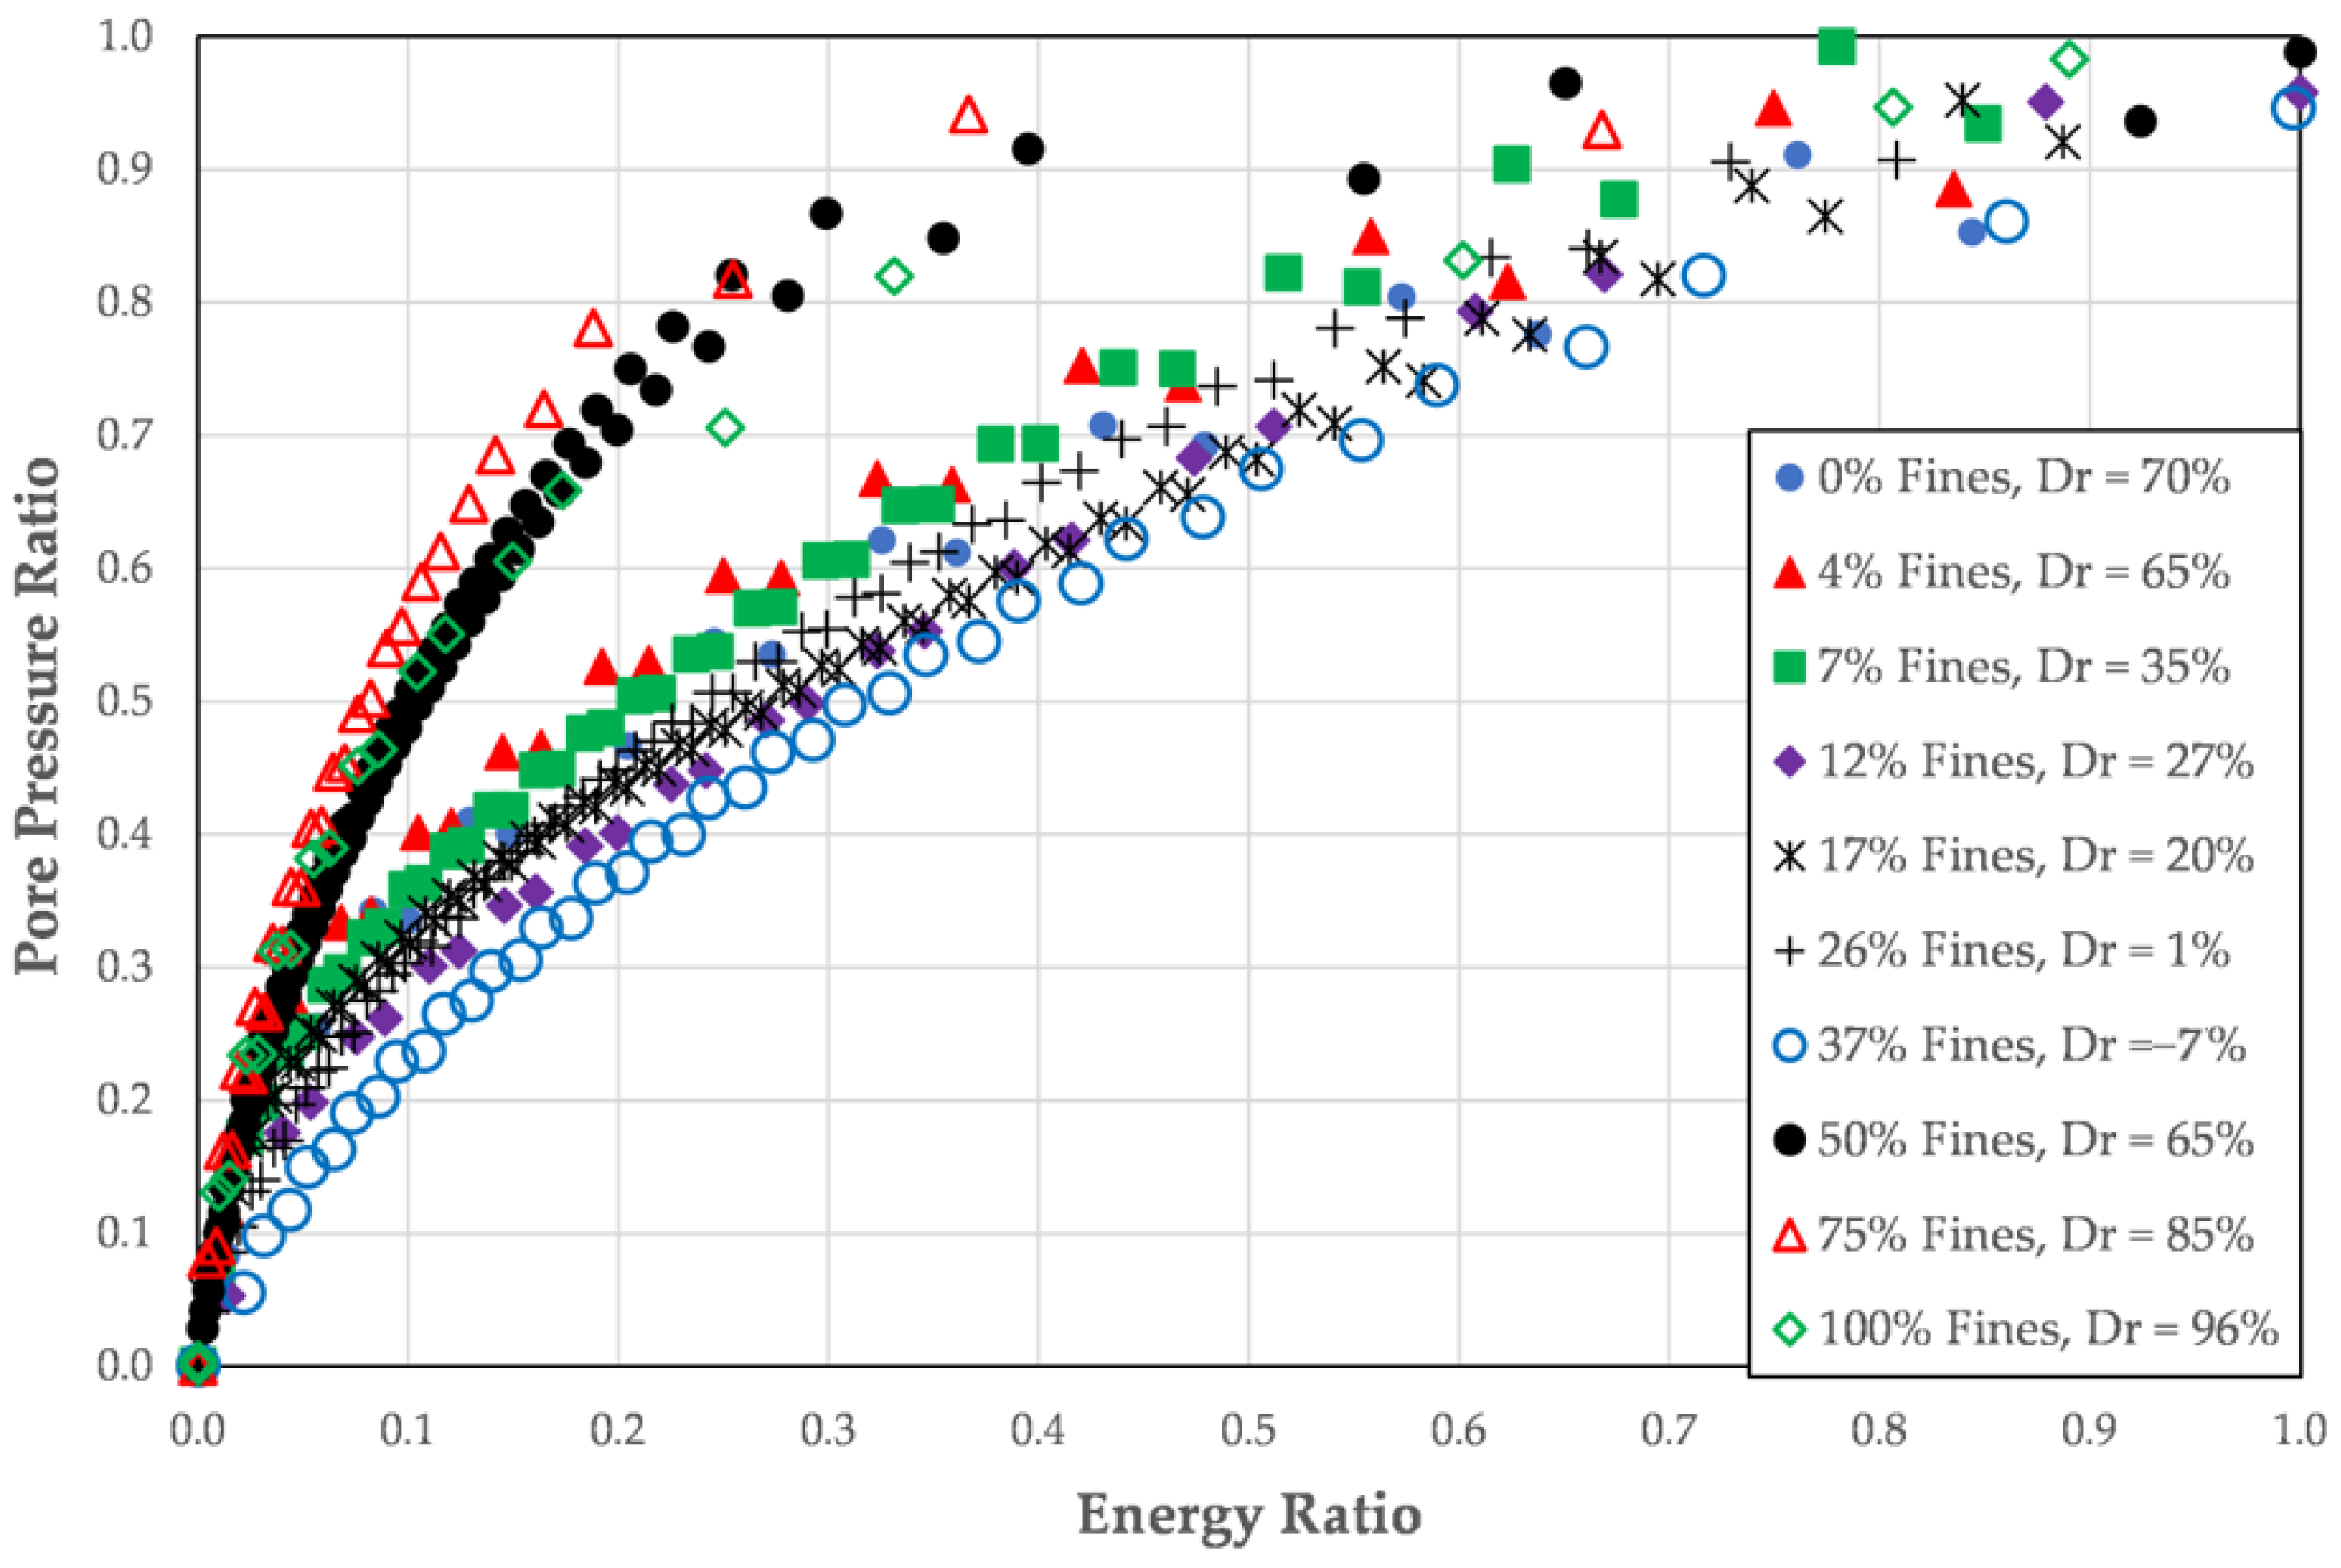
Figure 11 presents the pore pressure ratio plotted against the dissipated energy ratio for the same soils.
As may been seen in
Figure 10, the non-plastic silt content does not play a significant role in the pore pressure generation pattern of the soil if it is plotted against the cycle ratio.
As may been seen in
Figure 11, at a constant relative density, the non-plastic silt content affects the pore pressure generation pattern in the soil when it is plotted against the dissipated energy ratio. Soils with higher silt contents tend to generate more pore pressure earlier in the loading than soils with lower silt contents. This is likely due to the higher compressibility of the soils that have a predominately silt matrix as compared to the soils that have a predominately sand matrix.
4.5. Soil Density
The results of 10 stress-controlled cyclic tests performed on Yatesville sand with void ratios ranging from 0.76 to 1.20 (relative densities ranging from −45% to 70%) were examined to determine the effects of soil density on pore pressure generation and energy dissipation patterns [
17,
18]. This analysis was performed to remove any effects of silt content. The results of the analysis can be seen in
Figure 12 and
Figure 13.
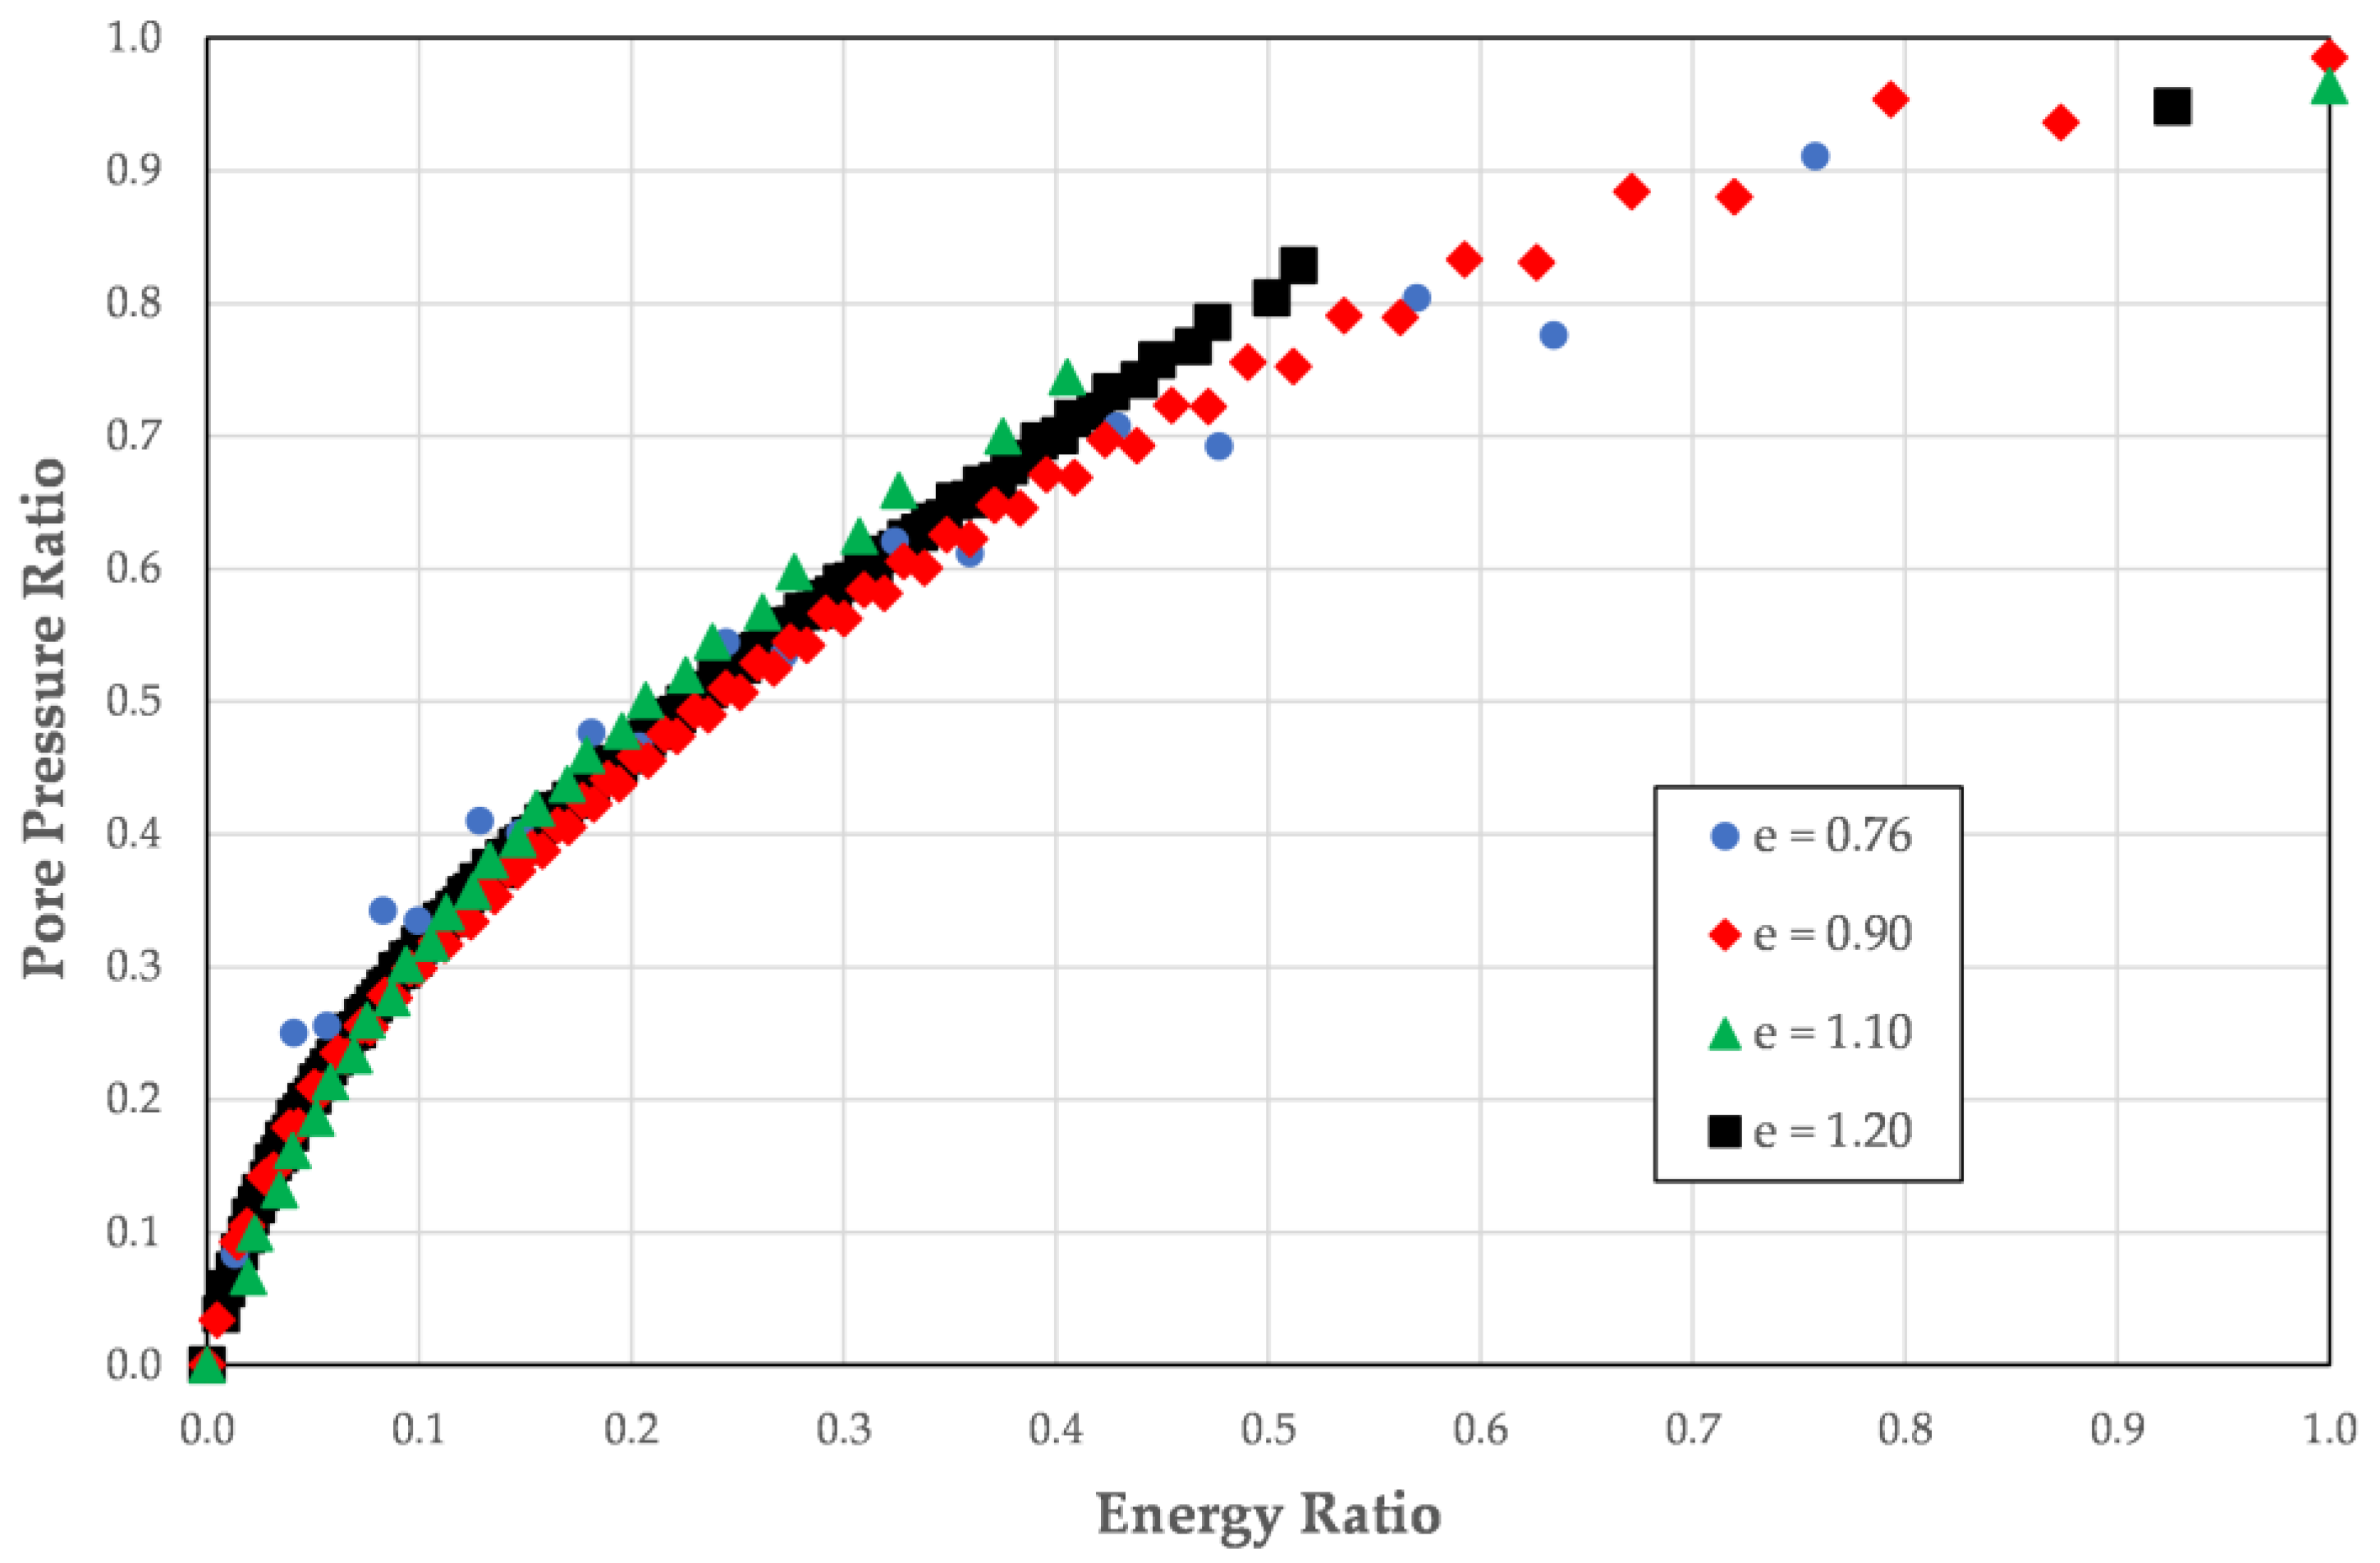
Figure 12 presents the pore pressure ratio plotted against the cycle ratio for the soils, while
Figure 13 presents the pore pressure ratio plotted against the dissipated energy ratio for the same soils.
As may been seen in
Figure 12 and
Figure 13, for clean sands, soil density does not play a significant role in either the energy dissipation or the pore pressure generation patterns for the soil. This holds true whether the pore pressure ratio is plotted against the cycle ratio or the dissipated energy ratio.
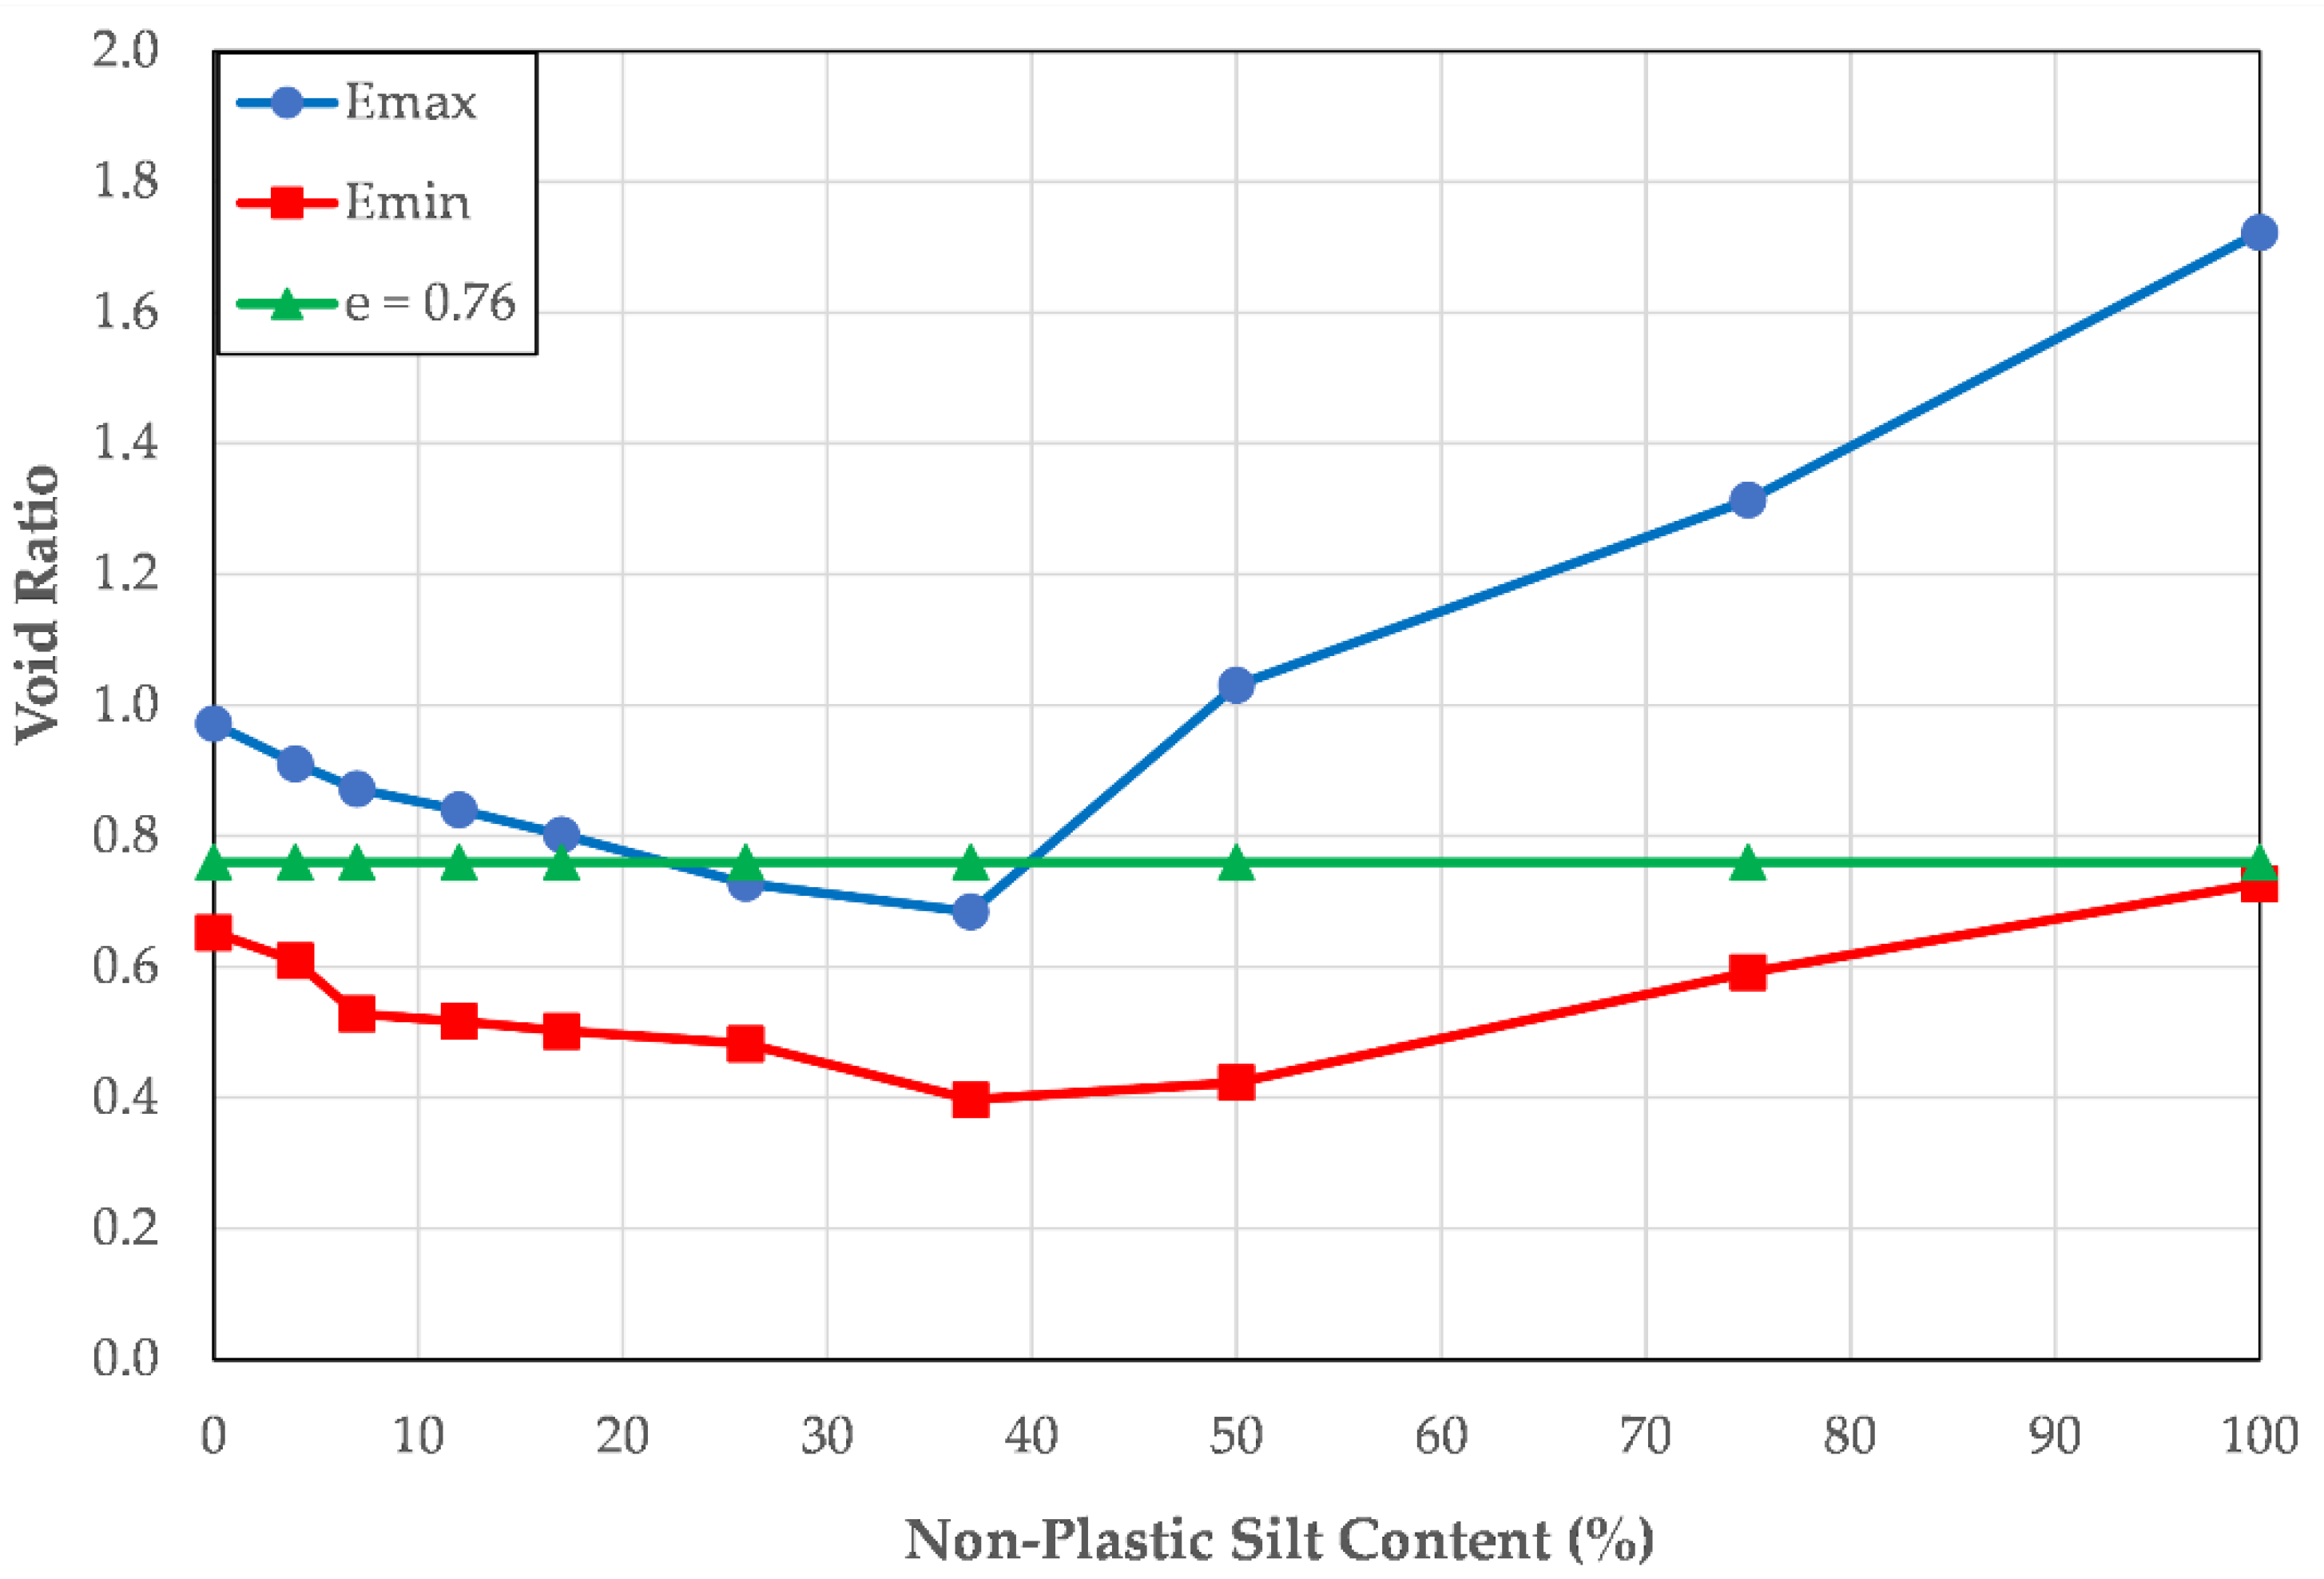
Similarly, the results of 10 stress-controlled cyclic tests performed on mixtures of Yatesville sand and Yatesville silt with non-plastic silt contents ranging from 0 to 100% were examined to determine the effects of soil density on pore pressure generation and energy dissipation patterns in soils with non-plastic fines [
17,
18]. All specimens were prepared to a void ratio of 0.76. Because the void ratio was held constant as the maximum and minimum index void ratios varied with silt content, as can be seen in
Figure 14, the relative densities of the specimens ranged from approximately −7% to 96%. The test results were examined to gain insight into the effects of relative density on pore pressure generation and energy dissipation patterns.
Figure 15 presents the pore pressure ratio plotted against the cycle ratio for the soils, while
Figure 16 presents the pore pressure ratio plotted against the dissipated energy ratio for the same soils.
As may been seen in
Figure 15 for sands and non-plastic silts, soil density does not play a significant role in either the energy dissipation or the pore pressure generation patterns of the soil when the pore pressure ratio is plotted against the cycle ratio.
As may been seen in
Figure 16, for sands and non-plastic silts, soil density does not play a significant role in the energy dissipation and the pore pressure generation patterns of the soil when the pore pressure ratio is plotted against the energy ratio.
4.6. Uniformity of Loading
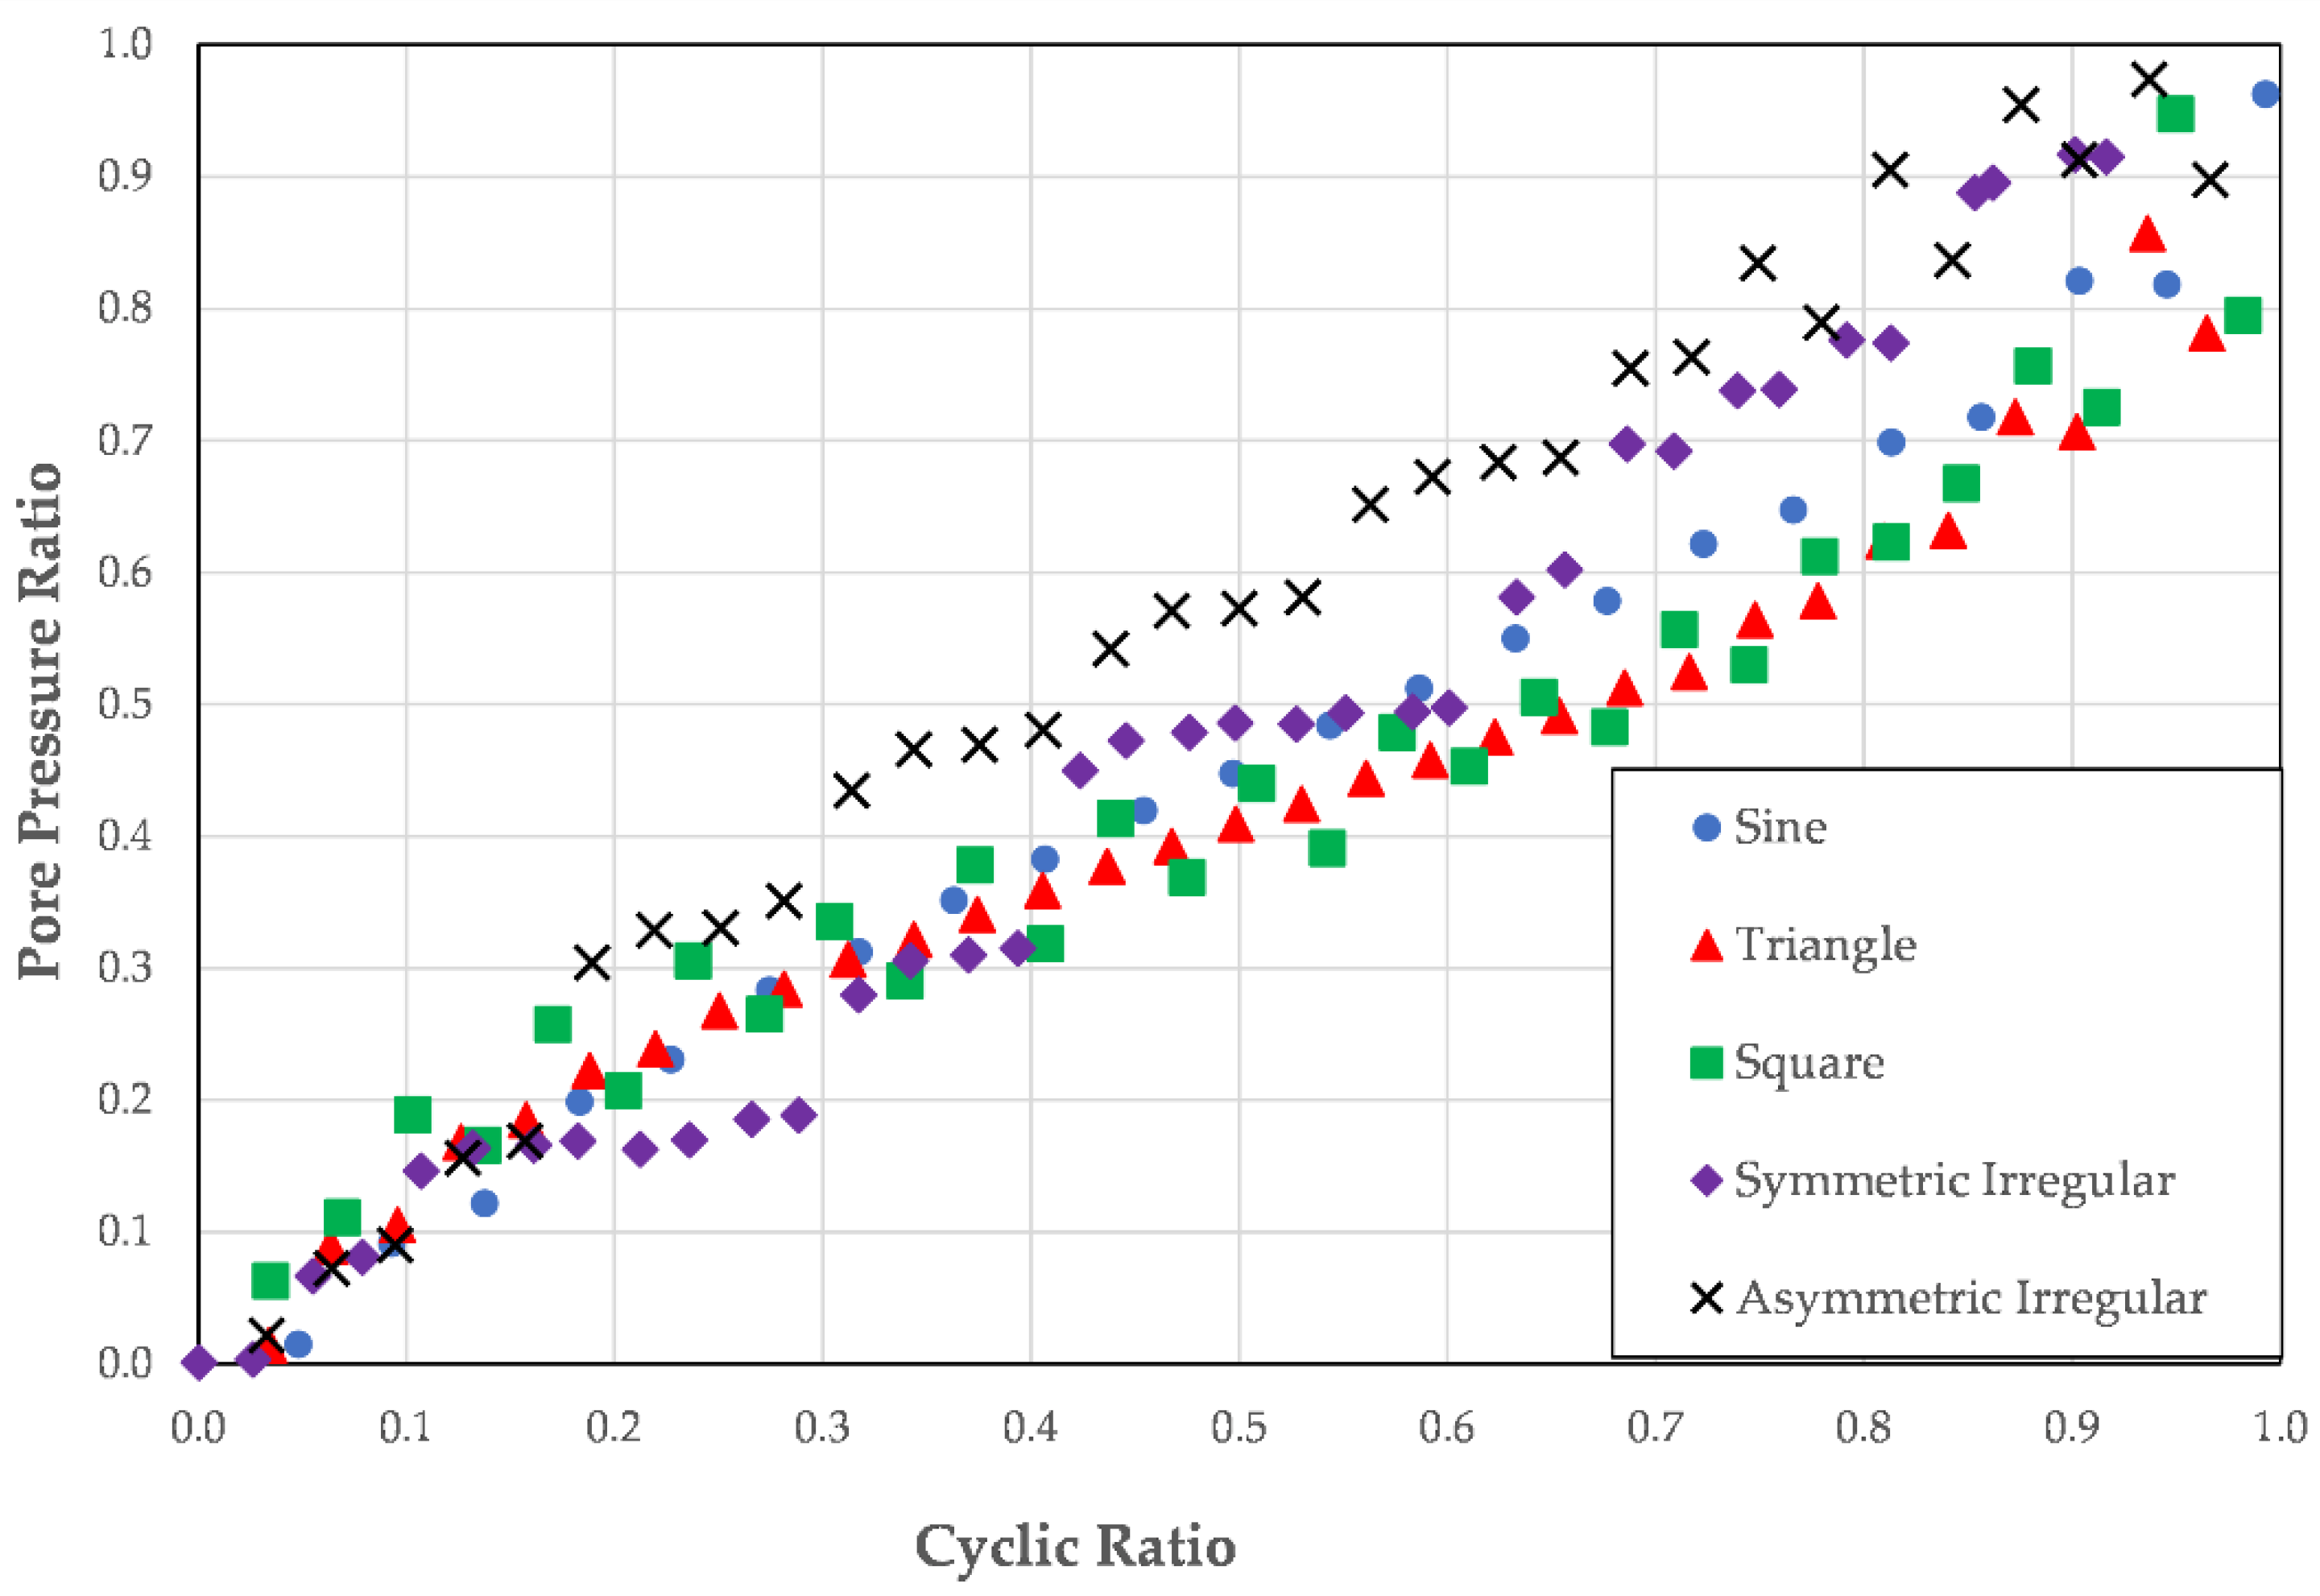
Twenty specimens of Ottawa 20–30 sand prepared to relative densities of approximately 22% were tested in stress-controlled cyclic triaxial tests [
19]. The specimens were subjected to various load shapes: four specimens were subjected to sinusoidally varying deviator stresses, four specimens were subjected to triangular deviator stresses, four specimens were subjected to square deviator stresses, four specimens were subjected to symmetrical, irregular deviator stresses and four specimens were subjected to asymmetrical irregular deviator stresses. Illustrations of each of the load shapes are provided by Polito et al. [
19].
Rather than having constant peak stresses like the sinusoidal, triangular and square loadings, the irregular loads featured maximum peak deviator stresses that varied in amplitude with either each cycle or each half cycle. For the symmetric irregular loads, the absolute value of the peak deviator stress was the same for both the tension and the compression halves of the load cycle. For the asymmetric irregular loads, the absolute value of the peak deviator stress was different for the tension and the compression halves of the load cycle.
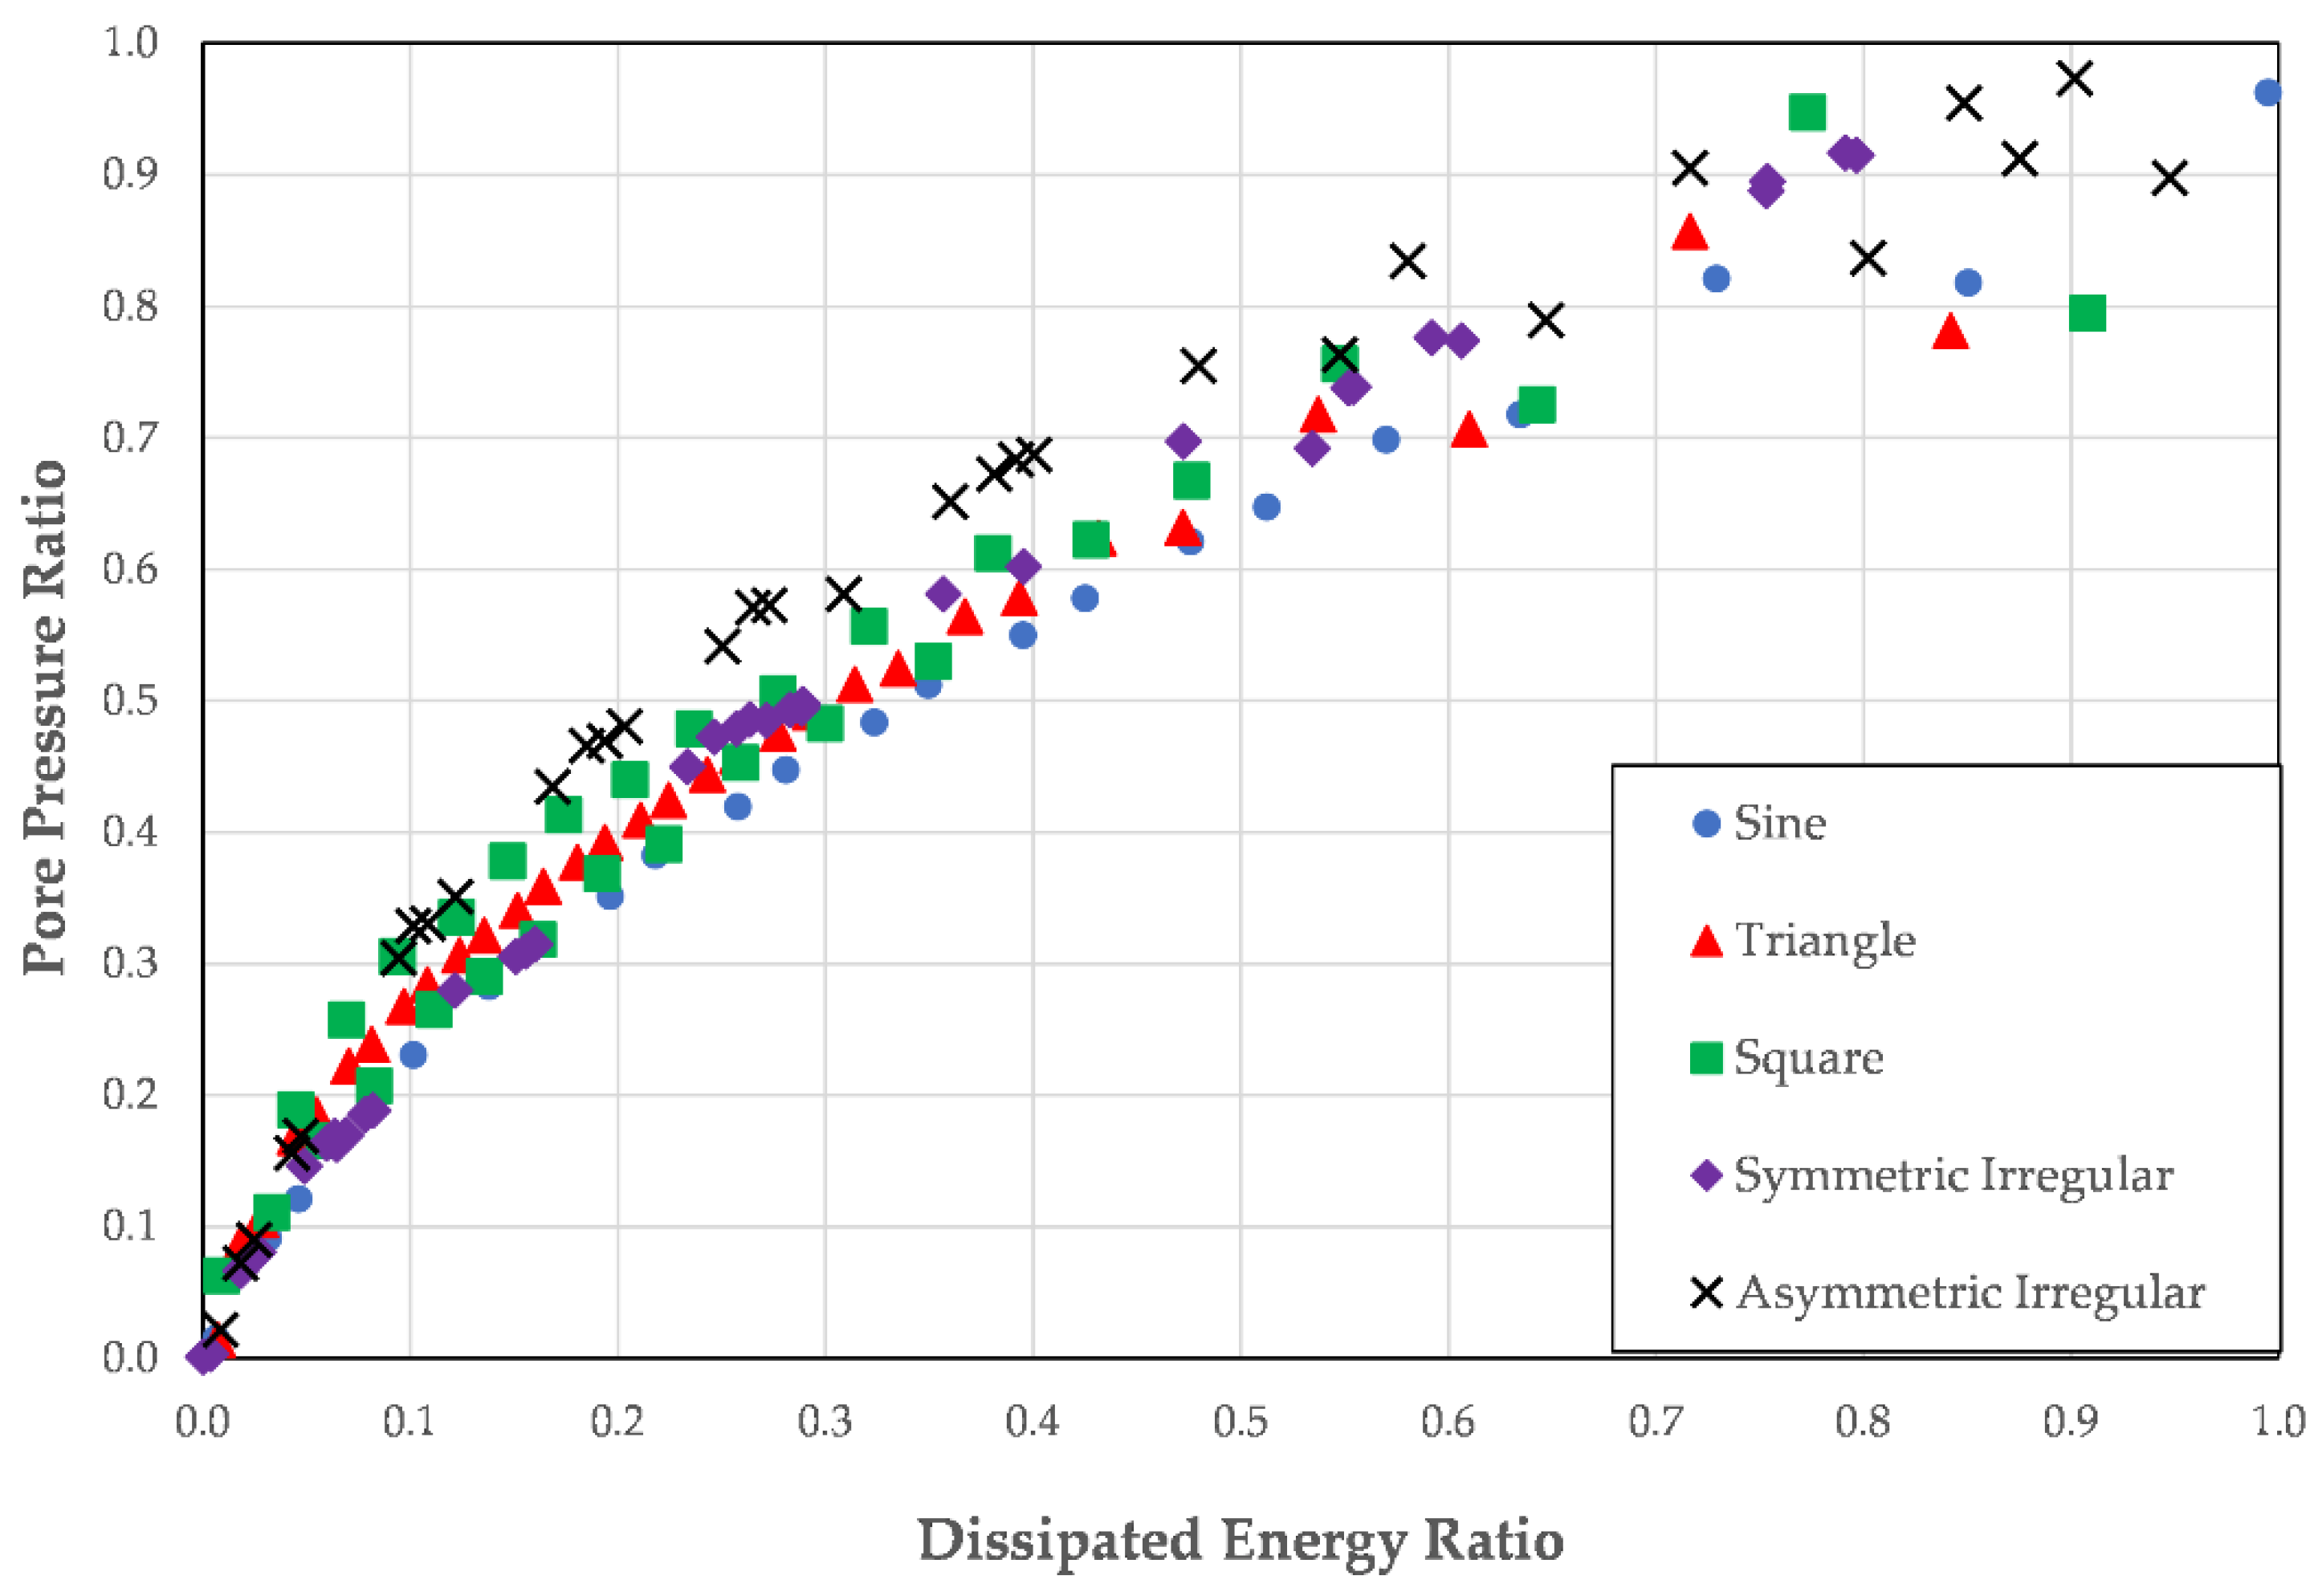
Figure 17 presents the pore pressure ratio plotted against the cycle ratio for one test for each of the load types, while
Figure 18 presents the pore pressure ratio plotted against the dissipated energy ratio for the same tests.
From
Figure 17, it appears that, when viewed in terms of cycle ratio, the irregular loadings may produce different patterns of pore pressure development than those tests with more symmetric loading patterns. Conversely, when the pore pressure ratio is plotted against the dissipated energy ratio, there is no difference between the pore pressures produced by the different loadings.
This difference in pore pressure generation is analogous to the effects seen for the stress-controlled and the strain-controlled tests. Because irregular loading can apply larger loads anywhere within the test, the cycle ratio does not capture their true behavior. The dissipated energy ratio, because it is based on how much energy is being dissipated and not on when in the loading the energy is dissipated, produces a more consistent pattern between the various load shapes, as may be seen in
Figure 18.
4.7. Flow Liquefaction Failures versus Cyclic Mobility Failures
When a soil liquefies, it undergoes one of two general behaviors. If the soil has a low relative density, it is typically contractive in nature. When it liquefies, it undergoes flow liquefaction, which is marked by large strains [
27,
28,
29]. If the soil has a high relative density, it is typically dilative in nature and when it liquefies, it undergoes cyclic mobility, which is marked by limited strains [
27,
28,
29].
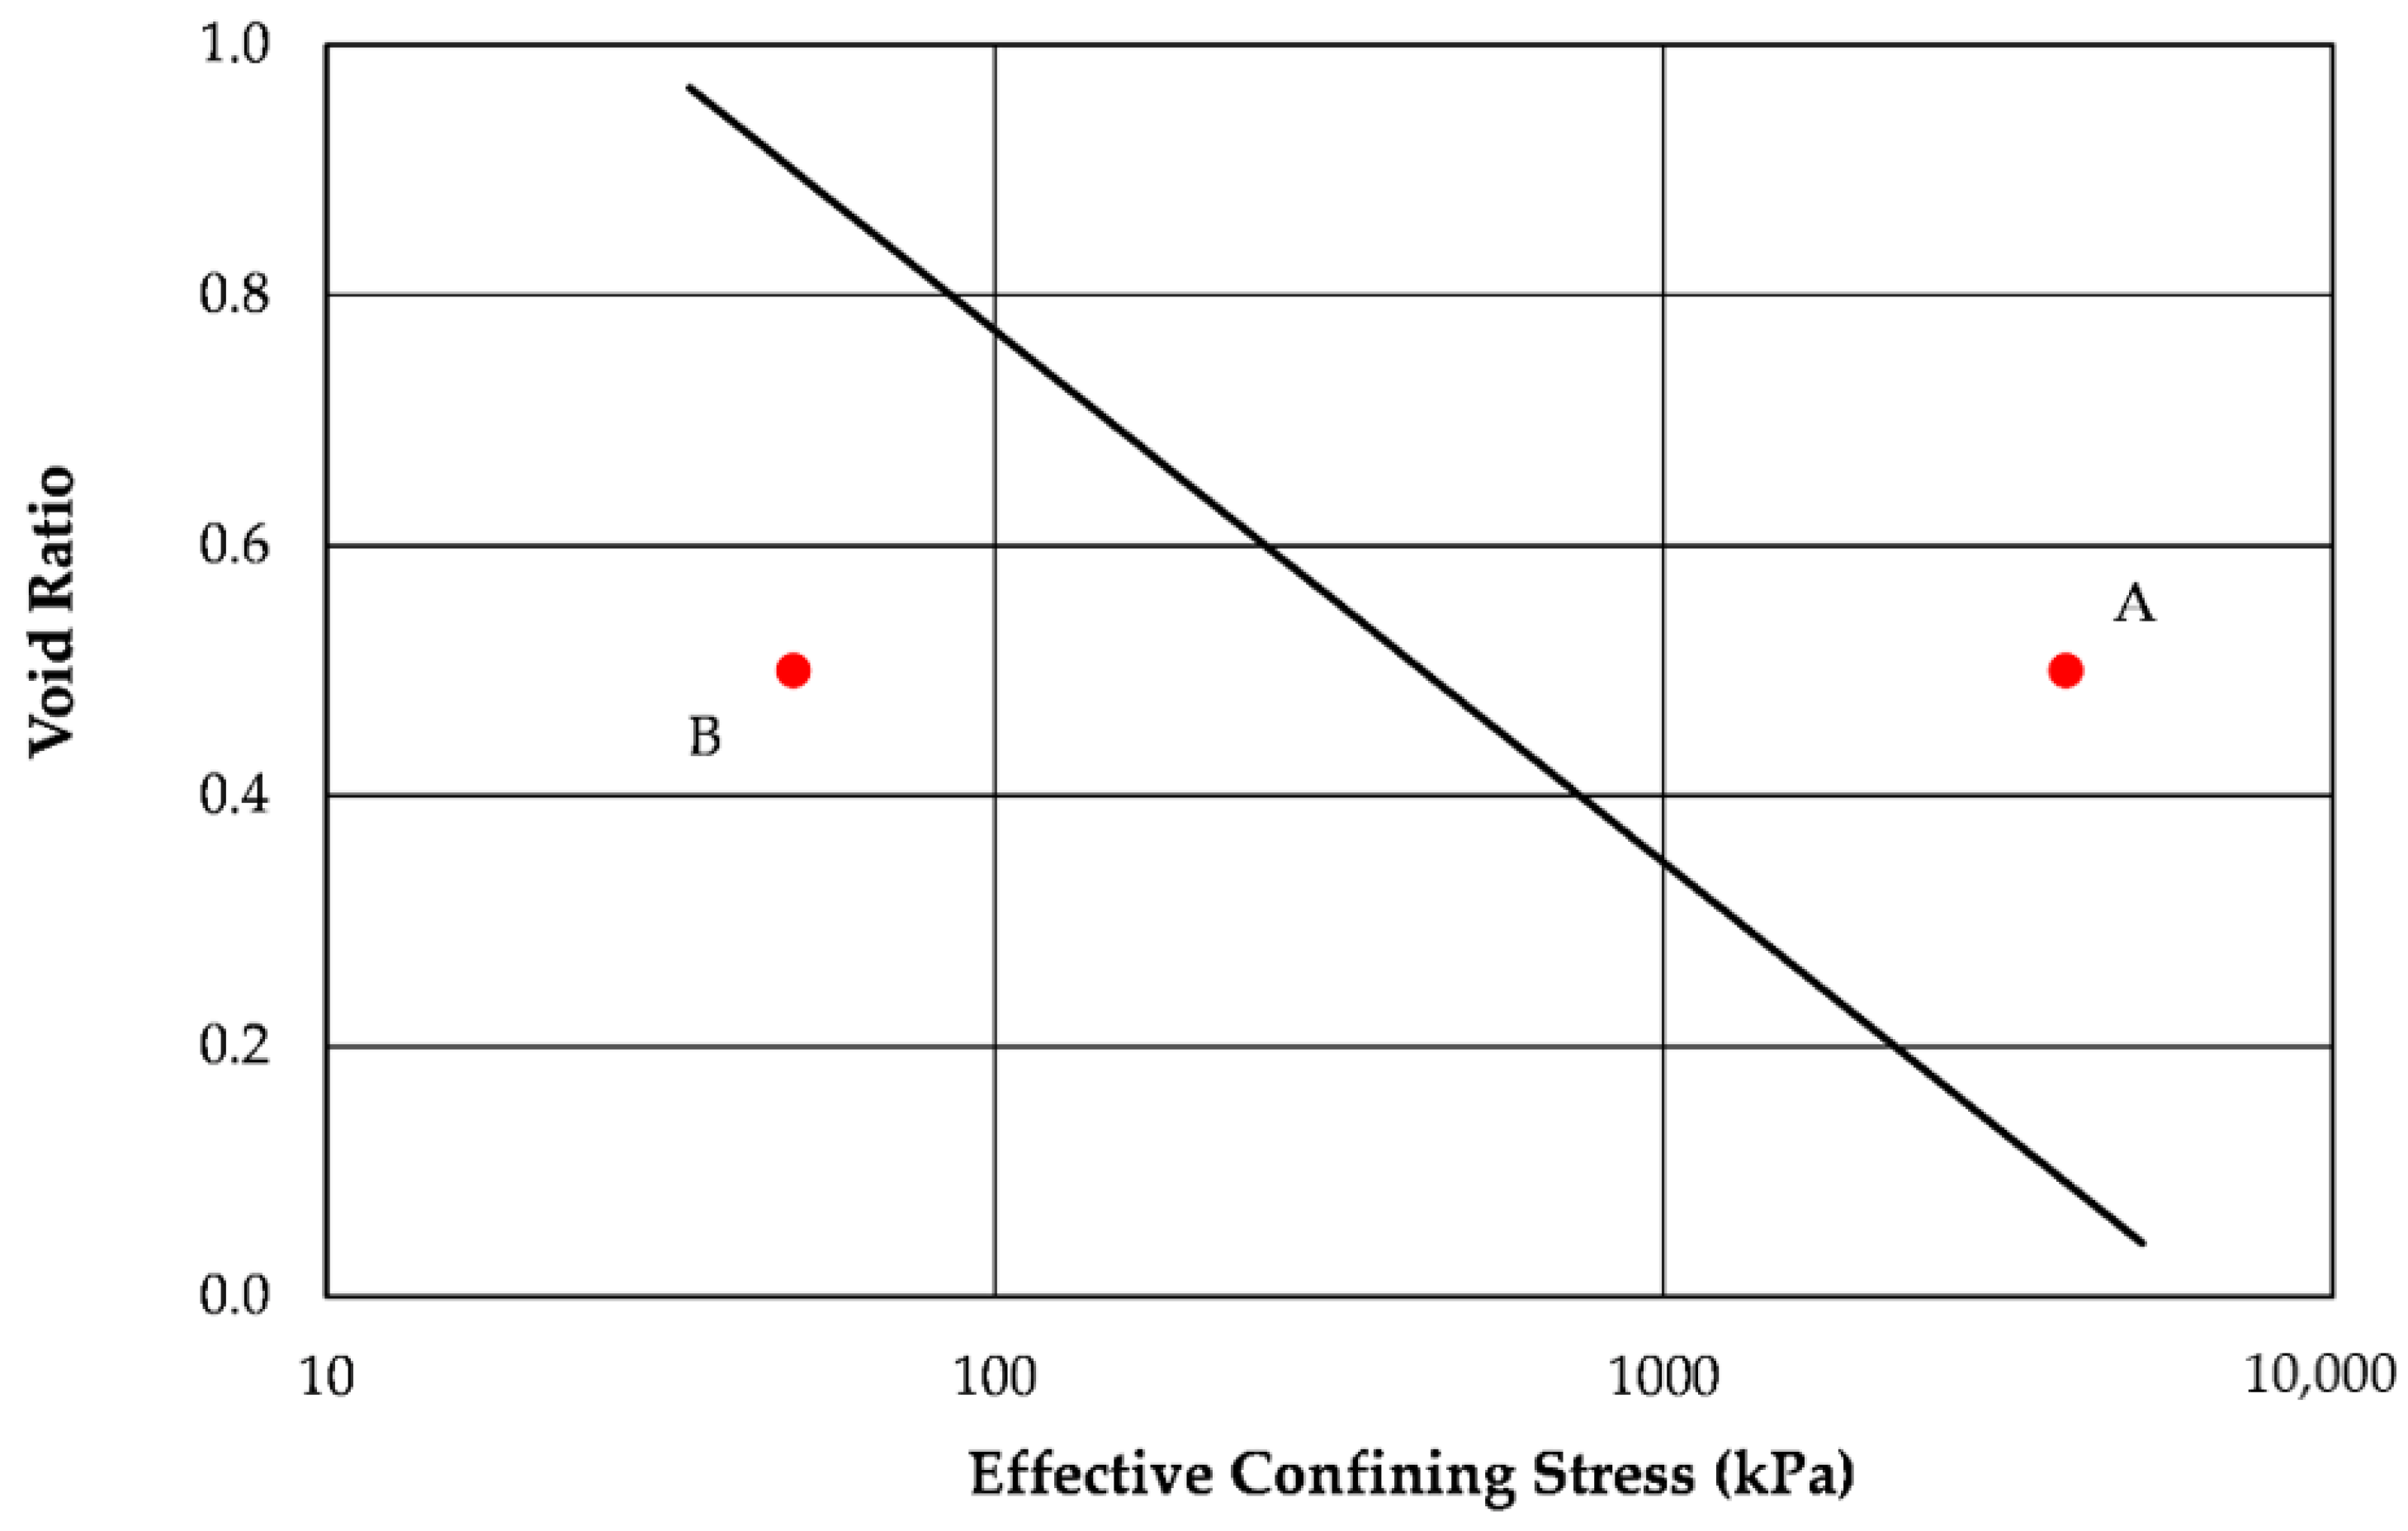
The potential for a flow liquefaction failure exists in a soil deposit when the in situ void ratio is larger than the critical void ratio that corresponds to the effective confining stress acting on the soil [
30,
31,
32]. Point A in
Figure 19 represents such a condition. Because it is loose of critical, when sheared undrained, the soil will attempt to contract; however, because drainage is not allowed, it will develop positive pore pressures that reduce the effective stress in and the strength of the specimen. The decreased strength leads to increased straining during subsequent load applications, which leads to increased pore pressures. These increased pore pressures result in lower strengths. This results in a self-perpetuating strength loss that will continue to move the specimen to the left on the diagram (i.e., the effective stress decreases at a constant void ratio) until it reaches the steady-state line and a steady-state condition is achieved. Very large strains or displacements typically accompany flow liquefaction.
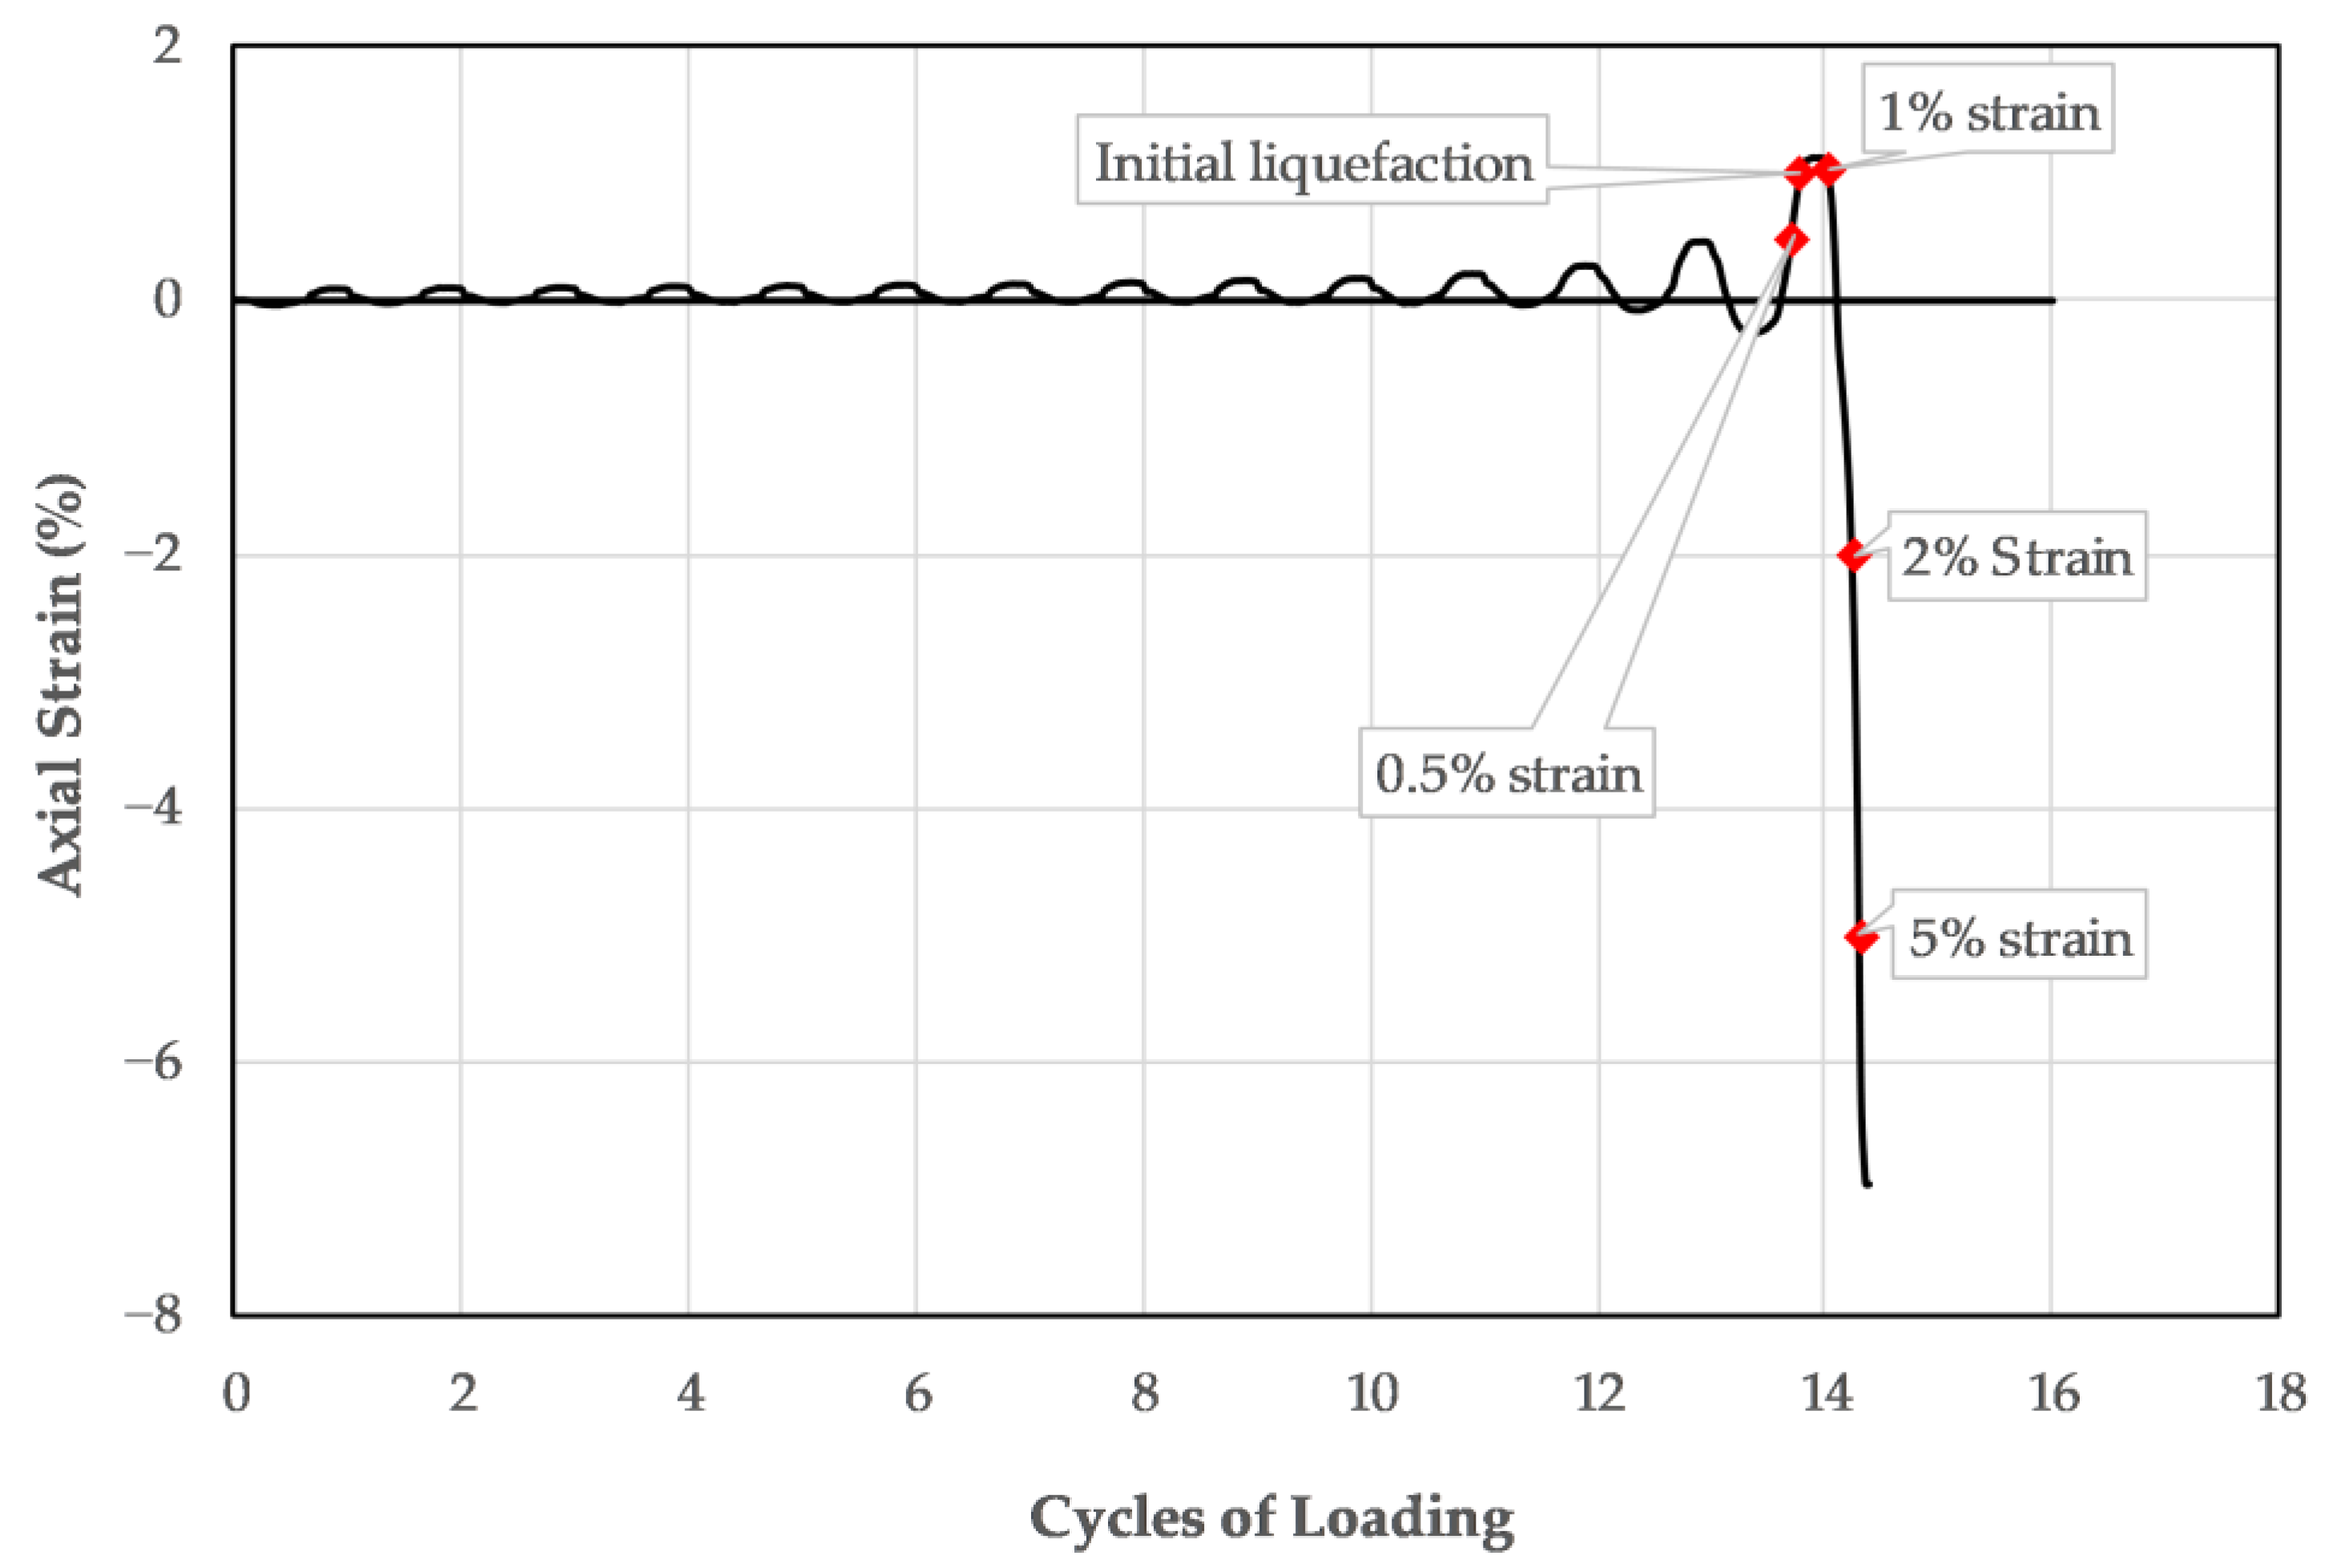
A strain versus cycles of loading curve from a stress-controlled cyclic triaxial test performed on a specimen exhibiting flow liquefaction is presented in
Figure 20. In the figure, the points where initial liquefaction and various single-amplitude strains occurred during the test are marked. During loading, its behavior is characterized by the very small strains up until just before the onset of initial liquefaction, when sudden, intense strain occurs. In a cyclic triaxial test, the magnitude of the strain achieved is limited by the mechanisms of the test, not by the behavior of the soil. If allowed, it may continue to deform until the driving shear stress reaches the same value as the residual shear strength.
The potential for a cyclic mobility failure exists in a soil deposit when the in situ void ratio is smaller than the critical void ratio that corresponds to the effective confining stress acting on the soil [
30,
31,
32]. Point B in
Figure 19 represents such a condition. When sheared undrained, the soil will initially attempt to compress, thus developing an increase in pore pressures that move it to the left in
Figure 19, away from the steady-state line. This change in pore pressure reduces the effective stress on the soil. As the soil continues to strain, it attempts to dilate, the pore pressures decrease, the effective stress increases, and the strength of the soil increases, thereby limiting further straining in the soil. This dilative behavior and the resulting strength gain prevent large displacements from occurring even if it reaches the steady-state line.
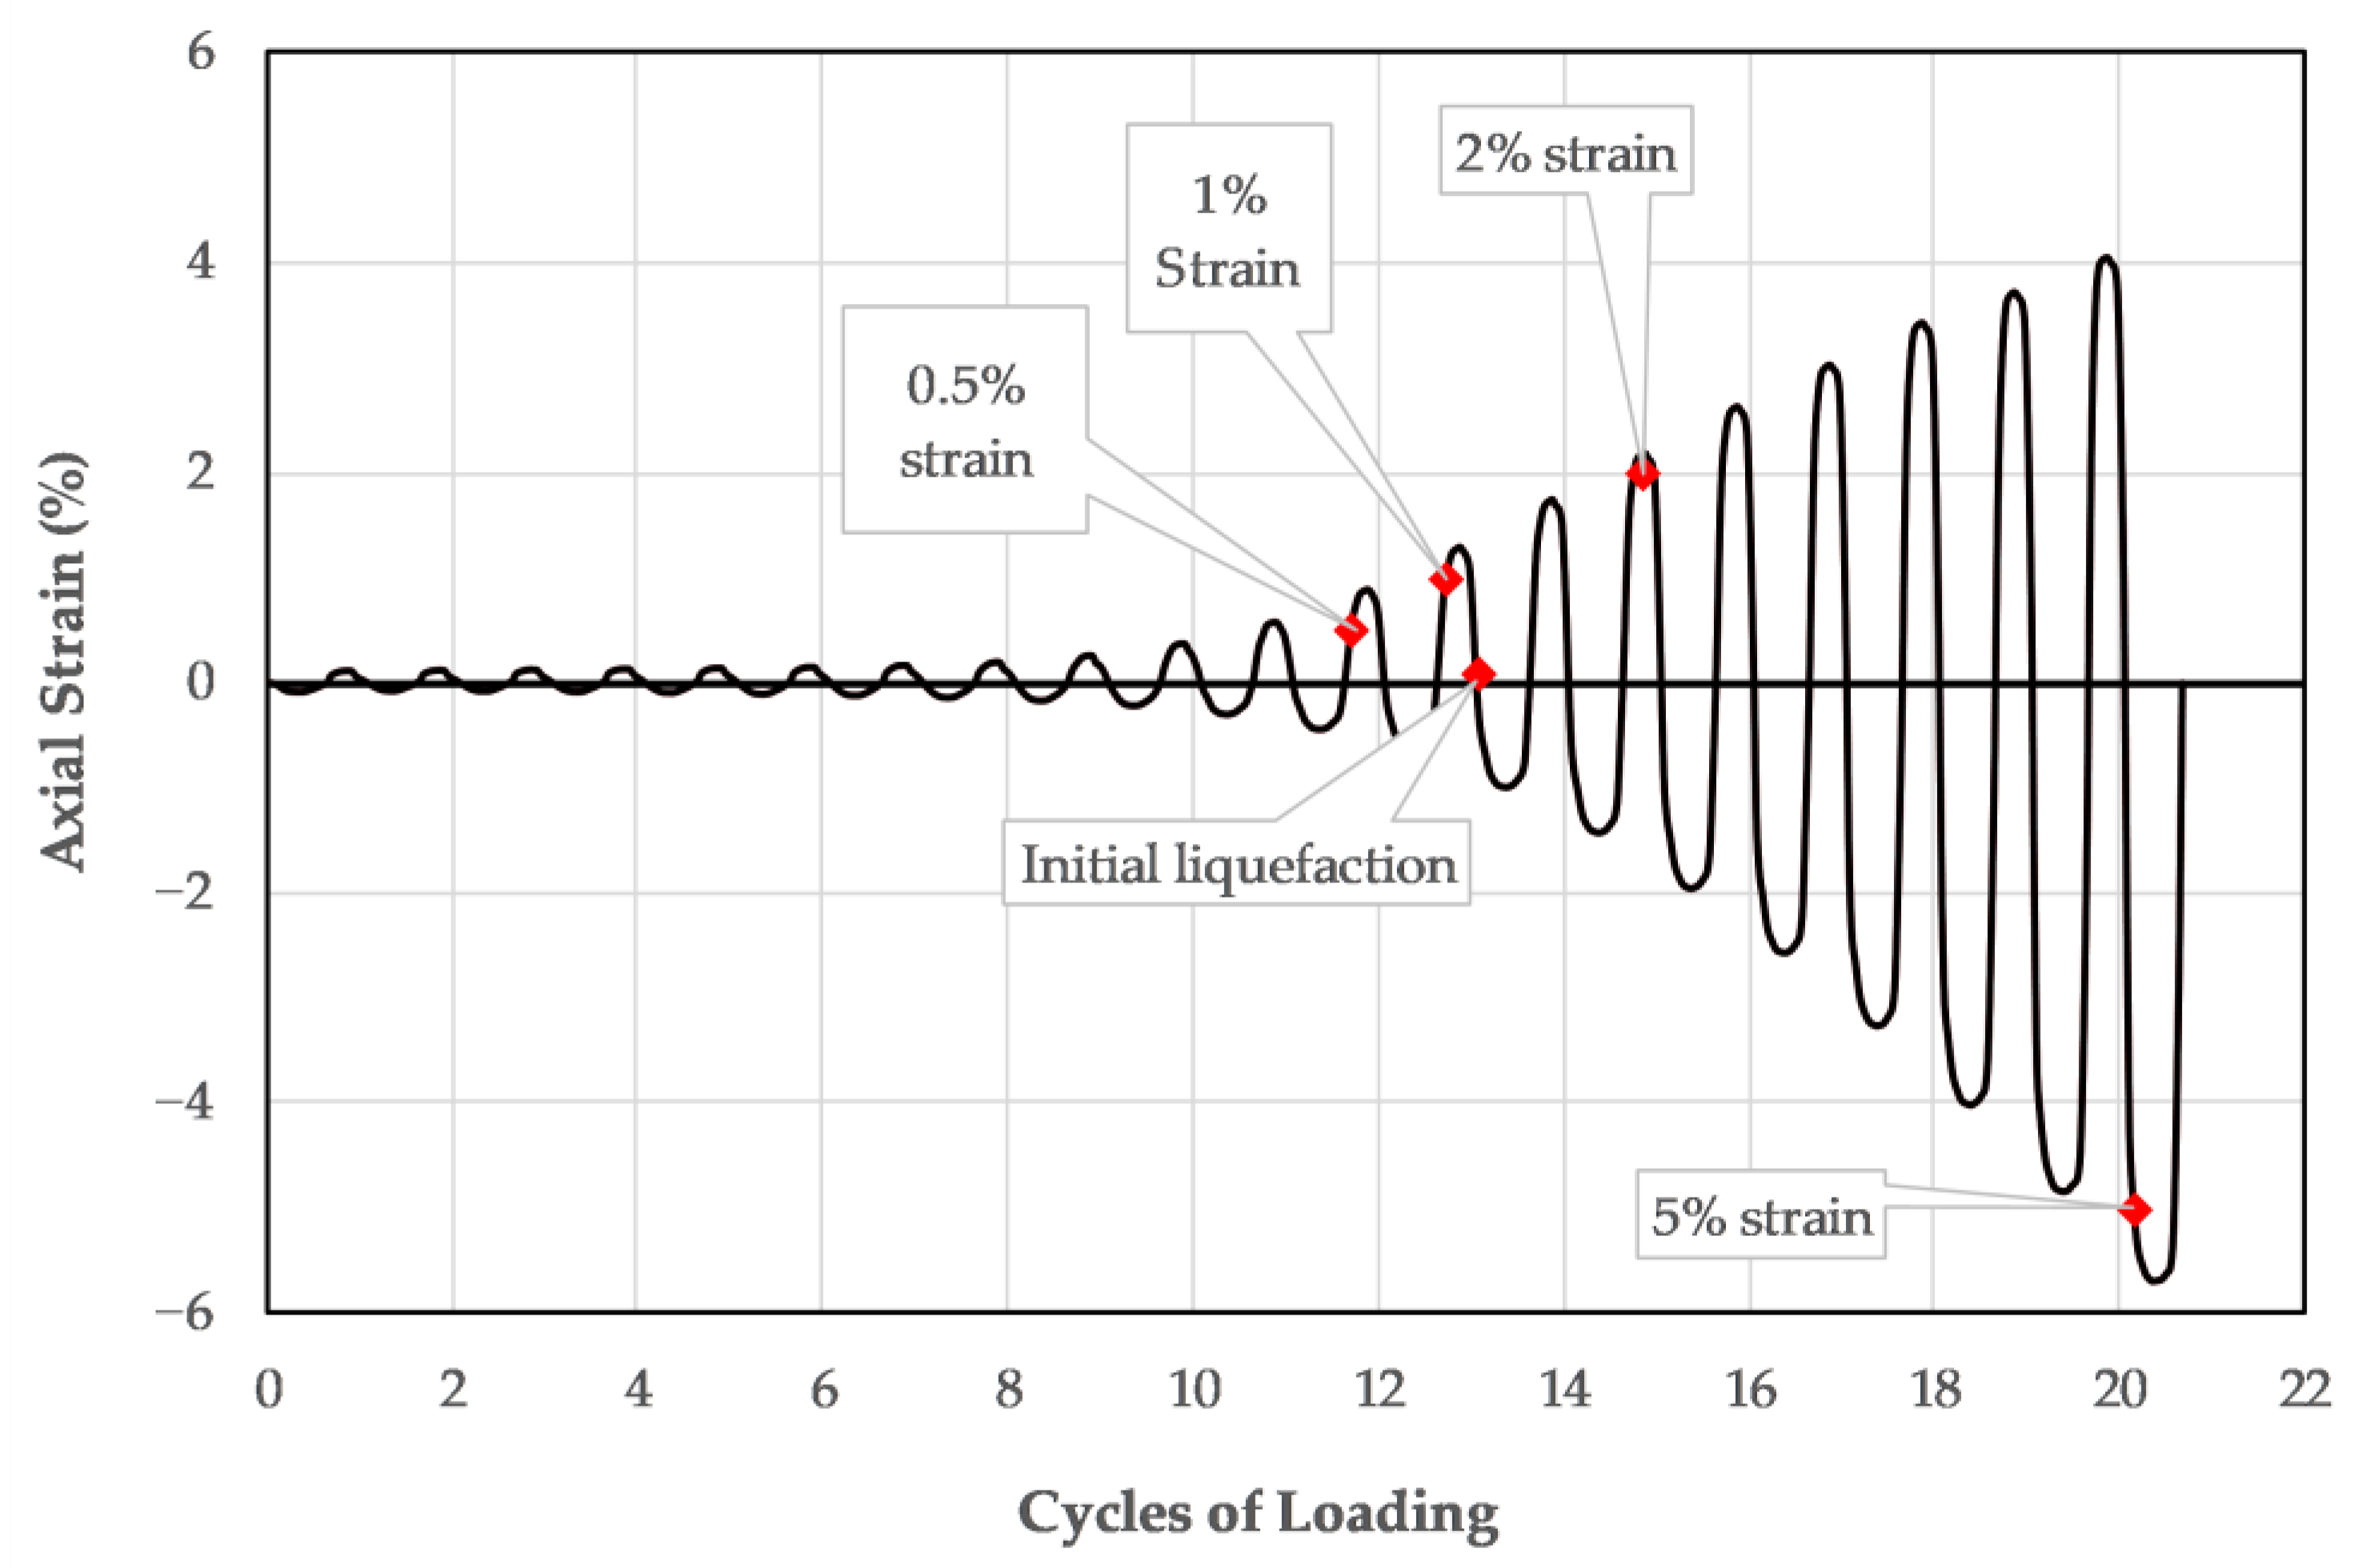
A typical strain versus cycles of loading curve from a stress-controlled cyclic triaxial test performed on a specimen exhibiting cyclic mobility is presented in
Figure 21. Similar to
Figure 20, it is marked where initial liquefaction and various single-amplitude strains occurred during the test. Soils subject to cyclic mobility are characterized by the nearly uniform development of bi-axial strains throughout the course of loading and a return to near zero strain at the end of loading.
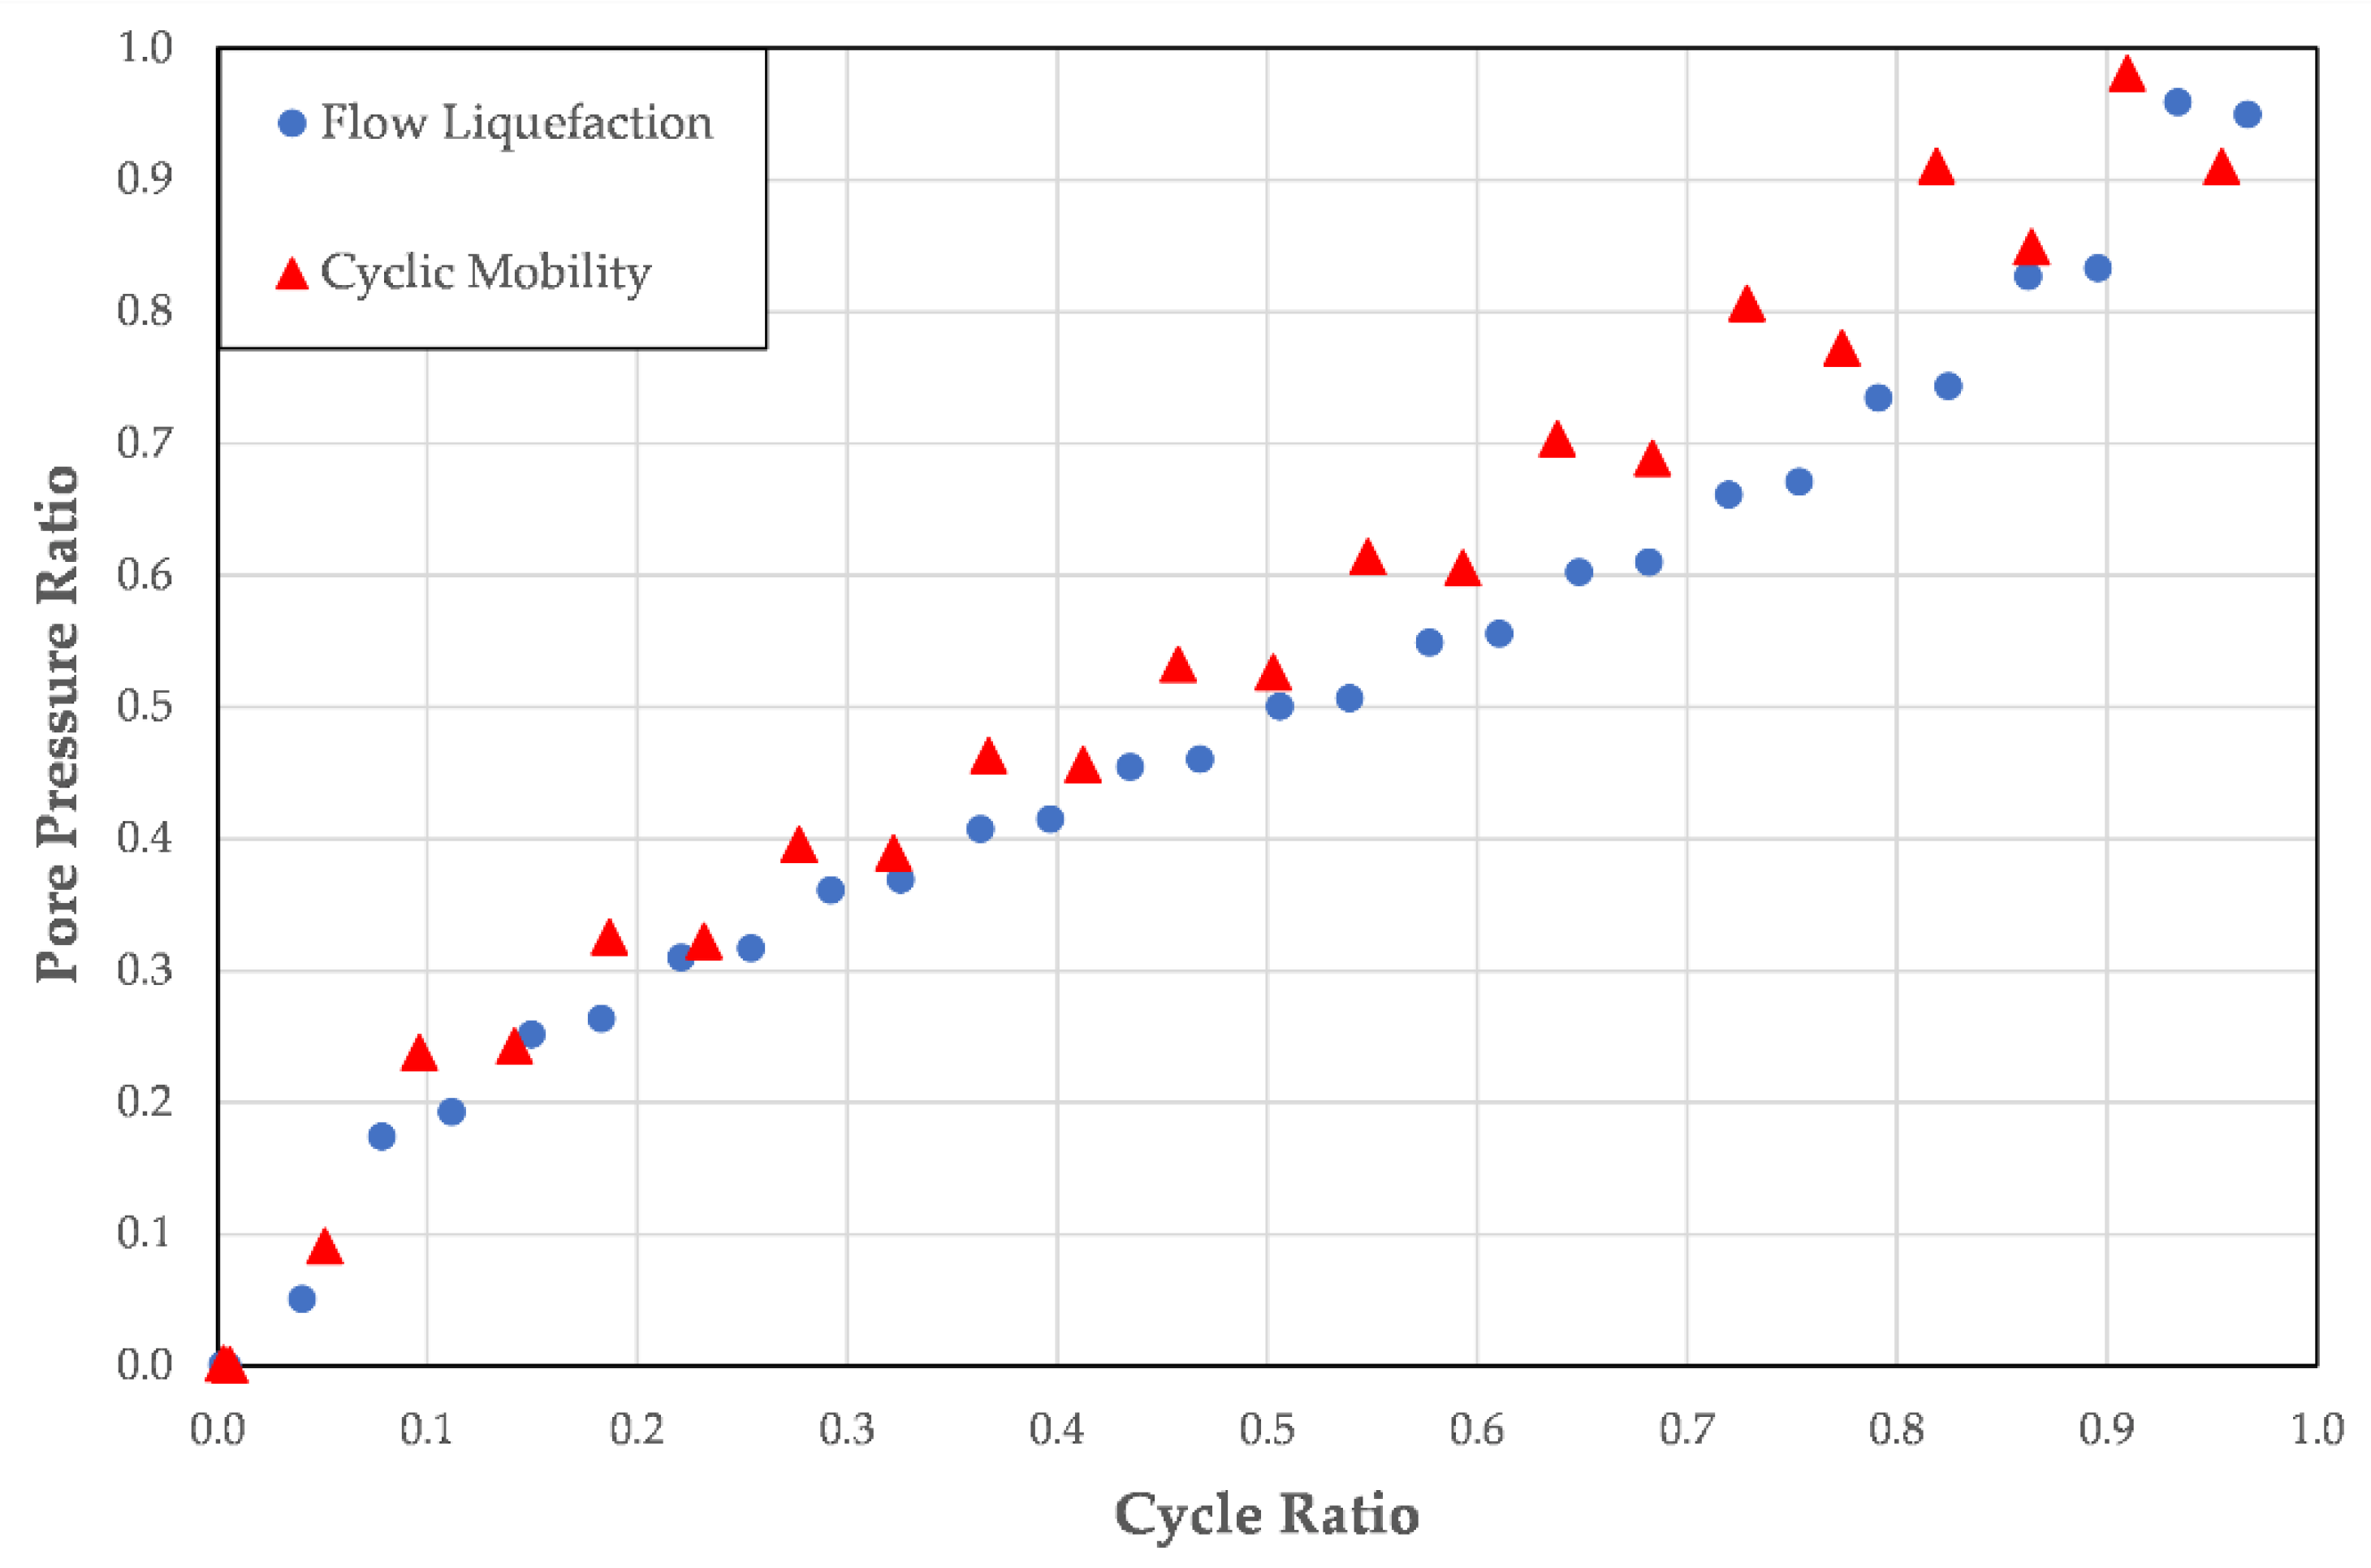
Figure 22 presents the pore pressure ratio plotted against the cycle ratio for specimens that underwent flow liquefaction and cyclic mobility failures.
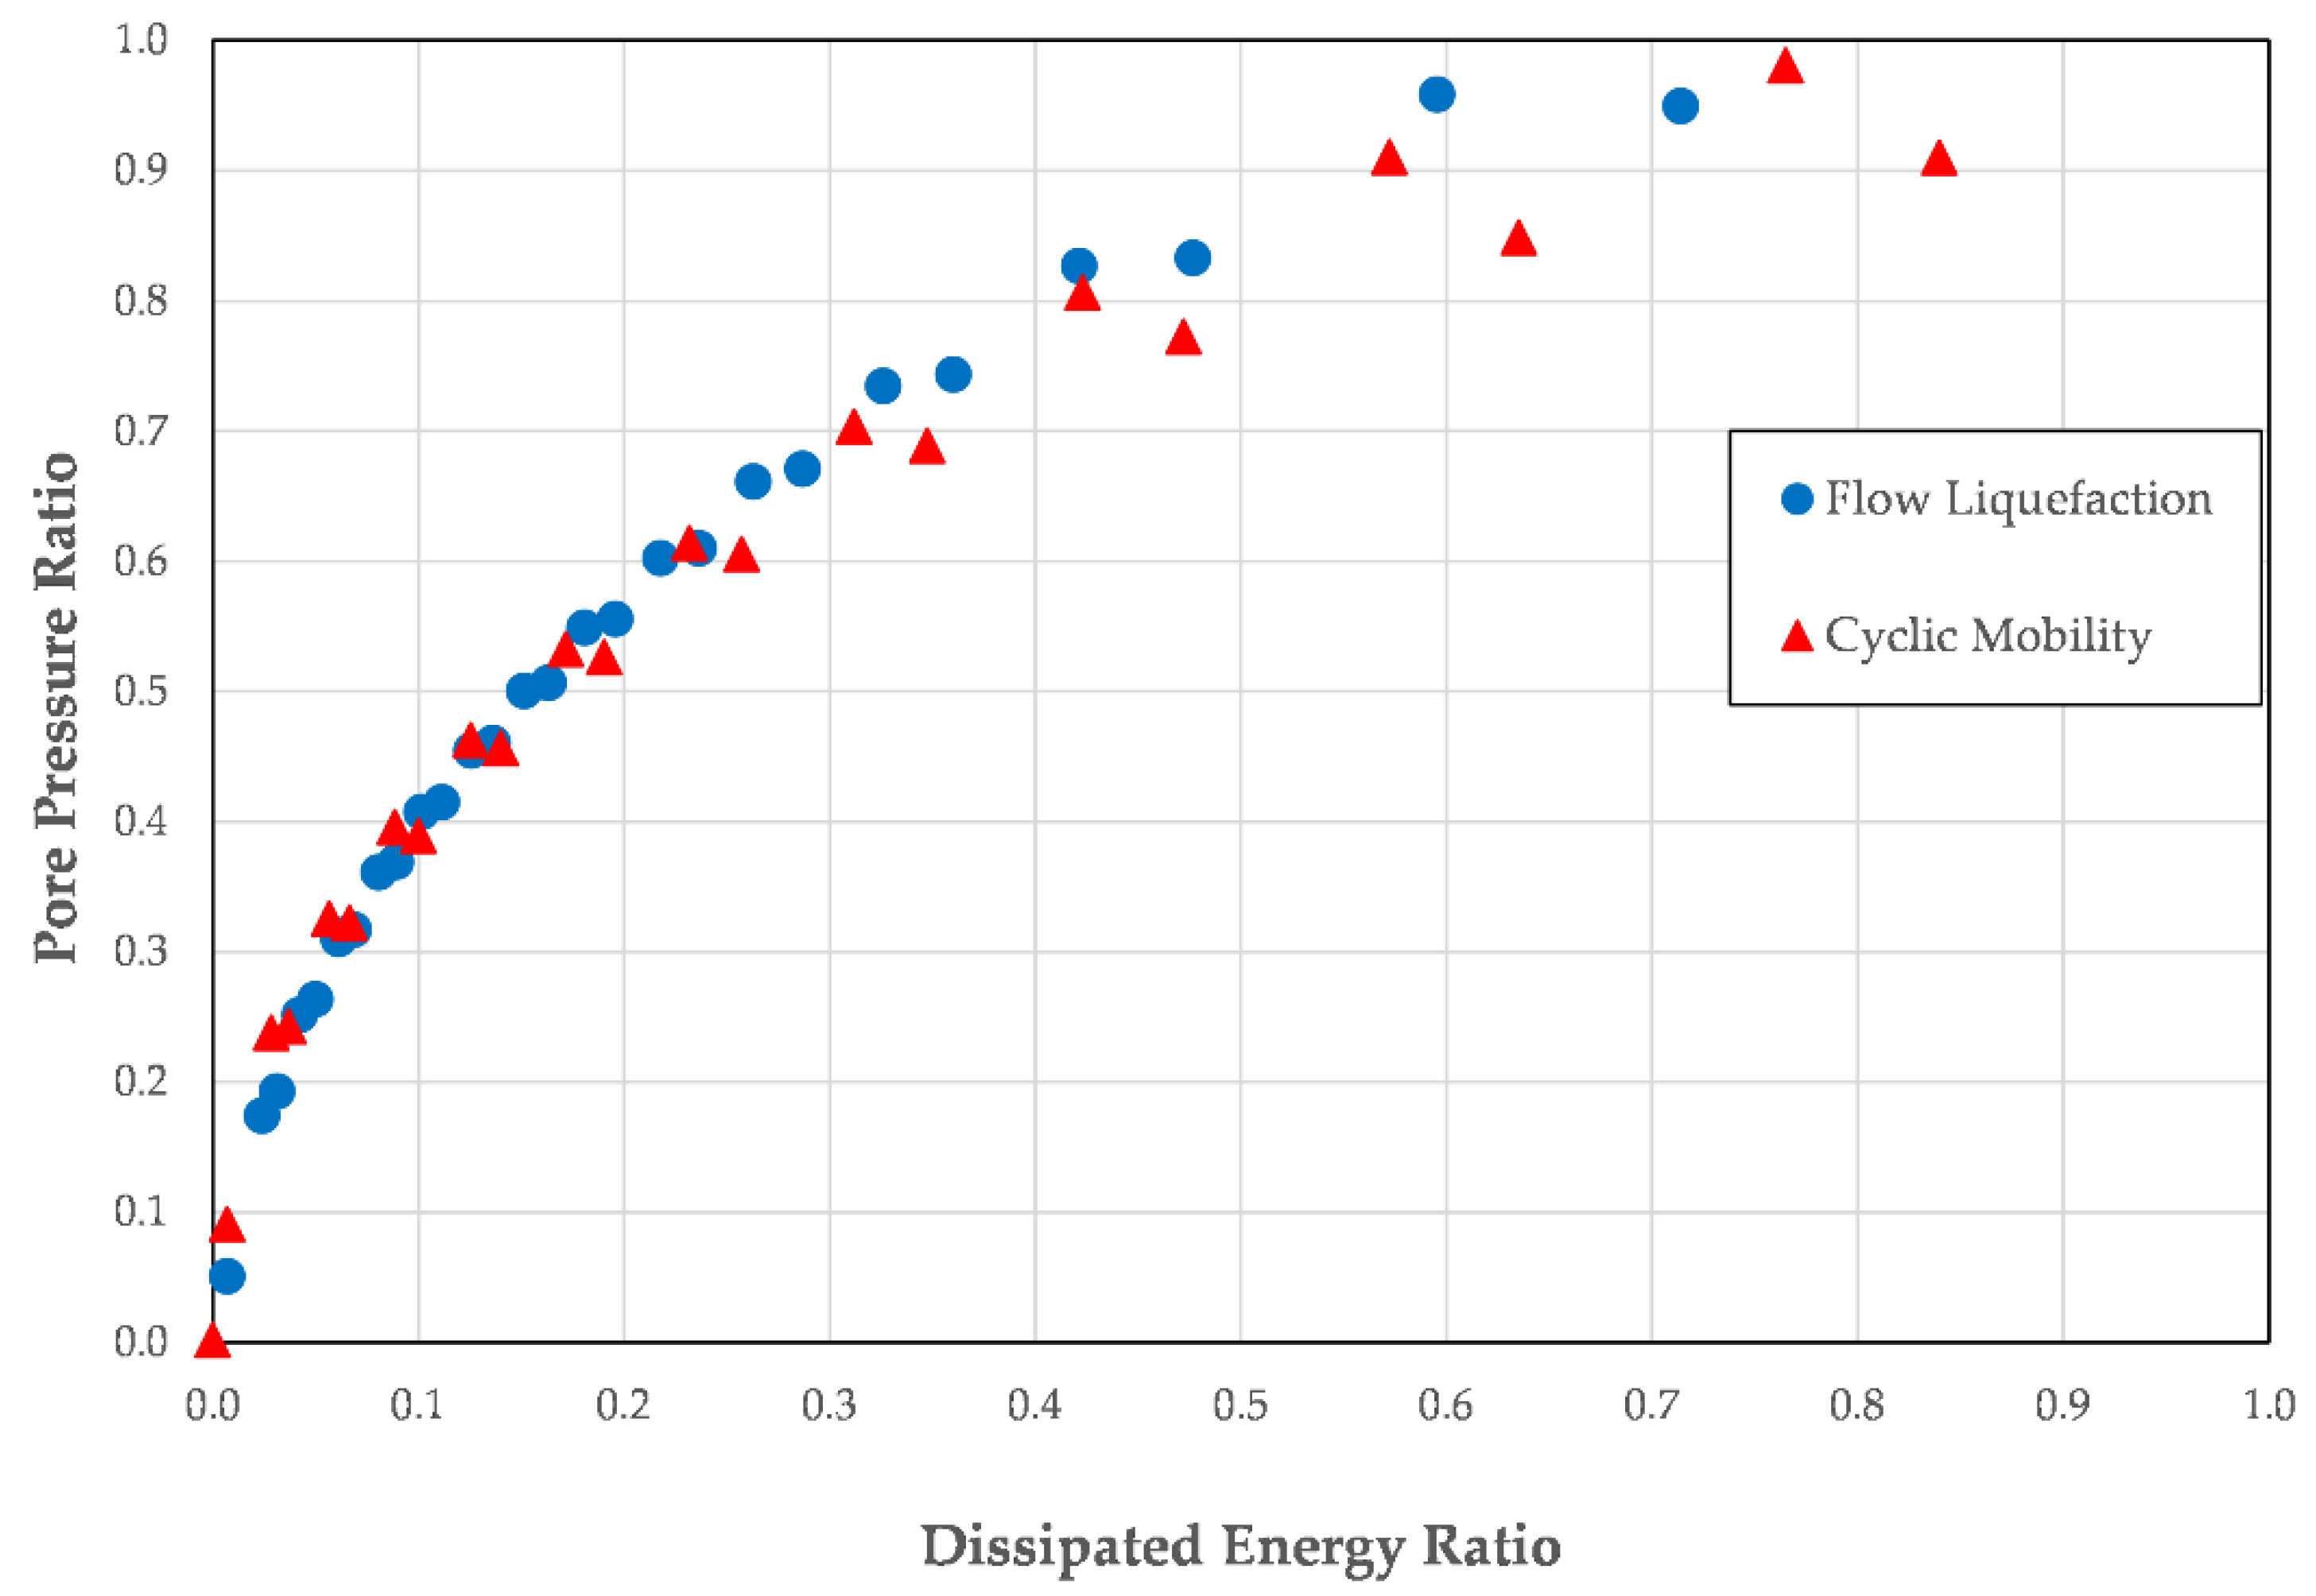
Figure 23 presents the pore pressure ratio plotted against the dissipated energy ratio for specimens that underwent flow liquefaction and cyclic mobility failures.
As may been seen in
Figure 22 and
Figure 23, the mode of liquefaction does not play a significant role in the pore pressure generation patterns of the soil. This holds true whether the pore pressure ratio is plotted against the cycle ratio or dissipated energy ratio.
5. Discussion of Results
The reason that some factors produced variations in the pore pressure generation patterns when the cycle ratio was used instead of the dissipated energy ratio is because pore pressure generation is directly linked to the dissipation of energy into the soil. It is not directly linked to the cycle of loading. While for uniform loadings, the pore pressure generation patterns are similar whether plotted as a function of cycle ratio or as a function of dissipated energy ratio, this is not the case for irregular loadings or loadings that produce different quantities of stresses and strains at different points in the test.
For tests that have different applied stresses or strains for each cycle of loading, such as a soil subjected to an irregular load that varies in the magnitude of loading from cycle to cycle, there are different amounts of energy dissipated in each cycle and, thus, different amounts of pore pressure are generated. Because the dissipated energy ratio relates the amount of energy dissipated to the amount of energy that must be dissipated to liquefy the soil, it does not matter whether a cycle of loading that produces a larger (or smaller) amount of energy dissipation occurs in the beginning, middle, or end of the loading sequence. Regardless of where the more heavily loaded cycle occurs, the pore pressure generation pattern will be the same when plotted with respect to the dissipated energy ratio.
The cycle ratio does not reflect the distribution of energy dissipation; it only reflects where a cycle of loading occurs during the sequence of loading. A cycle of loading that produces a larger (or smaller) amount of energy dissipation will produce different pressure-generation patterns when plotted with respect to the cycle ratio depending on if the cycle occurs in the beginning, middle or end of the loading sequence.
Therefore, to obtain a true understanding of a soil’s response to cyclic loading that is independent of the details of the loading pattern, pore-pressure generation should be examined in terms of dissipated energy, not in terms of loading cycles. This is best achieved by using the dissipated energy ratio rather than the cycle ratio when assessing a cyclically loaded soil’s pore pressure response.
6. Conclusions
An analysis of several factors that may influence dissipated energy and pore pressure generation patterns with respect to cycle ratio and dissipated energy ratio revealed several interesting differences. Some factors were found to produce different pore pressure generation patterns when related to the cycle ratio than when they were related to the dissipated energy ratio. These findings may be summarized as follows:
It was found that soil type, soil density, and liquefaction mode all produced similar pore pressure generation patterns for each soil tested, whether the pore pressure ratio was plotted against the cycle ratio or the dissipated energy ratio.
It was found that non-plastic silt content and soil density produced similar pore pressure generation patterns for all cases when the pore pressure ratio was plotted against the cycle ratio.
It was found that non-plastic silt content and soil density yielded different pore pressure generation patterns when the pore pressure ratio was plotted against the dissipated energy ratio. Specifically, it was found that soils with high silt contents produced higher pore pressure ratios at lower energy ratios than soils with lower silt contents.
Whether the test was stress controlled or strain controlled led to very different pore pressure generation patterns for each test when plotted against the cycle ratio, but produced very similar patterns when plotted against the dissipated energy ratio.
Similarly, whether the test performed was a cyclic triaxial test or a cyclic direct simple shear test had a large impact on the pore pressure generation pattern when plotted against the cycle ratio, but almost no impact when plotted against the dissipated energy ratio.
Lastly, the shape of the applied loading influenced the pore pressure generation patterns as well. Load shapes with a constant amplitude of the peak stresses in each cycle produced similar patterns when plotted against either the cycle ratio or the dissipated energy ratio. Irregular loadings, whose amplitude of peak stresses varied from one cycle to the next, produced different patterns when plotted against the cycle ratio but little difference when plotted against the dissipated energy ratio.
Author Contributions
Conceptualization, C.P.P. and J.R.M.; methodology, C.P.P. and J.R.M.; software, C.P.P.; validation, C.P.P.; formal analysis, C.P.P.; investigation, C.P.P.; resources, J.R.M.; data curation, C.P.P.; writing—original draft preparation, C.P.P.; writing—review and editing, C.P.P. and J.R.M.; supervision, J.R.M.; project administration, J.R.M.; funding acquisition, J.R.M. All authors have read and agreed to the published version of the manuscript.
Funding
This research received no external funding.
Data Availability Statement
All data and materials are available on request from the corresponding author. The data are not publicly available due to ongoing research using a part of the data.
Acknowledgments
The first author would like to thank Valparaiso University for the financial support provided via the Alfred W. Sieving Endowed.
Conflicts of Interest
The authors have no conflicts of interest to declare. There are no financial interests to report.
References
- Silver, M.; Chan, C.; Ladd, R.; Lee, K.; Tiedmann, D.; Townsend, F.; Valera, J.; Wilson, J. Cyclic Strength of Standard Test Sand. J. Geotech. Eng. Div. 1976, 102, 511–523. [Google Scholar] [CrossRef]
- Townsend, F. A Review of Factors Affecting Cyclic Triaxial Tests; Dynamic Geotechnical Testing, ASTM STP 654; ASTM International: West Conshohocken, PA, USA, 1978; pp. 356–383. [Google Scholar]
- Mogami, T.; Kubo, K. The Behaviour of Soil during Vibration. In Proceedings of the Third International Conference on Soil Mechanics and Foundation Engineering, Zurich, Switzerland, 16–27 August 1953; Volume 1, pp. 152–153. [Google Scholar]
- Seed, H.B.; Lee, K.L. Liquefaction of Saturated Sands during Cyclic Loading. J. Soil Mech. Found. Div. 1966, 92, 105–134. [Google Scholar] [CrossRef]
- Lee, K.L.; Seed, H.B. Cyclic Stress Conditions Causing Liquefaction of Sand. J. Soil Mech. Found. Div. 1967, 93, 47–70. [Google Scholar] [CrossRef]
- Seed, H.B. Soil Liquefaction and Cyclic Mobility Evaluation for Level Ground during Earthquakes. J. Geotech. Eng. 1979, 105, 201–255. [Google Scholar] [CrossRef]
- Nemat-Nasser, S.; Shokooh, A. A Unified Approach to Densification and Liquefaction of Cohesionless Sand in Cyclic Shearing. Can. Geotech. J. 1979, 16, 659–678. [Google Scholar] [CrossRef]
- Berrill, J.B.; Davis, R.O. Energy Dissipation and Seismic Liquefaction of Sands: Revised Model. Soils Found. 1985, 25, 106–118. [Google Scholar] [CrossRef] [PubMed]
- Figueroa, J.; Saada, A.; Liang, L.; Dahisaria, N. Evaluation of Soil Liquefaction by Energy Principles. J. Geotech. Eng. 1994, 120, 1554–1569. [Google Scholar] [CrossRef]
- Baziar, M.H.; Shahnazari, H.; Sharafi, H. A laboratory study on the pore pressure generation model for Firouzkooh silty sands using hollow torsional test. Int. J. Civ. Eng. 2011, 9, 126–134. [Google Scholar]
- Jafarian, Y.; Towhata, I.; Baziar, M.H.; Noorzad, A.; Bahmanpour, A. Strain energy based evaluation of liquefaction and residual pore water pressure in sands using cyclic torsional shear experiments. Dyn. Earthq. Eng. 2012, 35, 13–28. [Google Scholar] [CrossRef]
- Kokusho, T. Liquefaction Potential Evaluation: Energy-Based Method Compared to Stress-Based Method. In Proceedings of the Seventh International Conference on Case Histories in Geotechnical Engineering, Chicago, IL, USA, 29 April–4 May 2013. [Google Scholar]
- Shan, Y.; Cui, J.; Wen, H.; Yu, S.; Li, Y. Analysis of dynamic properties and transitional failure of clay–sand mixture in fine-grained soil based on mineral composition. Eng. Geol. 2020, 274, 105713. [Google Scholar] [CrossRef]
- Polito, C.; Moldenhauer, H. Pore Pressure Generation and Dissipated Energy Ratio in Cohesionless Soils. In Geotechnical Earthquake Engineering and Soil Dynamics IV; American Society of Civil Engineers: Austin, TX, USA, 2018; pp. 336–344. [Google Scholar]
- Green, R.A. Energy-Based Evaluation and Remediation of Liquefiable Soils. Ph.D. Thesis, Department of Civil Engineering, Virginia Polytechnic Institute and State University, Blacksburg, VA, USA, 2001. [Google Scholar]
- Seed, H.B.; Booker, J.R. Stabilization of Potentially Liquefiable Sand Deposits Using Gravel Drains. J. Geotech. Eng. Div. 1977, 103, 757–768. [Google Scholar] [CrossRef]
- Polito, C.P. The Effects of Non-Plastic and Plastic Fines on the Liquefaction of Sandy Soils. Ph.D. Thesis, Virginia Polytechnic Institute and State University, Blacksburg, VA, USA, 1999; p. 289. [Google Scholar]
- Polito, C.; Martin, J.R. The Effects of Non-Plastic Fines on the Liquefaction Resistance of Sands. J. Geotech. Geoenvironmental Eng. 2001, 127, 408–415. [Google Scholar] [CrossRef]
- Polito, C.; Green, R.A.; Dillon, E.; Sohn, C. The effect of load shape on the relationship between dissipated energy and residual excess pore pressure generation in cyclic triaxial tests. Can. Geotech. J. 2013, 50, 1118–1128. [Google Scholar] [CrossRef]
- Silver, M.L. Laboratory Triaxial Testing Procedures to Determine the Cyclic Strength of Soils; NUREG-0031; National Technical Information Service: Springfield, VA, USA, 1977. [Google Scholar]
- Ladd, R.S. Preparing Test Specimens Using Undercompaction. Geotech. Test. J. 1978, 1, 16–23. [Google Scholar] [CrossRef]
- ASTM D5311/D5311M-13; Standard Test Method for Load Controlled Cyclic Triaxial Strength of Soil. ASTM International: West Conshohocken, PA, USA, 2013. Available online: www.astm.org (accessed on 11 November 2023).
- Finn, W.; Vaid, Y.; Bhatia, S.K. Constant Volume Cyclic Simple Shear Testing. In Proceedings of the Second International Conference on Microzonation for Safer Construction: Research and Applications, San Francisco, CA, USA, 26 November–1 December 1978; pp. 839–851. [Google Scholar]
- Finn, W.D.L. Aspects of constant volume cyclic simple shear. In Proceedings of the Advances in the Art of Testing of Soils under Cyclic Conditions, Detroit, MI, USA, 24 October 1985; pp. 74–98. [Google Scholar]
- ASTM D8296-19; Standard Test Method for Consolidated Undrained Cyclic Direct Simple Shear Test under Constant Volume with Load Control or Displacement Control. ASTM International: West Conshohocken, PA, USA, 2013. Available online: www.astm.org (accessed on 11 November 2023).
- U.S. Nuclear Regulatory Commission. US NRC Regulatory Guide 1.198: Procedures and Criteria for Assessing Seismic Soil Liquefaction at Nuclear Power Plant Sites; US NRC: Washington, DC, USA, 2003. [Google Scholar]
- Schneider, J.A.; Mayne, P.W. Soil Liquefaction Response in Mid-America Evaluated by Seismic Piezocone Tests: Mid-America Earthquake Center Report MAE-GT-3A; Georgia Institute of Technology: Atlanta, GA, USA, 1999; 292p. [Google Scholar]
- Poulos, S. The steady state of deformation. J. Geotech. Engrg. 1981, 107, 553–561. [Google Scholar] [CrossRef]
- Poulos, S.; Castro, G.; France, J. Liquefaction evaluation procedure. J. Geotech. Engrg. 1985, 111, 772–792. [Google Scholar] [CrossRef]
- Roscoe, K.H.; Schofield, A.N.; Wroth, C.P. On the yielding of soils. Geotechnique 1958, 8, 22–53. [Google Scholar] [CrossRef]
- Schofield, A.N.; Wroth, C.P. Critical State Soil Mechanics, 1st ed.; McGraw-Hill Book Co., Inc.: London, UK, 1968. [Google Scholar]
- Li, X.; Wang, Y. Linear Representation of Steady-State Line for Sand. J. Geotech. Geoenvironmental Eng. 1998, 124, 621–629. [Google Scholar] [CrossRef]
Figure 1.
Stresses in a stress-controlled and a strain-controlled cyclic triaxial or cyclic direct simple shear test.
Figure 1.
Stresses in a stress-controlled and a strain-controlled cyclic triaxial or cyclic direct simple shear test.
Figure 2.
Strains from a stress-controlled and a strain-controlled cyclic triaxial or cyclic direct simple shear test.
Figure 2.
Strains from a stress-controlled and a strain-controlled cyclic triaxial or cyclic direct simple shear test.
Figure 3.
Pore pressure generation patterns as a function of cycle ratio for stress- and strain-controlled cyclic triaxial tests.
Figure 3.
Pore pressure generation patterns as a function of cycle ratio for stress- and strain-controlled cyclic triaxial tests.
Figure 4.
Pore pressure generation patterns as a function of dissipated energy ratio for stress- and strain-controlled cyclic triaxial tests.
Figure 4.
Pore pressure generation patterns as a function of dissipated energy ratio for stress- and strain-controlled cyclic triaxial tests.
Figure 5.
Pore pressure generation patterns as a function of cycle ratio for one strain-controlled cyclic triaxial test and one strain-controlled cyclic direct simple shear test.
Figure 5.
Pore pressure generation patterns as a function of cycle ratio for one strain-controlled cyclic triaxial test and one strain-controlled cyclic direct simple shear test.
Figure 6.
Pore pressure generation patterns as a function of dissipated energy ratio for one strain-controlled cyclic triaxial test and one strain-controlled cyclic direct simple shear test.
Figure 6.
Pore pressure generation patterns as a function of dissipated energy ratio for one strain-controlled cyclic triaxial test and one strain-controlled cyclic direct simple shear test.
Figure 7.
Grain size distribution curves for the soils evaluated.
Figure 7.
Grain size distribution curves for the soils evaluated.
Figure 8.
Pore pressure ratio plotted against the cycle ratio for the six soils tested.
Figure 8.
Pore pressure ratio plotted against the cycle ratio for the six soils tested.
Figure 9.
Pore pressure ratio plotted against the dissipated energy ratio for the six soils tested.
Figure 9.
Pore pressure ratio plotted against the dissipated energy ratio for the six soils tested.
Figure 10.
Pore pressure ratio plotted against the cycle ratio for the specimens with 10 different non-plastic fines contents prepared to approximately 26% relative density.
Figure 10.
Pore pressure ratio plotted against the cycle ratio for the specimens with 10 different non-plastic fines contents prepared to approximately 26% relative density.
Figure 11.
Pore pressure ratio plotted against dissipated energy ratio for specimens with 10 different non-plastic fines contents prepared to approximately 26% relative density.
Figure 11.
Pore pressure ratio plotted against dissipated energy ratio for specimens with 10 different non-plastic fines contents prepared to approximately 26% relative density.
Figure 12.
Pore pressure ratio plotted against cycle ratio over a range of void ratios for Yatesville sand.
Figure 12.
Pore pressure ratio plotted against cycle ratio over a range of void ratios for Yatesville sand.
Figure 13.
Pore pressure ratio plotted against energy ratio over a range of void ratios for Yatesville sand.
Figure 13.
Pore pressure ratio plotted against energy ratio over a range of void ratios for Yatesville sand.
Figure 14.
Variation in relative density for specimens prepared to a constant void ratio of 0.76 at various silt contents.
Figure 14.
Variation in relative density for specimens prepared to a constant void ratio of 0.76 at various silt contents.
Figure 15.
Pore pressure ratio plotted against cycle ratio for soils over a range of relative densities.
Figure 15.
Pore pressure ratio plotted against cycle ratio for soils over a range of relative densities.
Figure 16.
Pore pressure ratio plotted against the dissipated energy ratio for soils over a range of relative densities.
Figure 16.
Pore pressure ratio plotted against the dissipated energy ratio for soils over a range of relative densities.
Figure 17.
Pore pressure ratio plotted against the cycle ratio for the different load shapes.
Figure 17.
Pore pressure ratio plotted against the cycle ratio for the different load shapes.
Figure 18.
Pore pressure ratio plotted against the dissipated energy ratio for the different load shapes.
Figure 18.
Pore pressure ratio plotted against the dissipated energy ratio for the different load shapes.
Figure 19.
An example of a typical steady-state line.
Figure 19.
An example of a typical steady-state line.
Figure 20.
Strain versus cycles of loading curve for a specimen exhibiting flow liquefaction.
Figure 20.
Strain versus cycles of loading curve for a specimen exhibiting flow liquefaction.
Figure 21.
Strain versus cycles of loading curve for a specimen exhibiting cyclic mobility.
Figure 21.
Strain versus cycles of loading curve for a specimen exhibiting cyclic mobility.
Figure 22.
Pore pressure ratio plotted against the cycle ratio for the specimens with flow liquefaction and cyclic mobility failure modes.
Figure 22.
Pore pressure ratio plotted against the cycle ratio for the specimens with flow liquefaction and cyclic mobility failure modes.
Figure 23.
Pore pressure ratio plotted against dissipated energy ratio for the specimens with flow liquefaction and cyclic mobility failure modes.
Figure 23.
Pore pressure ratio plotted against dissipated energy ratio for the specimens with flow liquefaction and cyclic mobility failure modes.
Table 1.
Summary of previous studies.
Table 1.
Summary of previous studies.
| Reference Number | Test Type | Soils Tested | Description of Study |
|---|
| [17,18] | CTX | Yatesville sand, Monterey #0/30 sand and Yatesville Silt | 210 stress-controlled cyclic triaxial tests were performed on mixtures of two sands and a non-plastic silt. Each sand was mixed to 10 different silt contents. Specimens at the different silt contents and at various densities were tested to evaluate the effects of non-plastic fines on liquefaction susceptibility. |
| [14] | CTX | Ottawa C-109 Sand | The results of 137 stress-controlled cyclic triaxial tests were used to evaluate the validity of energy ratio in clean sand. |
| [19] | CTX | Ottawa 20–30 sand | 28 stress-controlled cyclic triaxial tests were performed with various loading shapes to evaluate the effects of the various load shapes on energy dissipation, pore-pressure generation and liquefaction in clean sands. |
| Unpublished | CTX & CDSS | Ottawa C-109 Sand, Nevada Sand and New Martin Sand | 30 CTX and 30 CDSS tests were performed in order to generate data for evaluation of energy dissipation as a function of test type. Tests were performed on specimens prepared to either 40% or 65% relative density. |
Table 2.
Properties of soils used in study.
Table 2.
Properties of soils used in study.
| Soil | Gs | Cu | Cc | D50 (mm) | emax | emin |
|---|
| Monterey #0/30 Sand | 2.65 | 1.48 | 1.04 | 0.43 | 0.821 | 0.631 |
| New Martin Sand | 2.63 | 4.61 | 1.02 | 0.70 | 0.547 | 0.337 |
| Nevada Sand | 2.67 | 1.69 | 0.77 | 0.11 | 0.887 | 0.511 |
| Ottawa 20–30 sand | 2.65 | 1.20 | 1.01 | 0.71 | 0.740 | 0.510 |
| Ottawa C-109 Sand | 2.65 | 1.65 | 1.03 | 0.33 | 0.690 | 0.499 |
| Yatesville Silt | 2.77 | 4.33 | 0.92 | 0.03 | 1.723 | 0.727 |
| Yatesville Sand | 2.72 | 2.45 | 0.77 | 0.18 | 0.972 | 0.653 |
| Disclaimer/Publisher’s Note: The statements, opinions and data contained in all publications are solely those of the individual author(s) and contributor(s) and not of MDPI and/or the editor(s). MDPI and/or the editor(s) disclaim responsibility for any injury to people or property resulting from any ideas, methods, instructions or products referred to in the content. |
© 2024 by the authors. Licensee MDPI, Basel, Switzerland. This article is an open access article distributed under the terms and conditions of the Creative Commons Attribution (CC BY) license (https://creativecommons.org/licenses/by/4.0/).


