Article

Rock Mechanical Laboratory Testing of Thebes Limestone Formation (Member I), Valley of the Kings, Luxor, Egypt

1
Department of Civil Engineering, York University, 4700 Keele, Toronto, ON M3J 1P3, Canada
2
Department of Earth Sciences, ETH Zurich, 5 Sonneggstrasse, 8092 Zurich, Switzerland
3
Department of Ancient Civilizations, University of Basel, 51 Petersgraben, 4051 Basel, Switzerland
4
Department of Geology, South Valley University, Qena 83523, Egypt
5
GNS Science, 1 Fairway Drive, Avalon, Lower Hutt 5011, New Zealand
*
Author to whom correspondence should be addressed.
Geotechnics 2022, 2(4), 825-854; https://doi.org/10.3390/geotechnics2040040
Submission received: 26 August 2022 / Revised: 16 September 2022 / Accepted: 20 September 2022 / Published: 26 September 2022

Abstract

:
The Thebes Limestone Formation of Lower Eocene age is one of the most extensive rock units in Egypt. It is of importance to the apogee of the ancient Egyptian civilization, particularly in Luxor (South-Central Egypt), where the rock formation hosts the Theban Necropolis, a group of funerary chambers and temples from the New Kingdom Egyptian era (3500–3000 BP). In this work, we investigated the petrophysical and rock mechanical properties (e.g., rock strength, critical crack stress thresholds) through laboratory tests on eleven rock blocks collected from one area within the Theban Necropolis known as the Valley of the Kings (KV). The blocks belong to Member I of the Thebes Limestone Formation, including six blocks of marly limestone, three blocks of micritic limestone, one block of argillaceous limestone from the Upper Esna Shale Formation, and one block of silicified limestone of unknown origin. Special attention was given to the orientation of bedding planes in the samples: tests were conducted in parallel (PA) and perpendicular (PE) configurations with respect to bedding planes. We found that the marly limestone had an average unconfined compressive strength (UCS) of 30 MPa and 39 MPa for the PA and PE tests, respectively. Similarly, the micritic limestone tests showed an average UCS of 24 MPa for the PA orientation and 58 MPa for the PE orientation. The critical crack thresholds were the first ever reported for Member I, as measured with strain gauge readings. The average crack initiation (CI) stress thresholds for the marly limestone (PA: 14 MPa) and the micritic limestone (PA: 11 MPa; PE: 24 MPa) fall within the typical ratio of CI to UCS (0.36–0.52). The micritic limestone had an average Young’s modulus (E) of 19.5 GPa and 10.3 GPa for PA and PE, respectively. The Poisson’s ratios were 0.2 for PA and 0.1 for PE on average. Both marly and micritic limestone can be characterised by a transverse isotropic strength behaviour with respect to bedding planes. The failure strength for intact anisotropic rocks depends on the orientation of the applied force, which must be considered when assessing the stability of tombs and cliffs in the KV and will be used to understand and improve the preservation of this UNESCO World Heritage site.

1. Introduction

The Valley of the Kings (KV) is an ancient cemetery used by the Egyptians of the New Kingdom (3500–3000 BP) within a larger archaeological complex called the Theban Necropolis. The Theban Necropolis was constructed at the West Bank of the Nile River in Luxor, South-Central Egypt (Figure 1), and it has more than 450 underground tombs in an area of about six square kilometres. The area was declared a UNESCO World Heritage Site in 1979 and includes several sacred areas such as the Valley of the Queens, Sheikh Abd el-Qurna, Deir el-Medina, the Hatshepsut temple, Deir el-Bahari, and the KV. The KV was constructed for pharaohs’ funerary rites, and 64 underground tombs have been discovered within the KV to date [1]
Among many topics, geoarchaeology and environmental archaeology examine damage to rock caverns, tomb stability, geological hazards within ancient sites, and environmental influences on ancient art and archaeological artefacts [2,3,4]. Archaeological campaigns at the site strive to understand, document, and preserve the legacy of this ancient Egyptian civilisation. Their work is supported by geologists that have undertaken research in the wider Theban Necropolis [1,5,6,7,8,9,10,11]. Within this context, the Swiss Kings’ Valley Project of the University of Basel has been granted permission by Egyptian authorities to explore twelve tombs from the 18th to 25th Dynasties (i.e., 3500–2650 BP) situated in the central area of the KV. The main activities of this project are the detailed documentation and publication of the tombs’ state [12]. In addition, researchers wish to understand how to preserve a site, studying its critical state, potential mitigations, and enhancement through the use of an engineering geology methodology. Here, a joint geological team aids the Kings’ Valley Project and comprises members from York University (Toronto, ON, Canada), ETH Zurich (Zurich, Switzerland) and South Valley University (Qena, Egypt). Our team assessed the current condition of the cliffs around the valley to determine their stability, triggering agents for rock falls, and (in particular) the effect of climatic conditions on the evolution of rock damage in subvertical cliffs of marlstone and limestone belonging to Member I of the Thebes Limestone Formation [13,14].
The assignment of the Thebes Limestone in the stratigraphic nomenclature within the Theban Necropolis has recently come into question. Some authors have delineated a so-called Thebes Limestone Group, which includes the Serai Formation [15]. The Serai Formation would dominate the landscape of the Theban Necropolis, including Member I in the KV. Other authors described that the Thebes Limestone Formation comprises the Member I and associated outcrops in the Thebes Mountains [16]. For the purpose of this research, the definition proposed by King et al. [16] was used, which considers the Thebes Limestone Formation as independent of a stratigraphic group. The Thebes Limestone Formation is one of the most extensive rock outcrops in Egypt, extending from the western bank of the Nile River to Kharga Oasis in the Western Desert, and it hosts world-class archaeological sites. However, only limited information regarding rock mechanical properties including anisotropic behaviour is presently available, as summarised in Table 1, and critical crack thresholds are missing. Although many geotechnical properties have been reported from various locations within the Theban Necropolis, typically the values are based on a small number of tested samples (between one to seven), whereas we have tested between 10 to 50 samples for each property. Here, we present results from a rock mechanical investigation of Member I of the Thebes Limestone Formation in which the entrance of the KV tombs were constructed. These results include physical rock properties (e.g., bulk density, compressional wave speed, thermal conductivity, heat capacity, connected porosity, slake durability, elastic properties), peak strength limits (tensile, and compressive), and critical crack thresholds (crack closure and crack initiation). We followed suggested methods from international standards, so that these data can support future analyses of the rock mass behaviour of natural and built structures of the KV, therefore contributing to the future preservation of this UNESCO world heritage site.

2. Rock Formations and Morphology of the Valley of the Kings

The Theban Necropolis is located on the West Bank of the Nile River. The site is at the base of the el-Qurna mountain of 478 m maximum elevation. Two marine sedimentary formations dominate the geology: Thebes Limestone Formation of Lower Eocene age [16] and the underlying Esna Shale Formation of Upper Palaeocene/Lower Eocene age [15]. The Thebes Limestone Formation has a maximum vertical extent of about 340 m and is exposed at most of the cliffs surrounding the Theban Necropolis. Regionally, it is one of the largest formations, covering approximately 200,000 km2 [16]. At el-Qurna mountain, distinct subvertical cliffs and less steeply dipping slopes in between showcase the Thebes Limestone Formation’s subunits of different mineralogical compositions, comprising fine-grained and thinly bedded micritic limestone, chalky and cherty with rare shale [30]. The lower section of the Thebes Limestone Formation, i.e., Member I, was deposited in an open ocean shallow environment with high plankton production rates. Their original bedding orientation deviates at places between 20° and 40° [16], marked by the presence of chert nodules and chert layers aligning parallel along bedding planes in the upper units of Member I. The nature of bedding planes causes anisotropic rock behaviour (e.g., strength and deformation) [17,18,20,21]. The Esna Shale Formation is exposed at the entrance area of the KV, in some undecorated rock tombs, as well as at slumped blocks that shape the landscape in the hills of Sheikh Abd el-Qurna [11,16].
The northern area of the Theban Necropolis is part of a wadi system in the Theban Mountains containing the East Valley and West Valley. Most royal tombs are located in the East Valley, known as the KV (Figure 2a). The KV is surrounded by steep cliffs of up to 30 m in height (Figure 2b) and small hills with gentle slopes. Other important features were described by Lukovic et al. [14] and include low slope angles from the crest of cliffs to the upper plateau, overhanging blocks in cliff walls, gullies crossing the valley, and branching channels used as tourist paths dipping towards the north (<10°). Lukovic et al. [14] also reported bedding angles from subhorizontal (15°) for unfaulted sections to steep angles (30°) for those affected by listric faults. The current morphology is a result of the tectonic fracture network, allowing for rock falls and slides, as well as repetitive fluvial erosion, cycles of flooding, and colluvium accumulation. The rock mass wasting processes accumulate rock debris (consolidated and loose) at the toe of the cliffs and the central site of the valley; these debris are transported by fluvial processes and redeposited during archaeological excavations [31].
Member I of Thebes Limestone Formation dominates the exterior landscape of the KV and the entrance of the tombs. However, it is difficult to note the presence of Member I at the central section of the KV because of an accumulation of debris, colluvial materials (angular in shape; formed during flooding with limited length of transport), and finer gravel and aeolian sediments. This debris has caused a rise of the ground surface of up to 10 m in some areas within the KV [14,33].Conversely, the upper Esna Shale Formation is only visible at the entrance to the KV and in some of the deepest tombs, such as KV20, KV17, and KV7 [9]. The upper members of the Esna Shale Formation are water-sensitive rock units (i.e., high contents of smectite and illite) [21,34]. Outside of the KV, the Esna Shale Formation is the origin of most of the soils in both banks of the Nile River at Luxor. Outcrops of the Esna Shale Formation are found at some locations in the Theban Necropolis (e.g., Sheikh Ab el-Qurna, Hatshepsut temple, and Deir el-Medina) and at rock walls surrounding the main road leading to the KV.
King et al. [16] provided a stratigraphic column for the Thebes Limestone Formation, including 13 subunits. The authors characterised the lower section of the Thebes Limestone Formation (up to 223.5 m.a.s.l.), also called Member I. Different subunits of marly limestone, marlstone, and micritic limestone and layers of thin flints, cherts, and nodular limestone comprise Member I. A general mineralogical breakdown for Member I is about 60% calcite, <5% quartz, <10% ankerite, and 25–30% clay minerals (15% fibrous clay and 15% other clay minerals) [16]. The clay mineral fraction of the rocks in Member I consist of sepiolite, palygorskite, and illite-smectite mixed-layer clay minerals. The latter was termed ISRo by King et al. [16], and it is characterised by its high potential for expansion when in contact with water. The ISRo composition is dominated by smectite (85%), with illite reaching a maximum of 15% in the upper levels of the Thebes Formation (i.e., Member IV and V).
The presence of ISRo varies across the stratigraphic column in the Thebes Formation. At the lowest level of Member I (i.e., up to 125 m.a.s.l), ISRo dominates over 60% of the clay composition. Above this point in the stratigraphic column, the amount of planktonic foraminifera reduce, changing the ratio between sepiolie and palygorskite as shown in Figure 2c. The ratio of sepiolite to palygorskite has important implications in characterising the depositional environment in which the units were formed [21]. However, it also explains the existence of manganese dendrites in some marly limestone belonging to Member I. Palygorskite tends to oxidise and supports as catalyst the formation of manganese dendrites in shallow surfaces, assisted by repeated cycles of wetting and drying [35]. Both clay composition and grain size are important diagnostic features to determine the original location of different loose rock blocks in the KV and this was used in this study.

3. Sampling and Rock Description

Eleven rock block samples were collected at different locations within the KV (Figure 2a) during a field campaign in February 2019. The blocks were approximately 50 cm × 50 cm × 25 cm in size, as shown in Figure 3a. Since the KV is a UNESCO World Heritage Site, samples were selected from loose, partly excavated debris in order to not disturb or alter archaeological sites. We macroscopically inspected the blocks on-site to ascertain whether they belonged to Member I of the Thebes Limestone Formation (Table 2) by ensuring that blocks had sharp edges and corners (i.e., short transport distances from upper levels), a low fossiliferous content (fossils are rare in Member I) and did not show the effects of human influence (likely moved from other sites or interior of tombs). We also collected one block sample from the Esna Shale Formation and one block sample of silicified limestone. Block samples were described in accordance with BSI [36]. The estimated stratigraphic positions of samples are presented in Figure 2c. These data were compiled from information provided in the literature and on-site observations [16,21].
The marly limestone blocks (B1, B2, B3, B9, B10, and B11) showed an expansive response in contact with water, likely linked to a high content of ISRo minerals as described for the bottom section of Member I (120–130 m.a.s.l), as well as the absence of interbedded flint layers and the presence of manganese dendrites at the outer layers (i.e., oxidation of palygorskite). Sample B7 was excavation material from KV17, so that is derived from the Esna Shale Formation. This had an argillaceous and oxidised appearance (i.e., reddish edges), and expanded in contact with water (i.e., stronger action than marly limestone blocks). The KV17 tomb is one of the deepest tombs, located at a transition between Member I of the Thebes Limestone Formation and the Esna Shale Formation, so the B7 sample was assigned to the Upper Esna Shale Formation (i.e., 110–120 m.a.s.l.). The micritic limestone samples (B4, B5, and B6) were assigned to the upper levels (200–210 m.a.s.l.) of the stratigraphic column (Figure 2c) because of their relatively low expansion in contact with water (i.e., lower content of ISRo minerals), lack of manganese oxide dendrites on outer layers, low bioclast percentages (at naked eye), and presence of chert beddings. The silicified limestone sample (B8) was assumed to belong to the top of Member I (220–235 m.a.s.l.), as noted by Wüst [18]: “silicified reworked limestone band on top of Member I”; however, this was not explicitly reported by King et al. [16]. Following field collection, the samples were stored for one year at room temperature, isolated from direct sun exposure, and isolated from water contact. Laboratory tests were conducted in February 2020.

4. Methodology

The aim of the laboratory testing program was to geotechnically characterise the rock units while considering the natural anisotropy originating from rock bedding. The orientation of the tests relative to bedding plane orientations followed the nomenclature set out by Lazar [17] and Wüst [18], as illustrated in Figure 3b. The parallel (PA) and perpendicular (PE) orientations refer to the orientation of tests, so geotechnical properties are measured in PA and PE with respect to bedding planes. All tests and preparations of samples were carried out at room temperature and humidity in daylight hours during February 2020 in Qena, Egypt.

4.1. Rock Block Tests and Drilling of Rock Blocks

4.1.1. Thermal Conductivity and Volumetric Specific Heat

A thermal property analyser was used (KD2 Pro) with an SH-1 dual needle sensor (1.3 mm in diameter, 30 mm in length, and 6 mm spacing between needles) for rocks [37]. For softer rocks, slim drill holes were produced to install the thermal needle. For harder rocks, the needles were placed between two parallel planes (as close as possible) along a pre-existing fracture. The needle was covered with a thermal silver-based gel (99.9% pure silver). For each sample, we obtained ten values recorded at 15 min intervals.

4.1.2. Ultrasonic Pulse Velocity Tests of Blocks (Wave Speed)

Tests were conducted on rock blocks following BSI (1986). A V-meter MK IV apparatus was used with a 54 kHz ultrasonic transducer (diameter of 50 mm and length of 81.3 mm), assisted by a lubricant mineral-oil-based gel to increase the contact area between the rock and transducer. In addition to PA and PE tests, we also oriented the transducer in two modes [38]: direct (i.e., travel time across the block, DIR) and indirect (i.e., travel time measured between two transducers located on the same side of a block with at least 150 mm of separation, IND). For each test, ten readings were recorded with the two setups.

4.1.3. Coring and Preparation of Samples

The coring process took place outdoors on a wet platform following the suggested method of BSI [36]. A drill bit of 50.8 mm in diameter was used to core samples with an average of 43 mm in diameter. The drilling machine (700 rpm and 3300 W) was held and screwed to a platform floor to reduce vibrations, and the rock samples were stabilised. The water flux was controlled at a minimum rate needed not only to allow for a constant drill advance rate but also to ensure that the samples did not become too wet in order to avoid expansive clay mineral reactions. Note that no dry coring drill bits could be used. The samples were marked to guide the coring, avoiding natural fractures as much as possible. However, this was not always possible, and many samples were broken during drilling and cutting processes, and even after the drying stages, due to the pre-existence of undetected fractures. Challenges in coring associated with swelling clay minerals were faced in marly (B10 and B11) and argillaceous (B7) limestone blocks. These blocks were excluded from further tests. Other blocks of marly limestone (B1, B2, B3, and B9) emitted cracking sounds and presented fractures expanding along planes as a result of water contact.
Cored samples were prepared for mechanical tests in a cutting machine with a diamond cutoff wheel and holders in accordance with ISRM [39,40] and ASTM [41]. The ends of the cylinders were visually tested to identify any chipped edges, re-passing the surface by the cut-off wheel to ensure the smoothness of the ends. The parallelism of the surface was ensured with the holders of the cutting machine. After cutting, samples were dried in an oven at 105 °C for 24 h [42] and then naturally cooled to avoid any thermal shock (at 20 °C). In total, 97 cored samples for UCS (21) and BTS (76) were obtained. The slender ratio of length to diameter (L/D) were on average 0.48 for BTS (ranging from 0.39 to 0.60) and 2.2 for UCS (ranging from 1.7 to 2.6). In addition, 34 disc-shaped samples were taken from the cutting leftovers for apparent porosity tests.

4.2. Petrophysical Index Tests on Cored Samples

4.2.1. Bulk Density

Tests were performed in accordance with the ISRM [43] procedure for the determination of bulk density via the calliper method. A scale with accuracy of ±0.1 g was used. No tests were conducted in argillaceous limestone as detailed in Section 4.1.3.

4.2.2. Apparent Porosity

Tests were performed in accordance with ASTM [42] and measured the interconnected void volume. Samples were saturated in tap water for 24 h. The additional weight of water (after samples were dried with paper towel) was related to the surface connected void volume. To determine the potential swelling impact of samples, the dimensions of the samples were measured before and after the saturation period, as well as it was ensured that samples had no layering or signs of breakings. Tests were conducted only in offcut samples of micritic limestone (i.e., samples that were too short or had no parallel ends). Marly limestone samples were not tested due to their water sensitivity already observed during the coring process. Other lithologies did not provide sufficient samples to conduct the tests.

4.2.3. Slake Durability Index

A slake durability apparatus (A130, Matest) was used with dried samples [42] submerged in tap water for 2 cycles [44]. The retained fragments were weighted after each cycle. The slake durability index was calculated with the weight of the second cycle, and the final shape of the fragment was described and tabulated in Appendix A.

4.2.4. Wave Velocity

Tests were conducted in the direct (i.e., travel time across the sample between two parallel flat sides, DIR) mode for UCS samples of marly and micritic limestone [38]. Ten readings were taken in the same position for each P-wave and S-wave test, and the average value of those ten readings is reported.

4.3. Mechanical Strength Tests and Critical Crack Thresholds

4.3.1. Tensile Strength Tests

Tensile tests were conducted on two type of PE orientations, performing the tests for the highest tensile strength values according to Dinh et al. [45] for anisotropic rocks. Both PE1 and PE2 tests are illustrated in Figure 3b. No samples of argillaceous limestone were tested, for reasons previously described. The Brazilian test (BTS) method suggested by the ISRM (1978) was used to measure the indirect tensile strength (σt) on a CBR-Marshal 50 kN (Figure 4a) loading machine with a displacement-controlled rate of 0.003 mm/s so that samples failed at between 30 and 60 s. Samples were placed in a curved hardened steel loading jaw to allocate the applied bearing force. During the BTS tests, 34 of the total 58 PA test results were declared invalid because the samples failed along planes of weakness parallel to the main disc face (i.e., vertical fracture between the two bearing points, as Figure 4a shows. The ISRM [39] states that primary failure (i.e., early peak failure in Figure 4a) should be followed by a final failure, with maximum difference of 5%. However, in our tests, this difference was 10% on average, so only 39 out of 76 tests were used to determine the indirect tensile strength.

4.3.2. Uniaxial Compressive Strength (UCS) Tests with Strain Measurement

UCS tests were conducted to determine elastic parameters, critical crack thresholds, and the UCS, in accordance with the ISRM [40]. Strain was measured with strain gauges. The tests were conducted on 16 marly and micritic limestone samples in the PA and PE loading orientations, as shown in Figure 3b. In addition, 5 conducted tests recorded the peak strength only (no strain gauges were attached). Sample surfaces were smoothed, and rock dust was removed to ensure that superglue held the contact between the rock surfaces and strain gauges, which were placed on the central region. Axial (2 × εa) and lateral (2 × εl) average strains were recorded with strain gauges (thermally compensated for steel and with a 10 mm gauge length) at diametrically opposite positions (Figure 4b). For the PE samples, gauge locations were selected to avoid chert nodules (less than 15% of sample size), though they were still vertically centred. The strain gauge data were recorded with an HBM strain gauge bridge amplifier (MX1615B). A CT310 compression machine with a maximum load of 2000 kN was used (Figure 4b) at a loading rate of 0.003 mm/s for all tests so that peak strength could be typically reached between 5 and 10 min in accordance with ISRM [40]. Samples were preloaded to 4 kN to ensure that the plates were in full contact with the rock samples before proceeding with the loading and breaking of samples, as shown in Figure 4c.

4.3.3. Critical Crack Thresholds during UCS Tests and Elastic Properties

The critical crack thresholds during UCS tests comprise several stress stages during the loading process of unconfined samples. As introduced by Martin and Chandler [46], the progression of damage in brittle materials has an initial stress level (i.e., threshold) at which the majority of pre-existing cracks are closed, which is known as crack closure (CC). This is followed by a stress range in which the rock reacts elastically, limited by a second stress threshold called crack initiation (CI). The nonlinear trend in the volumetric strain evolution from this point upwards indicates stress distribution at the grain scale which leads to the formation of new cracks [47,48,49,50,51,52,53]. When cracks start to interact with each other and coalesce, a new threshold is defined as crack damage (CD). Finally, ultimate failure occurs at peak strength defining the UCS.
To date, no international standard (e.g., ISRM, ASTM, or BS) has published a guideline to determine these stress threshold magnitudes. Here, we employed methodologies derived from the works of Brace et al. [47], Latjai [48], Stacey [49], Diederichs [50], and Ghazvinian [51], which are summarised in Table 3. Our CC and CI calculations used the volumetric strain (εv), mathematically defined as the sum of axial strain (εa), and two times the lateral strain (εl) (i.e., mathematically, εv = εa + 2 × εl). The CC value was determined to be the average stress given by the methods of Brace et al. [47] and Latjai [48], which rely on determine the point where the stress–strain evolution changes from non-linear (cracks still closing) to linear (most cracks perpendicular to loading are closed). From this point upward on the stress–strain curve, the CI value was defined as the average value amongst all methods from Table 3. Note that the CD threshold was not included in this characterisation because of the noise in strain data when approaching the peak strength region of the test. The region of the stress–strain curve between CC and CI is known as the elastic region. The average Young’s modulus and Poisson’s ratio were calculated within this elastic region [40].
The elastic properties, the peak strength values and the critical crack stress thresholds are important values for input into numerical models, which can be used to capture past or future rock mass behaviour. This study focused on determining the CI threshold for the Thebes Limestone Formation, not only because these are the first reported values, but also because other studies have indicated the CI threshold is considered a long-term lower bound rock strength value [50,54,55]. Determining this threshold is critical for understanding the long-term behaviour of the cliffs and tombs in the KV and developing preservation strategies that take this into consideration will be essential given the age of the rock cut cliffs and tombs in the area.

5. Geomechanical Behaviour

5.1. Overview

We report in Table 4, Table 5 and Table 6 the thermal and geotechnical properties in terms of number of samples; average, maximum, and minimum values; and standard deviation in Section 5.1. The results are organised by lithology and test orientation (i.e., PA or PE); the marly and micritic limestone results are shown in Table 4, and the argillaceous and silicified limestone results are shown in Table 5 and Table 6. The data are described in Section 5.2. A comparison between these results and published data (Table 1) is undertaken in Section 5.3. Section 5.4 focuses on the strain measurements during UCS tests and the critical crack thresholds.

5.2. Standard Geotechnical Properties

Standard geotechnical tests were conducted on block and cored samples. The average and coefficient of variation (CV) were used to investigate the variability of the test results within each test type and lithology.

5.2.1. Thermal Conductivity and Volumetric Specific Heat

The results for thermal properties are plotted in Figure 5a,b for Thermal Conductivity (k) and Volumetric Specific Heat (Sp). Thermal properties for the silicified and marly limestone samples were measured within existing fractures. The silicified limestone had the highest average value for k (1.44 W/mK), whereas the marly limestone had the second highest average value (1.08 W/mK; CV: 0.1) for PA tests. However, block B10 of the marly limestone had the lowest k (0.76 W/mK) of all blocks, which lowered the reported average k value for this lithology (Table 4). The argillaceous limestone had a range of average values from 1.04 to 1.08 W/mK, with PA values being the highest. The micritic limestone had the lowest average value (PA: 0.70 W/mK; PE: 0.65 W/mK). The highest k value for micritic limestone in the PA test was for B6 (0.84 W/mK), in contrast to the B4 and B5 blocks (0.56 W/mK). For the micritic limestone PE tests, only B4 and B5 were tested.
The Specific Heat results showed that silicified limestone had the highest average value (1.90 MJ/m3K), and the marly limestone had the lowest values (1.04 MJ/m3K), with a wide variability between blocks (CV: 0.25). For the micritic limestone PA tests, the B6 sample had the lowest values (1.1 MJ/m3K) in comparison to block B4 (2.3 MJ/m3K) and B5 (1.47 MJ/m3K) samples. The argillaceous limestone had a lower than 1% difference between the PA and PE tests, with an average of 1.06 MJ/m3K.

5.2.2. P-Wave Velocity Measured by Direct and Indirect Methods in Blocks

As stated in Section 4.1.2, the definitions of the direct (DIR, travel time across the block) and indirect (IND, travel time measured between two transducers located at the same block side) methods are based on BSI [38]. The tests conducted in the DIR mode had a higher wave speed (2.06 km/s) than those in the IND mode (0.85 km/s), which was consistent across the different tested lithologies.
Regarding the DIR tests (Figure 5c), the marly limestone blocks had a wider variability for PA tests (CV: 0.27) than PE tests (CV: 0.16). Block samples for the PA tests seemed to be clustered, e.g., B1, B9, and B10 (0.8 km/s; CV: 0.3) and B2, B3, and B11 (2.4 km/s; CV: 0.2). For the PE tests of the marly limestone samples, B3 had the lowest wave speed (1.8 km/s) in comparison to other blocks (2.6 km/s). The tests for micritic limestone showed higher values for B6 (PE: 2.3 km/s; PA: 3.3 km/s) than for B4 and B5 (PE: 1.3 km/s; PA: 2.3 km/s). The argillaceous limestone block had a difference of 1.3 km/s between PA (2.5 km/s) and PE (1.2 km/s).
Regarding the IND mode (Figure 5d), the marly limestone blocks B2 (1.2 km/s) and B10 (2.17 km/s) had the highest wave speed for PA and PE, respectively. Similarly, the average results were higher for PE (1.05 km/s) than PA (0.75 km/s). The micritic limestone tests in the PA and PE orientations had a similar wave speed of 0.73 km/s, whereas the argillaceous limestone block had a greater wave speed for PA (1.3 km/s) than PE (0.7 km/s).

5.2.3. Apparent Porosity

The Apparent Porosity (nap) tests results showed no difference between the PA and PE orientations (Figure 5e). The micritic limestone had an average of 23.9%, with 5% difference in results between blocks, with the variabilities within B4 (CV:0.14), B5 (CV:0.1), and B6 (CV:0.05) smaller than the marly limestone data.

5.2.4. Bulk Density

The Bulk Density (γb) was measured for UCS and BTS samples. The results are plotted in Figure 5f. All rock units had little variability in their results (CV < 0.1). The silicified limestone had the largest bulk density (2550 kg/m3), as measured in five BTS samples. The marly limestone (2020 kg/m3) and micritic limestone (2060 kg/m3) yielded distinct smaller average values compared to the silicified limestone.

5.2.5. Slake Durability Index

We expressed the results of the Slake Durability Index (Id) in the percentage of retained material within the steel drums after two cycles, as shown in Figure 5g, and we classified the slaking durability according to the work of Franklin and Chandra [44]. Here, the marly limestone blocks had two groups of slaking durability, with average Id results ranking from Extremely High (Id = 98% for B1, B2, and B3) to High (Id = 87% for B9 and B10). The micritic limestone had an Extremely High (Id = 96%) durability, with closely grouped results. A description of retained fragments is provided in Appendix A.

5.2.6. Wave Velocity of Cored Samples

Both P-wave (Vp) and S-wave (Vs) velocities were 30% higher in the PA orientation than in the PE orientation for both marly and micritic limestone. The results by lithology are plotted in Figure 5h,i. For Vp tests, the micritic limestone (PA: 3.22 km/s; PE: 2.20 km/s) had a higher average speed than marly limestone (PA: 2.98 km/s; PE: 2.14 km/s). Smaller differences between PA and PE were measured on average for vs. of micritic limestone (PA: 1.30 km/s; PE: 1.02 km/s) and marly limestone (PA: 1.18 km/s; PE: 1.17 km/s).

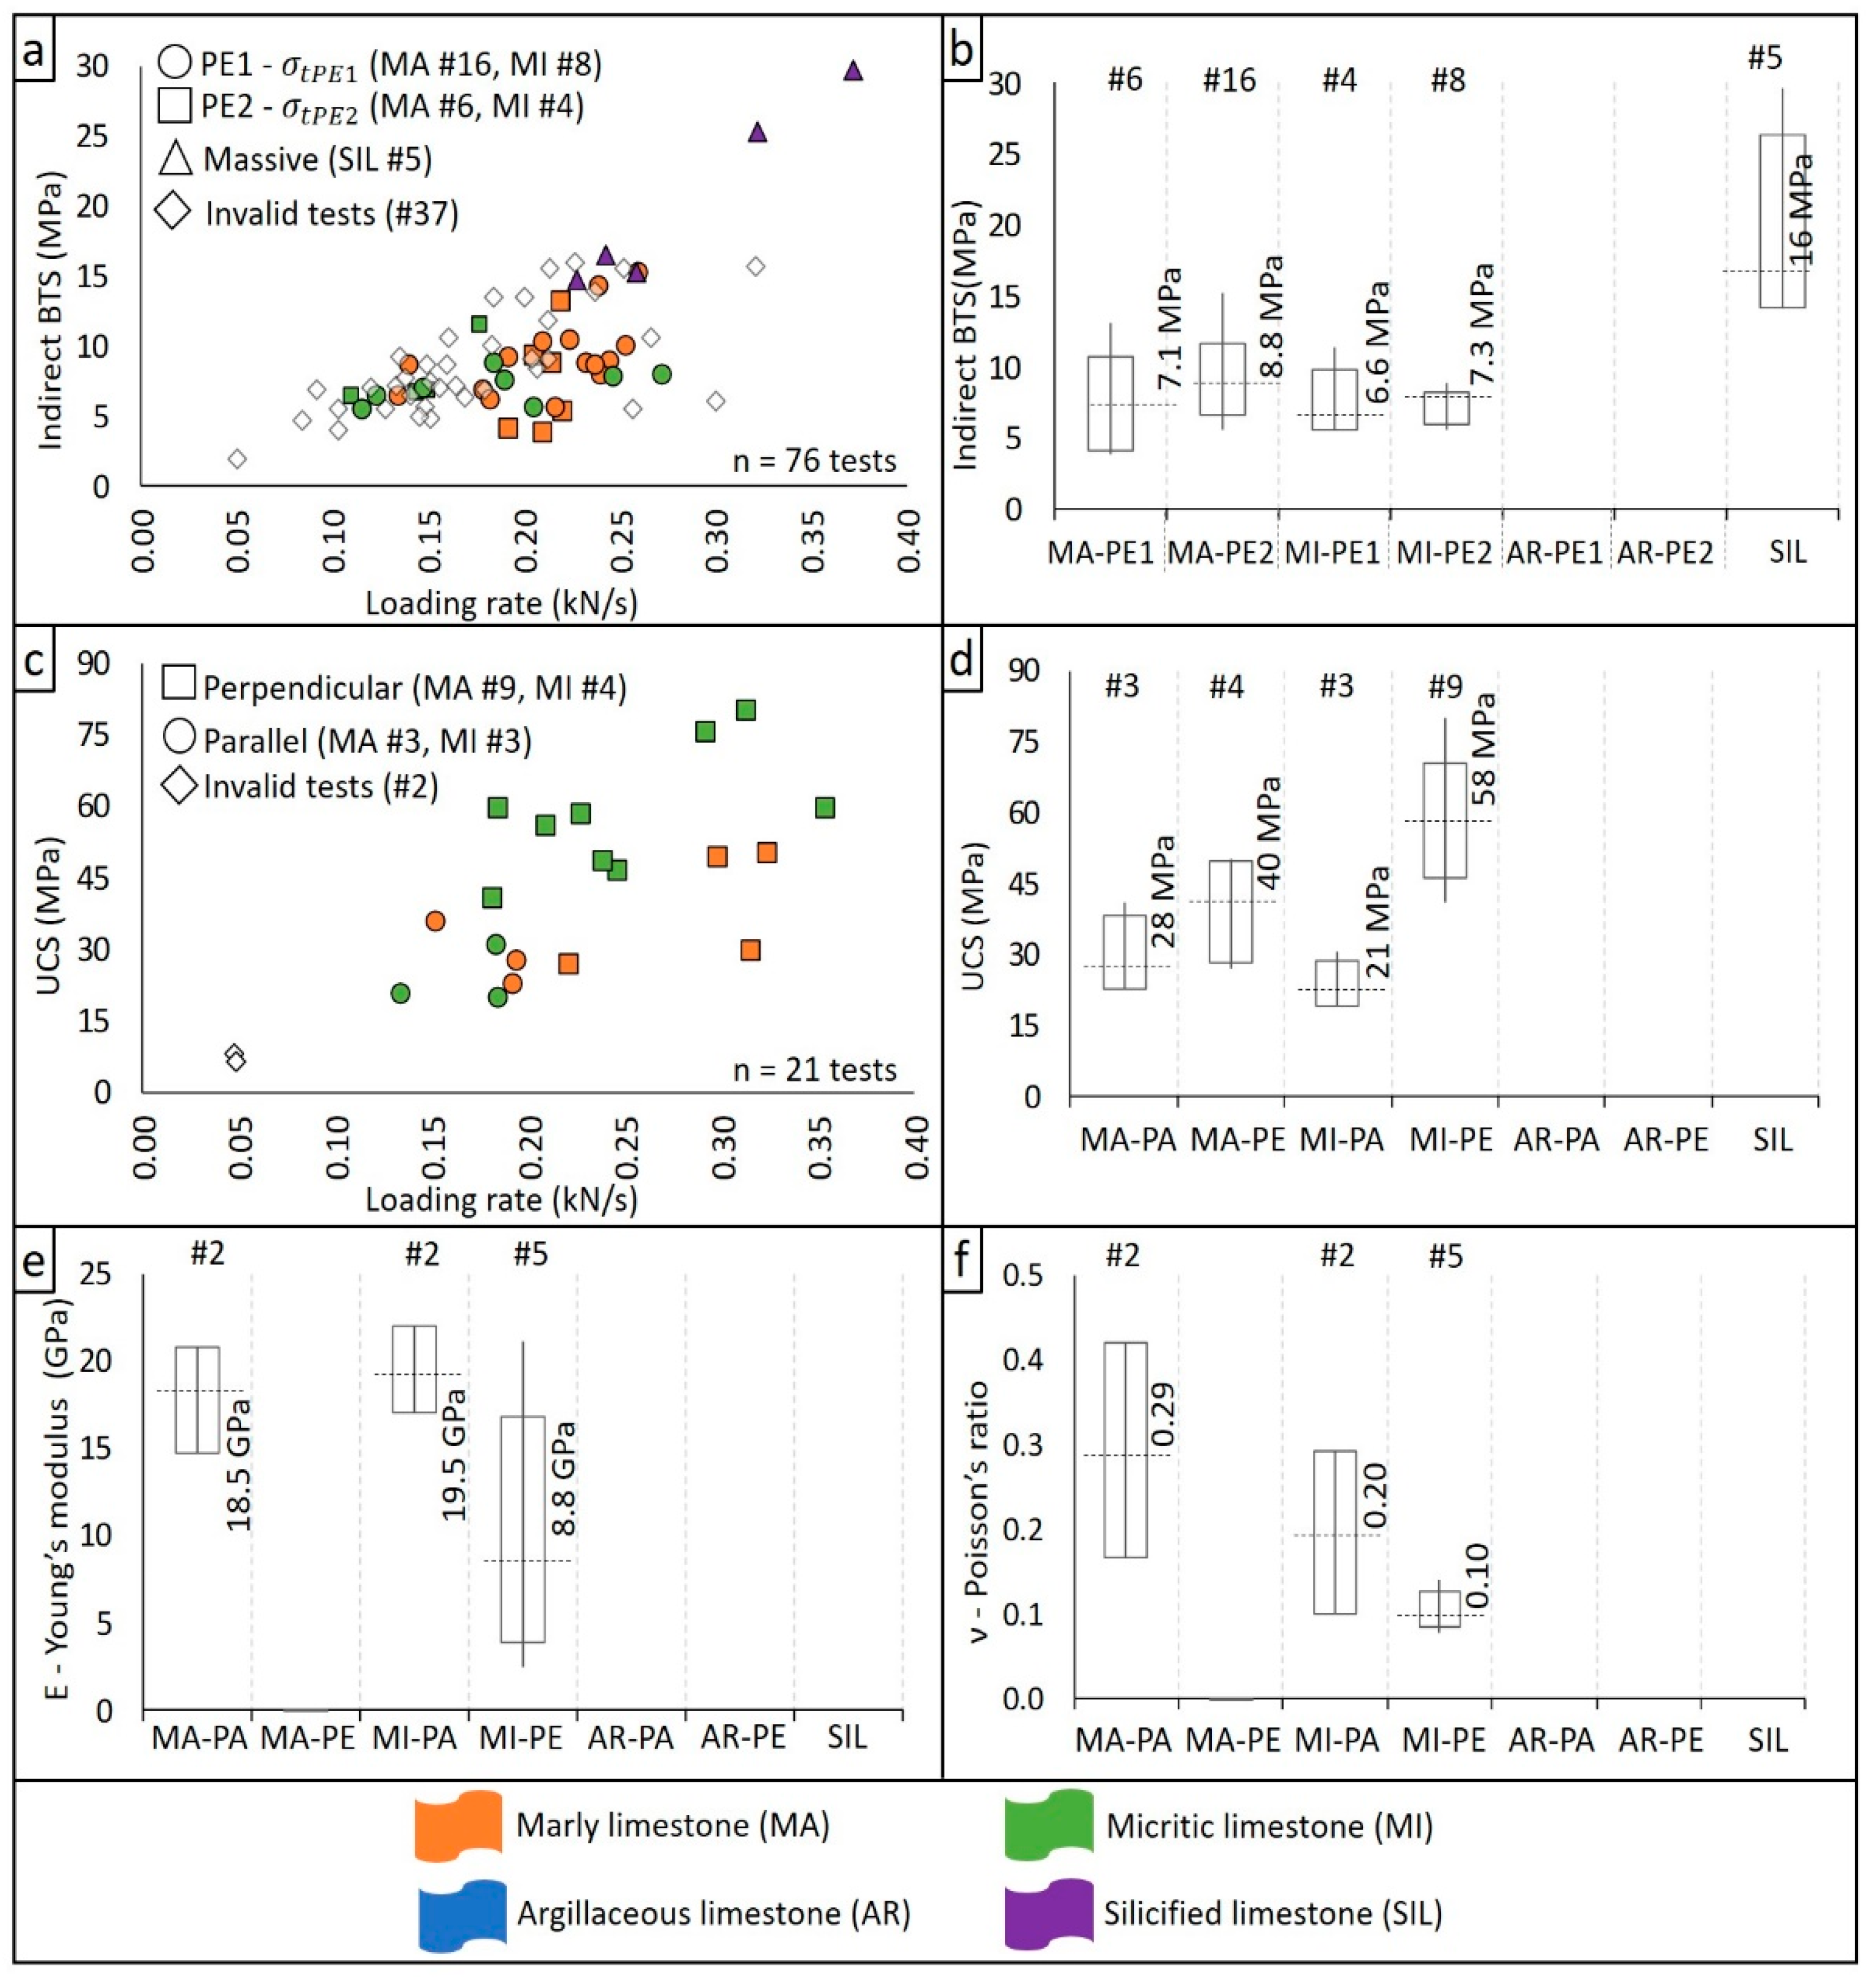
5.2.7. Indirect Tensile StrengthAll indirect tensile strength

All indirect tensile strength (σt) data are plotted in Figure 6a versus loading rate. Invalid tests are included to show how the primary failure was systematically observed along different ranges of stresses. A summary of valid tests is plotted in Figure 6b. Because the loading machine was capable of controlling the displacement rate in mm/s, different loading rates in kN/s resulted in accordance with the stiffness of each rock type. The silicified limestone had the highest loading rate (0.28 kN/s) and σt of on average 20.3 MPa. The marly limestone required a higher loading rate (0.21 kN/s) than the micritic limestone (0.17 kN/s) in both PE1 and PA2 test orientations. For the micritic limestone, the PE1 tests (7.7 MPa) had slightly higher values than the PE2 tests (7.1 MPa). This relates to one BTS sample from B6 that had a σt of 11.4 MPa in PE1 direction, whilst the other PE1 samples (three samples from B5) had an average value of 6.3 MPa. The marly limestone had higher values for the PE2 tests (9.1 MPa) than the PE1 tests (7.4 MPa).

5.2.8. Unconfined Compression Tests, Young’s Modulus and Poisson’s Ratio

The Unconfined compressive strength (UCS) was conducted with an apparatus set to a loading rate of 0.003 mm/s that, based on the stiffness of each rock type, resulted in different loading rates in kN/s. The UCS tests in PE had a higher loading rate (0.26 kN/s) than in PA (0.14 kN/s). This difference was consistent across the different tested lithologies. Two samples of micritic limestone were discarded since they broke at low loading rates (Figure 6c). Therefore, 19 out of 21 tests were used to determine the UCS value, as summarised in Figure 6d. In general, the micritic limestone had a higher UCS (50 MPa) than the marly limestone (35 MPa), for both PA and PE orientations. The highest difference was seen in the PE tests, in which micritic limestone showed on average 58 MPa and the marly limestone had on average 39 MPa. Elastic properties of Young’s modulus (E) and Poisson’s ratio ( υ ) could not be determined for all UCS samples because strains could not always be accurately measured (i.e., no strain gauges or noisy strain signals during tests). Hence, only values from eight samples of micritic limestone (two PA and six PE) and two PA samples of marly limestone can be reported. The results are plotted in Figure 6e,f. The micritic limestone had higher average elastic parameters for PA tests (E: 19.5 GPa; υ: 0.2) than PE tests (E: 10 GPa; υ: 0.1). The marly limestone had the highest υ in PA (0.3) amongst all tests.

5.3. Comparison of Geotechnical Properties with Existing Data

5.3.1. Analysis of Thermal Conductivity and Specific Heat Results

No thermal properties for Member I, Thebes Limestone Formation, were publicly available at the time of this work, so the analysis focuses on limestone rocks from other locations. Physical features such as porosity and density are useful indicators for estimating the degree of compaction of rocks, which is linked to thermal conductivity [56]. For instance, Çanakci et al. [57] tested limestone from Southeast Turkey and found an exponential direct correlation between density and thermal conductivity (k), with a range of k values from 0.8 W/mK to 2.5 W/mK for a range of densities from 1800 kg/m3 to 2400 kg/m3. We observed a range of density from 2000 kg/m3 to 2700 kg/m3 and a range of k from 0.7 W/mK to 1.4 W/mK. Similarly, Robertson [56] reviewed literature values of k for limestone and gathered a database that features a range from 1 W/mK to 2 W/mK and porosity values from 20% to 75%. Our tested samples had an apparent porosity ranging between 13% and 26%, designating the tested samples in the lower band of Robertson’s reported values for k lower than 1 W/mK.
Specific heat is defined as the product between rock bulk density and heat capacity. The values of the heat capacity of rocks are influenced by the mineralogical composition of the rock and the individual heat capacity of its constitutive minerals [58]. Here, the silicified limestone block showed the highest specific heat and density, resulting in the greatest heat capacity of 0.75 kJ/kgK. The heat capacity ranged from 0.5 kJ/kgK to 0.65 kJ/kgK for the marly, micritic, and argillaceous limestones. The literature values of heat capacity for marly and micritic limestones were reported by Kappelmeyer and Haenel [58] as 0.9 kJ/kgK, by Robertson [56] from 0.83 kJ/kgK to 1 kJ/kgK, and by Homuth et al. [59] from 0.6 kJ/kgK to 1.0 kJ/kgK at 20 °C in dry conditions. The differences in values can be attributed to the depth of penetration of the sensors, the degree of weathering of the surfaces, and the amount of clay minerals. It is worth noting that thermal conductivity can almost linearly decrease with temperature in regions below 100 °C [56]. This variation could be neglected in our work since we measured thermal properties in a range of temperature between 15 °C and 20 °C.

5.3.2. Analysis of P-Wave Speed in Blocks

The P-wave speed in blocks (Vpb) results were higher in the PA than PE orientations for most samples. However, the marly limestone Vpb was lower in the PA orientation than the PE orientation, likely because of the existence of closely spaced discontinuities oriented 45° to 90° from bedding planes that reduced the Vpb values for PA (rock discontinuities in Table 2). It was expected that samples had a higher Vpb for the DIR compared to IND tests because of the poorer integrity of the shallow layers of the blocks in contrast to the block’s cores (i.e., blocks were not sampled from fresh rock walls). Likewise, Maissen [22] reported higher values of Vpb in the DIR mode of different samples of marly limestone in the KV for PE (2.95 km/s; CV: 0.17) and PA (3.15 km/s; CV: 0.06). However, Maissen [22] did not report the fracture state of the rock samples to discuss whether the differences were related to the integrity of the samples.

5.3.3. Analysis of Apparent Porosity

The Apparent Porosity (nap) of marly limestone from KV5 was previously presented by Hemeda [20], with values ranging from 14% to 19%, though the author did not refer to a procedure for the calculation. Similarly, Lazar [17] reported values for porosity ranging from 1.1% to 27.5% for 13 samples of marlstone, with an average of 13%. Wüst [18] determined an average of 19.7% for the porosity of eight samples of marl and limestone, with values ranging from 14% to 34.7%. Wüst and Schlüchter [19] examined six samples from KV17 (marlstone and shale), with nap ranging from 15% to 23% (average of 18%). However, none of the authors detailed how they dealt with the water sensitivity of the samples during testing. Based on published data, the results from this research fall within a known range of values, with an average of 18.2% for micritic limestone.

5.3.4. Analysis of Bulk Density

For the Bulk Density ( γ b ), at the Theban Necropolis, Lazar [17] provided information for 13 samples of chalk and marl, with an average value of 2280 kg/m3 ranging from 1950 kg/m3 to 2650 kg/m3. Wüst [18] also indicated a mean value of 2100 kg/m3, with a range of values from 1710 kg/m3 to 2210 kg/m3, tested on eight samples from Wadi Qabbanat el-Gouroud (Figure 1, 2.5 km south of the KV). Wüst and Schlüchter [19] provided density values for six marlstone samples from the KV, with an average value of 2150 kg/m3 (range from 2050 kg/m3 to 2180 kg/m3). Hemeda [20] reported unit weight values of marly limestone for samples from KV5 (unknown number of samples), which ranged from 20 kN/m3 to 21 kN/m3 (i.e., from 2039 kg/m3 to 2141 kg/m3). The results for the marly and micritic limestone altogether ranged from 1650 kg/m3 to 2250 kg/m3, so our results fall within published ranges. For silicified limestone from the KV no values were reported in the literature. However, Manger [60] gave values of density for “hard and dense” Eocene limestone ranging from 2300 kg/m3 to 2700 kg/m3 that had a porosity of around 2% and could be linked to the silicified limestone samples. This provides an upper boundary for the density of silicified limestone, and our results fall within the range.

5.3.5. Analysis of Slake Durability Index

There were no previous slake durability index (Id) data from the KV by the time this research was conducted. The marly limestone blocks B9 and B10 (both from the excavation material of KV17) had a lower Id (87%—High) than other blocks of the same lithology (B1, B2, and B3: 98%—Extremely High), likely related to past flooding events (i.e., natural slaking) since the blocks originating from debris. According to Miscevic and Vlastelica [61], an additional slaking cycle (followed by a drying stage) could reduce the Id by 5% to 10%. The retained fragments after the second cycle, for B9 and B10, were similar to small loose material in angular shape, with larger pieces with cracks on the surface, which differed from the more packed integrity of retained fragments of B1, B2, and B3 (Appendix A). Marly limestone has been found to have a high to very high durability in regions of the Middle East [62,63,64]. Arman et al. [65] also reported a slake durability index value for “soft limestone” (i.e., micritic texture from United Arab Emirates) of about 97%, which aligns with the micritic limestone values from our research.

5.3.6. Analysis of Wave Velocity of Cored Samples

The tests conducted in the PA orientation had wave speeds 40% faster than those conducted in the PE orientation. This difference was consistent across the tested lithologies and similar to what was observed for block samples and bedding plane orientations (see Section 5.2.2). Comparatively, most cored UCS samples had higher wave speeds than those measured in the blocks themselves by about 25%. This could be explained by weathered rims of blocks, fractures and the presence of silica bands in blocks, which were avoided as much as possible during the coring process. From the literature, Lazar [17] reported values from P-wave speed tests in marly and micritic limestone from Wadi el-Machtiar (Figure 1, 2.5 km east of the KV). The tests in the PA orientation (three samples) yielded an average value of 3.32 km/s, ranging from 3.28 km/s to 3.39 km/s, whilst the tests in the PE orientation (three samples) gave on average 2.36 km/s with a range from 2.15 km/s to 2.70 km/s. The results of Lazar [17] were about 0.2 km/s higher than the results of this research, although they state that three unweathered, oriented samples of Member I were taken and having only three samples may have influence the results. A similar coring integrity was targeted in our research (i.e., unweathered). The integrity of the sample (i.e., unaltered cored samples) facilitated the travel of the ultrasonic wave by avoiding weathered areas that would slow the wave down. With more test results in this study, as well as considering the natural variability of geo-materials, small differences from other studies are expected. There was no reported value for S-wave speed in the literature.

5.3.7. Analysis of Indirect Tensile Strength (Brazilian Test Results)

Limited information of Tensile Strength (σt) on aspects such as rock formation, sample integrity, fracturing, and weathering degree was provided in the literature. These parameters must be considered when comparing test results, so the validation of the reported values of this research relied on the procedure suggested by the ISRM [39] under the inherent properties of the samples (other physical properties and rock unit characterisation). It is worth to point out that our samples were tested under the maximum tensile stess capable of withstand in two orientations according to Dihn et al. [45], therefore it might be expected that values from other authors could be lower than the ones from our tests. Furthermore, at the KV, literature values are limited to selected places and few samples. For instance, Aydan et al. [24] mentioned a range from 4.4 to 5.1 MPa for “soft limestone” tested in the tomb 22 at the West Valley (WV22), with no information regarding the number of samples or the mean value. These values were lower than the results presented here for the marly and micritic limestone together, which ranged from 3.9 MPa to 15.3 MPa. Similarly, Dziedzic and Michiewicz [25] reported values of strength in tension for limestone blocks from the temple of Hatshepsut, quarried about 3500 years ago at 3 km north of el-Qurna hill. The tests were conducted as bending tests on beams sampled from the temple, resulting in strength values ranging from 2.7 MPa to 3.4 MPa and an average value of 3 MPa.
Other researchers have conducted analyses of tensile strength at other locations in Egypt, though far from the Theban Necropolis. Ali and Yang [66] tested marly Palaeocene limestone samples collected in Qena (Egypt), and they reported an average value of 5.3 MPa for dense samples (porosity of 7.6% and density of 2450 kg/m3). These results were complemented by Ali and Ahmed [67], who tested the same rock type in the PE orientation to report tensile strength values with an average of 5.5 MPa and a range from 3.9 MPa to 7.7 MPa. Abdelrahman et al. [68] tested limestone from different quarries around the Cairo metropolitan area; the authors gave tensile strengths of 1.9 MPa to 2.5 MPa for three dense samples with porosities of 2.7% to 2.9%, respectively, together with an average density of 2600 kg/m3.

5.3.8. Analysis of Unconfined Compressive Strength

The unconfined compressive strength (UCS) for Thebes Limestone Formation was previously published by Lazar [17], for marly limestone collected from Wadi el-Machtar (Figure 1). The marly limestone average results from Lazar [17] were 35 MPa (ranging from 16 MPa to 47.7 MPa) and 55 MPa (ranging from 22 MPa to 72 MPa) for tests measured in the PA and PE orientations, respectively. Our average UCS results for the marly limestone measured in the PA and PE orientations were 22.6 MPa and 39 MPa, respectively, which is lower than Lazar’s average results. However, our average measured PE to PA ratio for the marly limestone of 1.7 was similar to 1.6 reported by Lazar [17]. For the micritic limestone from our tests, this ratio was 2.4 (PA: 23.8 MPa; PE: 58 MPa).
It is worth mentioning that the variability in published results for the marly limestone is quite wide. For instance, a UCS of 78.2 MPa was reported by Wüst and McLane [21] for one sample of marly limestone from KV17, whereas Hemeda [23] reported a range of values from 8 MPa to 9.3 MPa for seven samples from the interior of tomb KV57. Hemeda [20] reported UCS values for samples from the interior of tomb KV5 as “sidewalls are between 6 MPa and 7 MPa, while the strength of the supporting rock pillar is 1 MPa because of the impact of the past and recent flash floods”, possibly measured in the PA orientation because of the exposure of the bedding planes in the tombs’ walls (i.e., running subparallel to the floor of tunnels and caverns), although the method of measurement was not reported. This could be a good indicator of how prone the marly limestone is to losing strength due to variations in weathering degree (i.e., water contact, for instance). Limited information from similar rock types in other locations across Egypt was available, particularly regarding anisotropy and tests clearly documenting PA and/or PE orientations. For example, UCS tests carried out on marly limestone samples collected at Qena, Egypt, resulted in an average of 74 MPa for dense samples with a porosity of 7.6% and a density of 2450 kg/m3, but the authors did not indicate the orientation of the load and bedding planes [67]. Ali and Ahmed [67] also tested ten samples of marly limestone from Qena, and the reported value of the UCS measured in the PE orientation was 74 MPa, with a range from 54 MPa to 96 MPa. Additionally, Arnold [69] reviewed the properties of Egyptian building stone across Egypt, limiting the type of limestone in an engineering manner based on sample density (from 1700 kg/m3 to 2600 kg/m3), assigning a wide range of UCS values, from 20 to 80 MPa, to porous limestone. The range of values published by Arnold [69] for both density and UCS were similar to the measured properties in this research.

5.3.9. Analysis of Young’s Modulus and Poisson’s Ratio

The average results for Young’s modulus (E) in the present study were higher in the PA (19.5 GPa) than PE orientations (10.3 GPa) for the micritic limestone. Maissen [22] estimated values of 8.2 and 7.3 GPa for block samples measured in the PE and PA orientations, respectively. The author conducted P-wave velocity tests on block samples of marly limestone from the KV and used empirical relationships to determine [22]. These values indicated a slight anisotropy in the elasticity of the rock and substantially lower E for PA samples. Hemeda [20] reported a single value of 10 GPa for the elastic modulus of marly limestone samples from KV5, and Aydan et al. [24] indicated a range from 2 GPa to 10 GPa for “soft limestone” from a WV22 tomb. None other the researchers provided information regarding the number of samples, orientation with respect to the bedding planes, or the type of test method for the modulus.
We found average Poisson’s ratios ( ν ) of 0.2 (PA) and 0.1 (PE) for the micritic limestone. Gercek [70] collected data from several publications to determine a range for limestone from 0.10 to 0.32. The author also discussed the anisotropy (i.e., the transverse isotropy) of other sedimentary rocks (sandstone, claystone, and siltstone) measured with static methods, showing that the ratio between highest and lowest υ for the same sample could vary from 1.2 to 2.3. The micritic limestone from the present study had a ratio of 2, which falls within the reported limits by Gercek [70]. However, this is just a referential comparison because Gercek’s data [70] did not cover the specific tested lithology in the present study. For the marly limestone samples, the literature values did not help in determining an actual range of elastic parameter values because of the lack of testing information. For instance, Abdallah and Helal [26] used a value of 0.21 for limestone samples collected from the Hatshepsut temple, whereas Hemeda [23] reported a range from 0.25 to 0.30 for samples from KV57.

5.4. Analysis of Strain Measurement and Critical Crack Thresholds

5.4.1. Maximum Deformation at the Peak Strength

The samples that were gauged and not used, had signal noise problems near or above CD that resulted in sudden changes in trends (e.g., unforeseen spikes or null values), likely a result of damage to the gauges during sample fracturing and this interfered with the strain characterisation (i.e., to calculate εa and εl). Therefore, 9 out of 16 samples that were measured with strain gauges could be analysed. The resulting stress–strain curves of the marly and micritic limestone are displayed in Figure 7a,b for PA and PE, respectively. The axial strains measured in the PE orientation reached up to six times greater values than those measured in PA (on average PE: 0.78%; PA: 0.13%). For the micritic limestone, the PE tests (5 samples) resulted in axial strains ranging from 0.55% to 1.28%, whereas the PA tests (2 samples) resulted in lower strain values from 0.11% and 0.14%. These differences between PA and PE values for axial deformations can be explained by the orientation of bedding planes with respect to loading direction and failure planes. For instance, in the PA samples, the bedding planes tended to bend, and the strain gauges therefore measured shorter axial deformations. On the other hand, in the PE samples bedding planes compress before failure, which resulted in larger deformations.
Literature values for UCS with strain measurements in cylindrical samples from the KV are limited to Wüst and McLane [21], who measured the axial strain of a marlstone sample from Member I, collected from KV17. The sample was tested in PE, reporting a maximum strain of 0.4% at 78.2 MPa. However, their sample was 50.8 mm in diameter and had a length to diameter ratio (L/D) of 1.26; in contrast, our samples had an average diameter of 43 mm and L/D ratio of 2.43. This may have contributed to a comparatively lower strain. Note that the ISRM [40] suggests a minimum L/D of 2.

5.4.2. Critical Crack Thresholds from UCS Tests

The critical crack thresholds were only characterised in terms of CC and CI because these are essential thresholds that can aid in understanding cracking process and of particular interest the long-term lower bound strength as previously mentioned. In addition, the strain measurements became unreliable due to gauge failure in the region where CD was expected. The results are listed in Table 7. For the CC threshold, the micritic limestone tests conducted in the PA orientation (6.9 MPa) had lower average stress magnitude than those in the PE orientation (12.5 MPa), which was consistent with the UCS value (PA: 25.8 MPa; PE: 56.1 MPa). Thus, when comparing the results in terms of stress magnitude as the ratio of CC to UCS, the PA tests (two samples) and PE tests (five samples) had averages of 0.27 and 0.22, respectively. Similar results were obtained for PA tests in marly limestone, with an average of 0.25. This means that PA-oriented tests had to reach proportionally higher thresholds of stress to achieve the closure of their existing cracks. The average ratio of CI to UCS for the micritic limestone was 0.42 for the PE orientation (ranging from 0.40 to 0.44) and 0.45 for the PA orientation (two samples only: 0.47 and 0.42 each). The marly limestone results (two samples) yielded a ratio of 0.4.
The results of different CI calculation methods are plotted in Figure 8. Even though the average value given by all five methods was summarised for this research in Table 3, one can identify distinct differences in CI values calculated by each method related to the different principles and numerical inputs associated with each method. Overall, for the micritic limestone measured in the PE orientation using the method proposed by Ghazvinian [51] set a general lower bound (0.39), whereas the methods of Latjai [48] and Brace [47] defined an upper boundary (0.45). Values closer to the average CI value (0.41) were calculated by the methods of Stacey [49] and Diederichs [50]. Brace [47], Latjai [48] and Ghazvinian [51] did not use the correlation between deformations; they focused on deformations against stress, which could be useful for isotropic materials. Nevertheless, Brace [47] and Latjai [48] use the lateral strain to seek the CI stress value, which would tend to be overestimated because of the failing mechanism of bedding planes. In fact, Ghazvinian [51] method based on both ε a and ε l could diminish the bias given by the orientation of the test and the strain gauges with respect to the bedding planes. Stacey [49] and Diederichs [50] correlated variations in lateral and axial strains that concern the presence of bedding planes in intact rock. For the PA tests on both marly and micritic limestone, the upper and lower boundaries are not consistent based on any given method. It is worth noting that the PA-oriented tests were highly dependent on the εl magnitude because the strain gauges were placed across the bedding planes and the εl measured was therefore at the highest possible lateral deformation, as opposed to having the gauges in the bedding plane itself. Accordingly, we applied the method of Diederichs [50], who used increments in Poisson’s ratio (i.e., capturing the bulk deformation of the sample) against the stress increments, which resulted in the most centred values.

5.4.3. Comparison of Crack Initiation Threshold to Literature Values

Most authors have found that the CI threshold falls within a wide band ranging from 0.3 to 0.6 of the ratio CI stress to UCS, regardless of the petrophysical properties of the rocks. For sedimentary rocks, Wen et al. [71] tested a group of samples and determined that the ratio of CI to UCS had an average value between 0.45 and 0.65. Meyer [72] studied CI threshold using acoustic emission (AE) analysis and samples of Indiana and Cobourg Limestone, with average results from 0.45 to 0.55. Peng et al. [73] also conducted tests of four different types of limestone from the United States (Indiana Limestone), France (oolithic Malm Limestone), and Israel (Bina Limestone and Nekarot Limestone), reporting an average ratio of CI to UCS of 0.4 (ranging from 0.32 to 0.48). Similarly, Pepe et al. [74] tested sedimentary rocks (limestone with a quartz-calcite-muscovite matrix) and reported a ratio of CI to UCS of 0.49 (ranging from 0.41 to 0.57). Conversely, Ündül et al. [75] reported in biomicritic and nodular limestone with bedding planes, with a CI to UCS ratio of 0.35 (ranging from 0.3 to 0.4), for a group of 23 samples collected in locations near of Istanbul (Turkey); their UCS values were between 53 MPa and 149 MPa. In the present study, the range of values for the ratio of CI to UCS in limestone is between 0.3 to 0.6 and aligns well with previously published ranges. The CI values for marly (PA: 0.4) and micritic (PA: 0.45; PE: 0.42) limestone of Member I from Thebes Formation tested in this research represent the first CI values published to date for this Formation.

6. Discussion

6.1. Quality of Reported Data and Overall Results

The examination of the available literature and the analysis of results from Section 5.2 suggest that sample description and standardised tests have been scarcely reported so far. This poses a challenge for data comparison and validation and if literature values were to be used, e.g., in rock-mechanical calculations. In particular, the use of standard testing procedures (international or other) should be well documented in future testing programs. To the authors’ knowledge, this study presents the first documentation of thermal properties and critical crack threshold (i.e., CC and CI) for the KV, and data of these properties could be used in the study of environmental fluctuations inside tombs with rock wall cracking in the KV, such as the continuing research carried out by Alcaino-Olivares et al. [13], Hemeda [23] and Khalil [76].
Any rock sampling and testing program within the KV represents a rare opportunity due to the restrictions imposed by the Egyptian authorities to preserve this UNESCO World Heritage site. In order to expand the database of properties for the Thebes Limestone Formation, sample collection should also be performed in a rigorous manner not only to document the location of the samples but also to consider the samples’ time history to ensure that samples that are compared underwent similar environmental processes (e.g., wetting and drying cycles, thermal fluctuations). Ideally, the structure of collected samples and their state in terms of microdamage related to, e.g., thermal fatigue or swelling processes should be assessed with microscopic or computer tomography analyses. For instance, the marly limestone tested in this work was classified as water sensitive as part of the rock classification in Table 2, however no dry coring was available during the testing program. Although the water used was minimised to ensure the core drilling and the integrity of the sample, whilst those samples severely affected by the water were not considered in the tests. In addition, other techniques for determining the porosity (e.g., total porosity measurements) could have been used to avoid the water in contact with samples, although the method used in this research fit the availability of equipment at the time of the testing program. Furthermore, the rock block descriptions detail the macroscopic features and heterogeneity (e.g., fractures perpendicular to bedding planes, presence of silica nodules and bands, and clay minerals) of the blocks that were cored to take our samples from, to ensure that large features could be avoided during the core sampling processes, so that the results represent the intact rocks parameters, which can be compared well with each other. Comprehensive sample descriptions are important to document in order to continue to build a reliable database of engineering properties within the KV.

6.2. Petrophysical and Mechanical Properties

Bedded sedimentary rocks typically exhibit anisotropic petrophysical and mechanical properties [77]. In this testing program, special attention was paid to the orientation of bedding planes, quantifying the degree of anisotropy and its effect on the strength of the marly and micritic limestone. Two criteria were applied: the ratio of UCS PA to PE (the Rc index of Ramamurthy [78]) and the transversely isotropic elastic constants (the n index of Kwasniewski [79]). The latter was only applied to the micritic limestone, because no valid tests and elastic parameters could be obtained for the PE samples of the marly limestone. Ramamurthy’s [78] criterion classifies marly limestone as fairly anisotropic (i.e., Rc = 1.3). Micritic limestone is classified with index values from medium (i.e., Rc = 2.4) to low anisotropic (i.e., n = 2.1) using both methods. Hence, both lithologies exhibit a transversely isotropic stress–strain behaviour.
As part of the literature background, it was described that water in contact with Member I is a concern for the rock behaviour (i.e., because of nature of water-sensitive clay minerals, also known as ISRo). In spite of our focus in this research was on dry mechanical tests, the slake durability results (Id) could provide valuable information on the water sensitivity of the samples. The marly limestone was classified as highly durable, whereas the micritic limestone yielded an extremely high slake resistance according to Franklin and Chandra [44]. The lower slake resistance for the marly limestone than micrict limestone relates to the large percentages of ISRo minerals reported to this unit [16]. The effects of the ISRo relate to the marly limestone features observed in the retained fragments, such as layer expansion, surface cracks, and cavities in large edgeless pieces when the rocks were submerged in water. Small fragments (>2 mm) were long and thin sheet-like pieces. The micritic limestone retained fragments were more rounded and polished, and no small chips or slabs were seen as a result of water intake and mineral expansion. Furthermore, the characteristics of the retained fragments support the observation that the slaking durability reflects the strength of sedimentary rocks. Some authors have suggested that the lower the Id, the lower the UCS [80,81], which aligns with our findings (i.e., marly limestone had both the lowest Id and UCS). Nevertheless, progressive exposure to slaking cycles and the loss of strength has not yet been studied for Member I, which could help to understand the impacts of flooding events on tomb wall stability.
Several authors have suggested that the variability in the mechanical response under loads relates to both rock petrophysical properties and the degree of intact anisotropy [82,83]. Various geotechnical properties of marly and micritic limestone are compared in scatter plots in Figure 9 in order to illustrate the variability. The discussion in terms of petrophysical properties is based on the reported Vp values. For instance, a transverse isotropic behaviour can be seen when plotting UCS against Vp (Figure 9a). The anisotropy relates to the nature of bedding planes, as tested by other authors [17,18,21,23]. This causes the reduction in wave speed for PE tests, in comparisson to PA tests, because of samples are less continuous cross the planes, whereas the Vp for PA tests, the bedding acted as a path for the ultrasonic waves, thereby increasing the wave speed over the PE samples. This difference was highlighted by Xue et al. [84] in their tests in the PE orientation, which withstood higher strains and resulted in higher strengths than in the PA orientations.
For the crack initiation (Figure 9b) and elastic parameters (Figure 9c,d), both the PA and PE orientations followed trends reported in the literature [53,85,86]. The CI threshold showed that data for all PE and PA followed a linear relationship (R2 = 0.99), with a slope (i.e., ratio of CI to UCS) of 0.42. This CI/UCS ratio was within the typical limits of 0.3–0.5 [53], and the data of the CI/UCS ratio (shown in Figure 8) showed little influence of the bedding orientation. The elastic stiffness (E) and peak stress (UCS) are plotted in Figure 9c. The upper and lower boundaries are defined by the ratio of E to UCS of published data, also known as the modulus ratio (MR) [84]. All tests had an average MR of 393, which is close to the mean value proposed by Deere [87] for limestone and dolomites (MR = 420) and Palmström and Singh [88] for limestones (MR = 441). The PE-oriented tests yielded a mean MR value of 171 (ranging from 61 to 279), whilst the PA orientation MR values were 679 (ranging from 391 to 817). Hoek and Diederichs [85] pointed out that higher values of MR are expected when force occurs in the PA orientation than in the PE orientation, as seen in our results due to the transverse isotropy of the rocks. In fact, only the PA orientation met the proposed range of MR for micritic/sparitic limestone from 400 to 1000, as reported by Hoek and Diederichs [85]. The PE results fall below the lowest boundary though remained within the broad range from 100 to 1000 for limestone literature values [84,87,88,89]. To address the broad range MR values in the literature, Palchik [86] tested and compiled information for a large number of carbonate sedimentary units from Israel (limestone amongst them), defining a dependency of the MR to the maximum axial strain. The proposed correlation from Palchik [86] aligned well with the results presented here, with an R2 = 0.8, as shown in Figure 9d (dashed line). The maximum axial strain of our test results indicates a clear distinction between bedding orientations, though it appeared to be independent of lithology in the current study.
In rock engineering projects, mechanical properties are used in empirical design criteria or in numerical models as inputs into failure criteria. The definition of a failure criteria becomes more complex when the loads originate from a combination of different sources (e.g., gravitational, thermal, and hydraulic). For instance, Woodman et al. [90] studied the thermomechanical loading of intact samples of sedimentary isotropic rocks (sandstone) at temperatures lower than 100 °C by triaxial tests and numerical models. The authors found a reduction of up to 15% of the peak strength with increasing temperatures from 20 to 100 °C, and the effect of localised thermal stresses triggered tensile micro cracks that contributed to a reduction in strength. Woodman [91] pointed out that this process is delayed when structures (e.g., beddings or natural fractures) exist in the samples, since thermal expansion of discontinuities causes thermal closure, and intact material failure resumes after the maximum closure of the discontinuities is achieved. This idea is supported by the work of Marmoni et al. [92], who studied the thermomechanical fluctuations in rock slopes. The authors found that discontinuities interrupt the heat transfer process, dissipating heat or dilate the discontinuities planes. In particular to KV, the water incidence has been pointed out as one of the biggest challenges when dealing with Member I Thebes Formation, particularly for our marly limestone samples, and its swelling and shrinking cycles have largely affected the landscape and the rock-cut constructions in KV, which according to several authors is one of the main hazards in the area [5,6,21,23,76]. Therefore, the integration of different loads and strength-degradating factors to anisotropic rocks could provide a more realistic assessment of the stability of the rock masses. Such considerations are necessary in real-world scenarios, such as the study of the decorated tombs in the Theban Necropolis [6,21], the stability of cliffs surrounding the KV [13], and other sites worldwide [92,93,94]. Future testing should include both the petrophysical and mechanical properties, with particular attention paid to degree of weathering, clay minerology and its influence on swelling, as well as anisotropic and thermal influences.

7. Conclusions

A characterisation of the intact anisotropic rock properties of limestones collected from the Valley of the Kings is presented in this article. A testing program was conducted to develop a comprehensive set of numerical model input parameters and to benefit geotechnical work in the KV for future preservation measures of this UNESCO World Heritage site. We highlight this unique opportunity of sampling rocks inside the KV. To our knowledge, this work represents not only the first exhaustive documentation of intact rock properties for the marly and micritic limestone from the Member I of the Thebes Limestone Formation but also provides a first analysis of crack initial thresholds, which are important properties for long-term stability considerations. Our findings are compared to the limited information in the literature regarding the Thebes Limestone Formation.
The geotechnical properties were measured parallel (PA) and perpendicular (PE) with respect to the bedding planes. The marly and micritic limestone exhibit transverse isotropic strength behaviour, with the bedding plane acting as an isotropic plane, typical of sedimentary rocks. The results of UCS tests show that the micritic limestone average strength for PA orientation is 24 MPa, whilst PE tests are 58 MPa. According to the classification set by Ramamurthy [78], the rock unit has a low anisotropy. Similarly, the marly limestone samples had an average strength of 30 MPa for PA tests and 39 MPa tests, classified as fairly anisotropic, based on similar criterion. Elastic constants also vary in the PA and PE orientations. We also classified the anisotropy of the micritic limestone samples using an approach based on elastic constants formulated by Kwasniewski (1984), where the Young’s modulus (E) measured in PA tests are 20 GPa, whilst PE tests showed 10 GPa. The Poisson’s ratio (ν) values are 0.2 for PA tests and 0.1 for PE tests. This suggests a medium intact anisotropy of the micritic limestone [79]. The volumetric strain (i.e., combination of lateral and axial strains) approach was preferred to avoid biased results because of bedding plane splitting gauges and/or causing erratic lateral strain readings. This is suggested for any intact anisotropic rock testing program. Accordingly, the CI threshold showed that the CI values for the marly limestone are 14 MPa for PA tests, and the micritic limestone for PA tests is 11 MPa and PE tests is 24 MPa. Both rock types fall within published values, typically expressed as the ratio of CI to UCS (e.g., 0.36–0.52). The average value of PA and PE samples were 0.43 and 0.42, respectively.
Robust geotechnical properties that include rock anisotropy and lower strength thresholds, i.e., CI values, are essential for providing rock engineering solutions through empirical, analytical, and important numerical modelling approaches. In particular, for anisotropic rocks, the stiffness of different composing layers can guide the mode of failure such as the development of axial fractures and local shearing along bedding planes. The intact rock properties described in this paper will be used at the rock mass scale to numerically model cliffs and tombs in the KV to better understand deformation measurements collected by the authors that could be related to damage progression over long period of time. There is potential to validate a failure criterion for long-term stability assessments, which can incorporate the CI threshold. The application of these results will lead to new insights regarding anisotropic rock mass behaviour and long-term stability, which in turn will help develop a better understanding of other influencing factors on the stability of cliffs and tombs in the KV, ultimately leading to better preservation approaches for this rich UNESCO World Heritage site.

Author Contributions

Conceptualisation, R.A.-O., M.Z. and M.P.; Data curation, R.A.-O. and M.P.; Formal analysis, R.A.-O., M.Z., H.I. and M.P.; Funding acquisition, M.P.; Investigation, R.A.-O., M.Z. and M.P.; Methodology, R.A.-O., M.Z. and M.P.; Project administration, S.B.; Resources, H.I.; Writing—original draft, R.A.-O.; Writing—review and editing, R.A.-O., M.Z., K.L., H.I., S.B. and M.P. All authors have read and agreed to the published version of the manuscript.

Funding

This research was funded by Natural Sciences and Engineering Research Council of Canada (NSERC) through Discovery Grant program [RGPIN-2018-05918] and in part by funding from the Government of Canada’s New Frontiers in Research Fund (NFRF), [NFRF-2020-00893].

Institutional Review Board Statement

Not applicable.

Informed Consent Statement

Not applicable.

Acknowledgments

The authors express their gratitude to the University of Basel Kings’ Valley Project and project Life Histories of Theban Tombs (SNF grant number 162967) for their contribution and interest in this research. We particularly thank Andrea Loprieno-Gnirs, Elina Paulin-Grothe, and Nadine Schönhütte for their great support as well as the Permanent Committee of the Supreme Council of Antiquities in Cairo for permission to carry out the work at the site. Mahmoud Ibrahim kindly assisted in the administrative planning of our field seasons, and Rais Abd el-Hamid Oman provided on-site technical and logistic support. We also thank Jasmin Maissen and Marija Lukovic for helping collect samples in the KV as well as Ali Ismail for his operational assistantship while conducting tests in South Valley University. Finally, we acknowledge the assistance from York University in our field campaign administrative matters, and the support from the Geological Institute of ETH Zurich.

Conflicts of Interest

The authors declare no conflict of interest. The funders had no role in the design of the study; in the collection, analyses, or interpretation of data; in the writing of the manuscript, or in the decision to publish the results.

Abbreviations

ARArgillaceous limestone
ASTMAmerican Society for Testing and Materials
AVG.Average
BSIBritish Standard Institution
BTSBrazilian tensile strength
CCCrack closure threshold
CICrack initiation threshold
CDCrack damage threshold
CVCoefficient of variation
DIRDirect transmission
EYoung’s modulus
IdSlake-durability index
INDIndirect transmission
ISRMInternational Society of Rock Mechanics
KVValley of the Kings
KV42Tomb KV42 in the Valley of the Kings
MAMarly limestone
MIMicritic limestone
PAOrientation parallel to rock bedding
PEOrientation perpendicular to rock bedding
SILSilicified limestone
VpUltrasonic measured compression (primary) wave velocity
VsUltrasonic measured shear wave velocity
UCSUniaxial compressive strength
υPoisson’s ratio
εStrain (subscript: a—axial, l—lateral, v—volumetric)
σStress (subscript: t—tensile)

Appendix A

Figure A1. Slake durability tests. Original tested subsamples and retained fragments after the second cycle of slaking. Description of retained fragments have been added along with differentiation by blocks and lithology. There were no differences in colour between samples, though pictures were taken at different light intensities.
Geotechnics 02 00040 g0a1

References

  1. Theban Mapping Project. 2005. Available online: www.chnm.gmu.edu (accessed on 19 January 2019).
  2. Hemeda, S. Geotechnical modelling of the climate change impact on world heritage properties in Alexandria, Egypt. Herit Sci. 2021, 9, 73. [Google Scholar] [CrossRef]
  3. Sesana, E.; Gagnon, A.S.; Ciantelli, C.; Cassar, J.; Hughes, J.J. Climate change impacts on cultural heritage. Wiley Interdiscip. Rev. Clim. Change 2021, 12, e710. [Google Scholar] [CrossRef]
  4. Bakun-Mazor, D.; Hatzor, Y.H.; Glaser, S.D.; Santamarina, J.C. Thermally vs. seismically induced block displacements in Masada rock slopes. Int. J. Rock Mech. Min. Sci. 2013, 61, 196–211. [Google Scholar]
  5. Rutherford, J.B. Geotechnical causes of ancient tomb damage: Valley of the Kings, Egypt. In Proceedings of the Symposium on Geotechnical Aspects of Restoration Works on Infrastructure and Monuments, Bangkok, Thailand, 3–6 December 1988. [Google Scholar]
  6. Hamada, M.; Aydan, O.; Tano, H. A report on environmental and Rock Mechanical Investigations for the Conservation Project in the Royal Tomb of Amenophis III. In Conservation of the Wall Paintings in the Royal Tomb of Amenophis III–First and Second Phases Report; Waseda University: Tokyo, Japan, 2004; pp. 83–138. [Google Scholar]
  7. Tawfik, H.A.; Zahran, E.K.; Abdel-Hameed, A.T.; Maejima, W. Mineralogy, petrography, and biostratigraphy of the Lower Eocene succession at Gebel El-Qurn, West Luxor, Southern Egypt. Arab. J. Geosci. 2011, 4, 517–534. [Google Scholar] [CrossRef]
  8. Dupuis, C.; Aubry, M.P.; King, C.; Knox, R.W.B.; Berggren, W.A.; Youssef, M.; Galal, W.F.; Roche, M. Genesis and geometry of tilted blocks in the Theban Hills, near Luxor (Upper Egypt). J. Afr. Earth Sci. 2011, 61, 245–267. [Google Scholar] [CrossRef]
  9. Aubry, M.P.; Berggren, W.A.; Dupuis, C.; Ghaly, H.; Ward, D.; King, C.; Knox, R.W.O.B.; Ouda, K.; Youssef, M.; Galal, W.F. Pharaonic necrostratigraphy: A review of geological and archaeological studies in the Theban Necropolis, Luxor, West Bank, Egypt. Terra Nova 2009, 21, 237–256. [Google Scholar] [CrossRef]
  10. Bardají, T.; Martínez-Graña, A.; Sánchez-Moral, S.; Pethen, H.; García-González, D.; Cuezva, S.; Cañaveras, J.C.; Jiménez-Higueras, A. Geomorphology of Dra Abu el-Naga (Egypt): The basis of the funerary sacred landscape. J. Afr. Earth Sci. 2017, 131, 233–250. [Google Scholar] [CrossRef]
  11. Ziegler, M.; Colldeweih, R.; Wolter, A.; Loprieno-Gnirs, A. Rock mass quality and preliminary analysis of the stability of ancient rock-cut Theban tombs at Sheikh ‘Abd el-Qurna, Egypt. Bull. Eng. Geol. Environ. 2019, 78, 6179–6205. [Google Scholar] [CrossRef]
  12. The Kings’ Valley Project. 2017. Available online: www.kv64.ch (accessed on 20 April 2020).
  13. Alcaíno-Olivares, R.; Perras, M.A.; Ziegler, M.; Leith, K. Thermo-Mechanical Cliff Stability at Tomb KV42 in the Valley of the Kings, Egypt. In WLF 2020: Understanding and Reducing Landslide Disaster Risk; Sassa, K., Mikoš, M., Sassa, S., Bobrowsky, P.T., Takara, K., Dang, K., Eds.; ICL Contribution to Landslide Disaster Risk Reduction; Springer: Cham, Switzerland, 2020. [Google Scholar] [CrossRef]
  14. Lukovic, M.; Ziegler, M.; Aaron, J.; Perras, M.A. Rockfall susceptibility and runout in the Valley of the Kings. In Natural Hazards; Springer: Berlin, Germany, 2021; pp. 1–35. [Google Scholar]
  15. Said, R. The Geology of Egypt; Routledge: Abingdon, UK, 1990. [Google Scholar]
  16. King, C.; Dupuis, C.; Aubry, M.P.; Berggren, W.A.; Robert, O.B.K.; Galal, W.F.; Baele, J.M. Anatomy of a mountain: The Thebes Limestone Formation (Lower Eocene) at Gebel Gurnah, Luxor, Nile Valley, Upper Egypt. J. Afr. Earth Sci. 2017, 136, 61–108. [Google Scholar] [CrossRef]
  17. Lazar, J. Geologisch-Geotechnische Untursuchungen im Thebanischen Gebirge, Teil Nord, Luxor, Agypten. Master’s Thesis, University of Bern, Bern, Switzerland, 1995. [Google Scholar]
  18. Wüst, R. Geologisch-Geotechnische Untersuchungen im Thebanischen Gebirge, Teil Sud, Luxor, Agypten. Master’s Thesis, University of Bern, Bern, Switzerland, 1995. [Google Scholar]
  19. Wüst, R.A.; Schlüchter, C. The origin of soluble salts in rocks of the Thebes mountains, Egypt: The damage potential to ancient Egyptian wall art. J. Archaeol. Sci. 2000, 27, 1161–1172. [Google Scholar] [CrossRef]
  20. Hemeda, S. Engineering failure analysis and design of support system for ancient Egyptian monuments in Valley of the Kings, Luxor, Egypt. Geoenviron. Disasters 2018, 5, 126–158. [Google Scholar] [CrossRef]
  21. Wüst, R.A.; McLane, J. Rock deterioration in the royal tomb of Seti I, Valley of the Kings, Luxor, Egypt. Eng. Geol. 2000, 58, 163–190. [Google Scholar] [CrossRef]
  22. Maissen, J. The Fractured Rock Cliff above KV42, Valley of the Kings, Egypt. Master’s Thesis, Swiss Federal Institute of Technology Zurich, Zürich, Switzerland, 2019. [Google Scholar]
  23. Hemeda, S. Geo-environmental monitoring and 3D finite elements stability analysis for site investigation of underground monuments. Horemheb tomb (KV57), Luxor, Egypt. Herit. Sci. 2021, 9, 17. [Google Scholar] [CrossRef]
  24. Aydan, Ö.; Tano, H.; Geniş, M.; Sakamoto, I.; Hamada, M.; Yoshimura, S. Environmental and rock mechanics investigations for the restoration of the tomb of Amenophis III. In Proceedings of the Japan–Egypt Joint Symposium New Horizons in Geotechnical and Geoenvironmental Engineering, Tanta, Egypt, 15–17 September 2018. [Google Scholar]
  25. Dziedzic, T.; Michiewicz, M. Research of the Theban limestone: The case of Temple of Hatshepsut in Deir el-Bahari. E3S Web Conf. 2018, 49, 1–9. [Google Scholar] [CrossRef]
  26. Abdallah, T.; Helal, H. Risk evaluation of rock mass sliding in El-Deir El-Bahary valley, Luxor, Egypt. Bull. Int. Assoc. Eng. Geol. 1990, 42, 3–9. [Google Scholar] [CrossRef]
  27. Ayman, H. Re-Excavation of Seti First Tomb, Kv17, Luxor, Egypt. Int. J. Conserv. Sci. 2013, 4, 433–446. [Google Scholar]
  28. Abdellah, M.Y.; Gelany, A.F.; Mohamed, A.F.; Khoshaim, A.B. Protection of limestone coated with different polymeric materials. Am. J. Mech. Eng 2017, 5, 51–57. [Google Scholar] [CrossRef]
  29. Mohamed, A.E.E.A.; El-Hadidy, M.; Deif, A.; Elenean, K.A. Seismic hazard studies in Egypt. NRIAG J. Astron. Geophys. 2012, 1, 119–140. [Google Scholar] [CrossRef]
  30. Conoco, Inc. Stratigraphic Lexicon and Explanatory Notes to the Geological Map of Egypt, 1: 500000; The Egyptian petroleum Co-operation: Cairo, Egypt, 1986. [Google Scholar]
  31. Cross, S.W. The Hydrology of the Valley of the Kings. J. Egypt. Archaeol. 2008, 94, 303–310. [Google Scholar] [CrossRef]
  32. Google Earth Pro. Valley of the Kings 25°44′ 24.5” N, 32°36′ 05” E, Elevation 175 m. Terrain Layer. Imagery Date 11/02/2018. 2021. Available online: http://www.earth.google.com (accessed on 15 March 2021).
  33. El Salam, M.E. Construction of underground works and tunnels in ancient Egypt. Tunn. Undergr. Space Technol. 2002, 17, 295–304. [Google Scholar] [CrossRef]
  34. Gelany, A.F.; Abu Zeid, M.M.; Abd El-Sadek, M.S.; Mansour, A.M. Evaluation of the Expansive Esna Shale and Its Role in the Deterioration of Heritage Buildings at West Bank of Luxor. J. Geosci. Environ. Prot. 2019, 7, 24–37. [Google Scholar] [CrossRef] [Green Version]
  35. Wang, C.; Zou, X.; Liu, H.; Chen, T.; Suib, S.L.; Chen, D.; Xie, J.; Li, M.; Sun, F. A highly efficient catalyst of palygorskite-supported manganese oxide for formaldehyde oxidation at ambient and low temperature: Performance, mechanism and reaction kinetics. Appl. Surf. Sci. 2019, 486, 420–430. [Google Scholar] [CrossRef]
  36. British Standard Institution. BS5930:2015; Code of Practice for Ground Investigations. BSI: London, UK, 2015.
  37. Decagon Devices Inc. KD2 Pro Thermal Properties Analyzer, Operator’s Manual; Pullman: Washington, DC, USA, 2015. [Google Scholar]
  38. British Standard Institution. BS1881-203:1986; Recommendation for Measurement of Velocity of Ultrasonic Pulses in Concrete. BSI: London, UK, 1986.
  39. International Society of Rock Mechanics. Suggested methods for determining tensile strength of rock materials. Int. J. Rock Mech. Min. Sci. 1978, 15, 99–103. [Google Scholar] [CrossRef]
  40. International Society of Rock Mechanics. Suggested methods for determining the uniaxial compressive strength and deformability of rock materials. Int. J. Rock Mech. Min. Sci. 1979, 16, 138–140. [Google Scholar] [CrossRef]
  41. American Society for Testing and Materials. ASTM D4543-08; Standard Practice for Preparing Rock Core Samples and Determining Dimensional and Shape Tolerances. ASTM: West Conshohocken, PA, USA, 2008.
  42. American Society for Testing and Materials. ASTM D2216-10; Standard Test Methods for Laboratory Determination of Water (Moisture) Contents of Soil and Rock by Mass. ASTM: West Conshohocken, PA, USA, 2010.
  43. International Society of Rock Mechanics. Suggested methods for determining water content, porosity, absorption and related properties and swelling and slake-durability index properties. Int. J. Rock Mech. Min. Sci. 1977, 16, 143–156. [Google Scholar]
  44. Franklin, J.A.; Chandra, R. The slake-durability test. Int. J. Rock Mech. Min. Sci. Geomech. 1972, 9, 325–328. [Google Scholar] [CrossRef]
  45. Dinh, Q.; Konietzky, H.; Herbest, M. Brazilian tensile strength tests on some anisotropic rocks. Int. J. Rock Mech. Rock Sci. 2013, 58, 1–7. [Google Scholar]
  46. Martin, C.D.; Chandler, N.A. The progressive fracture of Lac du Bonnet granite. Int. J. Rock Mech. Min. Sci. Geomech. Abstr. 1994, 3, 643–659. [Google Scholar] [CrossRef]
  47. Brace, W.F.; Paulding, B.W., Jr.; Scholz, C.H. Dilatancy in the fracture of crystalline rocks. J. Geophys. Res. 1966, 71, 3939–3953. [Google Scholar] [CrossRef]
  48. Lajtai, E.Z. Brittle fracture in compression. Int. J. Fract. 1974, 10, 525–536. [Google Scholar] [CrossRef]
  49. Stacey, T.R. A simple extension strain criterion for fracture of brittle rock. Int. J. Rock Mech. Min. Sci. Geomech. Abstr. 1981, 18, 469–474. [Google Scholar] [CrossRef]
  50. Diederichs, M.S. The 2003 CGS Geocolloquium address: Damage and spalling prediction criteria for deep tunnelling. Can. Geotech. J. 2007, 44, 1082–1116. [Google Scholar] [CrossRef]
  51. Ghazvinian, E. Modelling and Testing Strategies for Brittle Fracture Simulation in Crystalline Rock Samples. Master’s Thesis, Queen’s University, Kingston, ON, Canada, 2010. [Google Scholar]
  52. Nicksiar, M. Effective Parameters on Crack Initiation Stress in Low Porosity Rocks. Ph.D. Thesis, University of Alberta, Edmonton, AB, Canada, 2013. [Google Scholar]
  53. Perras, M.A.; Diederichs, M.S. A review of the tensile strength of rock: Concepts and testing. Geotech. Geol Eng. 2014, 32, 525–546. [Google Scholar] [CrossRef]
  54. Damjanac, B.; Fairhurst, C. Evidence for a long-term strength threshold in crystalline rock. Rock Mech. Rock Eng. 2010, 43, 513–531. [Google Scholar] [CrossRef]
  55. Leith, K.; Moore, J.R.; Amann, F.; Loew, S. In situ stress control on microcrack generation and macroscopic extensional fracture in exhuming bedrock. J. Geophys. Res. Solid Earth 2014, 119, 594–615. [Google Scholar] [CrossRef]
  56. Robertson, G.E. Thermal properties of rocks. In Geological Survey Editorial Standards and Stratigraphic Nomenclature; United States Geological Survey: Reston, VA, USA, 1988. [Google Scholar]
  57. Çanakci, H.; Demirboğa, R.; Karakoç, M.B.; Şirin, O. Thermal conductivity of limestone from Gaziantep (Turkey). Build. Environ. 2007, 42, 1777–1782. [Google Scholar] [CrossRef]
  58. Kappelmeyer, O.; Haenel, R. Geothermics with Special Reference to Application; Geoexploration Monographs Series; Gebrueder Borntraeger: Berlin, Germany, 1974. [Google Scholar]
  59. Homuth, S.; Götz, A.E.; Sass, I. Physical Properties of the geothermal carbonate reservoirs of the Molasse Basin, Germany—Outcrop Analogue vs. Reservoir Data. In Proceedings of the World Geothermal Congress, Melbourne, Australia, 19–25 April 2015. [Google Scholar]
  60. Manger, G.E. Porosity and Bulk Density of Sedimentary Rocks; United States Government Printing Office: Washington, DC, USA, 1963. [Google Scholar]
  61. Miščević, P.; Vlastelica, G. Durability characterization of marls from the region of Dalmatia, Croatia. Geotech. Geol. Eng. 2011, 29, 771–781. [Google Scholar] [CrossRef]
  62. Khalily, M.; Lashkaripour, G.R.; Ghafoori, M.; Khanehbad, M.; Dehghan, P. Durability characterization of Abderaz marly limestone in the Kopet-Dagh Basin, NE of Iran. Int. J. Emerg. Technol. Adv. Eng. 2013, 3, 50–56. [Google Scholar]
  63. Azimian, A.; Ajalloeian, R. Empirical correlation of physical and mechanical properties of Marly rocks with P wave velocity. Arab. J. Geosci. 2015, 8, 2069–2079. [Google Scholar] [CrossRef]
  64. Çiçek, F.; Deniz, İ.T.; Uçak, E.; Kandemir, S.Y. Determination of Slake Durability Index (Id) values on different shape of laminated Marl samples. Earth Environ. Sci. 2016, 44, 22006. [Google Scholar]
  65. Arman, H.; El, T.M.; Abdelghani, O.; Mahmoud, B.; Abu, S.M. Slake durability test on Lower Oligocene limestones from Al Ain City, United Arab Emirates. J. Earth Sci. Clim. Chang. 2016, 7, 2. [Google Scholar] [CrossRef]
  66. Ali, M.A.; Yang, H.S. A study of some Egyptian carbonate rocks for the building construction industry. Int. J. Min. Sci. Technol. 2014, 24, 467–470. [Google Scholar] [CrossRef]
  67. Ali, M.A.M.; Ahmed, H.M. Engineering characteristics of Egyptian limestone. Min. Miner. Depos. 2019, 13, 75–81. [Google Scholar] [CrossRef]
  68. Abdelrahman, A.S.; Ali, M.; Mahrous, A.; Draz, W.; Aly, F.A.; Moharam, M.R. Geotechnical assessment of limestone and dolomite quarries around Cairo for different purposes. J. Al-Azhar Univ. Eng. Sect. 2019, 14, 130–135. [Google Scholar] [CrossRef]
  69. Arnold, D. Building in Egypt: Pharaonic Stone Masonry; Oxford Press: Oxford, UK, 1991. [Google Scholar]
  70. Gercek, H. Poisson’s ratio values for rocks. Int. J. Rock Mech. Min. Sci. 2007, 44, 1–13. [Google Scholar] [CrossRef]
  71. Wen, T.; Tang, H.; Ma, J.; Wang, Y. Evaluation of methods for determining crack initiation stress under compression. Eng. Geol. 2018, 235, 81–97. [Google Scholar] [CrossRef]
  72. Meyer, B.J. New Objective Method for the Determination of Crack Initiation Stress Using Acoustic Emission Data. Ph.D. Thesis, Colorado School of Mines, Golden, CO, USA, 2018. [Google Scholar]
  73. Peng, J.; Rong, G.; Jiang, M. Variability of crack initiation and crack damage for various rock types. Arab. J. Geosci. 2018, 11, 265. [Google Scholar] [CrossRef]
  74. Pepe, G.; Mineo, S.; Pappalardo, G.; Cevasco, A. Relation between crack initiation-damage stress thresholds and failure strength of intact rock. Bull. Eng. Geol. Environ. 2018, 77, 709–724. [Google Scholar] [CrossRef]
  75. Ündül, Ö.; Aysal, N.; ÇobanoÏglu, B.C.; Amann, F.; Perras, M. Strength, deformation, and cracking characteristics of limestones. In Proceedings of the Rock Mechanics and Rock Engineering: From the Past to the Future, Cappadocia, Turkey, 29–31 August 2016. [Google Scholar]
  76. Khalil, E.E. On the modelling of air flow in the tombs of the Valley of the Kings. Fluid Mech. 2017, 4, 1–20. [Google Scholar]
  77. Bagheripour, M.H.; Rahgozar, R.; Pashnesaz, H.; Malekinejad, M. A complement to Hoek-Brown failure criterion for strength prediction in anisotropic rock. Geomech. Eng. 2011, 3, 61–81. [Google Scholar] [CrossRef]
  78. Rammamurthy, T. Strength and Modulus Responses of Anisotropic Rocks. Compr. Rock Eng. 1993, 13, 313–329. [Google Scholar]
  79. Kwasniewski, M. Anisotropy of elasticity of rocks and its effect on the magnitude and distribution of stress around underground openings. In Proceedings of the 8th Plenary Screntific Session, International Bureau of Strata Mechanics, Essen, Germany, 22–24 June 1983; pp. 5–37. [Google Scholar]
  80. Sharma, P.K.; Singh, T.N. A correlation between P-wave velocity, impact strength index, slake durability index and uniaxial compressive strength. Bull. Eng. Geol. Environ. 2008, 67, 17–22. [Google Scholar] [CrossRef]
  81. Yagiz, S. Correlation between slake durability and rock properties for some carbonate rocks. Bull. Eng. Geol. Environ. 2011, 70, 377–383. [Google Scholar] [CrossRef]
  82. Zhu, W.; Baud, P.; Wong, T. Micromechanics of cataclastic pore collapse in limestone. J. Geophys. Res. 2010, 115, 1–17. [Google Scholar] [CrossRef]
  83. Altindag, R. Correlation between P-wave velocity and some mechanical properties for sedimentary rocks. J. South. Afr. Inst. Min. Metall. 2012, 112, 229–237. [Google Scholar]
  84. Xue, L.; Qin, S.; Sun, Q.; Wang, Y.; Lee, L.M.; Li, W. A study on crack damage stress thresholds of different rock types based on uniaxial compression tests. Rock Mech. Rock Eng. 2014, 47, 1183–1195. [Google Scholar] [CrossRef]
  85. Hoek, E.; Diederichs, M.S. Empirical estimation of rock mass modulus. Int. J. Rock Mech. Min. Sci. 2006, 43, 203–215. [Google Scholar] [CrossRef]
  86. Palchik, V. On the ratios between elastic modulus and uniaxial compressive strength of heterogeneous carbonate rocks. Rock Mech. Rock Eng. 2011, 44, 121–128. [Google Scholar] [CrossRef]
  87. Deere, D.U. Geological considerations. In Rock Mechanics in Engineering Practice; Stagg, K.G., Zienkiewicz, O.C., Eds.; Wiley: London, UK, 1968; pp. 1–20. [Google Scholar]
  88. Palmstrom, A.; Singh, R. The Deformation Modulus of Rock Masses: Comparisons between in Situ Tests and Indirect Estimates. Tunn. Undergr. Space Technol. 2001, 16, 115–131. [Google Scholar] [CrossRef]
  89. Li, J.; Villaescusa, E. Determination of rock mass compressive strength using critical strain theory. In Proceedings of the 40th US Rock Mechanics/Geomechanics Symposium ARMA, Anchorage, AK, USA, 25–29 June 2019. [Google Scholar]
  90. Woodman, J.; Ougier-Simonin, A.; Stavrou, A.; Vazaios, I.; Murphy, W.; Thomas, M.E.; Reeves, H.J. Laboratory experiments and grain based discrete element numerical simulations investigating the thermo-mechanical behaviour of sandstone. Geotech. Geol. Eng. 2021, 39, 4795–4815. [Google Scholar] [CrossRef]
  91. Woodman, J. Thermo-Mechanical Loading of Intact Rock and Discontinuities. Ph.D. Thesis, University of Leeds, Leeds, UK, 2020. [Google Scholar]
  92. Marmoni, G.M.; Fiorucci, M.; Grechi, G.; Martino, S. Modelling of thermo-mechanical effects in a rock quarry wall induced by near-surface temperature fluctuations. Int. J. Rock Mech. Min. Sci. 2020, 134, 104440. [Google Scholar] [CrossRef]
  93. Collins, B.D.; Stock, G.M.; Eppes, M.C.; Lexiw, S.W.; Corbett, S.C.; Smith, J.B. Thermal influences on spontaneous rock dome exfoliation. Nat. Commun. 2018, 9, 762–775. [Google Scholar] [CrossRef] [PubMed] [Green Version]
  94. Alcaíno -Olivares, R.; Leith, K.; Ziegler, M.; Perras, M.A. Thermo-mechanical fatigue cracking of the bedrock on an island in the Baltic Sea. In Proceedings of the GeoNiagara 2021, Niagara Falls, ON, Canada, 26–29 September 2021. [Google Scholar]
Figure 1. Geographical location of the Thebes Necropolis within Luxor, Egypt, with red hashed area indicating the Valley of the Kings (KV), and WeG and WeM stand for Wadi Gabbanat el-Gouroud and Wade el-Machtiar, respectively.
Geotechnics 02 00040 g001
Figure 2. Introduction to the Valley of the Kings and the study area. (a) Satellite picture taken from Google Earth Pro [32]; imagery date 11 February 2018, showing the location of origin of the block samples (Block #) marked on the map. (b) Photograph of the southern branch of the valley at the University of Basel’s excavation area, with marks (KV#) showing the tomb entrances (picture faces south). Tomb KV42 has a rock column located directly above the tomb’s pit entrance, outlined in green (c) Stratigraphic column of Member I—Thebes Formation. The upper region of Esna Shale was added to describe block 7.
Geotechnics 02 00040 g002
Figure 3. Sample preparation considerations followed in this research, showing (a) picture of all rock blocks collected from the KV during the field campaign in February 2019 (locations highlighted in Figure 2a) and (b) a sketch of the nomenclature to define Parallel (PA) and Perpendicular (PE) orientations of coring, as well as a sketch to show the loading direction for Unconfined Compressive Strength (UCS) and Brazilian Tensile Strength (BTS) tests. BTS tests were conducted only in PE, for 2 configuration of loading and anisotropy orientation.
Geotechnics 02 00040 g003
Figure 4. Mechanical tests to measure strength of rock samples, with pictures showing the (a) apparatus for BTS tests and curved Brazilian loading jaw with BTS samples shown after peak strength is achieved and the fracture path connecting the two bearing points, and another type of failure influenced by the existence of planes parallel to the disc face (invalid sample). (b) Apparatus and an example specimen used in the UCS test with installed lateral and axial strain gauges on the sample surface, as well as (c) UCS tests of PA and PE samples with pictures of initial state (left) and at peak strength (right).
Geotechnics 02 00040 g004
Figure 5. Test results for block samples characterised by lithology and test orientation. The results for (a) thermal conductivity, (b) specific heat capacity, (c) P-wave velocity in the direct (DIR) technique, (d) P-wave velocity in the indirect (IND) technique, (e) apparent porosity, (f) bulk density, (g) slake durability index for the second cycle, (h) P-wave velocity measured in UCS samples, and (i) S-wave velocity measured on UCS samples are shown. MA: marly limestone; MI: micritic limestone; AR: argillaceous limestone; SIL: silicified limestone; PA: parallel; PE: perpendicular.
Geotechnics 02 00040 g005
Figure 6. Mechanical results for BTS and UCS tests, with the number of samples (#) indicated in individual graphs. Middle bars and values in box plots show the median value. (a) loading rate of BTS tests and strength; (b) indirect tensile strength results; (c) loading rate of UCS tests and strength; (d) UCS results; (e) Young’s modulus; (f) Poisson’s ratio. PA: parallel; PE: perpendicular. # stands for number of samples.
Geotechnics 02 00040 g006
Figure 7. Stress–strain curve for UCS tests with strain measurements. Samples are grouped by lithology and orientation of bedding planes. Samples with silica bands are not plotted in the graph (see Section 5.3), with (a) the stress–strain curves for PA samples and (b) the stress–strain curves for PE samples. The solid line shows the axial deformations, and the dashed line shows the lateral deformations.
Geotechnics 02 00040 g007
Figure 8. The crack initiation (CI) threshold values were calculated after several techniques detailed in Table 3. Legend stands for different calculation methods from Brace et al. [47], Latjai [48], Stacey [49], Diederichs [50], and Ghazvinian [51]. The marly and micritic limestone results are shown separately, distinguishing between PA and PE for the micritic limestone. No samples of PE for marly limestone could be used to calculate the CI threshold. PA: parallel; PE perpendicular.
Geotechnics 02 00040 g008
Figure 9. Correlation between parameters measured in this research. Symbols for geotechnical properties are illustrated in Table 4. (a)Unconfined compressive strength versus P-wave velocity; (b) crack initiation versus unconfined compressive strength (c) Young’s modulus versus unconfined compressive strength. Upper and lower limits for UCS vs. E are plotted (Hoek and Diederichs [85]; (d) modulus ratio versus maximum axial strain. Correlation of data plotted as dashed line (Palchik [86]).
Geotechnics 02 00040 g009
Table 1. Summary of reported values of geotechnical properties of rock units present in the Theban Necropolis. Where values or factual information are not explicitly reported a blank entry is left in the table. WV stands for West Valley of the Kings, whilst KV symbolises the East Valley of the Kings. KV# refers to a tomb within KV (e.g., KV17 is tomb 17). Wadi el-Machtiar and Wadi Gabbanat El-Gouroud are gullies near the KV within the Theban Necropolis, but they are not archaeological sites. These gullies’ locations are shown in Figure 1. #: number of samples: Avg.: average; Std. Dev.: standard deviation; Min.: minimum; Max.: maximum; ∆: differences; ρ : density. PA and PE denote the orientation of tests with respect to bedding planes.
PropertyReferenceRock Type(s)Sampling locationType of Test#Avg.Std.
Dev.
Min.Max.
Rock Density (kg/cm3)Lazar [17]Chalk, MarlWadi El-MachtiarBuoyancy in Hg13228021019502650
Wüst [18]Limestone, MarlWadi Gabbanat El-GouroudBuoyancy in Hg8210020017102210
Wüst and Schlüchter [19]Marls, Member IKV17Possibly from Wüst [18]621507020502180
Unit Weight (kN/m3)Hemeda [20]Marly limestoneKV5 20 2021
Porosity (%)Lazar [17]Chalk, MarlWadi El-Machtiar Δ   grain   and   bulk   ρ
Grain ρ measured with
multipycnometer
1313.481.127.5
Wüst [18]Limestone and MarlWadi Gabbanat El-Gouroud819.76.51434.7
Wüst and Schlüchter [19]Marls, Member IKV17618.23.415.223.4
Apparent
Porosity (%)
Hemeda [20]Marly limestoneKV5 1419
Uniaxial
Compressive Strength (UCS) in PE (MPa)
Lazar [17]Chalk, MarlWadi El-MachtiarUCS test10531622.868.2
Wüst and McLane [21]MarlKV17UCS test178.2
Hemeda [20]Marly limestoneKV5 67
Maissen [22]Micritic limestone (weathered)Exterior KV42Rebound hammer4407
Hemeda [23]Marly limestoneKV57UCS test78.7 89.3
UCS in PA (MPa)Lazar [17]Chalk, MarlWadi El-MachtiarUCS test7351016.247.8
Maissen [22]Micritic limestone (weathered)Exterior KV42Rebound hammer4326
P-wave velocity (Vp) in PE (km/s)Lazar [17]Chalk, MarlWadi El-MachtiarTransducer 100 kHz32.360.242.22.7
Maissen [22]Micritic limestone (weathered)Exterior KV42Transducer 54 kHz42.950.5
Hemeda [23]Marly limestoneKV57ASTM 597 0.70.9
Vp in PA (km/s)Lazar [17]Chalk, MarlWadi El-MachtiarTransducer 100kHz33.320.053.33.4
Maissen [22]Micritic limestone (weathered)Exterior KV42Transducer 54 kHz43.150.2
S-wave velocity (Vs) in PE (km/s)Hemeda [20]Marly limestoneKV5ASTM 597 0.71
Tensile   strength   ( σ t ) (MPa)Aydan et al. [24]Marly limestoneWV22Tensile test 4.45.1
Dziedzic and Michiewicz [25]Marly limestoneHatshepsut TempleBeam test42.950.262.73.4
Static elastic modulus, E-static (GPa)Hamada et al. [6]Marly limestoneKV5UCS tests 10
Aydan et al. [24]Soft limestoneWV22UCS tests 210
Hemeda [24]Marly limestoneKV57 12
Poisson’s
ratio (ν)
Abdallah and Helal [26]Limestone (Marly)Hatshepsut Temple 0.21
Ayman [27]Limestone (Esna Shale Fm.)KV17 Deepest Tunnel 0.2
Hemeda [20]Marly limestoneKV5 0.280.30
Hemeda [23]Marly limestoneKV57 0.250.30
Max .   axial   strain   ( ε a x i a l ) Wüst and McLane [21]MarlKV17UCS test10.42%
Abdellah et al. [28]Limestone (Marly)Hatshepsut TempleBlocks of 30 mm
tested at
1 mm/min
16%
Mohammed et al. [29]Limestone (Marly)Hatshepsut Temple12.2%
Table 2. List of blocks collected from the KV for the present work grouped by the rock units. Descriptions based on macroscopical features.
BlockFormationElevation (m.a.s.l.)Rock Unit Description
8Unknown 220–223.5 mStrong, massive, dark brown silicified limestone.
4, 5, 6Thebes Fm.—Member I200–210 mMedium strong, thinly bedded, cream, micritic limestone. Discontinuities: closely spaced, from 45° to 90° from bedding planes, smooth, tight.
1, 2, 3
9, 10, 11
Thebes Fm.—Member I120–130 mStrong, very thinly bedded, light grey, marly limestone with manganese dendrites on shallow surfaces. Discontinuities: very closely to closely spaced, from 45° to 90° from bedding planes, smooth, tight with small amount of clay infills.
7Esna Shale Fm.110–120 m Boundary with Thebes Fm.Medium strong, thickly laminated, reddish brown mottled light grey argillaceous limestone. Discontinuities: closely spaced, from 90° to 70° from bedding planes, rough, tight with small amount of clay infills.
Table 3. List of techniques for determination of Crack Initiation (CI) using strain measurements.
AuthorVariables and Method
Brace et al. [47]Linearity of volumetric strain and axial stress
Lajtai [48]Inflection in trend of lateral strain and axial stress
Stacey [49]Linearity of volumetric strain and axial strain
Diederichs [50]Maximum point of Poisson’s ratio increment and logarithm of axial stress curve
Ghazvinian [51]Lateral stiffness increment and axial stress
Table 4. Statistical values of the tested geotechnical parameters for the marly (MA) and micritic (MI) limestones. k: thermal conductivity; Sp. Heat: volumetric specific heat; Vpb: P-wave velocity measured in rock blocks; Id: slake durability index of two cycles; nap: apparent porosity; γb: bulk density; Vp: P-wave velocity measured in rock cylinders; Vs: S-wave velocity measured on rock cylinders; σt: indirect tensile strength; UCS: uniaxial compressive strength; E: elastic modulus; ν: Poisson’s ratio. * Overall values for lithology regardless of parallel (PA) or perpendicular (PE) orientation. ** Measured on UCS samples. OR: Orientation of coring is indicated as PA or PE, orientation of brackets (PE1 or PE2) referes to BTS tests. # stands for number.
LithologyOR k
W/mK
Sp. Heat
MJ/m3K
Vpb (DIR)
km/s
Vpb (IND)
km/s
Id *
(%)
nap *
(%)
γb *
kg/m3
Vp **
km/s
Vs **
km/s
σt
MPa
UCS
MPa
E
GPa
ν
MAPA
(PE1)
# Samples55665 49336322
Average1.081.041.610.7594 20222.981.187.430.418.50.29
Max.1.301.323.021.2699 22473.411.2813.240.9210.17
Min.0.730.`640.450.5285 17872.731.103.922.6160.42
Std. Dev.0.190.250.890.25.55 1340.300.073.37.7
PE
(PE2)
# Samples 66 44144
Average 2.491.05 2.141.179.239
Max. 2.982.20 2.401.3415.350
Min. 1.800.31 1.890.965.627
Std. Dev. 0.410.6 0.190.152.610.8
MIPA
(PE1)
# Samples333331447554322
Average0.701.472.650.739618.220623.221.307.723.919.50.20
Max.0.862.343.350.929723.929263.371.5311.430.8220.29
Min.0.521.061.140.239613.016643.061.086.320170.10
Std. Dev.0.140.500.780.20.473.41740.120.162.14.9
PE
(PE2)
# Samples2233 998955
Average0.651.621.630.73 2.201.027.158.310.30.10
Max.0.661.872.410.99 2.461.348.979.921.10.14
Min.0.651.361.040.34 2.050.785.640.92.50.08
Std. Dev. 0.480.2 0.130.181.112.16.40.02
Table 5. Statistical values of the tested thermal and physical properties of block samples for argillaceous (AR) and silicified limestone (SIL) samples. OR stands for orientation of test loading direction with respect to the bedding planes. The bedding planes were not present in SIL. Statistics were calculated from 10 readings for 1 test conducted for 1 sample of each lithology. k: thermal conductivity; Sp. Heat: volumetric specific heat; Vpb: P-wave velocity measured in rock blocks. OR: Orientation of coring is indicated as PA or PE, orientation of brackets (PE1 or PE2) refers to BTS tests.
LithologyOR k
W/mK
Sp. Heat
MJ/m3K
Vpb (DIR)
km/s
Vpb (IND)
km/s
ARPA (PE1)Average1.081.062.551.30
Max.1.081.062.641.31
Min.1.071.062.461.29
Std. Dev.0.000.000.080.01
PE (PE2)Average1.041.071.190.73
Max.1.051.081.230.85
Min.1.021.061.080.64
Std. Dev.0.010.010.050.1
SIL Average1.441.901.180.50
Max.1.512.031.30.50
Min.1.411.821.10.49
Std. Dev.0.020.080.060.01
Table 6. Statistical values of the tested physical and peak strength properties of five disc samples from the silicified limestone (SIL). γb: bulk density; σt: indirect tensile strength measured via Brazilian test.
Lithology γb
kg/m3
σt
MPa
SILAverage255020.3
Max.257129.7
Min.253114.7
Std. Dev.186.8
Table 7. Summary of Uniaxial Compressive Strength (UCS), crack closure stress (CC) and crack initiation stress (CI) levels, for marly and micritic limestone from Member I, Thebes Limestone Formation. Brackets indicate the thresholds in ratio of stress to UCS. Samples with silica bands were excluded here and average UCS of the remaining tests are given. # stands for number.
Rock TypeMarly LimestoneMicritic Limestone
Coring OrientationPAPEPAPE
# Samples2 25
UCS MPaAverage34.3 25.856.1
CCAverage7.4 (0.21) 6.9 (0.26)12.5 (0.22)
Max.7.7 (0.22) 5.6 (0.22)20.0 (0.36)
Min.7.0 (0.2) 8.3 (0.32)6.3 (0.11)
Std. Dev. 4.7 (0.08)
CIAverage14.1 (0.41) 11.4 (0.44)23.8 (0.42)
Max.16.8 (0.49) 9.7 (0.38)33.0 (0.59)
Min.11.4 (0.33) 13.1 (0.50)16.2 (0.29)
Std. Dev. 5.6 (0.10)
Publisher’s Note: MDPI stays neutral with regard to jurisdictional claims in published maps and institutional affiliations.

