
Exploring Spatio-Temporal Pattern of Gentrification Processes in Intracity Slums in the Lagos Megacity


Abstract
:1. Introduction
2. Slum Gentrification
3. Methodology
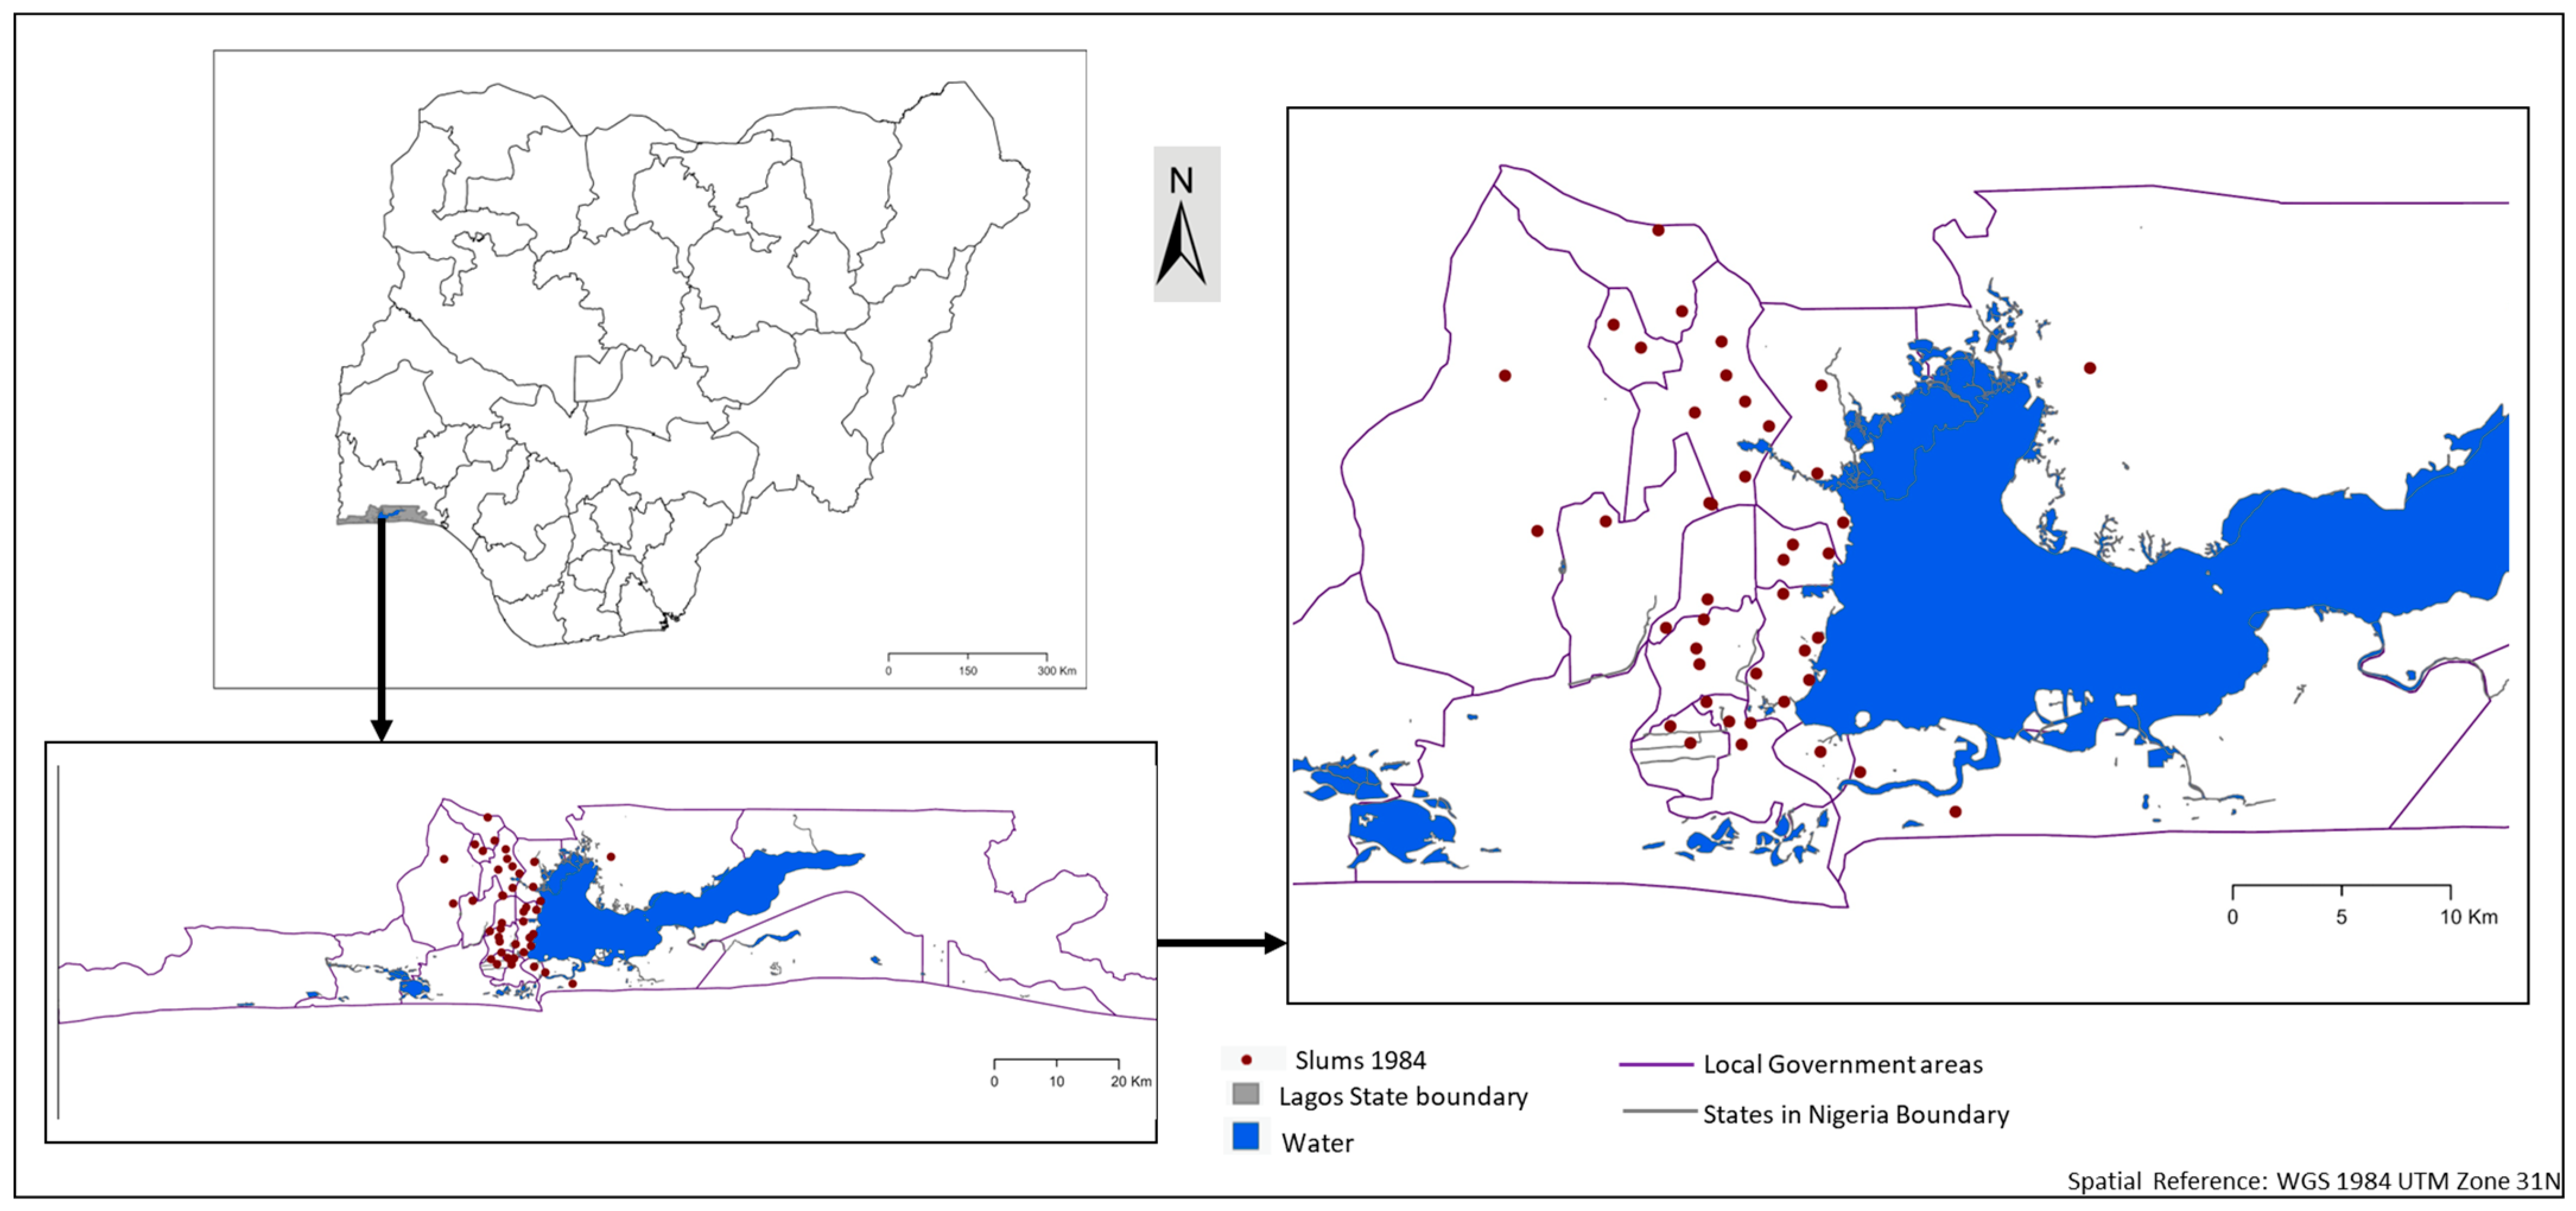
3.1. Study Area
3.2. Data Collection
3.3. Data Analysis
3.3.1. Image Classification and Change Detection
3.3.2. General Characteristics and Processes of Slum Gentrification in Lagos
3.3.3. Drivers of the Slum Gentrification Process
3.3.4. Random Forest and Variable of Importance
4. Results
4.1. What Were the Spatio-Temporal Patterns and Proportions of Deprived and Gentrified Areas in the Slums of Lagos from 1984 to 2021?
I was living close to the University of Lagos before; then I had to move with my family because I could not afford the new rents my landlord wanted me to pay.(Ayo, Iwaya, January, 2021)
4.2. Which Characteristics Are Revealed by the Gentrification Process in Slums?
After the government built this road, many landlords leased their land to developers to rebuild and then rent it out at a higher price. Many people have moved out because they could not afford the new rents.(Shola, Interview, Ijeshatedo/Itire, February, 2021)
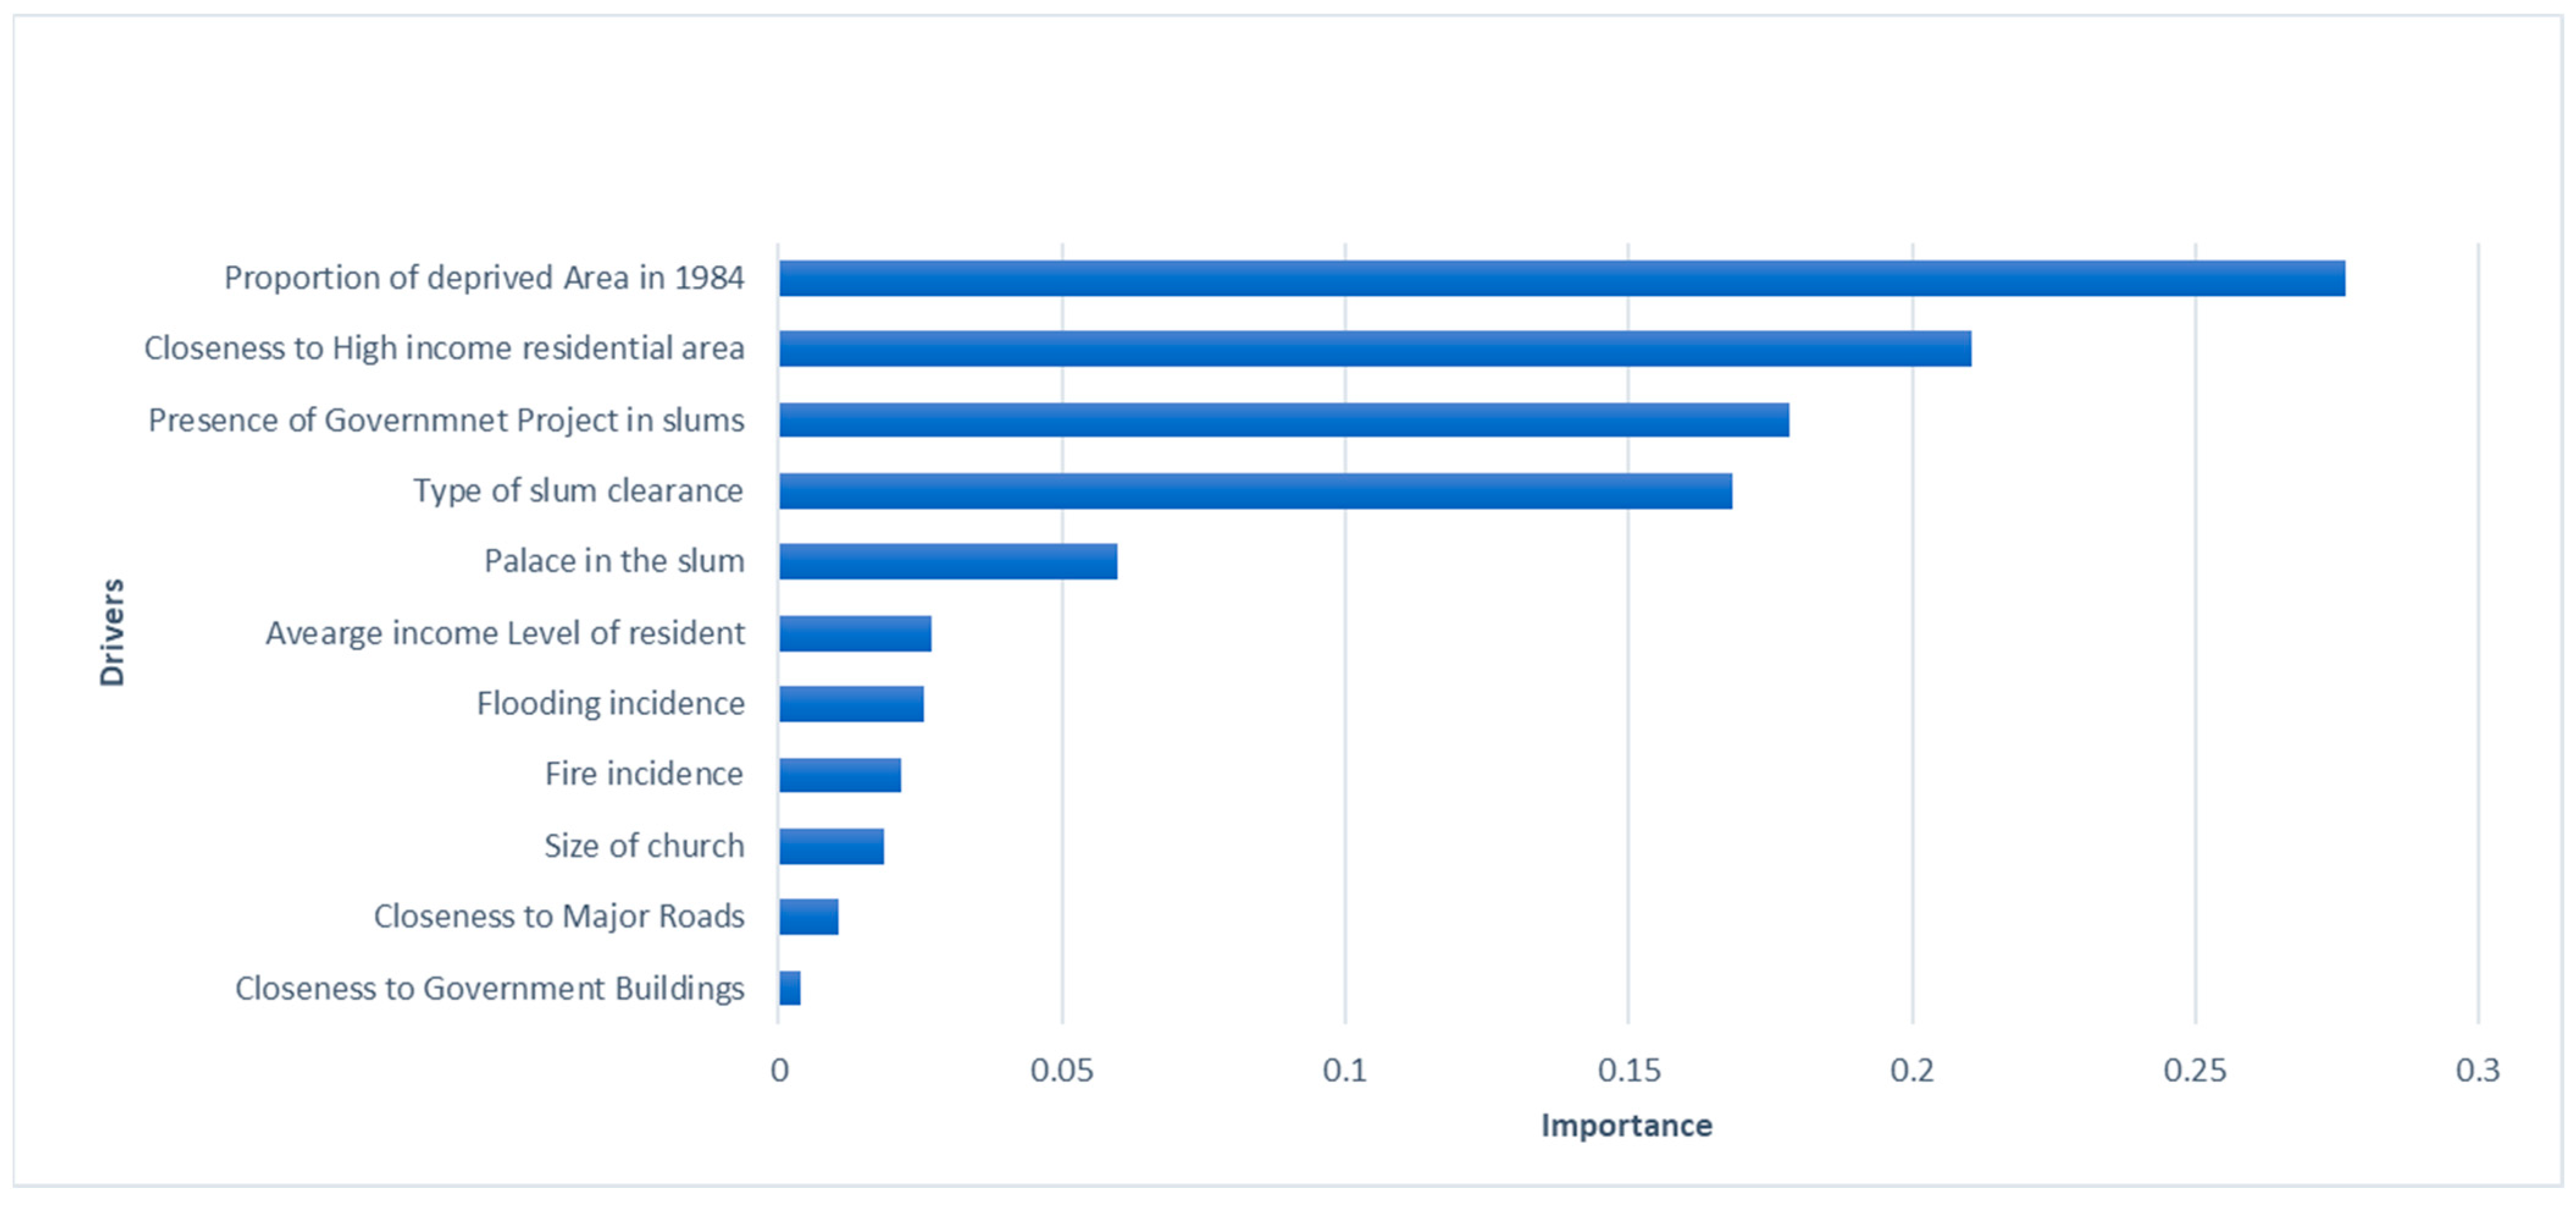
4.3. What Drives the Process of Gentrification
When our father died, we didn’t want to sell the land, and we do not have money to rebuild. So, we leased it to the developers, who built this new house; they gave us this floor that we are living in, and they rented the other floors out to tenants.(Kola, interview, Itire, January, 2021)
Someone set our houses on fire so we could be forced out and then sold our land to people that would pay more.(Bidemi, Otto-Ilogbo Residents, March 2021)
5. Discussion
6. Conclusions
Author Contributions
Funding
Data Availability Statement
Conflicts of Interest
References
- UN-Habitat. Global Report on Human Settlements 2003: The Challenge of Slums; Earthscan: London, UK; Sterling, UK, 2003. [Google Scholar]
- UN-Habitat. The World Cities Report 2020; The Value of Sustainable Urbanization; United Nations Human Settlements Programme (UN-Habitat): Nairobi, Kenya, 2020. [Google Scholar]
- UN-DESA. World Population Prospects 2019: Data Booklet 2019 (ST/ESA/SER.A/424); UN-DESA: New York, NY, USA, 2019. [Google Scholar]
- Davis, M. Planet of Slums. New Left Rev. 2009, 26, 5–34. [Google Scholar]
- Marx, B.; Stoker, T.; Suri, T. The Economics of Slums in the Developing World. J. Econ. Perspect. 2013, 27, 187–210. [Google Scholar] [CrossRef]
- Thomson, D.; Kuffer, M.; Boo, G.; Hati, B.; Grippa, T.; Elsey, H.; Linard, C.; Mahabir, R.; Kyobutungi, C.; Maviti, J.; et al. Need for an Integrated Deprived Area “Slum” Mapping System (Ideamaps) in LMICs. Soc. Sci. 2020, 9, 80. [Google Scholar] [CrossRef]
- UN-Habitat. The Challenge of Slums. Global Report on Human Settlements: Revised and Updated Version 2010. Available online: https://staging.unhabitat.org/downloads/docs/GRHS_2003_Chapter_01_Revised_2010.pdf (accessed on 27 March 2024).
- Kuffer, M.; Abascal, A.; Vanhuysse, S.; Georganos, S.; Wang, J.; Thomson, D.R.; Boanada, A.; Roca, P. Data and Urban Poverty: Detecting and Characterising Slums and Deprived Urban Areas in Low- and Middle-Income Countries; Springer: Singapore, 2023. [Google Scholar] [CrossRef]
- MacTavish, R.; Bixby, H.; Cavanaugh, A.; Agyei-Mensah, S.; Bawah, A.; Owusu, G.; Ezzati, M.; Arku, R.; Robinson, B.; Schmidt, A.M.; et al. Identifying deprived “slum” neighbourhoods in the Greater Accra Metropolitan Area of Ghana using census and remote sensing data. World Dev. 2023, 167, 106253. [Google Scholar] [CrossRef] [PubMed]
- Owusu, M.; Nair, A.; Jafari, A.; Thomson, D.; Kuffer, M.; Engstrom, R. Towards a scalable and transferable approach to map deprived areas using Sentinel-2 images and machine learning. Comput. Environ. Urban. Syst. 2024, 109, 102075. [Google Scholar] [CrossRef]
- Cities Alliance. Cities Alliance for Cities without Slum: Action Plan for Moving Slum Upgrading to Scale. Special Summary Edition 2013, 23. Available online: https://www.citiesalliance.org/sites/default/files/ActionPlan.pdf (accessed on 12 July 2020).
- Badmos, O.S.; Rienow, A.; Callo-Concha, D.; Greve, K.; Jürgens, C. Simulating slum growth in Lagos: An integration of rule based and empirical based model. Comput. Environ. Urban. Syst. 2019, 77, 101369. [Google Scholar] [CrossRef]
- Patel, K. A successful slum upgrade in Durban: A case of formal change and informal continuity. Habitat Int. 2013, 40, 211–217. [Google Scholar] [CrossRef]
- Werlin, H. The slum upgrading myth. Urban Stud. 1999, 36, 1523–1534. [Google Scholar] [CrossRef]
- Ascensa, E. Slum Gentrification. In Handbook of Gentrification Studies; Lees, L., Martin, P., Eds.; Edward Elgar Publishing: Cheltenham, UK, 2018; pp. 225–246. [Google Scholar]
- Ezema, I.; Opoko, P.; Oluwatayo, A. Urban Regeneration through State-led, New-Build Gentrification in Lagos Inner City, Nigeria. Int. J. Appl. Environ. Sci. 2016, 11, 137–148. [Google Scholar]
- Striedieck, M. Causes, Developments and Consequences of Gentrification Processes; Blekinge Tekniska Högskola: Karlskrona, Sweeden, 2012. [Google Scholar]
- Granger, R. What now for urban regeneration? Proc. Inst. Civ. Eng. Urban. Des. Plan. 2010, 163, 9–16. [Google Scholar] [CrossRef]
- Ghertner, D.A. Why gentrification theory fails in ‘much of the world. City 2015, 19, 552–563. [Google Scholar] [CrossRef]
- Deininger, K. Land Policies for Growth and Poverty Reduction; World Bank: Washington, DC, USA; Oxford University Press: Washington, DC, USA, 2003. [Google Scholar]
- Sauls, L.A.; Galeana, F.; Lawry, S. Indigenous and Customary Land Tenure Security: History, Trends, and Challenges in the Latin American Context. In Land Tenure Security and Sustainable Development; Holland, M.B., Masuda, Y.J., Robinson, B.E., Eds.; Springer Nature Switzerland AG: Cham, Switzerland, 2022; pp. 57–79. [Google Scholar] [CrossRef]
- Godswill, O.C.; Ukachukwu, A.G. Gentrification and Environmental Justice in Nigerian Cities. Int. J. Adv. Eng. Res. Sci. 2018, 5, 93–107. [Google Scholar] [CrossRef]
- Agbaje, E.B.A. Modernisation, urban renewal and the social cost of development. Mediterr. J. Soc. Sci. 2013, 4, 318–324. [Google Scholar] [CrossRef]
- Filani, O.M. The Changing Face of Lagos: From Vission to Reform and Transformation; Cities Alliance: Brussels, Belgium, 2012. [Google Scholar] [CrossRef]
- Morka, F.C. A Place to Live: A Case Study of the Ijora-Badia Community in Lagos, Nigeria. Unpublished Case Study Prepared for Global Report on Human Settlements. 2007. Available online: https://staging.unhabitat.org/downloads/docs/GRHS.2007.CaseStudy.Tenure.Nigeria.pdf (accessed on 10 October 2019).
- World Bank. From Oil to Cities: Nigeria’s Next Transformation. Directions in Development; World Bank: Washington, DC, USA, 2016. [Google Scholar] [CrossRef]
- LASG/MEPB. Lagos State Development Plan 2012–2025 2013:1–300. Available online: https://www.scribd.com/document/271150413/LAGOS-STATE-DEVELOPMENT-PLAN-2012-2025 (accessed on 5 March 2017).
- Nwanna, C. Gentrification in Lagos State: Challenges and prospects. Br. J. Arts Social. Sci. 2012, 5, 163–176. [Google Scholar]
- Glass, R. London, Aspects of Change; Macgibbon & Kee: London, UK, 1964. [Google Scholar]
- Kourilova, J.; Albertova, D.; Pelucha, M. Demographic and physical aspects of gentrification in relation to resilience of localities: Case study of the renovated district in the city of prague. Urban Reg. Anal. 2023, 15, 239–271. [Google Scholar] [CrossRef]
- Gray, J.; Buckner, L.; Comber, A. Identifying Neighbourhood Change Using a Data Primitive Approach: The Example of Gentrification. Appl. Spat. Anal. Policy 2023, 16, 897–921. [Google Scholar] [CrossRef]
- Slater, T. Gentrification of the city. In Gentrification of the City; Gary, B., Watson, S., Eds.; Blackwell Publishing Ltd.: Oxford, UK, 2011; pp. 571–585. [Google Scholar]
- Ellen, I.G.; O’Regan, K.M. How low income neighborhoods change: Entry, exit, and enhancement. Reg. Sci. Urban Econ. 2011, 41, 89–97. [Google Scholar] [CrossRef]
- Ghertner, D.A. India’s urban revolution: Geographies of displacement beyond gentrification. Environ. Plan. A 2014, 46, 1554–1571. [Google Scholar] [CrossRef]
- Lees, L. Gentrification in the Global South? In The Routledge Handbook on Cities of the Global South; Parnell, S., Oldfield, S., Eds.; Routledge: New York, NY, USA, 2014; pp. 506–521. [Google Scholar] [CrossRef]
- Smith, D. “Studentification”: The gentrification factory? In Gentrification in a Global Context: The New Urban Colonialism; Atkinson, R., Bridge, G., Eds.; Routledge: London, UK, 2005; pp. 72–89. [Google Scholar]
- Balboni, C.; Bryan, G.; Morten, M.; Siddiqi, B. Could Gentrification Stop the Poor from Benefiting from Urban Improvements? AEA Pap. Proc. 2021, 111, 532–537. [Google Scholar] [CrossRef]
- Sakızlıoğlu, B.; Lees, L. Commercial Gentrification, Ethnicity, and Social Mixedness: The Case of Javastraat, Indische Buurt, Amsterdam. City Community 2020, 19, 870–889. [Google Scholar] [CrossRef]
- Lemanski, C. Hybrid gentrification in South Africa: Theorising across southern and northern cities. Urban Stud. 2014, 51, 2943–2960. [Google Scholar] [CrossRef]
- Rigolon, A.; Collins, T. The green gentrification cycle. Urban Stud. 2023, 60, 770–785. [Google Scholar] [CrossRef]
- Blok, A. Urban green gentrification in an unequal world of climate change. Urban Stud. 2020, 57, 2803–2816. [Google Scholar] [CrossRef]
- Lees, L. The geography of gentrification: Thinking through comparative urbanism. Prog. Hum. Geogr. 2012, 36, 155–171. [Google Scholar] [CrossRef]
- Nijman, J. Introduction—Comparative urbanism. Urban. Geogr. 2007, 28, 1–6. [Google Scholar] [CrossRef]
- Badmos, O.S.; Callo-Concha, D.; Agbola, B.; Rienow, A.; Badmos, B.; Greve, K.; Jürgens, C. Determinants of residential location choices by slum dwellers in Lagos megacity. Cities 2020, 98, 102589. [Google Scholar] [CrossRef]
- Kohli, D. Identifying and Classifying Slum Areas Using Remote Sensing. Ph.D. Thesis, University of Twente, Enschede, The Nerthlands, 2015. [Google Scholar] [CrossRef]
- Mahabir, R.; Croitoru, A.; Crooks, A.; Agouris, P.; Stefanidis, A. A Critical Review of High and Very High-Resolution Remote Sensing Approaches for Detecting and Mapping Slums: Trends, Challenges and Emerging Opportunities. Urban. Sci. 2018, 2, 8. [Google Scholar] [CrossRef]
- Kuffer, M.; Pfeffer, K.; Sliuzas, R.; Baud, I. Extraction of Slum Areas from VHR Imagery Using GLCM Variance. IEEE J. Sel. Top. Appl. Earth Obs. Remote Sens. 2016, 9, 1830–1840. [Google Scholar] [CrossRef]
- Gruebner, O.; Sachs, J.; Nockert, A.; Frings, M.; Khan, M.d.M.H.; Lakes, T.; Hostert, P. Mapping the Slums of Dhaka from 2006 to 2010. Dataset Pap. Sci. 2014, 2014, 172182. [Google Scholar] [CrossRef]
- Markley, S. Suburban gentrification? Examining the geographies of New Urbanism in Atlanta’s inner suburbs. Urban Geogr. 2018, 39, 606–630. [Google Scholar] [CrossRef]
- Wu, W.; Wang, J. Gentrification effects of China’s urban village renewals. Urban Stud. 2017, 54, 214–229. [Google Scholar] [CrossRef]
- Yagmur, N.; Erten, E.; Musaoglu, N. How to Start Gentrification Process Using Interferometric Stack of Sentinel-1. Int. Arch. Photogramm. Remote Sens. Spat. Inf. Sci. 2021, XLIII-B3-2, 183–188. [Google Scholar] [CrossRef]
- Lin, L.; Di, L.; Zhang, C.; Guo, L.; Di, Y. Remote sensing of urban poverty and gentrification. Remote Sens. 2021, 13, 4022. [Google Scholar] [CrossRef]
- López-Morales, E. Gentrification in the global South. City 2015, 19, 564–573. [Google Scholar] [CrossRef]
- Yeom, M. Gentrification: An Introduction, Overview, and Application. The 21st Century American City: Race, Ethnicity, and Multicultural Urban Life; Kendall Hunt Publishing Company: Dubuque, IA, USA, 2019; pp. 79–96. [Google Scholar]
- López-Morales, E.; Ruiz-Tagle, J.; Santos Junior, O.A.; Blanco, J.; Salinas Arreortúa, L. State-led gentrification in three Latin American cities. J. Urban Aff. 2023, 45, 1397–1417. [Google Scholar] [CrossRef]
- Bamgbade, J.A.; Golly, G.N.A.; Ohueri, C.C. Sociopolitical economy and spatial accentuation of neighbourhood gentrification in East Malaysia. J. Hous. Built Environ. 2023, 39, 49–75. [Google Scholar] [CrossRef]
- Gulyani, S.; Talukdar, D. Slum Real Estate: The Low-Quality High-Price Puzzle in Nairobi’s Slum Rental Market and its Implications for Theory and Practice. World Dev. 2008, 36, 1916–1937. [Google Scholar] [CrossRef]
- Edelman, B.; Mitra, A. Slums as Vote Banks and Residents’ Access to Basic Amenities: The Role of Political Contact and its Determinants. Indian J. Hum. Dev. 2007, 1, 129–150. [Google Scholar] [CrossRef]
- Roy, D.; Lees, M.H.; Palavalli, B.; Pfeffer, K.; Sloot, M.A.P. The emergence of slums: A contemporary view on simulation models. Environ. Model. Softw. 2014, 59, 76–90. [Google Scholar] [CrossRef]
- Silvestre, G.; Gusmão de Oliveira, N. The revanchist logic of mega-events: Community displacement in Rio de Janeiro’s West End. Vis. Stud. 2012, 27, 204–210. [Google Scholar] [CrossRef]
- Obaitor, O.S.; Lawanson, T.O.; Stellmes, M.; Lakes, T. Social Capital: Higher Resilience in Slums in the Lagos Metropolis. Sustainability 2021, 13, 3879. [Google Scholar] [CrossRef]
- Nwanna, C. Gentrification in Nigeria: The case of two housing estates in Lagos. In Global Gentrifications: Uneven Development and Displacement; Lees, L., Shin, H.B., López-Morales, E., Eds.; Policy Press: Bristol, UK, 2015; pp. 311–328. [Google Scholar]
- Nwanna, C. Right To The City: Lagos, An Emerging Revanchist City In Nigeria? Adv. Soc. Sci. Res. J. 2018, 5, 59–69. [Google Scholar] [CrossRef]
- Diaz-Parra, I.; Hernández Cordero, A. Gentrification studies and cultural colonialism: Discussing connections between historic city centers of Mexico and Spain. J. Urban Aff. 2023, 1–15. [Google Scholar] [CrossRef]
- Fox, S. Urbanization as a Global Historical Process: Theory and Evidence from sub-Saharan Africa. Popul. Dev. Rev. 2012, 38, 285–310. [Google Scholar] [CrossRef]
- Barros, C.P.; Chivangue, A.; Samagaio, A. Urban dynamics in Maputo, Mozambique. Cities 2014, 36, 74–82. [Google Scholar] [CrossRef]
- Davies, L. Gentrification in Lagos, 1929–1990. Urban Hist. 2018, 45, 712–732. [Google Scholar] [CrossRef]
- Visser, G.; Kotze, N. The state and new-build gentrification in Central Cape Town, South Africa. Urban Stud. 2008, 45, 2565–2593. [Google Scholar] [CrossRef]
- Ajayi, O.; Soyinka-Airewele, P.; Samuel, O. Gentrification and the Challenge of Development in Makoko, Lagos State, Nigeria: A Rights-Based Perspective. Environ. Justice 2019, 12, 41–47. [Google Scholar] [CrossRef]
- Garside, J. Inner city gentrification in South Africa: The case of Woodstock, Cape Town. GeoJournal 1993, 30, 29–35. [Google Scholar] [CrossRef]
- Gossaye, A. Inner-city renewal and locational stability of the poor: A study of inner-city renewal program in Addis Ababa, Ethiopia. Adv. Archit. Ser. 2000, 39, 437–446. [Google Scholar]
- Adenaike, F.A.; Talabi, I.J.; Amusan, O.A. Causal theories and proposals for urban upgrades in historic city centres. J. Adv. Educ. Sci. 2023, 3, 6–14. [Google Scholar]
- Edwin, K. Impact of urban renewal changes on urban landscape identity: Case study of Kisumu City, Kenya. Acta Structilia 2023, 30, 156–185. [Google Scholar] [CrossRef]
- Monare, P.T.; Kotzé, N.; McKay, T.M. A second wave of gentrification: The case of Parkhurst, Johannesburg, South Africa. Urbani Izziv 2014, 25, S108–S121. [Google Scholar] [CrossRef]
- Adelekan, I.O. Vulnerability of poor urban coastal communities to flooding in Lagos, Nigeria. Environ. Urban. 2010, 22, 433–450. [Google Scholar] [CrossRef]
- Okwuashi, O.; Ofem, B.; Beulah, O. Historical Perspective of Urbanization and Urban Planning of Lagos, Nigeria. Int. J. Sci. Res. 2014, 3, 1994–1998. [Google Scholar]
- Lagos Bureau of Statistics. Spotlight on Lagos Statistics, 2021 Edition. Ministry of Economic Planning and Budget, Lagos State Government. 2022. Available online: https://lagosmepb.org/wp-content/uploads/Hotline_Stat.pdf (accessed on 5 December 2020).
- Lagos State Government/United Nations Centre for Human Settlements Identification of Urban Renewal Areas in Metropolitan Lagos. Urban and Regional Planning Division: United Nations Development Programme UNCHS Habitat N1R 82/00/Implementation; Lagos State Government: Lagos, Nigeria, 1984.
- Gilbert, A. The Return of the Slum: Does Language Matter? Int. J. Urban. Reg. Res. 2007, 31, 697–713. [Google Scholar] [CrossRef]
- Onokerhoraye, A.G. Urbanization and Environment in Nigeria: Implications for Sustainable Development; Benin Social Science Series for Africa: Benin, Nigeria, 1995. [Google Scholar]
- World Bank. Project Appraisal Document to the Federal Republic of Nigeria for the Lagos Metropolitan Development and Governance Project; World Bank: Washington, DC, USA, 2006. [Google Scholar]
- SNC-Lavalin. Report on Community Infrastructure Upgrading Programme for Metropolitan Lagos; SNC-Lavalin: Lagos, Nigeria, 1995. [Google Scholar]
- Lagos Bureau of Statistics. Abstract of Local Government Statistics; Lagos State Government: Lagos, Nigeria, 2019.
- Happe, B.; Sperberg, J. Social structures and living conditions. In Poverty and Democracy; Berg-Schlosser, D., Kersting, N., Eds.; Zed Books: London, UK, 2003; pp. 76–92. [Google Scholar]
- Durand-lasserve, A. Informal settlements and the Millennium Development Goals: Global policy debates on property ownership and security of tenure. Glob. Urban. Dev. 2006, 2, 15. [Google Scholar]
- Yoon, Y.; Park, J. Stage classification and characteristics analysis of commercial gentrification in Seoul. Sustainability 2018, 10, 2440. [Google Scholar] [CrossRef]
- Agbola, T.; Jinadu, A.M. Forced eviction and forced relocation in Nigeria: The experience of those evicted from Maroko in 1990. Environ. Urban. 1997, 9, 271–287. [Google Scholar] [CrossRef]
- Dadvand, P.; Ostro, B.; Figueras, F.; Foraster, M.; Basagaña, X.; Valentín, A.; Martinez, D.; Beelen, R.; Cirach, M.; Hoek, G.; et al. Residential proximity to major roads and term low birth weight: The roles of air pollution, heat, noise, and road-adjacent trees. Epidemiology 2014, 25, 518–525. [Google Scholar] [CrossRef]
- Yong, Y.; Diez-Roux, A.V. Walking Distance by Trip Purpose and Population Subgroups Yong. Am. J. Prev. Med. 2013, 43, 11–19. [Google Scholar] [CrossRef] [PubMed]
- Charmaz, K. Constructing Grounded Theory: A Practical Guide through Qualitative Analysis; Sage Publications: London, UK, 2006. [Google Scholar]
- Badmos, O.; Rienow, A.; Callo-Concha, D.; Greve, K.; Jürgens, C. Urban Development in West Africa—Monitoring and Intensity Analysis of Slum Growth in Lagos: Linking Pattern and Process. Remote Sens. 2018, 10, 1044. [Google Scholar] [CrossRef]
- Lemma, T.; Sliuzas, R.; Kuffer, M. A participatory approach to monitoring slum conditions: An example from Ethiopia. IIED Publ. Database Particip. Learn. Action 2006, 54, 67–89. [Google Scholar]
- Weeks, J.R.; Hill, A.; Stow, D.; Getis, A.; Fugate, D. Can we spot a neighborhood from the air? Defining neighborhood structure in Accra, Ghana. GeoJournal 2007, 69, 9–22. [Google Scholar] [CrossRef]
- Breiman, L. Random forests. Mach. Learn. 2001, 45, 5–32. [Google Scholar] [CrossRef]
- Congalton, R.G. A review of assessing the accuracy of classifications of remotely sensed data. Remote Sens. Environ. 1991, 37, 35–46. [Google Scholar] [CrossRef]
- Phinzi, K.; Abriha, D.; Szabó, S. Classification efficacy using k-fold cross-validation and bootstrapping resampling techniques on the example of mapping complex gully systems. Remote Sens. 2021, 13, 2980. [Google Scholar] [CrossRef]
- Chicco, D.; Jurman, G. The advantages of the Matthews correlation coefficient (MCC) over F1 score and accuracy in binary classification evaluation. BMC Genom. 2020, 21, 6. [Google Scholar] [CrossRef]
- Shekhar, S. Detecting Slums from Quick Bird Data in Pune Using an Object Oriented Approach. ISPRS—Int. Arch. Photogramm. Remote Sens. Spat. Inf. Sci. 2012, XXXIX-B8, 519–524. [Google Scholar] [CrossRef]
- Riessman, C.K. Narrative Analysis; Sage: Thousand Oaks, CA, USA, 1993; Volume 30. [Google Scholar]
- Amnesty International. The Human Cost of a Megacity Forced Evictions of the Urban Poor in Lagos, Nigeria; Amnesty International: London, UK, 2017. [Google Scholar]
- Hamnett, C.; Whitelegg, D. Loft Conversion and Gentrification in London: From Industrial to Postindustrial Land Use. Environ. Plan. A Econ. Space 2007, 39, 106–124. [Google Scholar] [CrossRef]
- Debnath, A.K.; Naznin, S.D. Industrial Concentration as Predictor of Slum Agglomeration in Dhaka Metropolitan Development Plan Area: A Spatial Autocorrelation Approach. J. Bangladesh Inst. Plan. 2011, 4, 1–13. [Google Scholar]
- Barros, C.P.; Balsas, C.J.L. Luanda’s Slums: An overview based on poverty and gentrification. Urban Dev. Issues 2020, 64, 29–38. [Google Scholar] [CrossRef]
- Strømsnes, K. The importance of Church attendance and membership of religious voluntary organizations for the formation of social capital. Soc. Compass 2008, 55, 478–496. [Google Scholar] [CrossRef]
- Roy, D.; Lees, M. Understanding resilience in slums using an agent-based model. Comput. Environ. Urban Syst. 2020, 80, 101458. [Google Scholar] [CrossRef]
- Smith, N. The New Urban Frontier; Routledge: London, UK, 2005. [Google Scholar] [CrossRef]
- Best, K.B.; Gilligan, J.M.; Baroud, H.; Carrico, A.R.; Donato, K.M.; Ackerly, B.A.; Mallick, B. Random forest analysis of two household surveys can identify important predictors of migration in Bangladesh. J. Comput. Soc. Sci. 2021, 4, 77–100. [Google Scholar] [CrossRef]
- Ali, J.; Khan, R.; Ahmad, N.; Maqsood, I. Random forests and decision trees. IJCSI Int. J. Comput. Sci. Issues 2012, 9, 272–278. [Google Scholar]
- Boge, F.I. Dynamics of Economic Development, Ikorodu Division of Lagos, Nieria, 1960–1999. Hist. Int. Stud. 2019, 9, 106–128. [Google Scholar]
- Olugbenga, E.; Adekemi, O. Challenges of Housing Delivery in Metropolitan Lagos. Res. Humanit. Soc. Sci. 2013, 3, 1–9. [Google Scholar]
- Nubi, O. Affordable Housing Delivery in Nigeria. In Proceedings of the South African Foundation International Conference and Exhibition, Cape Town, South Africa, 26–29 October 2008; pp. 1–18. [Google Scholar]
- Lees, L. Gentrification and social mixing: Towards an inclusive urban renaissance? Urban Stud. 2008, 45, 2449–2470. [Google Scholar] [CrossRef]
- Agboola, A.O.; Scofield, D.; Amidu, A.R. Understanding property market operations from a dual institutional perspective: The case of Lagos, Nigeria. Land Use Policy 2017, 68, 89–96. [Google Scholar] [CrossRef]
- Ibama, B.; Tar Okeh, E.; Oviebor, P. Dynamics of gentrification: Experiences from selected neighbourhoods in Port Harcourt municipality. MOJ Civ. Eng. 2019, 5, 107–113. [Google Scholar] [CrossRef]
- Amnesty International. Nigeria: Fire and Demolitions That Left 30,000 Homeless Must Be Urgently Investigated 2016. Available online: https://www.amnesty.org/en/latest/news/2016/11/nigeria-fire-and-demolitions-that-left-30000-homeless-must-be-urgently-investigated/ (accessed on 6 August 2021).
- Ogidi, R. Worries over Failure of Religion as Moral Anchor. The Guardian, 28 March 1997; p. 11. [Google Scholar]
- Ukah, A. Building God’s City: The Political Economy of Prayer Camps in Nigeria. Int. J. Urban. Reg. Res. 2016, 40, 524–540. [Google Scholar] [CrossRef]
- Kuffer, M.; Thomson, D.R.; Boo, G.; Mahabir, R.; Grippa, T.; Vanhuysse, S.; Engstrom, R.; Ndugwa, R.; Makau, J.; Darin, E.; et al. The role of earth observation in an integrated deprived area mapping “system” for low-to-middle income countries. Remote Sens. 2020, 12, 982. [Google Scholar] [CrossRef]
- Rankin, K.N.; Mclean, H. Governing the commercial streets of the city: New terrains of disinvestment and gentrification in toronto’s inner suburbs. Antipode 2015, 47, 216–239. [Google Scholar] [CrossRef]
- Durand-Lasserve, A.; Royston, L. Holding Their Ground: Secure Land Tenure for the Urban Poor in Developing Countries Chapter 1: International Trends and Country Contexts—From Tenure Regularization to Tenure Security; Earthscan: London, UK, 2002. [Google Scholar]
- Doshi, S. Rethinking gentrification in India: Displacement, dispossession and the spectre of development. In Global Gentrifications: Uneven Development and Displacement; Lees, L., Shin, H.B., Lopez-Morales, E., Eds.; Policy Press: London, UK; University of Bristol: Bristol, UK, 2015; pp. 101–120. [Google Scholar]
- Comelli, T.; Anguelovski, I.; Chu, E. Socio-spatial legibility, discipline, and gentrification through favela upgrading in Rio de Janeiro. City 2018, 22, 633–656. [Google Scholar] [CrossRef]
- Wu, F. Scripting Indian and Chinese urban spatial transformation: Adding new narratives to gentrification and suburbanisation research. Environ. Plan. C Politics Space 2020, 38, 980–997. [Google Scholar] [CrossRef]
- Daniel, M.M.; Wapwera, S.D.; Akande, E.M.; Musa, C.C.; Aliyu, A.A. Slum Housing Conditions and Eradication Practices in Some Selected Nigerian Cities. J. Sustain. Dev. 2015, 8, 230–241. [Google Scholar] [CrossRef]


| S/N | Sampled Communities | Tenancy (1984) | Area (ha) | * Projected Population/ha (2021) | Location | Ranked by UNDP, 1984 *** |
|---|---|---|---|---|---|---|
| 1 | Abule Ijesa | Slum | 108 | 26,541 | Land | 9 |
| 2 | Agege | Slum | 74 | 91,576 | Land | 12 |
| 3 | Agidingbi | Slum | 22 | 7631 | Land | 13 |
| 4 | Aiyetoro | Slum | 17 | 16,127 | Land | 20 |
| 5 | Ajegunle | Squatter | 244 | 358,474 | Swamp and Land | 11 |
| 6 | Alausa village | Slum | 26 | 29,822 | Land | 18 |
| 7 | Alli oromoko | Slum | 5 | 8330 | Land | 21 |
| 8 | Amukoko | Squatter | 117 | 67,175 | Land | 15 |
| 9 | Badia | Squatter | 169 | 324,005 | Swamp and Land | 4 |
| 10 | Bariga | Slum | 64 | 100,446 | Land | 27 |
| 11 | Egbe Bolorunpelu | Slum | 80 | 41,493 | Land | 38 |
| 12 | Ejigbo | Slum | 62 | 38,318 | Land | 33 |
| 13 | Ijeshatedo/Itire | Slum | 57 | 95,981 | Land | 25 |
| 14 | Ijora Oloye | Squatter | 19 | 15,263 | Land | 6 |
| 15 | Iju | Slum | 65 | 51,531 | Land | 34 |
| 16 | Ikorodu | Slum | 69 | 92,362 | Land | 32 |
| 17 | Ilaje | Squatter | 82 | 69,971 | Water and Land | 5 |
| 18 | Ipaja | Slum | 475 | 58,941 | Land | 40 |
| 19 | Ipodo Ikeja | Slum | 17 | 14,994 | Land | 7 |
| 20 | Iwaya | Squatter | 116 | 133,279 | Water and Land | 8 |
| 21 | Lagos Island | Slum | 461 | 72,384 | Land | 22 |
| 22 | Lawanson-Ikate | Slum | 27 | 47,050 | Land | 36 |
| 23 | Makoko | Squatter | 77 | 149,095 | Water and Land | 3 |
| 24 | Marine beach | Slum | 17 | 24,128 | Land | 42 |
| 25 | ** Maroko | Squatter | 312 | 0 | Land | 1 |
| 26 | Mile 12 market | Slum | 11 | 47,514 | Land | 31 |
| 27 | Mushin-Idiaraba | Slum | 44 | 71,143 | Land | 16 |
| 28 | Obalende | Slum | 62 | 27,134 | Land | 41 |
| 29 | Ogba west | Slum | 36 | 13,213 | Land | 23 |
| 30 | Ogudu | Squatter | 45 | 13,195 | Land | 39 |
| 31 | Okobaba | Squatter | 35 | 32,221 | Water and Land | 19 |
| 32 | Olaleye-Iponri | Slum | 42 | 59,355 | Land | 2 |
| 33 | Olusosun village | Slum | 9 | 11,729 | Land | 30 |
| 34 | Onigbongbo | Slum | 50 | 37,943 | Land | 37 |
| 35 | Oregun | Slum | 67 | 71,584 | Land | 24 |
| 36 | Orile-Agege | Slum | 13 | 18,613 | Land | 29 |
| 37 | Oshodi market | Slum | 16 | 24,128 | Land | 35 |
| 38 | Otto | Slum | 17 | 25,438 | Swamp and Land | 10 |
| 39 | Oworonshoki | Slum | 49 | 41,822 | Land | 28 |
| 40 | Sari-Iganmu | Squatter | 100 | 36,362 | Land | 14 |
| 41 | Shogunle | Slum | 31 | 65,511 | Land | 17 |
| 42 | Shomolu | Slum | 39 | 21,991 | Land | 26 |
| Land Use and Land Cover | 1984 | 2020 | |||
|---|---|---|---|---|---|
| F1 | Accuracy | F1 | Accuracy | ||
| 1 | Built-up (impervious surface) | 0.93 | 0.96 | 0.85 | 0.83 |
| 2 | Non-Built-up | 0.97 | 0.96 | 0.80 | 0.83 |
| Classes (2020) | Description |
|---|---|
| Gentrified areas | Deprived areas in 1984 that transformed into non-deprived areas |
| Persistent deprived areas | Deprived areas in 1984 that continue to be deprived |
| Newly deprived areas | Non-built-up areas in 1984 that transformed into deprived areas in 2020 |
| Other urban areas | Non-built-up areas that transformed into a non-deprived urban area in 2020 |
| Type | Variable Description | Data Type | Justification | Data Source |
|---|---|---|---|---|
| Target variable | Level of gentrification | Categorical (high/low) | Landsat (1984), Sentinel 2 (2020), GE (2021) | |
| General slum characteristics | Tenancy of community (1984) Legal community, squatter community | Categorical (legal, illegal) | The security of tenure drives slum evictions in Lagos [100]. This allows easier access to rebranding an area into a high/medium-income residential area | [82] |
| Dominant land use type | Categorical (residential, industrial and commercial) | There is a cyclical pattern of land use conversion during the gentrification process [86,101] | Survey | |
| Proportion of the deprived area in each slum in 1984 | Continuous (range from 0–1) | Smaller slum settlements are more vulnerable to transformation than bigger ones [85] | Landsat image 1984 | |
| Location | Closeness to open markets | Categorical (Yes, No) | Slums develop close to the informal economy and job opportunities [84,102]; residents may resist gentrification due to job opportunities in the open market and industrial area | Survey |
| Closeness to industrial land use | Categorical (Yes, No) | |||
| Closeness to high residential area | Categorical (Yes, No) | Slums close to high and medium residential areas tend to undergo gentrification [87,103] | ||
| Closeness to medium residential area | Categorical (Yes, No) | |||
| Closeness to other slum communities | Categorical (Yes, No) | Closeness to other slums may allow residents to move to other slums | ||
| Closeness to major roads | Categorical (Yes, No) | Roads as an infrastructure facility promote the gentrification process [16] | ||
| Closeness to government buildings | Categorical (Yes, No) | Nearness to government buildings allow easier access to slums [12], which, in Lagos, may influence the gentrification process in slums | ||
| Socio-economic | General income level of residents | Categorical (high, middle, and low-income) | The gentrification process involves the replacement of low-income with middle/high-income residents [15]. | Survey/interview |
| Influence of social groups: presence of community group association and non-governmental organization | Categorical (Yes, No) | Social capital influences resilience in slums. Non-governmental Organization, community development groups, worship centers, traditional palaces, town halls and other communal places can strengthen social networks, which can influence the gentrification process in slums [60,104,105] | Survey | |
| Presence worship centers (church and mosque) | Categorical (Yes, No) | |||
| Presence of palace in slum | Categorical (Yes, No) | |||
| Presence of communal place (Communal place includes town hall, sport area developed by the community) | Categorical (Yes, No) | |||
| Political /Government influence | Presence of government influence projects in area | Categorical (Yes, No) | Government drives gentrification based on their vision for the city [69]. This can be assessed using their activities and government-led projects | Survey |
| Slum clearances | Categorical (Yes, No) | Slum clearances pave the way for the gentrification process in Lagos. Slums cleared in Lagos have been converted to high/medium-income residential areas [28] | ||
| Type of slum clearance ** | Categorical (limited, significant) | Clearance of certain areas in slums create vacant plots for new developers/investors to capitalize on thereby initiating gentrification processes [106]. | Survey Landsat image 1984 Sentinel-2 2020 | |
| Facilities * | Availability of public water | Categorical (Yes, No) | Provision of infrastructure and facilities supports the rebranding of an area [37]. | Survey |
| Availability of schools | Categorical (Yes, No) | |||
| Recorded hazards | History of fire outbreak | Categorical (Yes, No) | Fire outbreak and flooding have been used as driving forces for slum clearance and gentrification processes in Lagos [60,87] | Survey |
| History of flooding | Categorical (Yes, No) |
| Response | Frequency (%) | |
|---|---|---|
| Design of new residential houses | Block of flats | 73.8 |
| One single family houses | 11.9 | |
| Face-to-face | 9.5 | |
| Others | 4.8 | |
| Dominant ownership of new housing development | Privately | 95.2 |
| Government owned | 2.4 | |
| Mixed | 2.4 |
Disclaimer/Publisher’s Note: The statements, opinions and data contained in all publications are solely those of the individual author(s) and contributor(s) and not of MDPI and/or the editor(s). MDPI and/or the editor(s) disclaim responsibility for any injury to people or property resulting from any ideas, methods, instructions or products referred to in the content. |
© 2024 by the authors. Licensee MDPI, Basel, Switzerland. This article is an open access article distributed under the terms and conditions of the Creative Commons Attribution (CC BY) license (https://creativecommons.org/licenses/by/4.0/).
Share and Cite
Obaitor, O.S.; Stellmes, M.; Lakes, T. Exploring Spatio-Temporal Pattern of Gentrification Processes in Intracity Slums in the Lagos Megacity. Geographies 2024, 4, 231-252. https://doi.org/10.3390/geographies4020015
Obaitor OS, Stellmes M, Lakes T. Exploring Spatio-Temporal Pattern of Gentrification Processes in Intracity Slums in the Lagos Megacity. Geographies. 2024; 4(2):231-252. https://doi.org/10.3390/geographies4020015
Chicago/Turabian StyleObaitor, Olabisi S., Marion Stellmes, and Tobia Lakes. 2024. "Exploring Spatio-Temporal Pattern of Gentrification Processes in Intracity Slums in the Lagos Megacity" Geographies 4, no. 2: 231-252. https://doi.org/10.3390/geographies4020015