Article

Geovisualization of Historical Geospatial Data: A Web Mapping Application for the 19th-Century Kaupert’s Maps of Attica

by
Georgios Lampropoulos
1,*,
George Panagiotopoulos
2,
Christina Giannakoula
1 and
Alexandros Kokkalas
1
1
Dipylon Society, 6 Omirou Str., 10564 Athens, Greece
2
Metsovio Interdisciplinary Research Center, National Technical University of Athens, 9 Iroon Polytechniou Str., 15780 Athens, Greece
*
Author to whom correspondence should be addressed.
Geographies 2023, 3(2), 398-415; https://doi.org/10.3390/geographies3020021
Submission received: 31 March 2023 / Revised: 24 May 2023 / Accepted: 6 June 2023 / Published: 12 June 2023
(This article belongs to the Special Issue Geovisualization: Current Trends, Challenges, and Applications)

Abstract

:
This paper presents the development procedure and significance of a web mapping application designed for disseminating, exploring, and analyzing Kaupert’s 19th-century Maps of Attica, Greece. The application facilitates historical and geographical study by providing access to high-resolution map images and overlaying multiple vector layers of geospatial data. The paper outlines the methods used to create the application, which includes the process of interpreting, digitizing, and organizing the original mapped data, georeferencing the historical cartographic sheets, and developing the web-based mapping application. The results of this work include a comprehensive and interactive digital reference tool for studying the ancient topography of Attica, as well as a framework for future research. Overall, this work highlights the potential of digital technologies to transform the way we approach and study historical maps and other cultural artifacts.

1. Introduction

1.1. The 19th-Century Topographic-Archaeological Mapping of Attica

Historical maps are essential records that provide valuable insights into the past [1,2,3,4], often being the only available source for reconstructing historical events. However, the reliability of such maps can vary depending on factors such as the period they were created in, the techniques employed, and the skill level of the cartographer [5,6]. Therefore, researchers need to be mindful of the uncertainties present in historical maps, as they can pose challenges for analyzing data over specific time frames and require careful consideration in developing methodologies. In addition, the limited accuracy of early cartographic maps adds further complexity to this issue [7].
Nevertheless, the Maps of Attica, created by Kaupert and his team, is a remarkable example of a comprehensive topographic study of a complex region. Immediately after the establishment of the German Archaeological Institute in Athens in 1874, the institute’s mastermind, the archaeologist Ernst Curtius, expressed the necessity of mapping the Attic land on single topographic-archaeological maps, as the area has been a cradle of civilization since ancient times and was full of archaeological monuments and remains. The German Empire supported this venture, intending to gain access to the East and gain primacy in the study of the classical world. However, to complete the archaeological mapping of the region, geographical background maps were required. As the newly established Greek nation still needed to have ready-constructed ones, the decision was taken to create them from scratch [8]. Thus, the Maps of Attica, a two-decade project (1875–1894), focus not only on specific topographic elements, such as the road network, settlements, or place names but also constitute a comprehensive topographic study of the area. Moreover, the fact that a region of complex topography with remote areas and rugged terrain was mapped, resulting in a series of maps of such detail using the equipment of the time, indicates the professional work of Kaupert and his team. Furthermore, these results are in accordance with prior research examining the surveys conducted by German topographers in the Attica region [9,10,11].

1.2. Web Mapping Applications in Spatial Humanities and Cultural Heritage
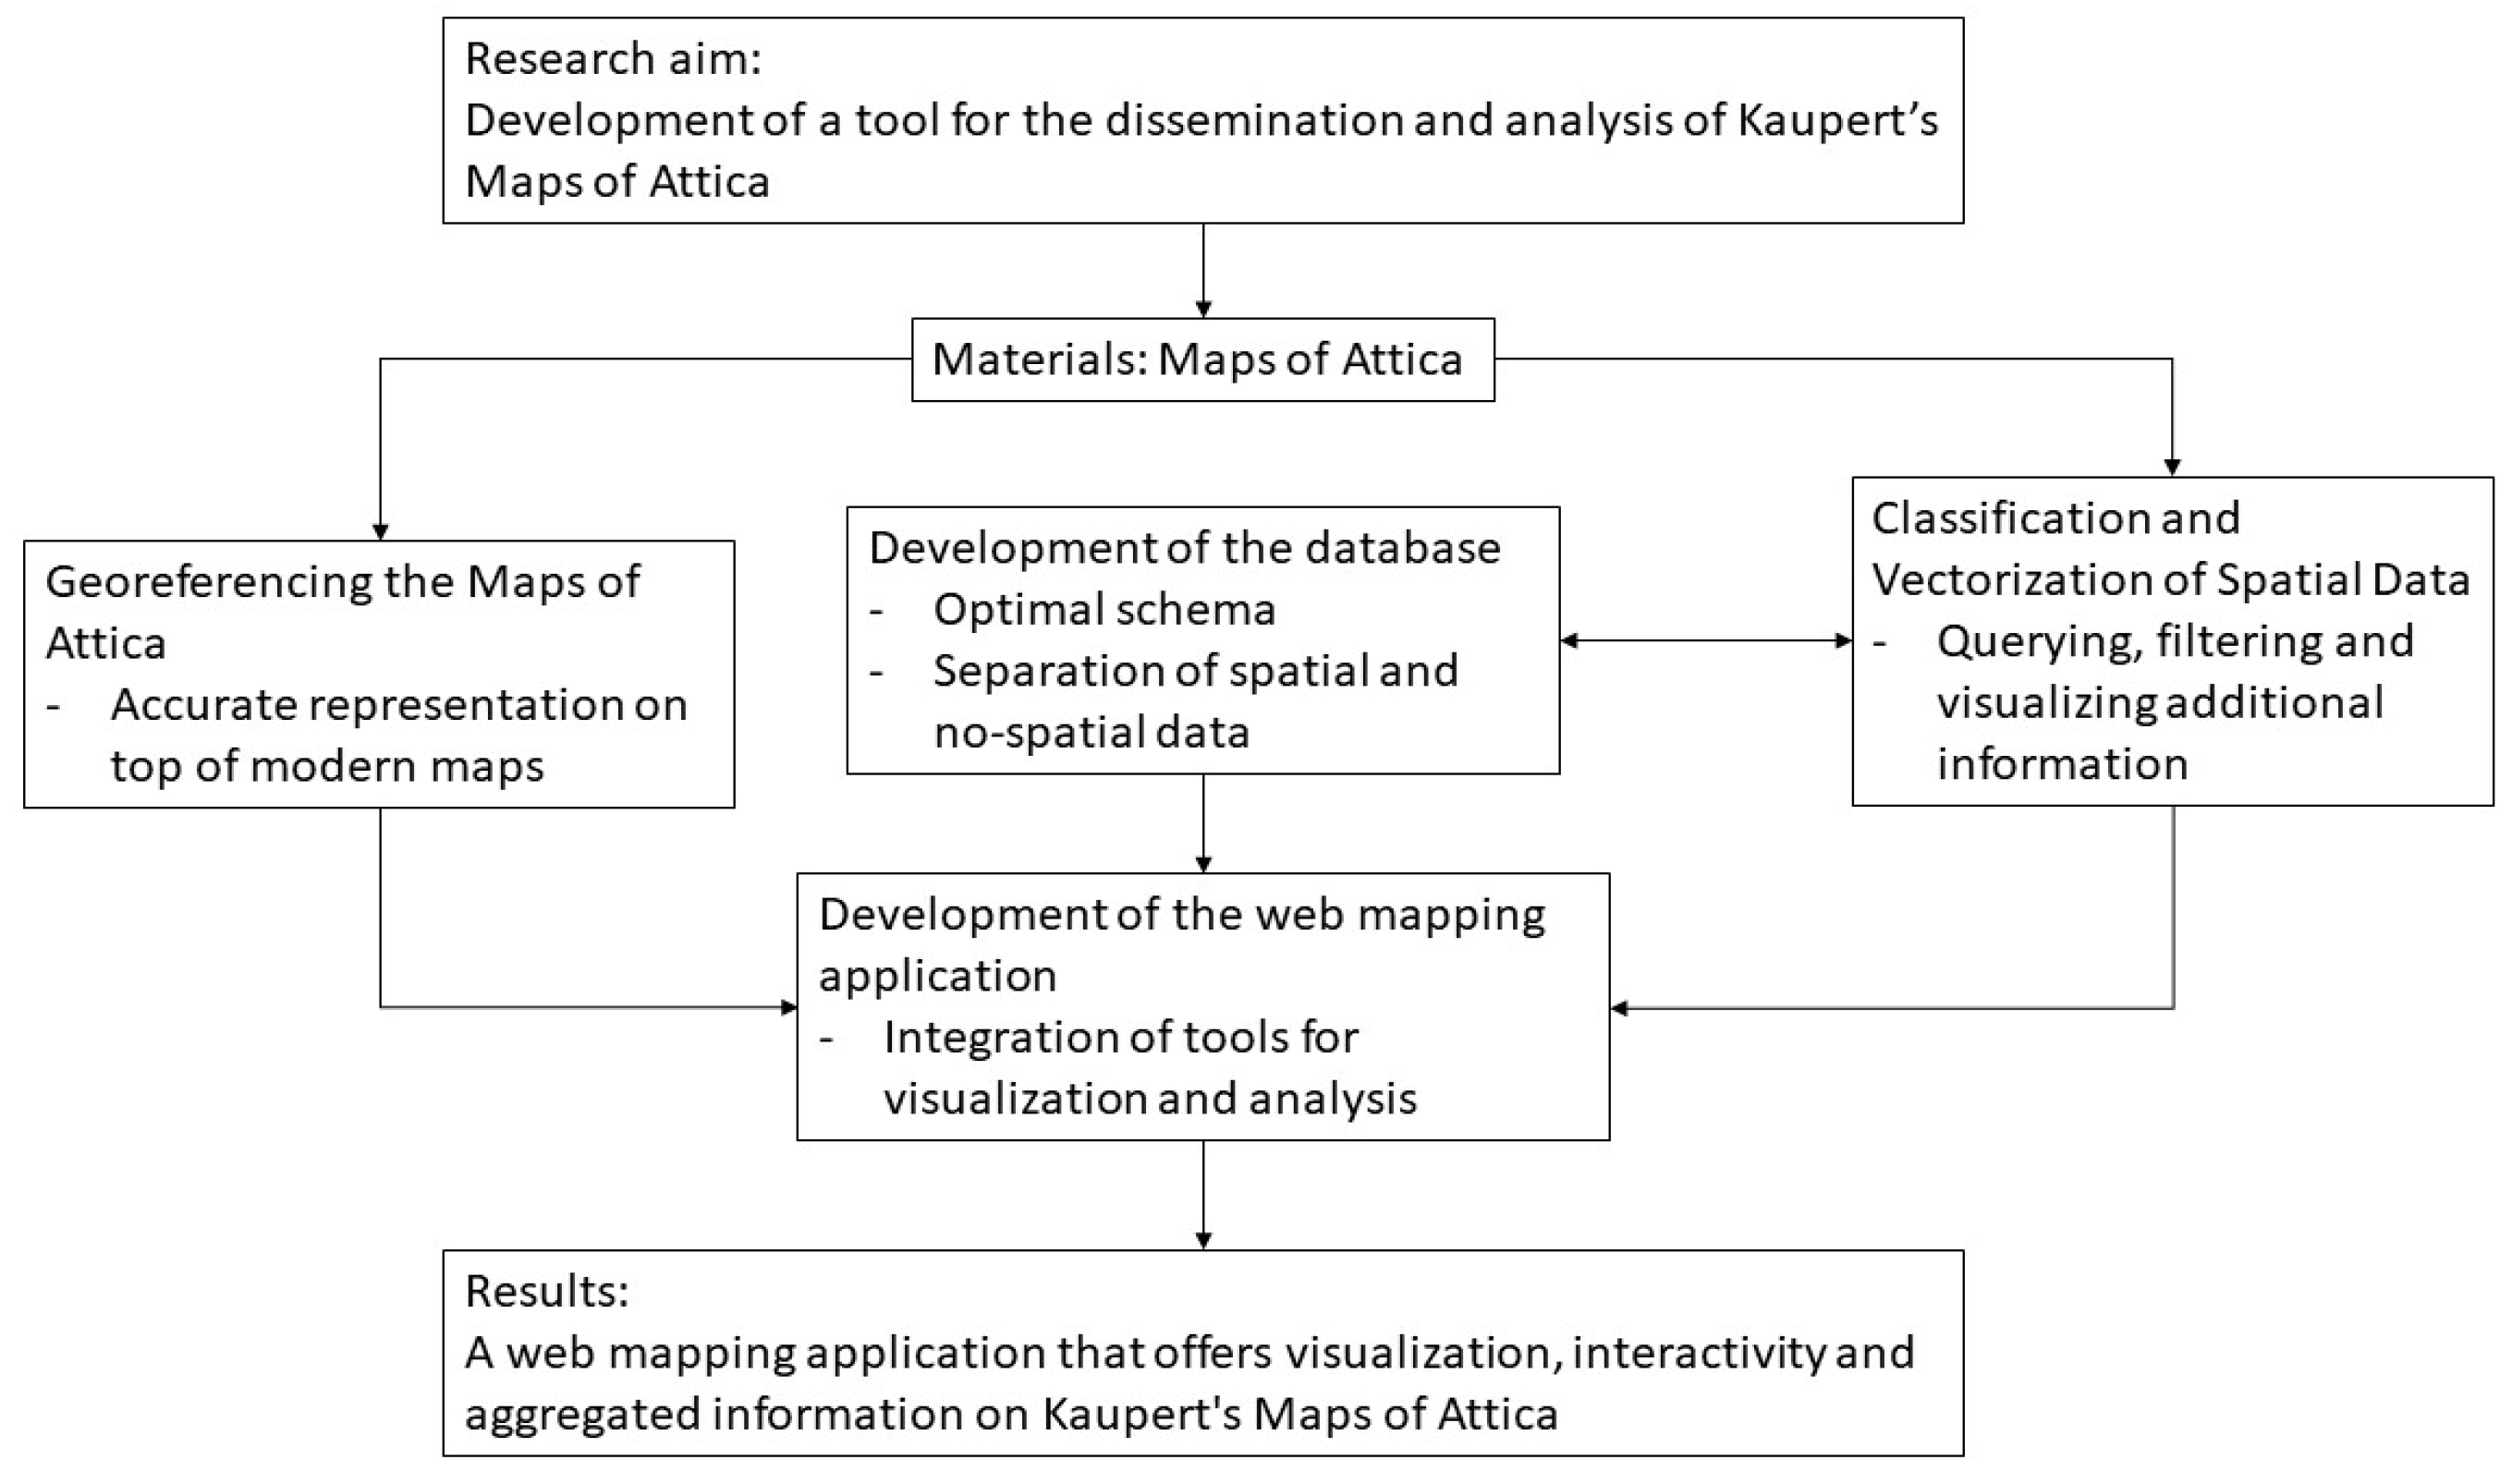
Web mapping applications provide a powerful tool for scholars in the field of spatial humanities to explore, visualize, and analyze various forms of geographical data and maps [12]. They play a crucial role in spatial humanities research as they facilitate the processing and analysis of vast amounts of spatial data. These systems allow researchers to create interactive maps, query and analyze data, and share their findings with other scholars in a way that is easy to access and interpret.
In spatial humanities research, web mapping can be used to study various phenomena that have spatial components, such as migration patterns, cultural landscapes, and urban development [13]. Such tools can also be utilized to map and analyze historical events, such as the movements of armies, trade routes, and the spread of disease [14,15].
Web mapping tools can also help scholars explore and understand complex spatial relationships. For example, the visualization of historical data on a map can help researchers identify patterns and relationships that might not be immediately apparent in text-based sources. This can be particularly useful in fields such as archaeology, where researchers can use digital mapping to analyze the distribution of artifacts across a landscape [16].
The interactivity offered by digital mapping allows users to filter the data at the desired scale and can include a plethora of additional information that allows interdisciplinary analysis [17]. The addition of the web element offers more possibilities for the dissemination and exchange of data among researchers.
Web mapping applications are widely used in cultural and archaeological heritage to visualize and share information about historical sites, monuments, artifacts, and landscapes [18]. Such applications offer users the opportunity to explore the cultural heritage of an area in a visual and interactive way, allowing them to experience the heritage site from a virtual perspective [19]. Additionally, web mapping applications can be used to create digital archives of cultural heritage data, providing a more accessible and sustainable way to preserve cultural heritage [20].
There are a few examples of cultural heritage web mapping applications, such as the “Mapping Ancient Athens” project (https://mappingancientathens.org, accessed on 30 March 2023) and the “Kitchener’s survey of Cyprus 1878–1883” project (https://kitchener.hua.gr, accessed on 30 March 2023). Both aim to provide a better understanding of historical locations and their significance. For instance, the “Mapping Ancient Athens” project unveils an unknown side of Athens by mapping rescue excavations and highlighting connections between archaeological sites and the present-day urban landscape. It makes vast amounts of archaeological data more accessible to a broader audience, including researchers, professionals, citizens, and visitors [21]. Similarly, the “Kitchener’s survey of Cyprus 1878–1883” project documents and arranges information from Kitchener’s historical map of Cyprus, making it easily accessible to users via a dedicated web application. The online application encourages the sharing and utilizing of this data by individuals interested in historical cartography and geography [22]. Both projects allow for basic and advanced searches, and the data are presented in a user-friendly format to appeal to a broad audience.
The effective utilization of web mapping applications in cultural heritage preservation and presentation relies on the development of accurate spatial databases to support detailed digital maps. In this case, the “Karten von Attika in the Era of Digital Humanities” project is achieved through the use of powerful tools and methodologies as the project team was able to effectively manage large quantities of spatial data, which included various types of geographical features and historical maps.
Relevant literature, such as “PostGIS in Action” by Obe and Hsu [23] and “Historical GIS: Technologies, Methodologies, and Scholarship” by Gregory and Ell [24], provides valuable guidance and insight for spatial database development in humanitarian studies. The development of this database is in line with emerging trends in historical GIS and the spatial humanities, which emphasize the importance of GIS and related technologies for humanities scholarship [24,25]. Other related works that address the implementation and use of GIS-based systems for heritage protection, management [26,27], and tourism [28,29] further demonstrate the versatility and significance of GIS for various fields. Moreover, cultural databases are gaining attention; thus, standards for data collection, organization, and analysis must be improved and widely adopted to address the unique challenges posed by cultural data [30]. The creation of a spatial database, as demonstrated in this project, is therefore essential for managing and analyzing spatial data in a comprehensive and efficient manner.

1.3. Research Aim

The objective of this article is to present the development of an online cartographic platform as a tool to disseminate and analyze Kaupert’s Maps of Attica. Previous studies have demonstrated the usefulness of online mapping applications for this purpose [21,22,31,32]. In this research, state-of-the-art technologies are employed to accomplish the goal, aiming to present Kaupert’s work with utmost precision and dependability, while ensuring easy accessibility for both the scientific community and the general public.

2. Materials and Methods

In this chapter, the materials and methodology employed for the project are presented in detail. A schematic representation of this work can be seen in Figure 1. Firstly, the 24 sheets of 19th-century Kaupert’s Maps of Attica were merged and georeferenced to create a seamless image mosaic. Then, the database was designed to store and link descriptive and geospatial data, facilitating their management and retrieval. Next, the historical-geographical content of the map was interpreted, categorized, and digitized using a GIS environment. The final step of the methodology involves the design and creation of the interactive web mapping application that incorporates all the information gathered and processed in the earlier phases and makes them publicly available.

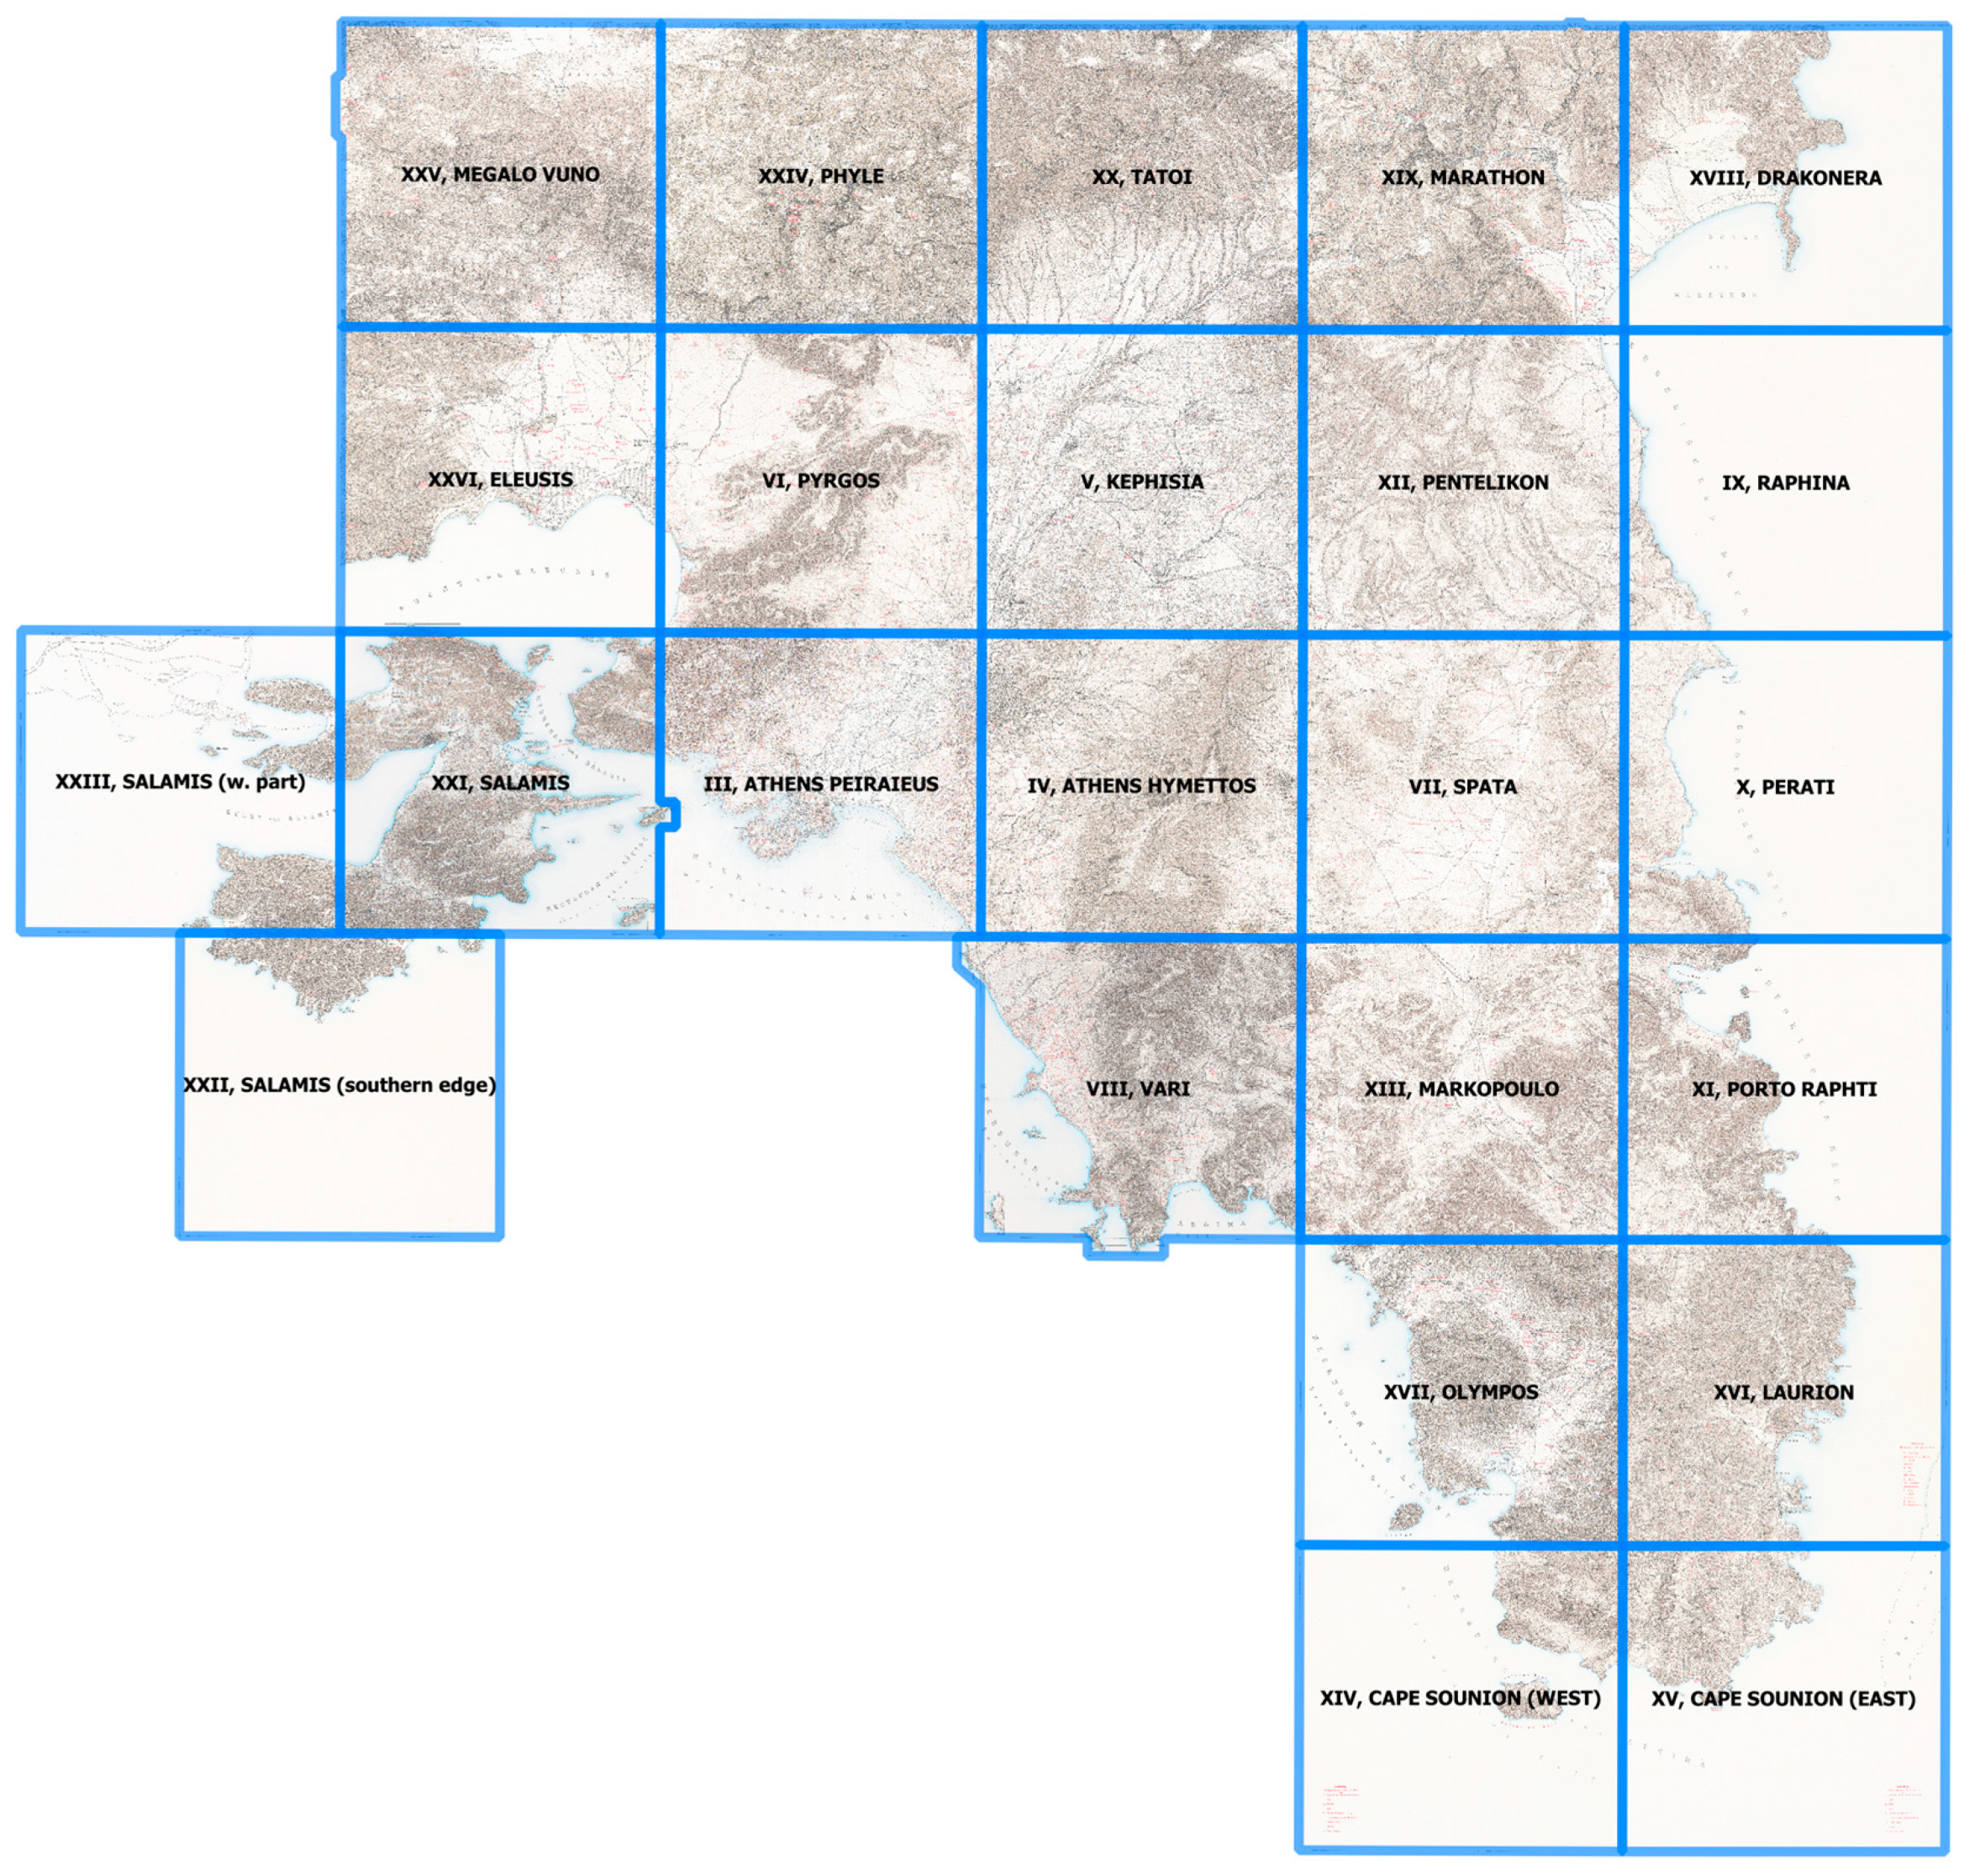
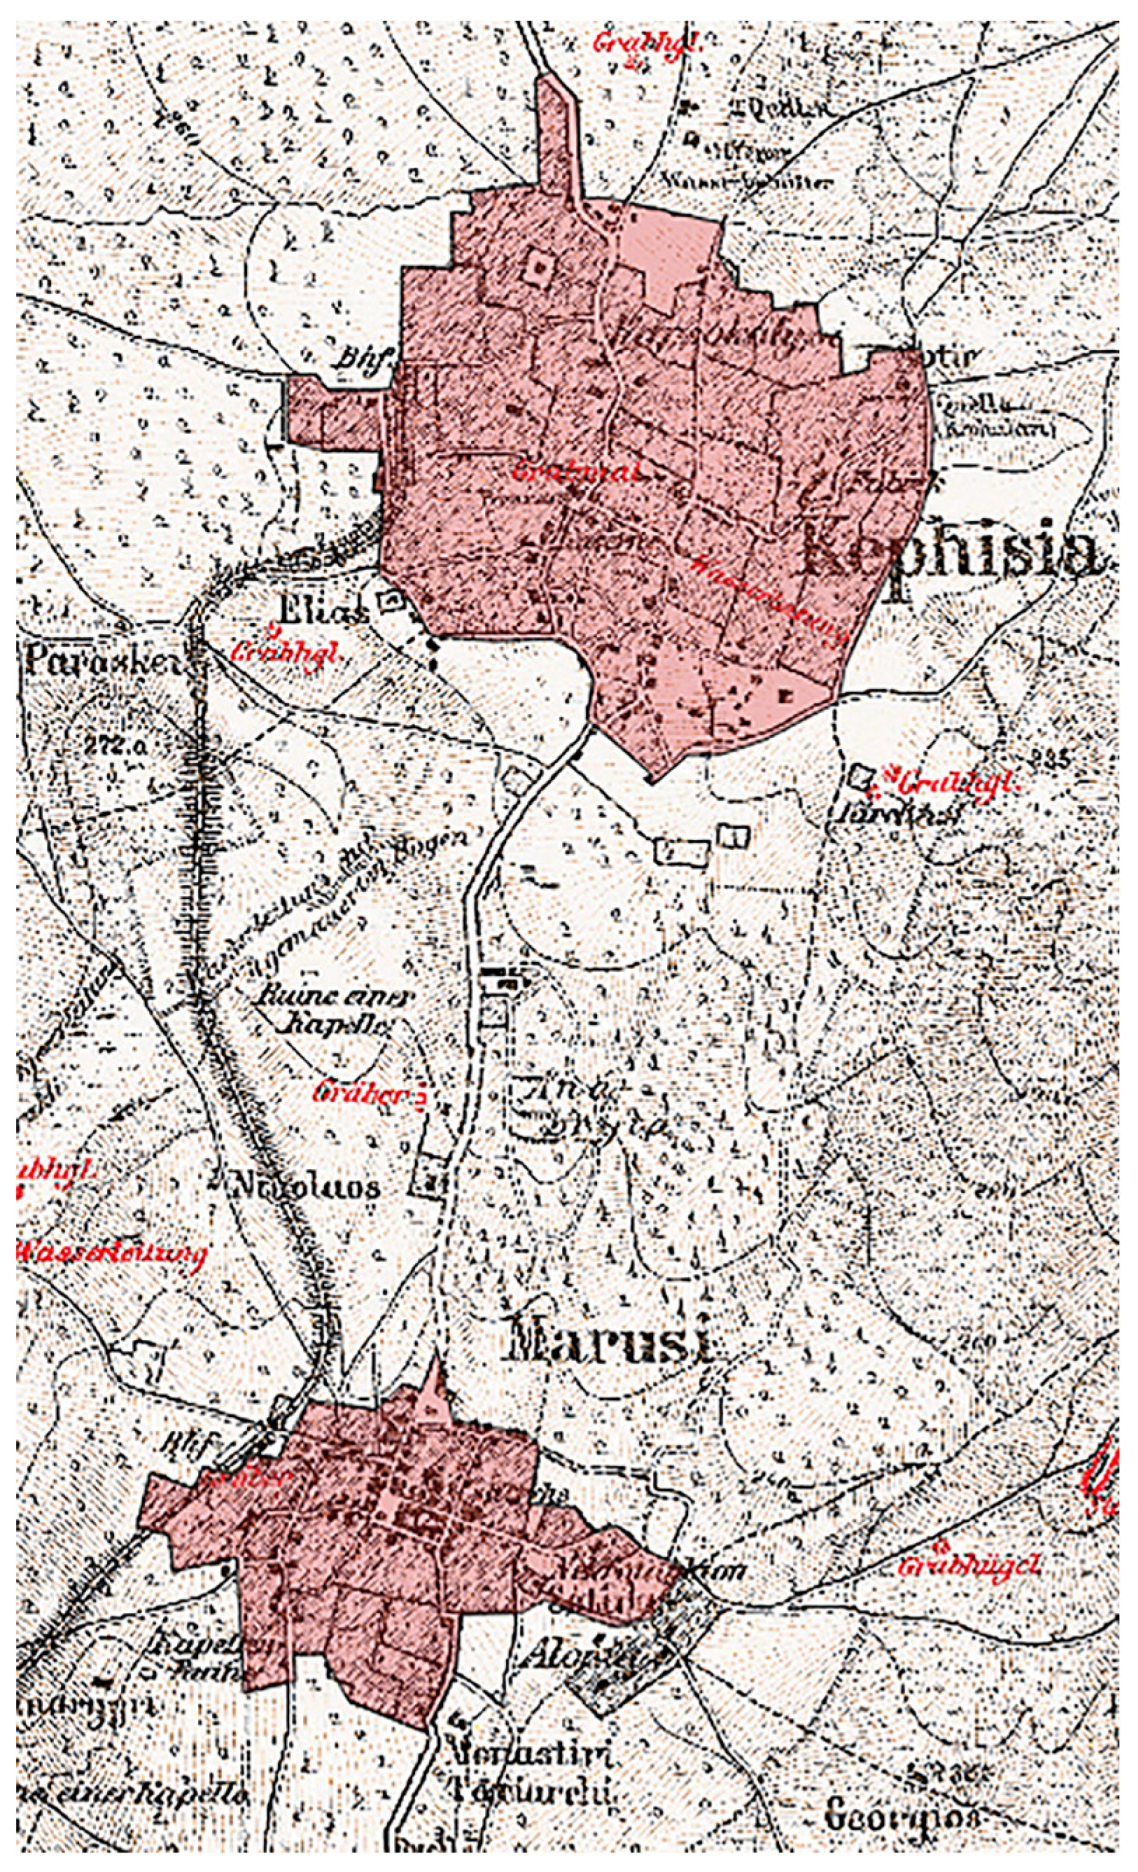
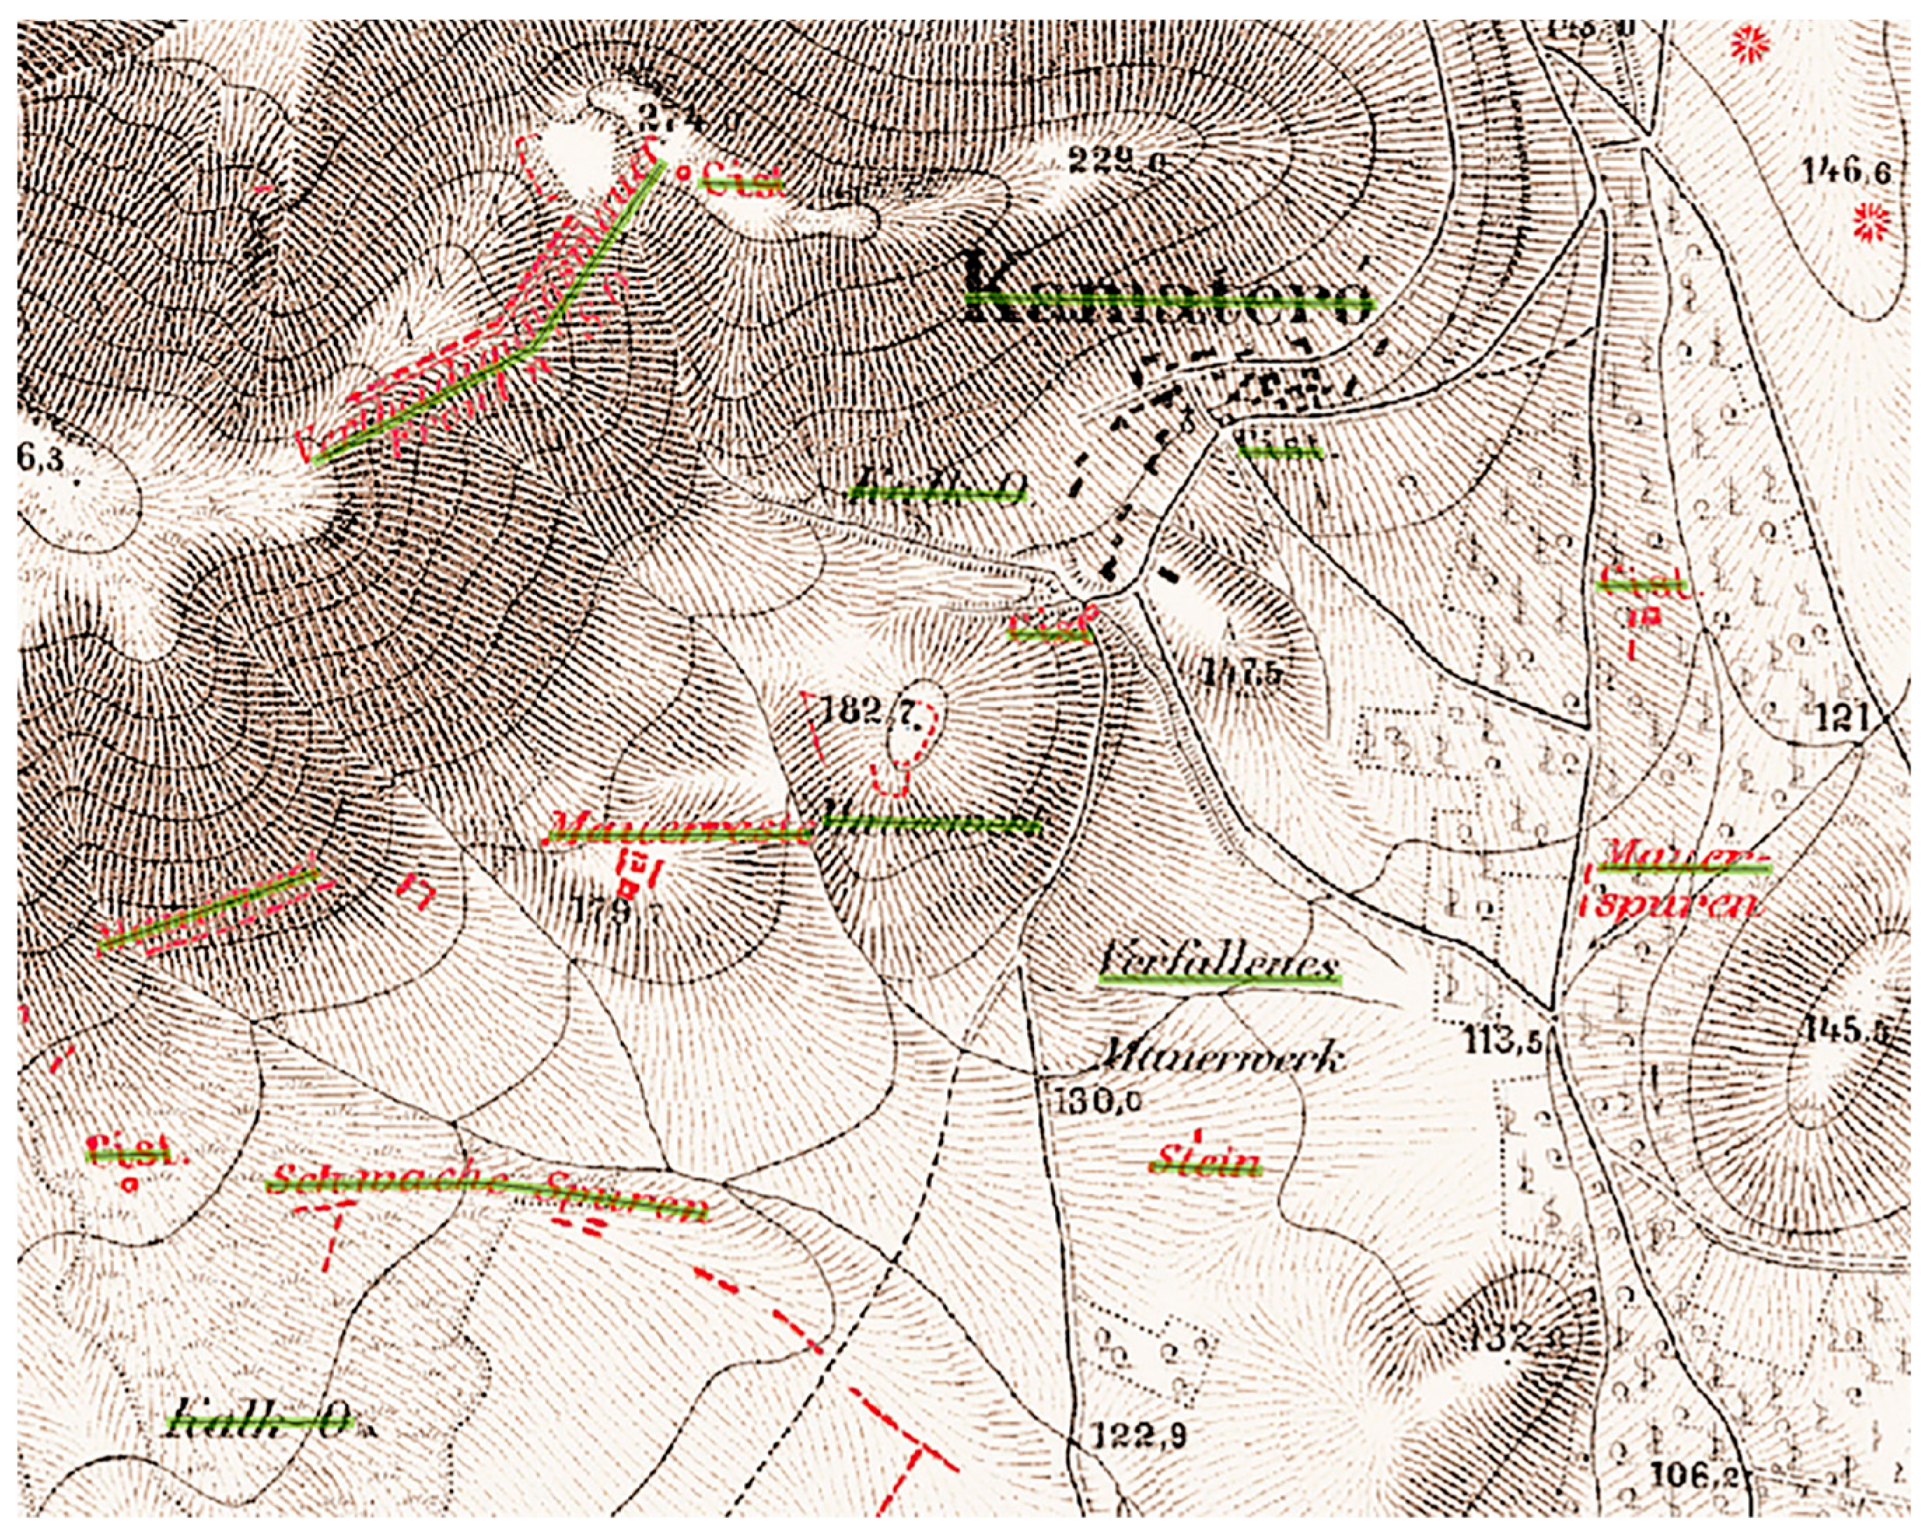
2.1. Cartographic Material

Twenty-four adjacent cartographic sheets from the extensive 19th-century Karten von Attika project [33] were selected for visualization on the cartographic platform, namely those numbered 3–26 (III–XXVI) (Figure 2). On a scale of 1:25,000, these sheets depict the 19th-century attic land to its entire extent. In addition, cartographic sheets 1 and 2 (I and II), which are not among those analyzed, show in greater detail the areas of Athens and Piraeus, respectively, at a scale of 1:12,500. All the above cartographic sheets were acquired from the rich collection of maps of the Melissa publishing house, specifically from the translated in Greek and edited by Manolis Korres publication of Karten von Attika [34]. Moreover, freely accessible cartographic backgrounds were used to identify the ground control points (GCPs) for georeferencing the unified Maps of Attica.

2.2. Methods

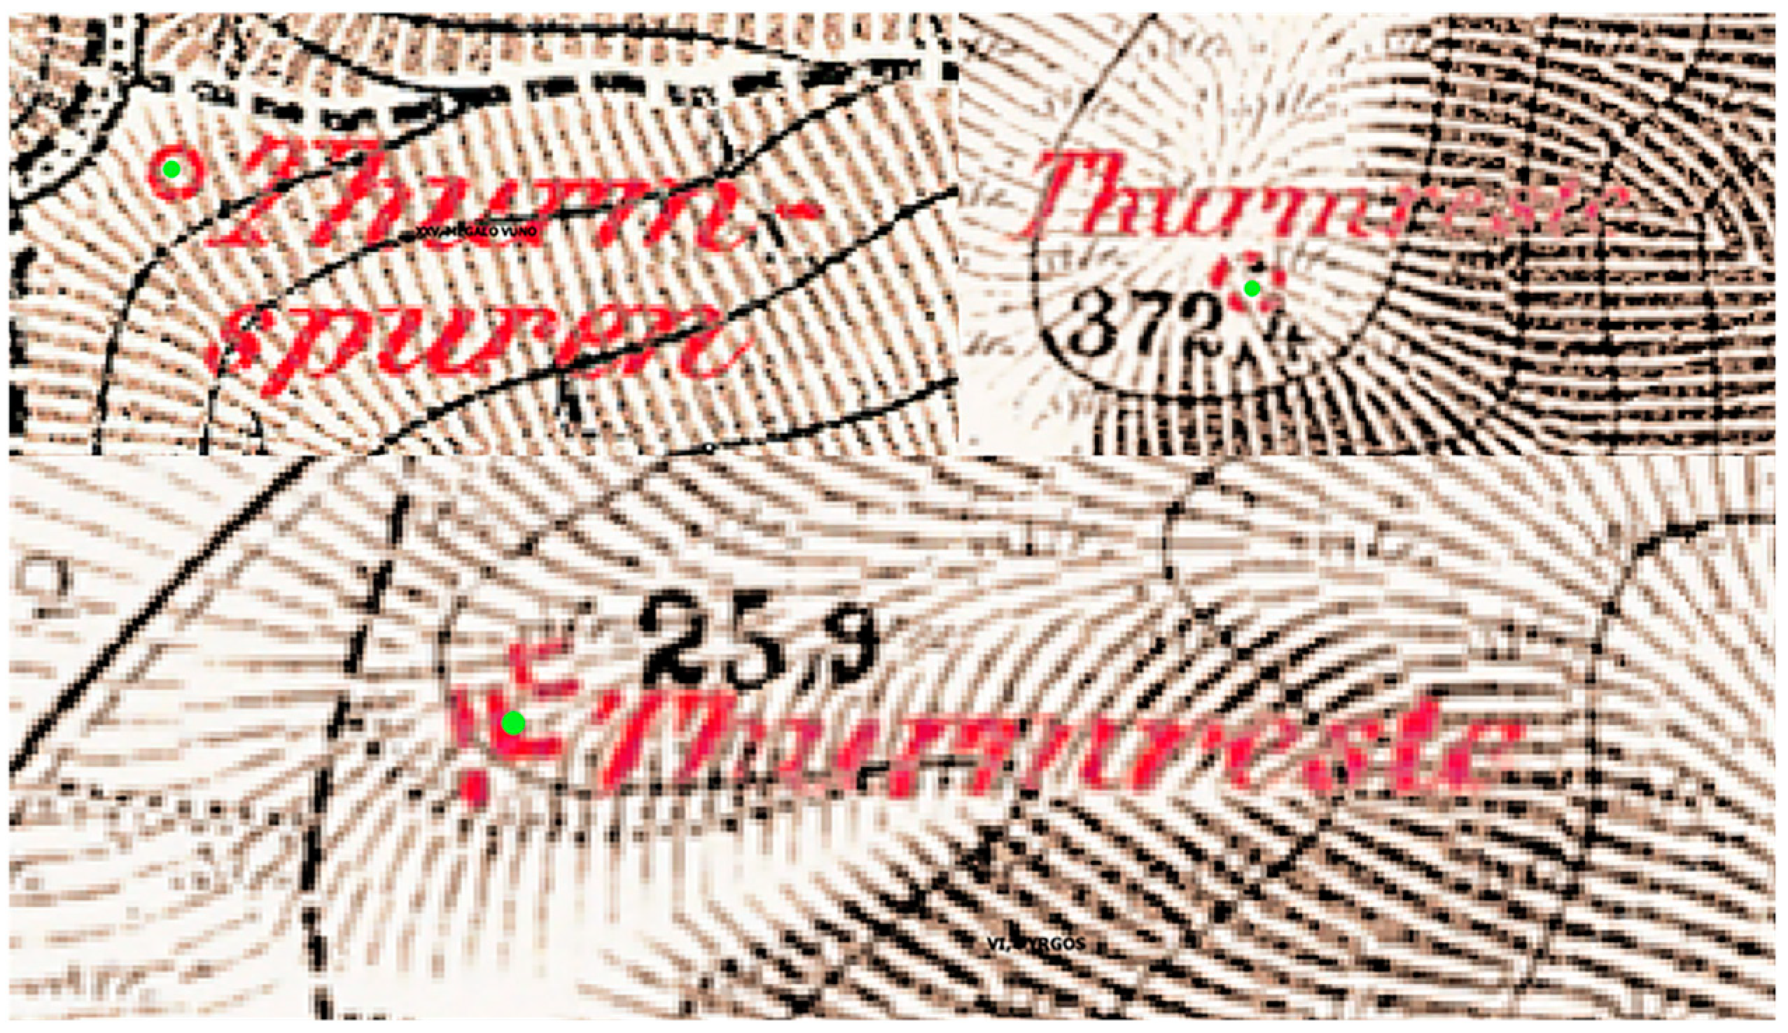
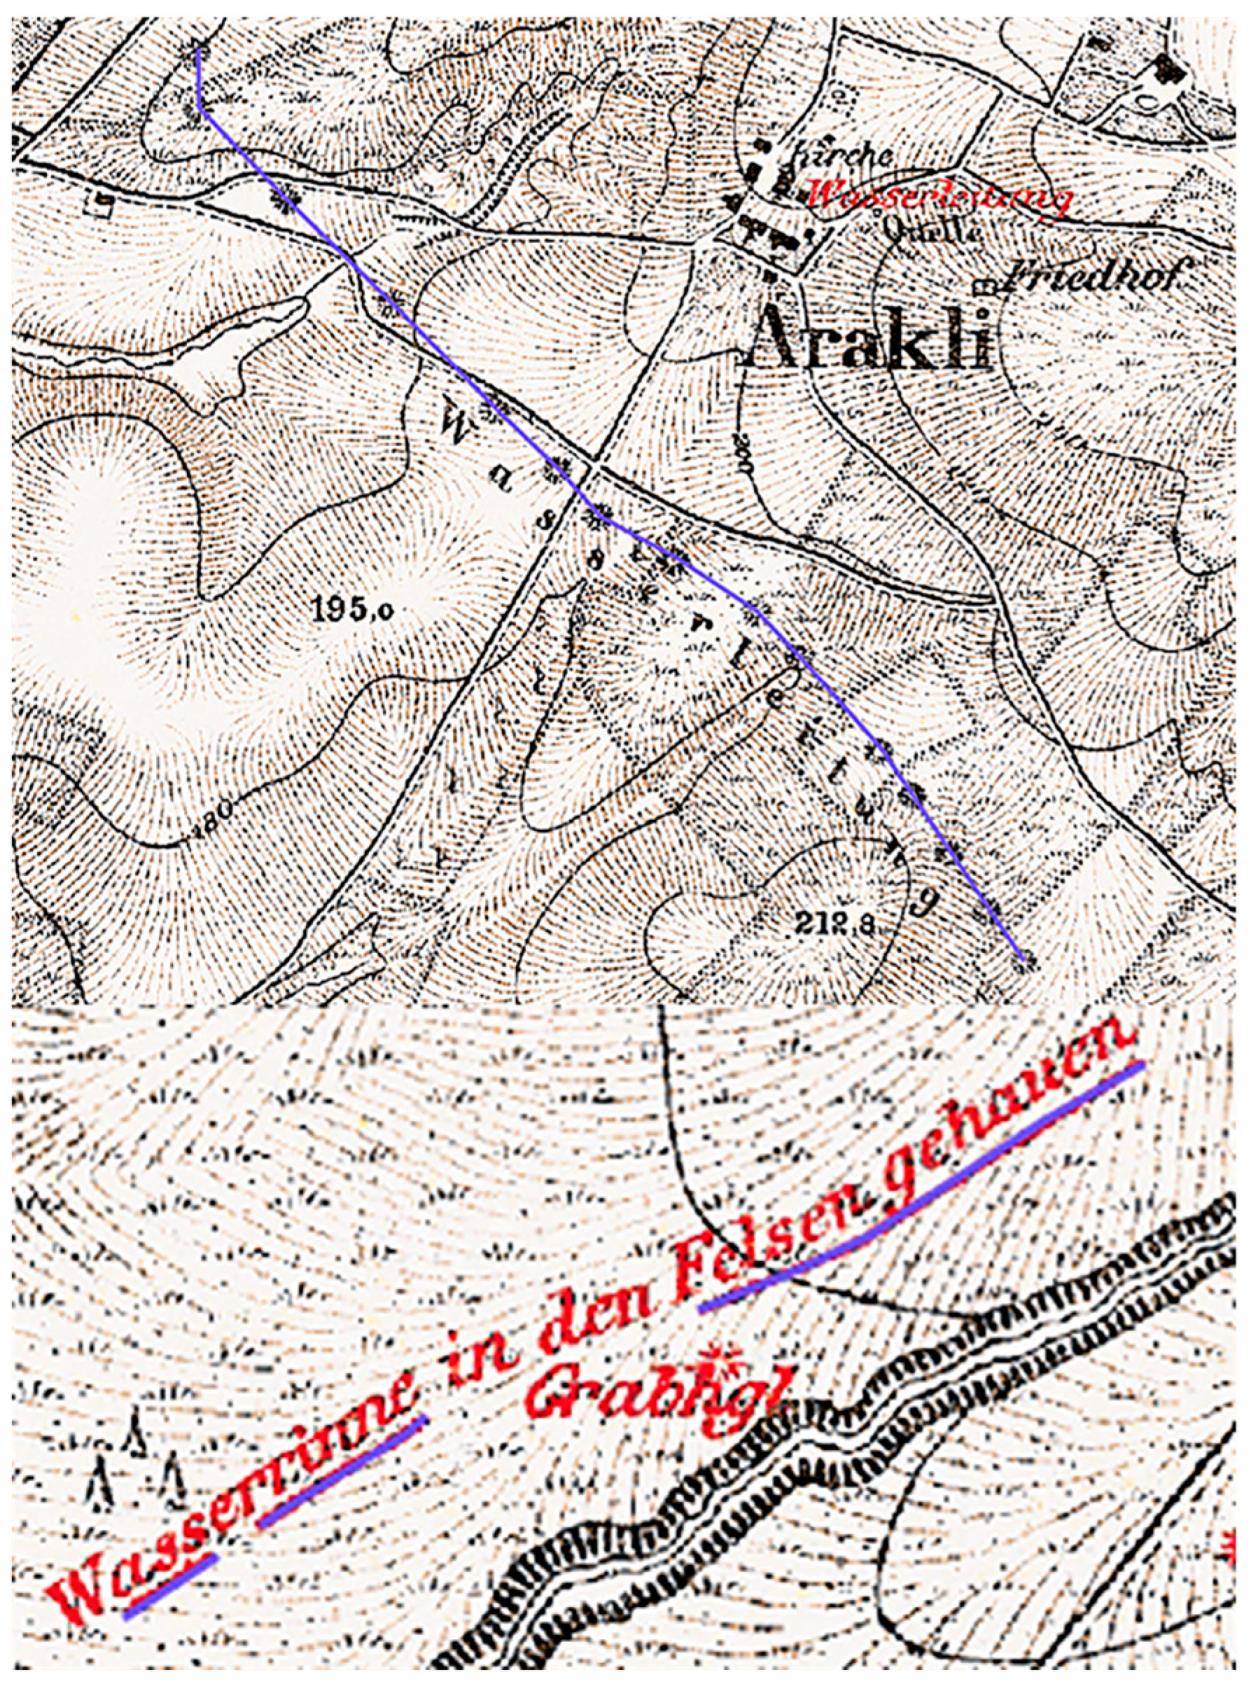
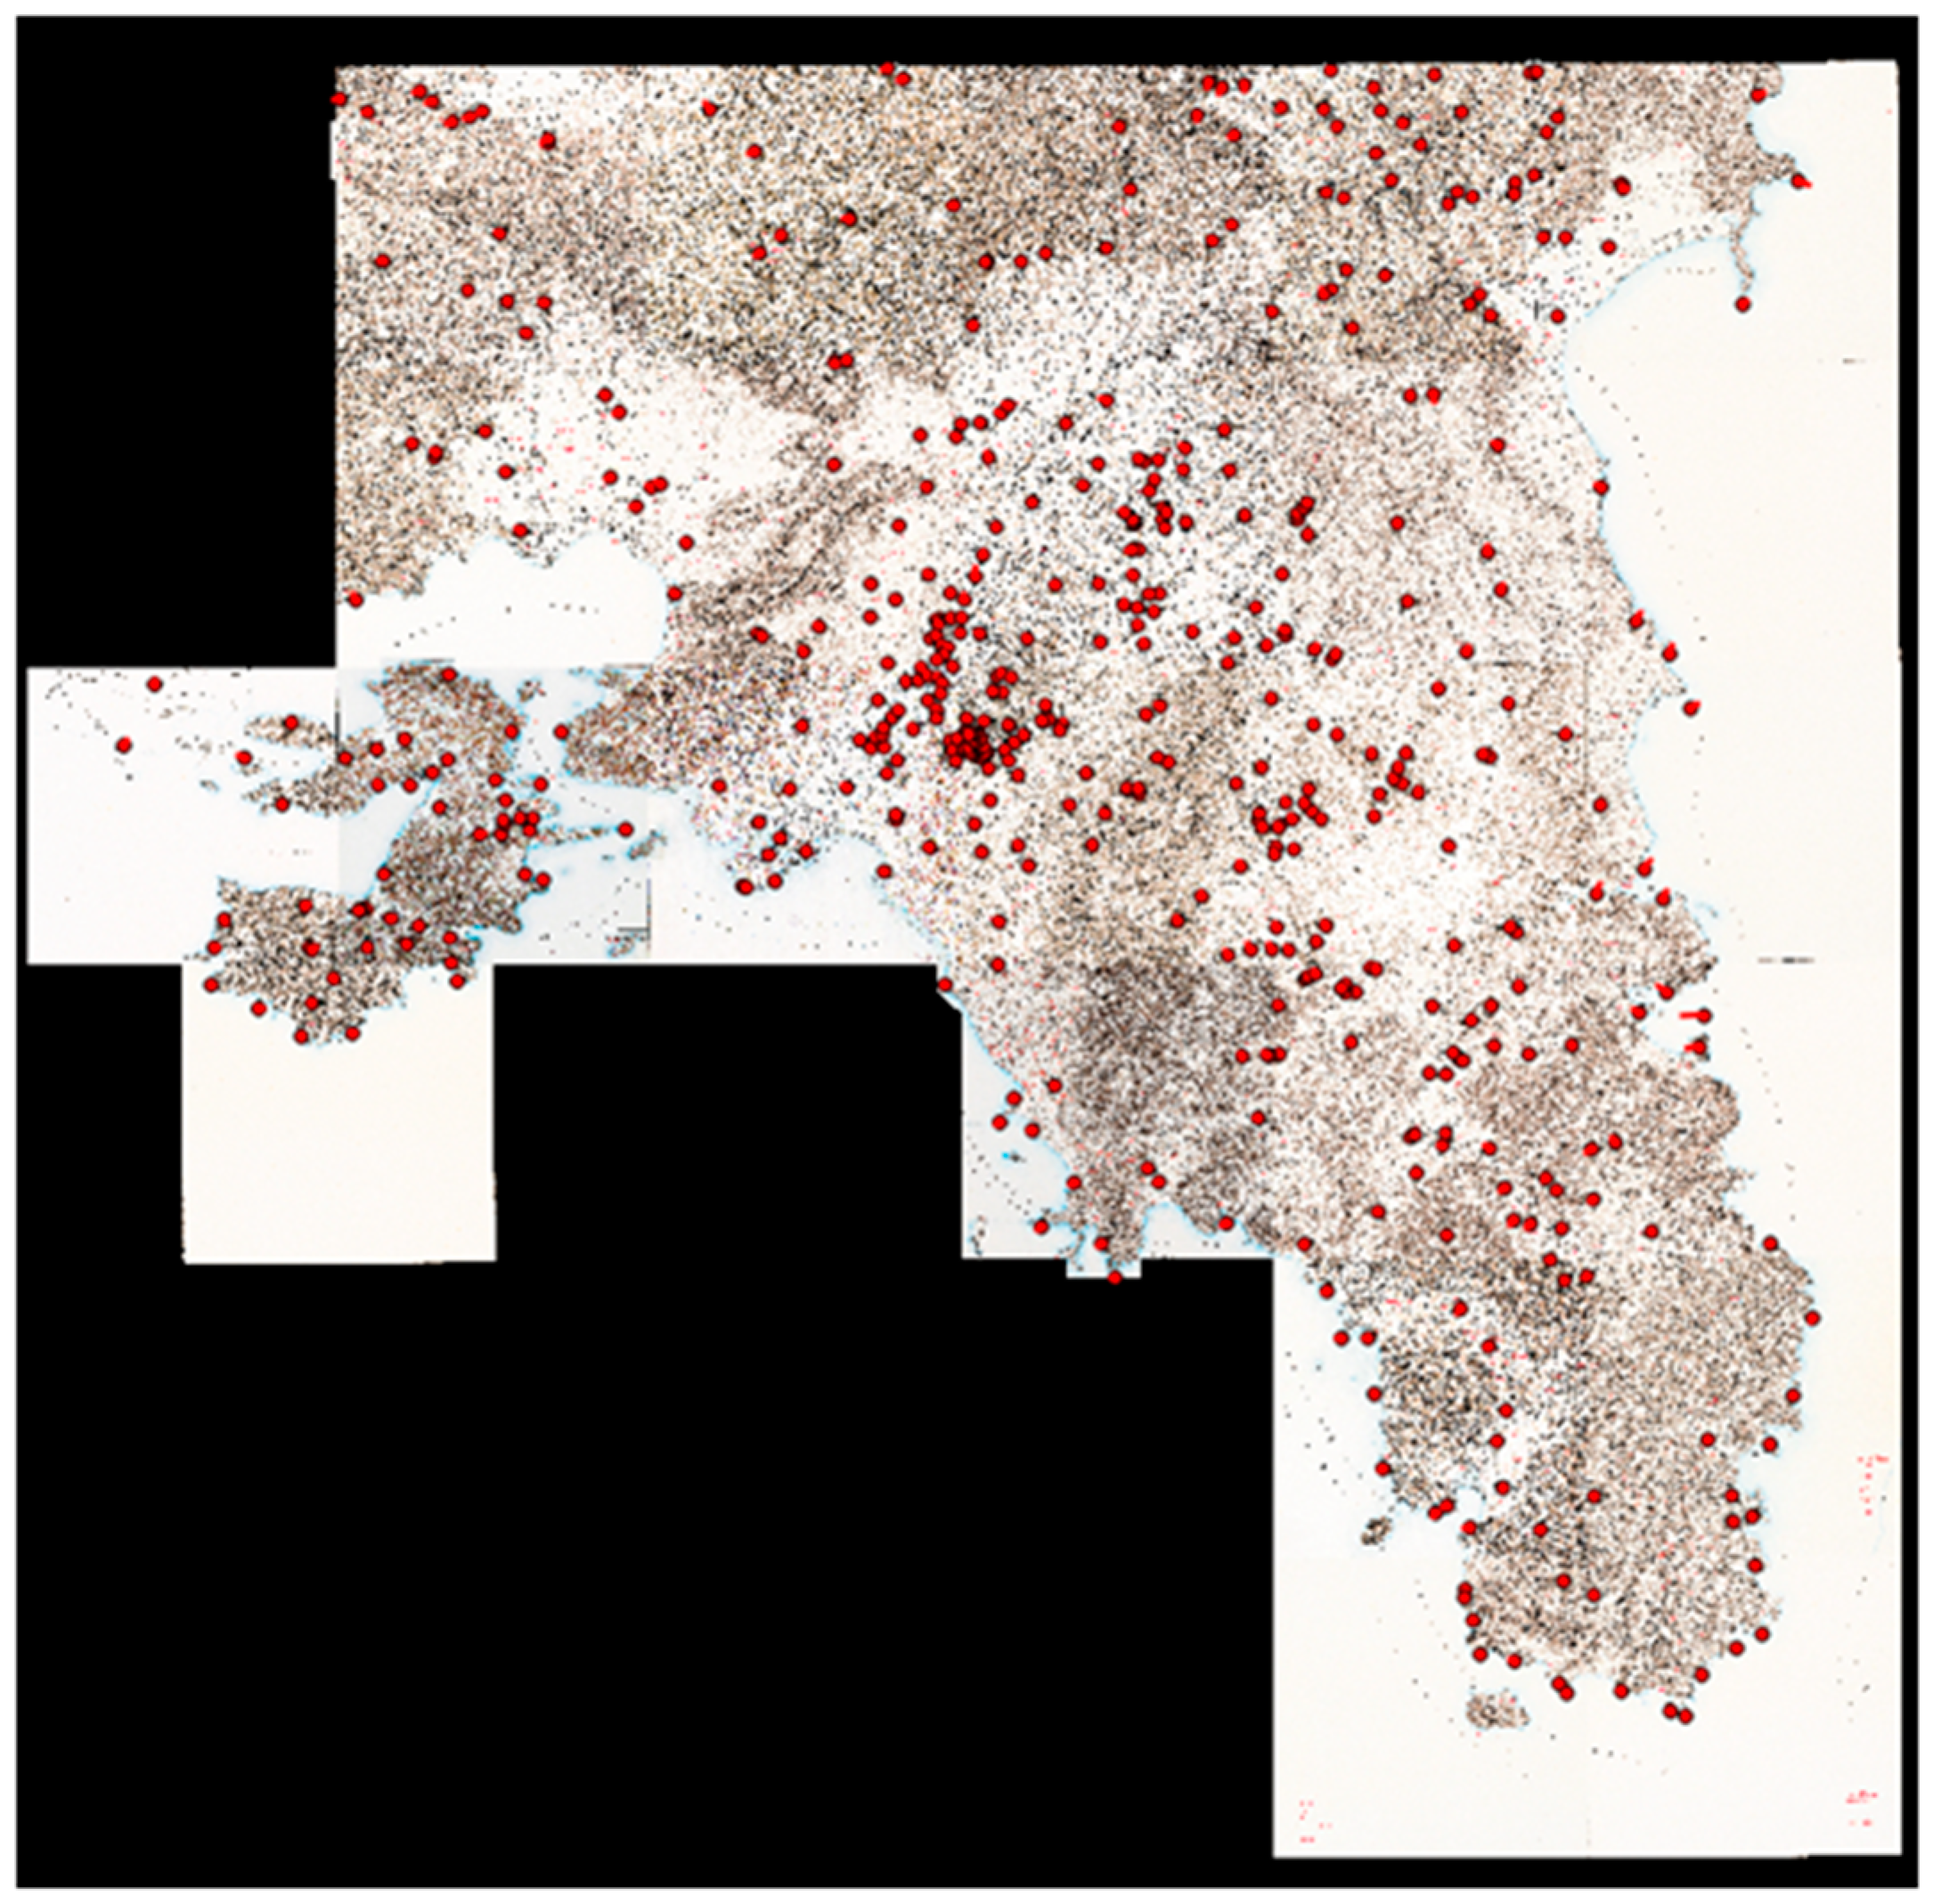
2.2.1. Classification and Vectorization of Spatial Data

In order to systematize the cartographic data depicted on the Maps of Attica, a separation of the data into cartographic signs and cartographic labels was initially carried out. Symbols are identified as signs, while the words that appear on the maps are identified as labels. Recognizing symbols and words is often a demanding process as, despite the excellent resolution of the digitized cartographic sheets, the distinction of the letters in words can be a difficult task (Figure 3).
For the identification of the cartographic signs, information was drawn from symbols of multiple legends provided by the original 19th-century work. The critical legend was the general legend of the cartographic sheet I, “Athens and surroundings”, which contains the most crucial information about the road network, hydrographic network, architectural remains, natural features, buildings, and other human-made constructions. As annotated in the rest of the cartographic sheets, the explanations of the symbols are those given on the first cartographic sheet [33]. Furthermore, the additional legends of sheets XIV, XV, “Cape Sounion”, and XVI, “Laurion”, have been used to identify the red signs depicted on the Maps of Attica. According to the annotated cartographic information, the red signs are recognized as ancient remains [33]. Moreover, to further verify the explanation of the symbols, we examined the legend of another cartographic product of the same map series, the “Overview Map of Attica”, a map of the region’s full extent, in scale 1:100,000 produced by the merging of partial cartographic sheets. A considerable part of cartographic signs regarding the human-made environment was recorded in the database, as well as the total number of cartographic labels.
The cartographic data are classified into 16 thematic categories and, at a second hierarchical level, into 56 sub-categories, as shown in Table 1. The categories contain cartographic signs and labels with related concepts, e.g., the terms ‘cistern’, ‘basin’, and ‘reservoir’ are classified under the term ‘cistern’, which in turn is classified under the broader category of ‘water supply’. A quantitative analysis of the categorized cartographic signs and labels is presented in Table 2.
The cartographic signs have been digitized into spatial vector data using all possible geometries (point, line, polygon). For example, map signs for towers are registered as points (Figure 4), water conduits as lines (Figure 5), settlements as polygons (Figure 6), etc. Regarding the digitization of the cartographic labels, they were digitized as lines. The vector lines match the length of the words or phrases depicted on the map (Figure 7). The translation of the cartographic labels, except those concerning toponyms, into Greek and English was based on the translation of Manolis Korres in Creation, Content and Value of Kaupert’s Maps of Attica [8].

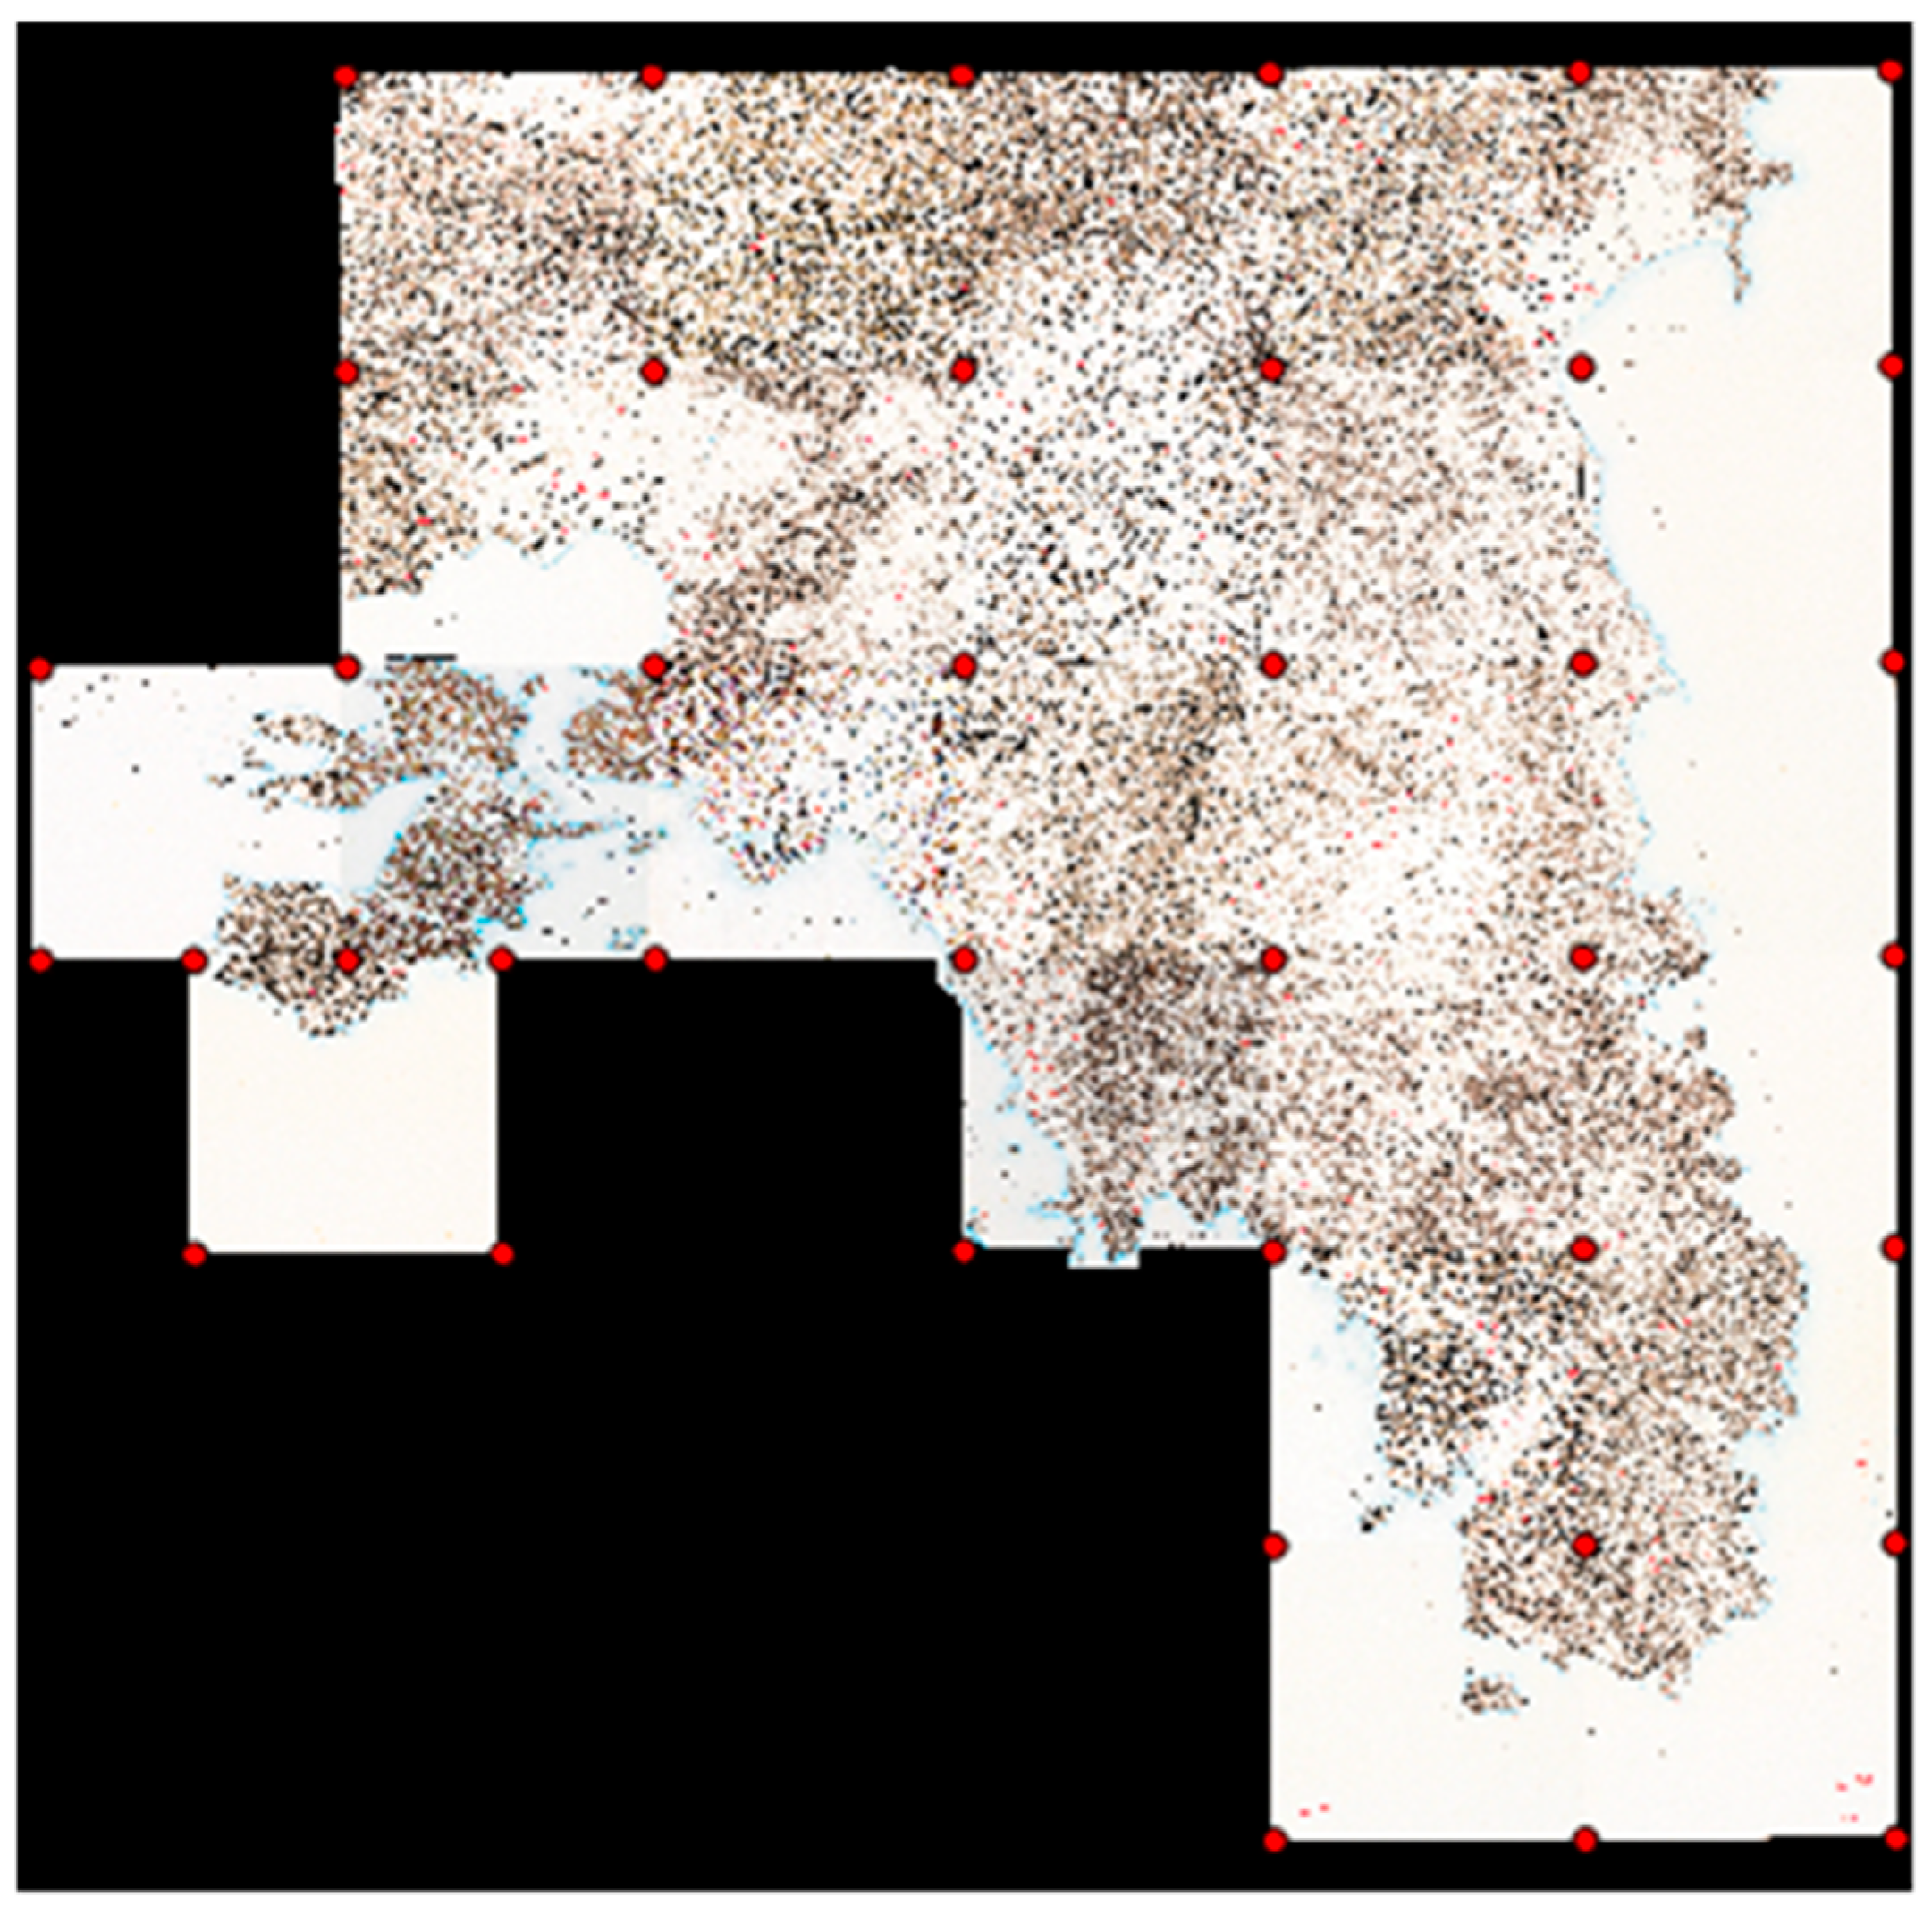
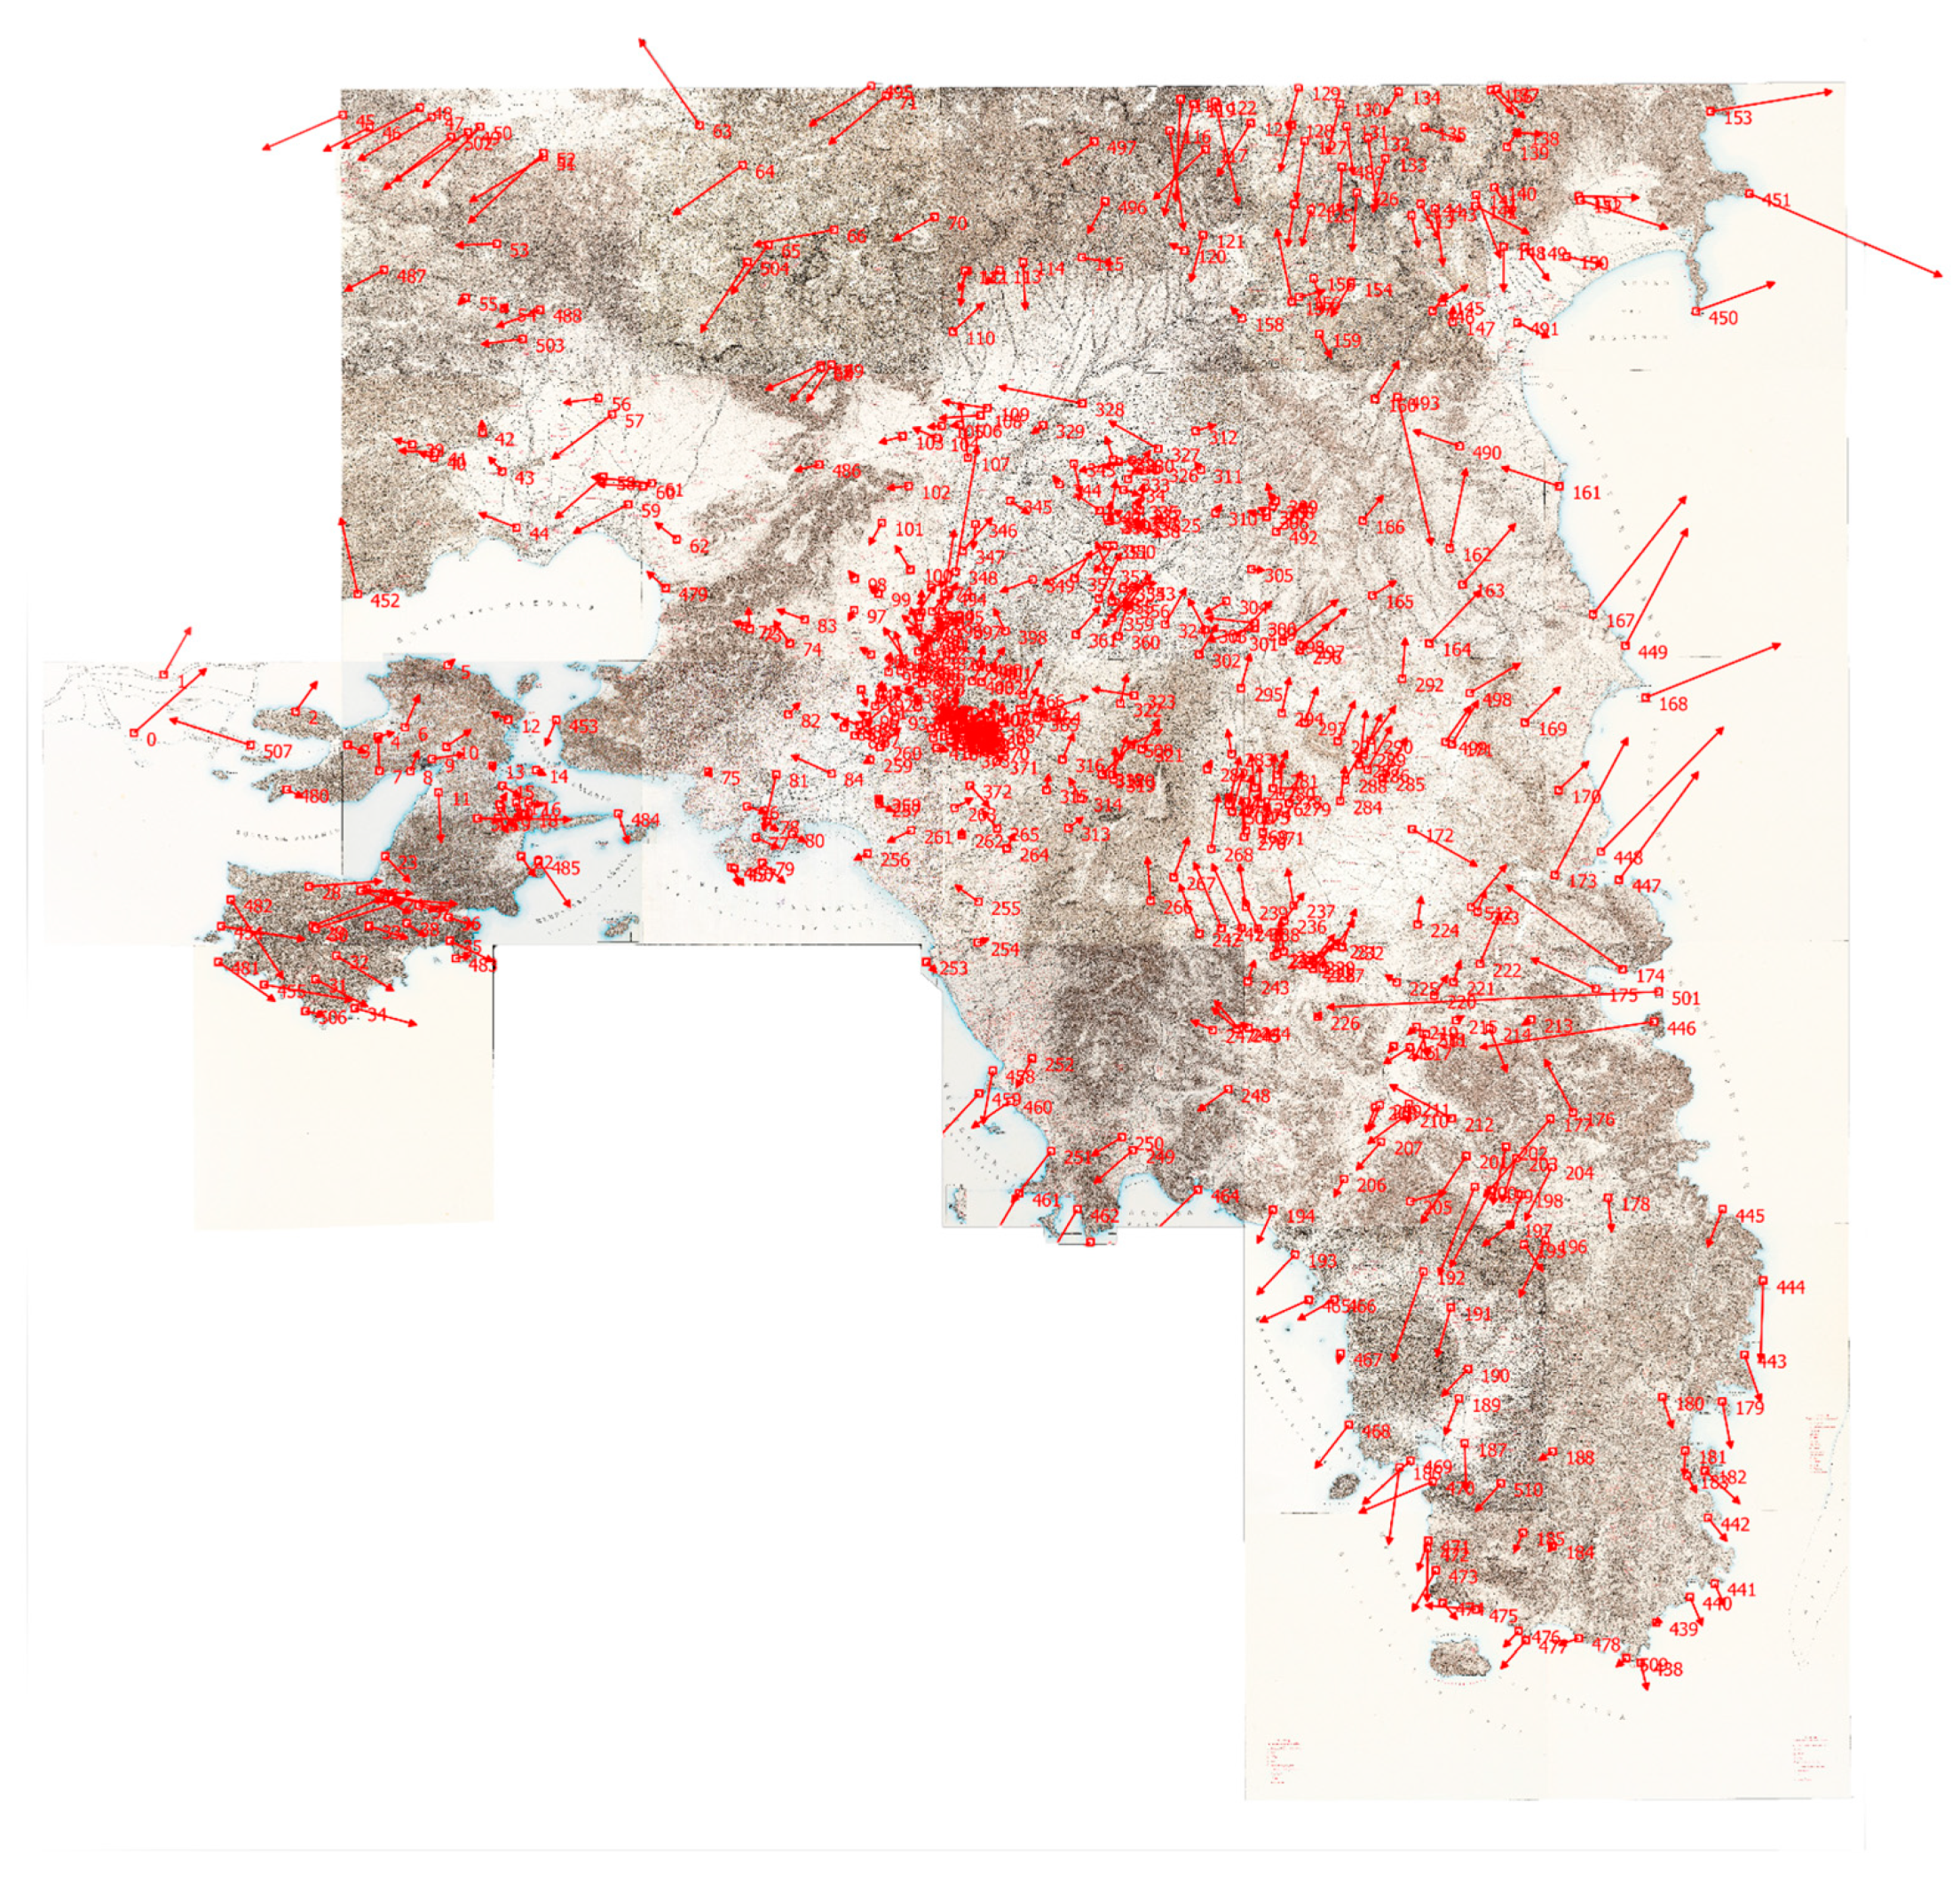
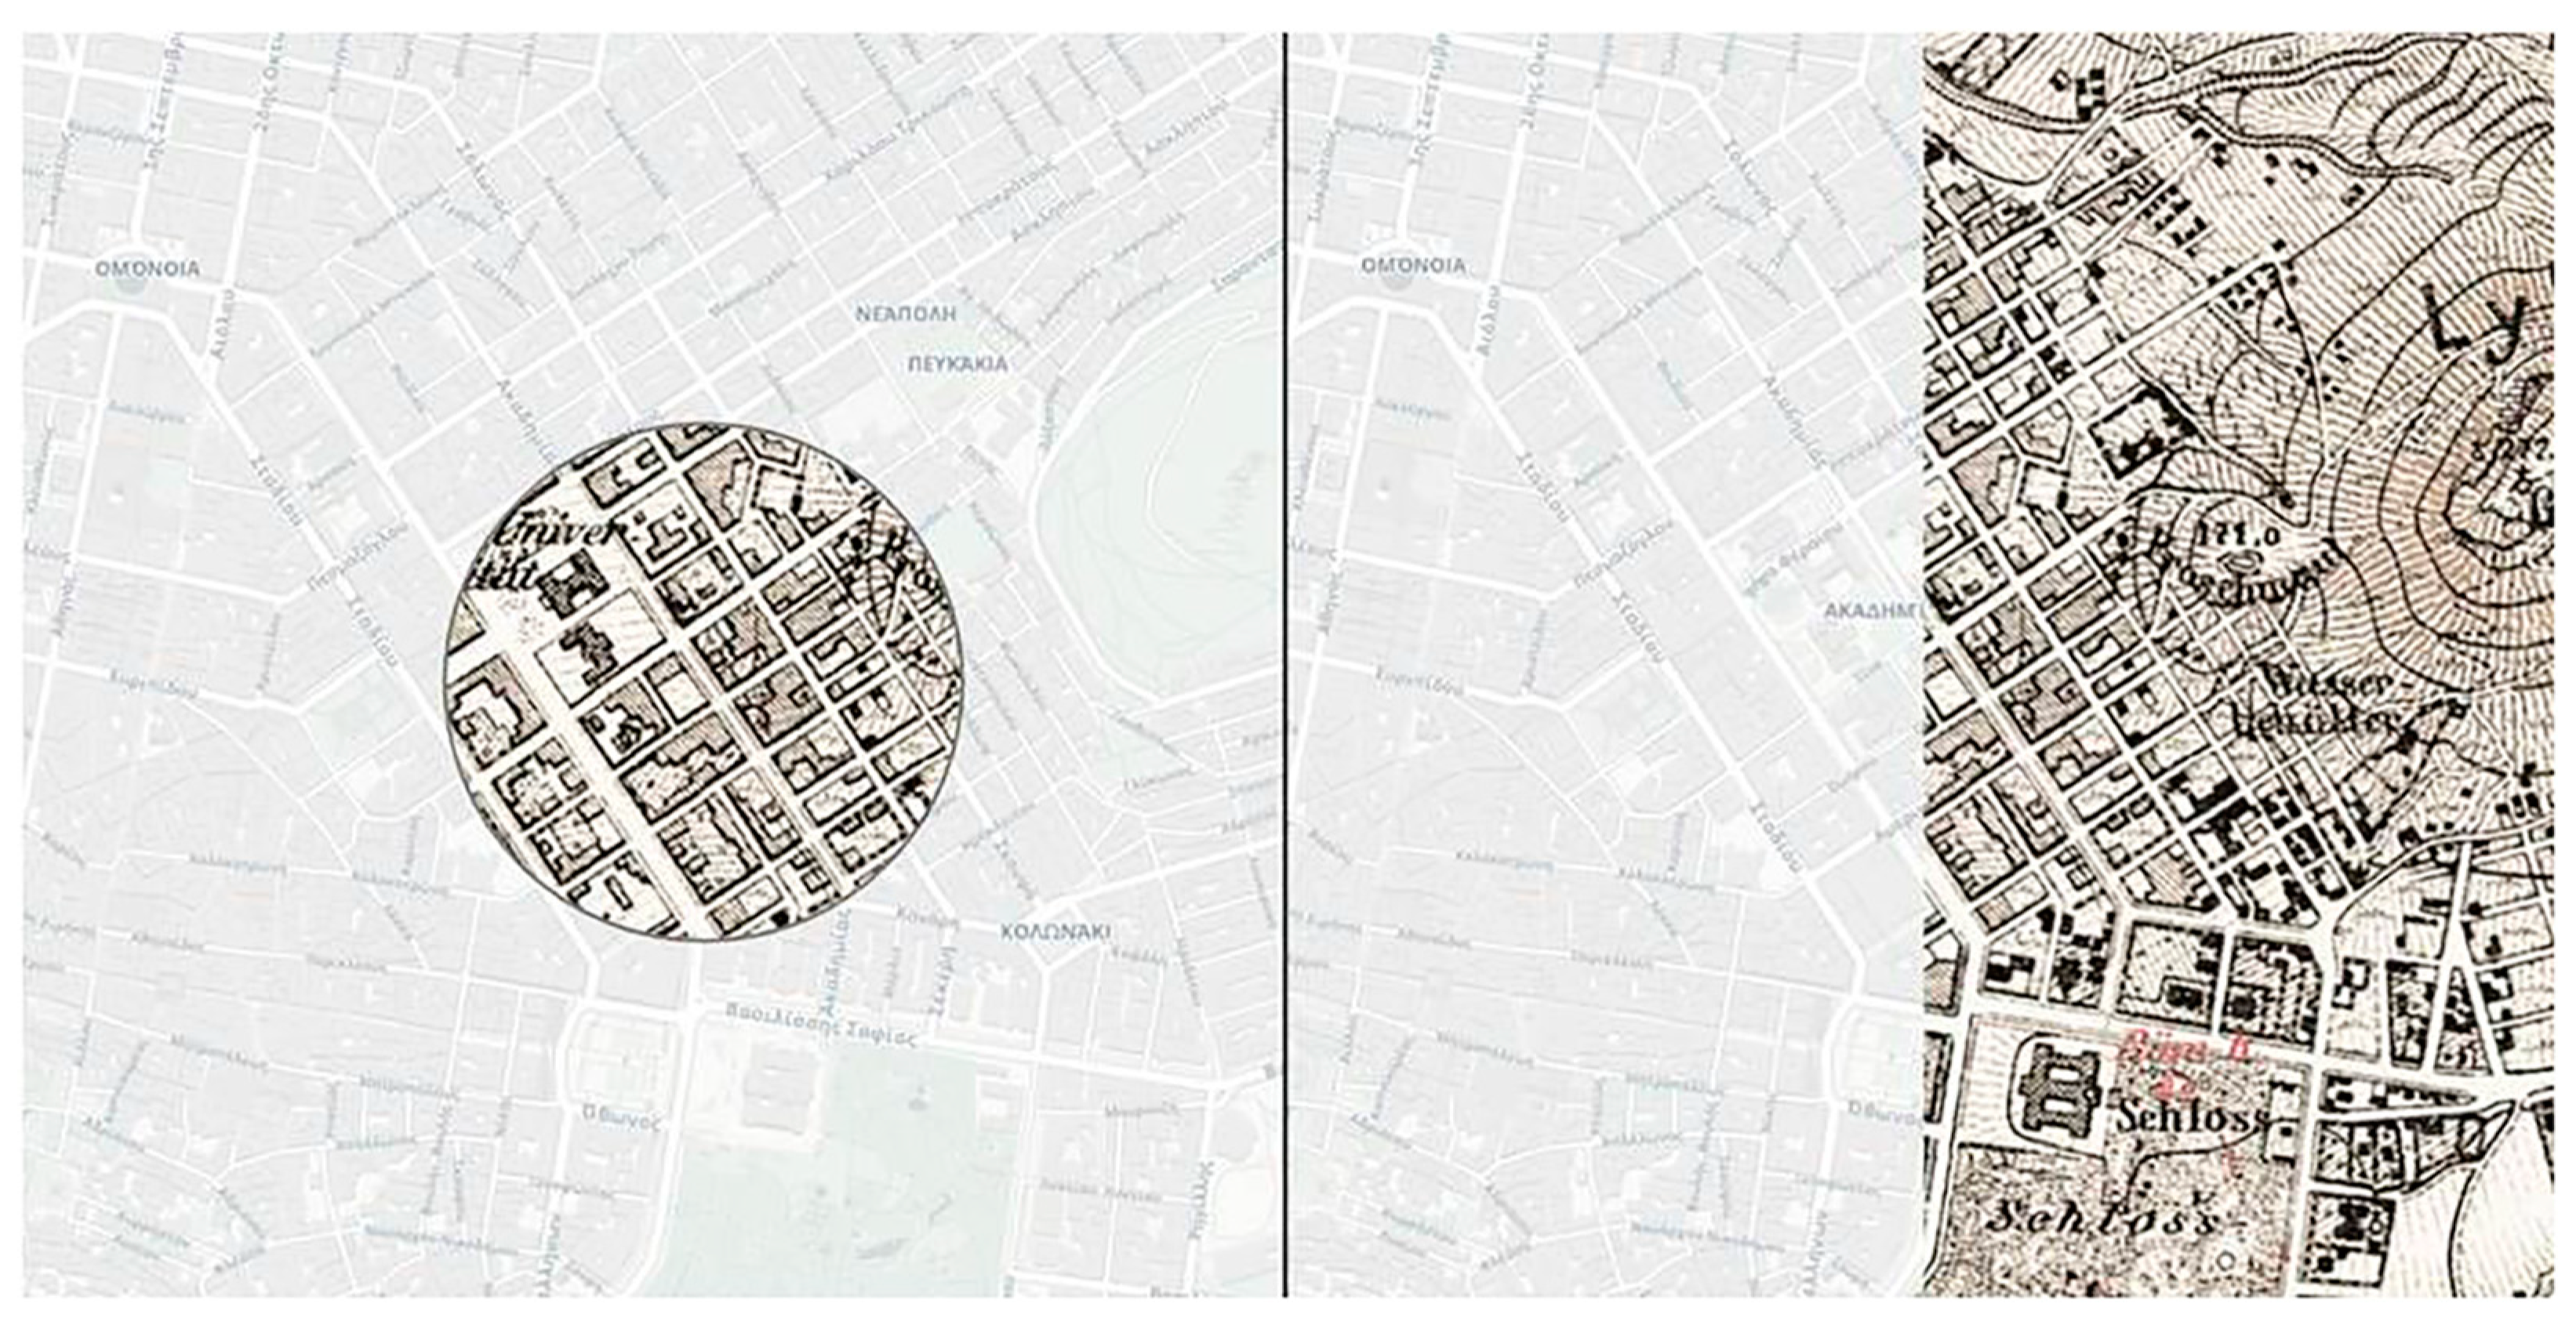
2.2.2. Georeferencing the Maps of Attica

Georeferencing is essential for aligning historical maps with modern ones to extract valuable information about the landscape over time [35]. After obtaining the high-resolution scanned map sheets, the first process was to crop them at the edges and stitch them together, creating a seamless image mosaic. The whole process was implemented in ArcGIS software. Then, the georeferencing procedure was carried out in two stages.
In the first stage, a rough georeference was generated based on the study of the cartographic directions followed for the overall 19th-century Karten von Attika project. According to Korres [8], the shape of the earth’s surface was taken as the ellipsoidal shape proposed already in 1842 by Friedrich Bessel, while the meridian of Ferro Island, the westernmost of the Canary Islands, was used as the First Meridian. Accordingly, the coordinates given at the four edges of each map sheet were transformed and registered in the World Geodetic System (WGS) 84, EPSG 4326. In this way, a new grid was created (Figure 8), according to which the georeferencing of the single image mosaic was performed.
According to Livieratos et al. [36] in their study on the geometric infrastructure of the Maps of Attica, an error is found in the coordinates of the Athens Observatory (which is given in the 19th-century work, as the Observatory is one of the vertices of the triangulation network of the maps). Therefore, after georeferencing the image mosaic, a geometric correction was made so that the coordinates of the Observatory are identical to those obtained from the modern background. As a result, a temporary alignment of the maps is available.
In the second stage, a transformation based on ground control points (GCPs) for greater accuracy was chosen. The task of identifying and gathering GCPs from historical maps is a challenging one that requires significant effort and attention to detail. It is due to the need for in-depth examination and thorough evaluation of supplementary materials such as narratives of people who have traveled to these particular locations, other old maps, and historical literature to ensure that the geographical features from the historical map correspond to locations on modern maps accurately [22]. In addition, a considerable amount of GCPs is necessary to enhance the overall accuracy. Therefore, our study concentrates on identifying control points, specifically on landmarks, such as churches and monasteries, which have remained in the exact same location without any significant changes. We also analyzed and identified archaeological remains, road intersections, remarkable buildings, and coastline features. This process aims to determine the locations of GCPs with high accuracy initially. Next, the GCPs were validated using supplementary material, such as different modern maps, various websites with historical information about churches and monasteries of Attic land, and Milchoefer’s explanatory text. The text is an integral part of the overall project, as it accompanies the Maps of Attica and often contains information that clarifies or revises what is displayed on them. Eventually, 470 GCPs were collected, and a 1st-degree polynomial (affine transformation) was performed on this set of points. On completion of this procedure, a mean error of 62.4 m was calculated.
The transformed image mosaic was then examined to detect and remove GCPs, resulting in significant distortions, and to identify and add new ones. Most of the GCPs with large residuals were discarded. However, others with significant residuals, most often collected in remote areas, were retained. In cases such as these, with limited reference information and a lack of identifiable locations in historical and modern background, these GCPs were considered to serve as rough anchor points contributing to local scale georeference. Additionally, it was considered essential to maintaining consistency and continuity by including most of the available data due to spatial considerations regarding the analyses of a considerably large area that Kaupert’s Maps of Attica covers. After this procedure, a set of 514 GCPs that were aligned with the reference map, distributed as shown in Figure 9, were generated. For further inspection of the validation of the GCPs, we observed the continuity of linear elements across the map sheets, such as the road and the water supply network.
The selected software for the georeferencing process is QGIS. The transformation function used was a 1st-degree polynomial (affine transformation), which included translation, rotation, and scale change, and the registration was made in the Greek Geodetic Reference System (GGRS) 87, EPSG 2100. The mean error of the procedure was calculated at 59.5 m, which corresponded to 2.38 mm in the historical map’s scale. The mean error represents the difference between the actual and desired link positions, and it is dependent on the accuracy of the historical map and the satellite imaginary [37]. In Schaffer and Levin’s “Reconstructing nineteenth century landscapes from historical maps–the Survey of Western Palestine as a case study” [38], the georeferencing of merged sheets of a historical map for the area of Palestine (surface area of approximately 14 square kilometers) was carried out using 123 GCPs, an affine transformation and an error of 74.4 m. While in Chalkias et al. [22], where a slightly different approach to the georeferencing procedure was used for the merged sheets of the 19th-century map of Cyprus (surface area of approximately 9 square kilometers), 340 GCPs were identified both on the historical map and a modern background with an error of 68.76 m. For the generated image mosaic of the Maps of Attica, a surface area of approximately 3.5 square kilometers, according to Conolly and Lake [39], the error of 59.5 m is considered significant. However, it is acceptable for the framework of this project, considering comparative literature and specificities of the map itself, such as the age of the maps, the multiple sheets produced by different cartographers, and the large area they covered.
Regarding a further deepening of the spatial distribution of the GCPs with the most significant residuals, Figure 10 shows the distribution of GCPs on the map, with the size of the arrow proportionally reflecting the size of the residual of each GCP. Excluding the Athens city region (sheets III, IV, VI) from our analysis, as in this region denser control points were taken for the georeferencing procedure, we observe that the most significant residuals were found in specific map sheets. These are the sheets V, VII, X, XI, XIII, XX, XXI, and XXV, most of which include coastline or mountainous areas, concluding that the accuracy is higher in relatively smooth surface areas.

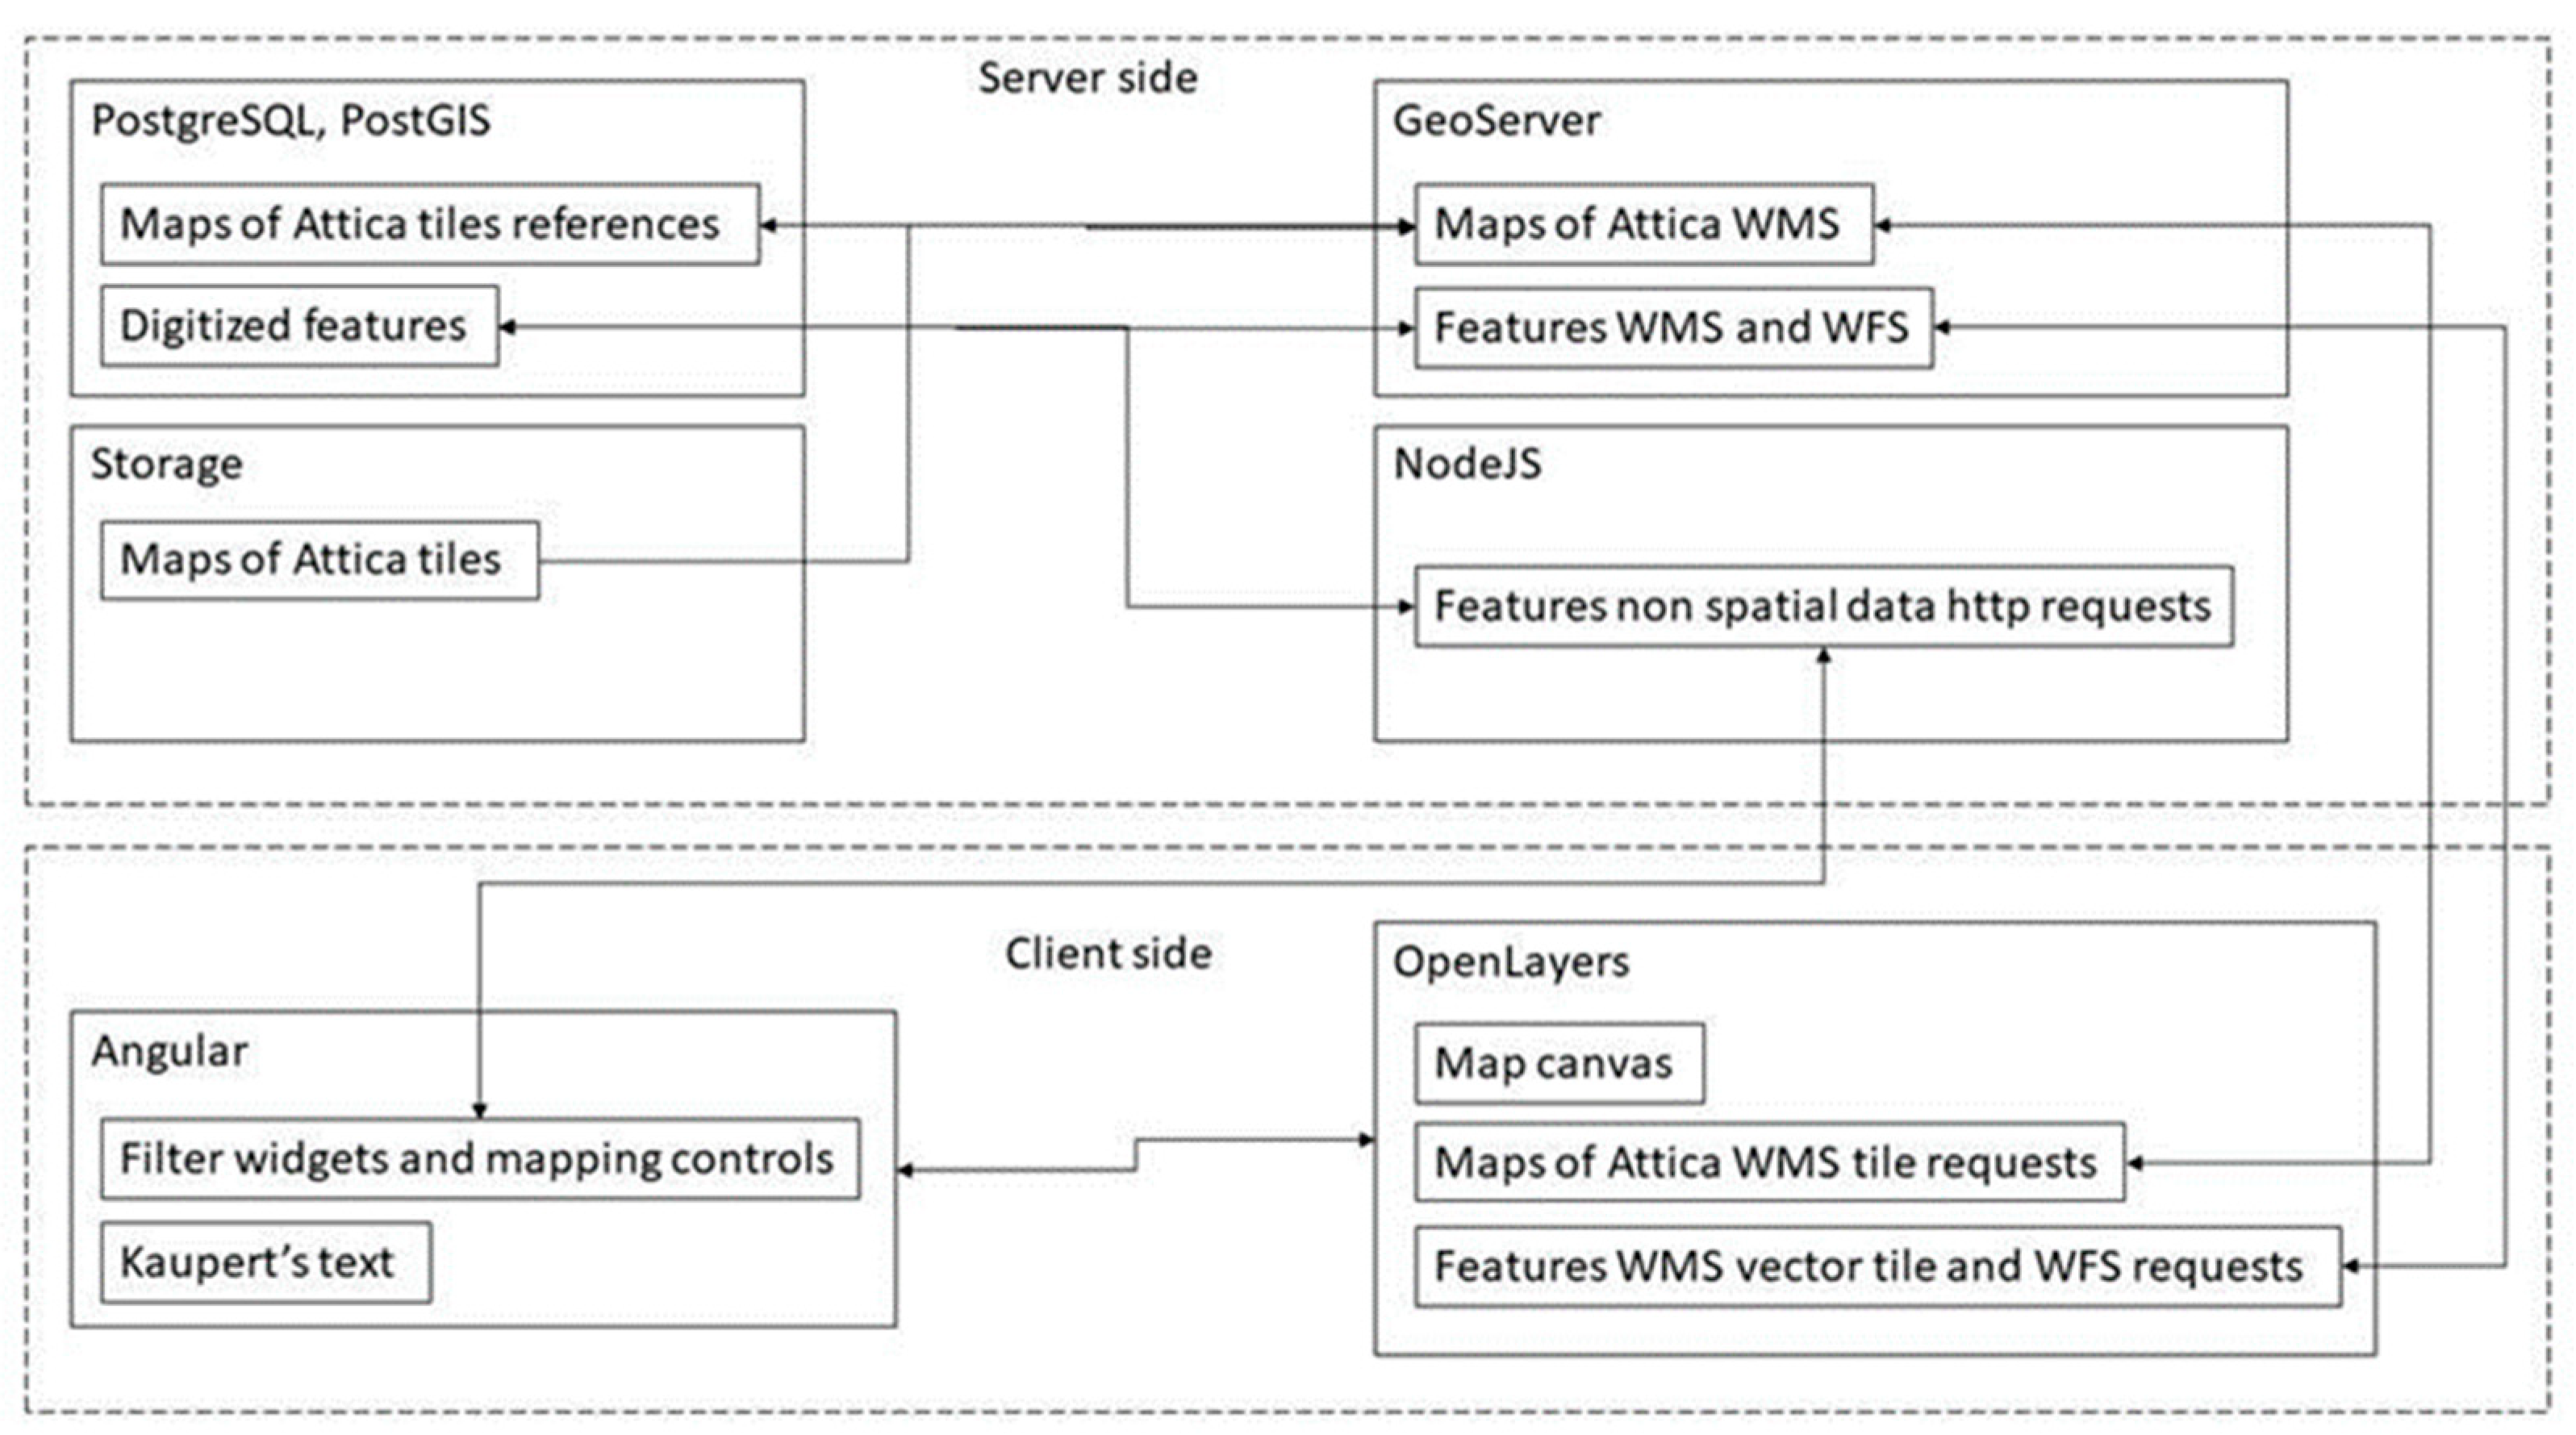
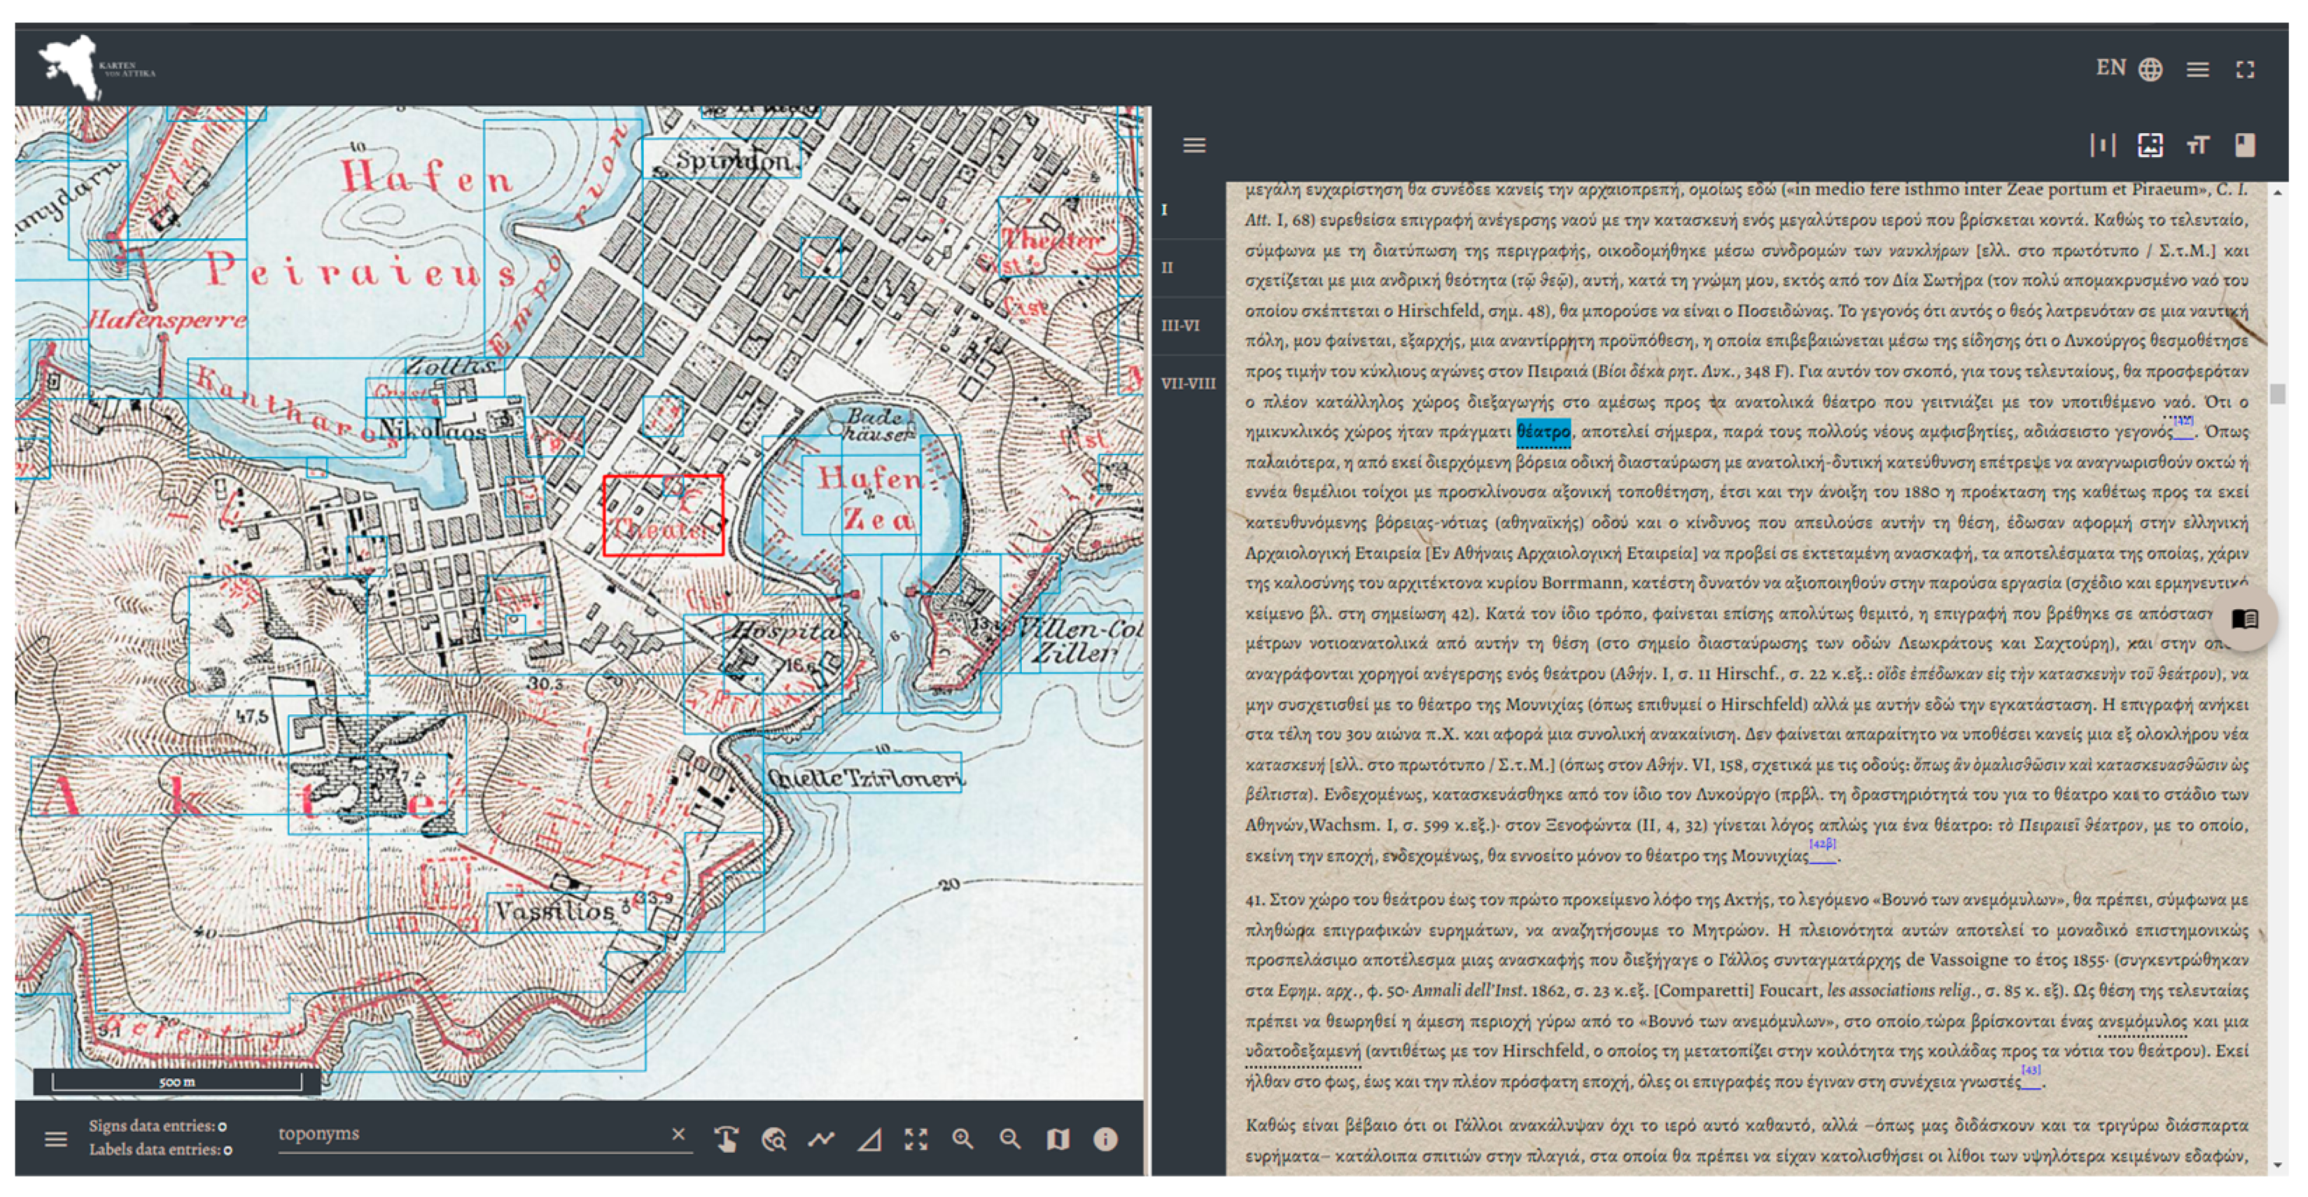
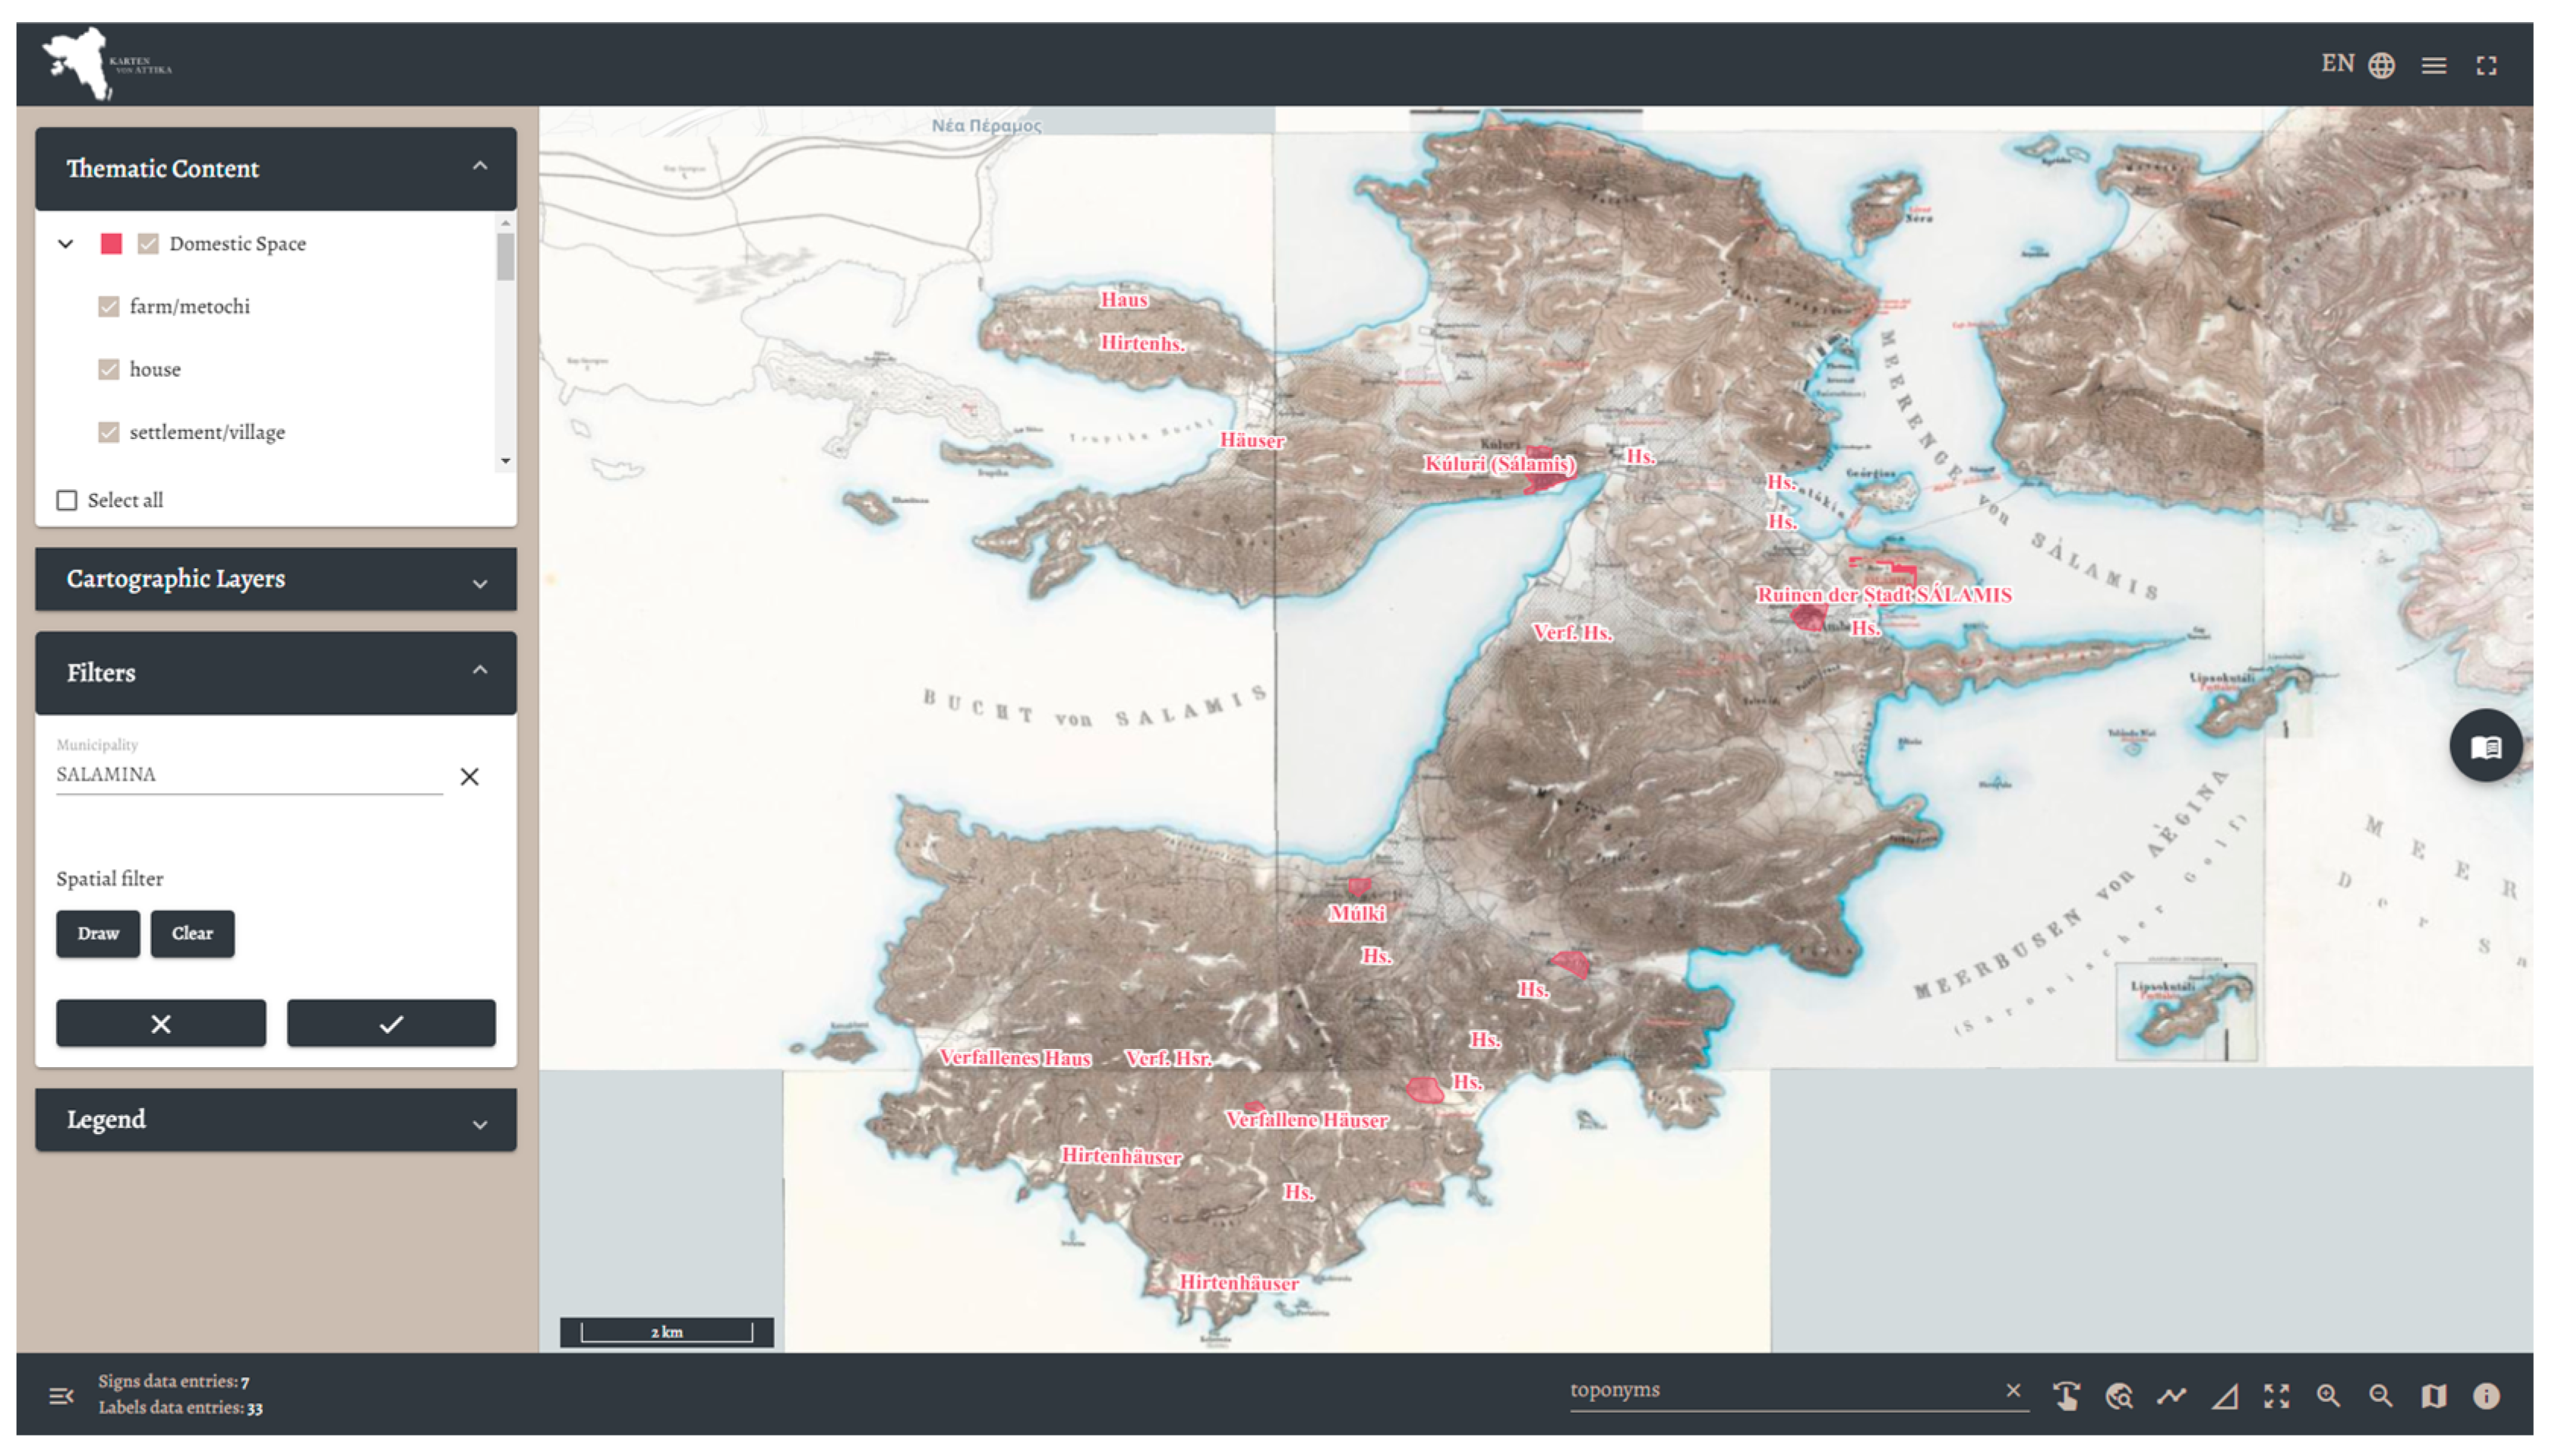
2.2.3. Development of the Web Mapping Application
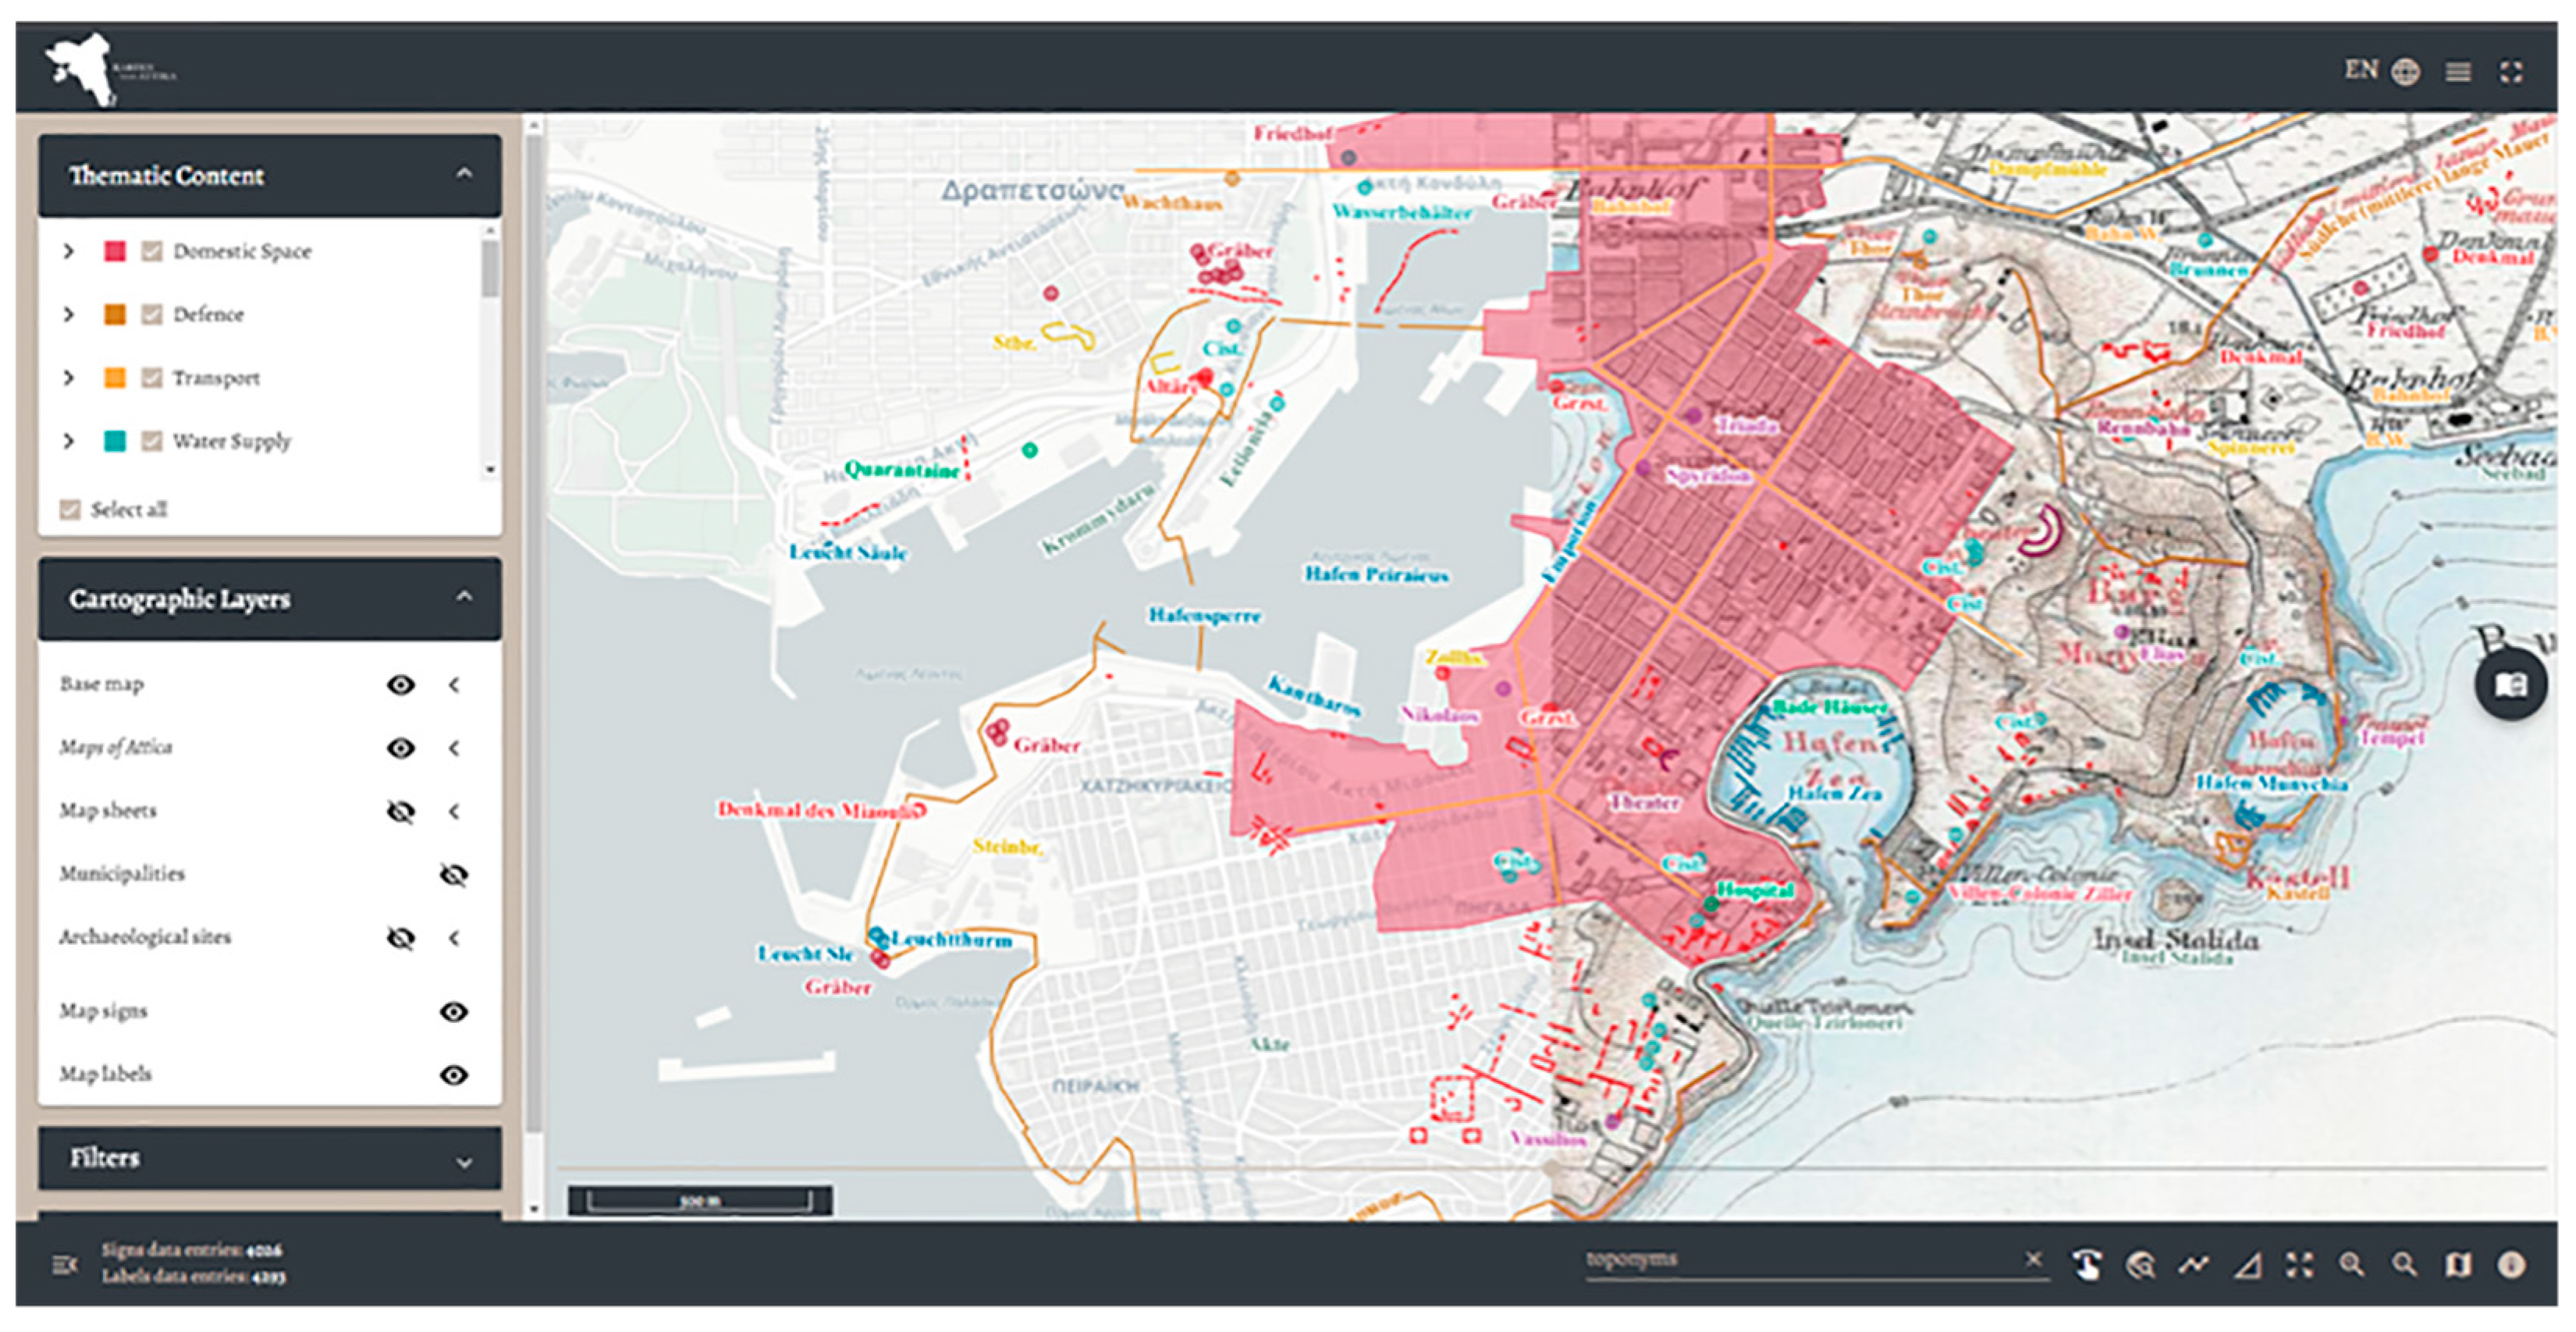
There are two fundamental types of architectures for webGIS and web mapping applications: thin-client and thick-client. In the former, the majority of data processing and analysis is conducted on the server side, with the client being responsible primarily for visualization. In the latter, these operations are largely performed on the client side [40]. Our application utilizes a hybrid system that combines aspects of both architectures; however, given that most of the processing is executed on the client side, it could be classified primarily as a thick-client application.
The web mapping application for this project must be capable of displaying both raster and vector geospatial data to achieve the project’s goal. The raster data, which are Kaupert’s Maps of Attica, and the vector data include the digitization of all elements of the map, accompanied by their relevant information, as well as auxiliary spatial data such as archaeological sites and modern municipalities of the area. Given the diverse types of data, we adopted both thin-client and thick-client architecture approaches to develop the application, ensuring optimal visualization concerning load speed, interactivity, functionality, and response times.
The general architecture of the web application is given in Figure 11. The components of the application can be separated into two basic categories, those on the server side and those on the client side. On the server side, there are four components. The first is the database, which manages all the data in tables and their relationships. The two main types of data are the spatial references of the raster image tiles and the digitized features, along with their non-spatial information. Additionally, disk storage is used to store the created tiles (PNG image files) derived from the raster image of the Maps of Attica.
The PostgreSQL database (https://www.postgresql.org/, accessed on 30 March 2023) with the PostGIS extension (https://postgis.net/, accessed on 30 March 2023) was used to store and manage the digitized features of the Maps of Attica. To achieve efficient storage and retrieval, the spatial and non-spatial data are divided into separate tables within the database. The spatial data is stored in dedicated tables optimized for computational efficiency. Non-spatial data is stored in separate tables, linked by foreign key constraints that enforce referential integrity. This separation allows for streamlined processing and quick retrieval of spatial information when generating the web map. To minimize redundancy and enhance space utilization, lookup tables (also known as LUT tables) are employed to store frequently referenced values. These tables mitigate duplication of data, leading to improved storage efficiency. Furthermore, the web application can independently access these lookup tables, thereby facilitating enhanced loading times. Additionally, indexes were created on columns that are frequently queried, and spatial indexes were created on the geometry columns of tables that contain spatial data. These indexes enhance data retrieval performance, particularly for spatial queries.
The next two server components, GeoServer and NodeJS, are responsible for retrieving and delivering data from the server to the client side. The non-spatial information is retrieved through HTTP requests, which, through NodeJS, lead to appropriate queries in the database and then return the information to the client side. Spatial data, before it can be visualized on a map on the client side, must be converted to Web Map Services (WMS) or Web Feature Services (WFS) [41]. GeoServer is used for this purpose. In the case of the vector features, the process is to retrieve the spatial data through queries in the database from the GeoServer and create the corresponding WFS or WMS. For raster data, the process is different. There are two ways that GeoServer can convert a raster file into a WMS. The first is by simply importing a raster file. In this way, GeoServer reads the file, and all the required conversions to WMS are performed on the fly, following the request from the client side. GeoServer can read most file formats such as ASCII, TIFF, Geopackage, etc. The second way is by converting the raster file into an image mosaic, i.e., the pre-production of the tiles for the various zoom levels and viewing area of the map on the client side. This process requires specifying the basic elements of the raster file (size in pixels and reference system) and the generated tile size in pixels (e.g., 256 × 256). Moreover, it is necessary to define the pyramids (zoom levels), which can be estimated from the size of the image based on the formula:
number of pyramids = log(pixel size of image)/log(2) − log(pixel size of tile)/log(2)
(https://docs.geoserver.org/2.19.x/en/user/tutorials/imagemosaic-jdbc/imagemosaic-jdbc_tutorial.html, accessed on 30 March 2023).
Both methods can be used by various client-side libraries to visualize raster data with the WMS or web map tile service (WMTS) protocols. The main reason for the choice of method has to do with the size of the raster file. GeoServer has the ability (it also depends on the capabilities of the server it is running on) to perform optimally up to a file size of 2 GB. For larger files, it is preferred to be converted to image mosaics first and then served to GeoServer via a PostgreSQL with the PostGIS extension database (https://docs.geoserver.org/latest/en/user/tutorials/imagepyramid/imagepyramid.html#:~:text=GeoServer%20can%20efficiently%20deal%20with,below%20the%202GB%20size%20limit, accessed on 30 March 2023). Maps of Attica are large raster files as they cover a large spatial area and are of high resolution so that all the elements of the map, which are drawn by hand, can be rendered correctly. Large-size raster images can be converted from RGB 24-bit to pseudo-color table (PCT) 8-bit images. However, with this conversion, the sharpness of the image is significantly reduced, and depending on its use, the result may not be desirable. In this work, both methods were considered. The original raster image of the Maps of Attica is almost 7 GB. The size converted to PCT is almost 1 GB, which is sufficient to import as a TIFF image to GeoServer.
On the client side, there are two main components. The Angular framework was used to develop all the elements of the user interface except for the map. This includes the various filters for the spatial features, the layers tools, the map tools, and the accompanying Milchoefer’s Explanatory Text. Apart from the text, all other information is dynamically retrieved from the database through NodeJS. Since Milchoefer’s Explanatory Text is a historical artifact that will not change over time, it was provided as simple text with the required spatial references and was not stored in the database to improve loading speed.
The open-source library OpenLayers is used to render the spatial data in the map element of the application. Raster data is retrieved as a WMS tile layer via the appropriate OpenLayer’s method, (https://openlayers.org/en/latest/apidoc/module-ol_source_TileWMS-TileWMS.html, accessed on 30 March 2023). Two more OpenLayers tools were used on the raster data for better map exploration, the ‘Layer Spy’ (https://openlayers.org/en/latest/examples/layer-spy.html, accessed on 30 March 2023) and the ‘Layer Swipe’ (https://openlayers.org/en/latest/examples/layer-swipe.html, accessed on 30 March 2023). With these tools, the user has the ability to overlay the raster data on a base map (e.g., OpenStreetMap), as shown in Figure 12.
Most of the vector features are rendered on the map with the vector tile method of OpenLayers (https://openlayers.org/en/latest/apidoc/module-ol_layer_VectorTile-VectorTileLayer.html, accessed on 30 March 2023). With this method, it is possible to retrieve vector data with the WMS, significantly reducing the loading time and the responsiveness of the map, while rendering numerous features. Given the large data volume of the two main layers of the application (the cartographic labels and the cartographic signs, which account for more than 9000), a specific method was chosen for these layers.

3. Results

The present study introduces a web application that is unique worldwide in offering visualization, interactivity, and aggregated information on Kaupert’s Maps of Attica, a work of significant historical and archaeological value for the study area and beyond. This platform provides a valuable tool for spatial humanities research and education as it offers deep mapping features that allow users to create spatial narratives in multiple ways. The web mapping application can be accessed at the following address: https://dipylon-kartenvonattika.org/ (accessed on 30 March 2023).
The digitization of the map features, combined with their classification and additional information, provides a comprehensive visualization for users when browsing and analyzing the Maps of Attica. This information can stimulate more in-depth analysis of the data in GIS software or serve as a simple assessment of the characteristics of the area at that time. The features can be overlaid on both the Maps of Attica and modern cartographic backgrounds (Figure 13, offering more flexibility and utility in the analysis and composition of spatial narratives.
The platform offers the possibility of overlaying the Maps of Attica on modern cartographic backgrounds, thereby integrating the maps into today’s reality (Figure 13). The georeferencing of the Maps of Attica carried out in this project provides a great advantage, as users can easily compare the natural and built environment of that time with today’s. The average error obtained in this study is relatively large compared to current standards (59.5 m). Nonetheless, considering the nature of the study material and comparing it with similar works, the result is satisfactory. Furthermore, it provides the opportunity, for the first time, to overlay the Maps of Attica on modern cartographic backgrounds.
A significant addition to the application is Milchoefer’s Explanatory Text of the Maps of Attica, which offers a huge amount of additional information to the map. Users can view the explanatory text in conjunction with the map and navigate the map via links in the text for all the words associated with a spatial entity (Figure 14). The two-way interaction between the map and the text allows users to connect from one media to the other, making it easy to access additional information about a spatial entity or locate a spatial entity on the map.
The creation of a database containing map elements provides the opportunity for quantitative analysis of Kaupert’s Maps of Attica. Users can observe quantitative aspects of each data category in conjunction with specific spatial filters. For example, Figure 15 demonstrates the utilization of a spatial filter to isolate cartographic signs and labels belonging to the ‘domestic space’ category for the island of Salamina. The user receives quantitative data pertaining to the selected area’s relevant digitizations. In addition to querying and filtering, various other tools are available to assist users in navigating and analyzing the data. These tools include measurement functionalities for distances and areas, a map-based search feature, legends, and more.
Additionally, the data will soon be available for download through the platform, enabling researchers to further study the data and their accompanying information in more detail.
Despite the abundance of spatial and non-spatial information, the application performs flawlessly on most modern browsers. Additionally, the application can operate normally on mobile devices with some minor limitations, particularly in displaying the explanatory text simultaneously with the map. These features make the application accessible to both academics and the public.
Overall, the web application developed provides valuable tools for the dissemination and study of Kaupert’s Maps of Attica. The interactivity and the aggregated and detailed information offered by the application make it an educational and scientific tool that can be used by anyone interested in studying this important work.

4. Discussion

In this study, we employed historical Maps of Attica within a webGIS framework to collect and visualize geographical data. To our knowledge, this represents one of the first comprehensive web mapping applications for the Attica region. The use of GIS technology enables the construction of a historical-geographical framework, facilitating the exploration of significant heritage, such as Kaupert’s Maps of Attica. Enhancing the value of historical data is achievable by identifying their geographical locations within modern cartographic backgrounds.
A critical step in this process was georeferencing the historical map using carefully selected GCPs. The overall mean error was found to be 59.5 m. While the global mean error is a widely recognized metric that provides an approximate estimate of georeferencing accuracy, it fails to convey the actual spatial distribution of inaccuracies across the map. Data collection using 19th-century equipment by multiple survey teams over a two-decade period (1875–1894), covering an area of approximately 3.5 square kilometers, and producing 24 different cartographic sheets, resulted in notable disparities in the precision of Kaupert’s Maps of Attica across different regions. Consequently, the digital data generated from the georeferencing process had to account for variations in accuracy across different map areas. The most significant discrepancies in accuracy were identified in the map’s periphery (e.g., Porto Rafti, Daskaleio) and over hilly terrain (e.g., Parnitha mountain). Large deviations along the coastline were expected due to changes that occurred over the last century and a half (e.g., Piraeus and Faliro regions). In contrast, mapping and defining the trigonometric network required special effort in mountainous or generally inaccessible areas, as mentioned before. Identifying trustworthy GCPs, primarily churches, proved to be a demanding and time-intensive task, requiring researchers to rely on supplementary historical and contemporary information to verify the precise locations of these GCPs.
The developed web application utilizes the latest web mapping technologies, and the employed architecture allows for flexible data visualization using a variety of tools without impacting data loading or map responsiveness. The application’s map symbols are used to depict various features or phenomena, and these symbols are associated with specific concepts that differentiate one type of map element from another. However, a lack of information on the map’s legend may cause readers to rely on their familiarity and ability to anticipate appropriate symbols for interpretation [42]. To mitigate personal bias in the interpretation process and reduce subjective perspective when interpreting symbols that are not explicitly defined in the legend, we refer to a subsequent map of the same series, the Overview Map of Attica. This map, which depicts the region’s full extent at a scale of 1:100,000, includes a separate legend rich in information. To aid recognition of the map symbols, a general legend is provided for the recognition of black-colored signs and labels, and two additional legends are provided for the recognition of red-colored signs and labels. Nonetheless, it is not certain that the symbols will be interpreted as intended, which introduces an additional factor of personal bias in the interpretation process. Thus, the choice to refer to the Overview Map of Attica is crucial for the accurate classification of cartographic data.
The results of this study can deepen our understanding of the geography, topography, and archaeology of the Attica region in the late 19th century and stimulate further inquiry into Kaupert’s Maps of Attica. Despite the limitations and assumptions mentioned earlier, this work offers valuable insights into the historical landscape of Attica during this period and can make a significant contribution to the field of digital humanities through interdisciplinary research.

Author Contributions

Conceptualization, G.L., G.P. and C.G.; Data curation, G.L., G.P., C.G. and A.K.; Formal analysis, G.P.; Investigation, G.L., G.P. and A.K.; Methodology, G.L., G.P., C.G. and A.K.; Project administration, C.G.; Resources, G.L.; Software, G.P. and A.K.; Supervision, G.L. and C.G.; Validation, G.P.; Visualization, G.P.; Writing—original draft, G.L., G.P. and A.K.; Writing—review & editing, G.L. and G.P. All authors have read and agreed to the published version of the manuscript.

Funding

The project was funded by the John S. Latsis Public Benefit Foundation (https://www.latsis-foundation.org/eng, accessed on 27 March 2023), the George Vergottis Memorial Fund (https://vergottisfoundation.org/?lang=ENG, accessed on 27 March 2023), the J. F. Costopoulos Foundation (https://costopoulosfoundation.org/en/, accessed on 27 March 2023) and the Loeb Classical Library Foundation (https://lclf.harvard.edu/, accessed on 27 March 2023).

Data Availability Statement

The data presented in this study are available on request from the corresponding author.

Acknowledgments

We would like to express our gratitude to Dipylon Society’s (https://dipylon.org/en/, accessed on 30 March 2023)ounding members, research team, and external collaborators for their contribution to the project, Manolis Korres, John Mckesson Camp II, Sylvian Fachard and Dylan K. Rogers for their scientific remarks, the Archaeological Society at Athens for the authorization to use archaeological plans, Athina Ragia and Melissa Publishing House for kindly providing digital copies of Kaupert’s Maps of Attica. Finally, we would like to express our gratitude to the two anonymous reviewers for their invaluable feedback and insightful comments that greatly improved this manuscript.

Conflicts of Interest

The authors declare no conflict of interest.

References

  1. Kienast, F. Analysis of Historic Landscape Patterns with a Geographical Information System—A Methodological Outline. Landsc. Ecol. 1993, 8, 103–118. [Google Scholar] [CrossRef]
  2. Grossinger, R.M.; Striplen, C.J.; Askevold, R.A.; Brewster, E.; Beller, E.E. Historical Landscape Ecology of an Urbanized California Valley: Wetlands and Woodlands in the Santa Clara Valley. Landsc. Ecol. 2007, 22, 103–120. [Google Scholar] [CrossRef]
  3. Levin, N.; Elron, E.; Gasith, A. Decline of Wetland Ecosystems in the Coastal Plain of Israel during the 20th Century: Implications for Wetland Conservation and Management. Landsc. Urban. Plan. 2009, 92, 220–232. [Google Scholar] [CrossRef]
  4. Hopkins, D.; Morgan, P.; Roberts, J. The Application of GIS to the Reconstruction of the Slave-Plantation Economy of St. Croix, Danish West Indies. Hist. Geogr. 2011, 39, 85–104. [Google Scholar]
  5. Plewe, B. The Nature of Uncertainty in Historical Geographic Information. Trans. GIS 2002, 6, 431–456. [Google Scholar] [CrossRef]
  6. Leyk, S.; Zimmermann, N.E. A Predictive Uncertainty Model for Field-Based Survey Maps Using Generalized Linear Models. In Proceedings of the Geographic Information Science; Egenhofer, M.J., Freksa, C., Miller, H.J., Eds.; Springer: Berlin/Heidelberg, Germany, 2004; pp. 191–205. [Google Scholar]
  7. Lukas, M.C. Cartographic Reconstruction of Historical Environmental Change. Cartogr. Perspect. 2014, 78, 5–24. [Google Scholar] [CrossRef]
  8. Korres, M. Creation Content and Value of Kaupert’s Maps of Attica; Melissa Publishing House: Athens, Greece, 2008; ISBN 960-204-292-3. [Google Scholar]
  9. Livieratos, E. Germans Map Greece–from the 16th till the 19th Century; National Map Center for Maps and Cartographic Heritage-National Map Library: Thessaloniki, Greece, 2001. [Google Scholar]
  10. Dasaklis, S.; Sigalos, G.; Loucaidou, B.; Oikonomou, K.; Mavrakis, A.; Fotopoulos, N. Kaupert Maps as an Environmental Information Source for Attica. In Proceedings of the 7th National Conference HellasGIS, Athens, Greece, 17–18 May 2012; Volume 9. [Google Scholar]
  11. Witmore, C. The World on a Flat Surface: Maps from The Archaeology of Greece and Beyond. In Re-presenting the Past: Archaeology through Text and Image; Brown University: Providence, RI, USA, 2013; pp. 125–150. ISBN 978-1-78297-231-0. [Google Scholar]
  12. Blundell, D.; Lin, C.; Morris, J. Spatial Humanities: An Integrated Approach to Spatiotemporal Research. In Big Data in Computational Social Science and Humanities; Springer: Cham, Switzerland, 2018; pp. 263–288. ISBN 978-3-319-95464-6. [Google Scholar]
  13. Jessop, M. The Inhibition of Geographical Information in Digital Humanities Scholarship. Lit. Linguist. Comput. 2008, 23, 39–50. [Google Scholar] [CrossRef]
  14. Jack Gieseking, J. Where Are We? The Method of Mapping with GIS in Digital Humanities. Am. Q. 2018, 70, 641–648. [Google Scholar] [CrossRef] [Green Version]
  15. Hamraie, A. Mapping Access: Digital Humanities, Disability Justice, and Sociospatial Practice. Am. Q. 2018, 70, 455–482. [Google Scholar] [CrossRef] [Green Version]
  16. Lin, N.; Chen, S.; Wang, S.; Yeh, C. Displaying Spatial Epistemologies on Web GIS: Using Visual Materials from the Chinese Local Gazetteers as an Example. IJHAC 2020, 14, 81–97. [Google Scholar] [CrossRef] [Green Version]
  17. Meccarelli, M.; Sastre, M.J.S. Spatial and Temporal Dimensions for Legal History: Research Experiences and Itineraries; Duve, T., Vogenauer, S., Eds.; Max Planck Institute for Legal History and Legal Theory: Frankfurt am Main, Germany, 2016; Volume 6, ISBN 978-3-944773-05-6. [Google Scholar]
  18. Vacca, G.; Fiorino, D.R.; Pili, D. A Spatial Information System (SIS) for the Architectural and Cultural Heritage of Sardinia (Italy). ISPRS Int. J. Geo-Inf. 2018, 7, 49. [Google Scholar] [CrossRef] [Green Version]
  19. Luppichini, M.; Noti, V.; Pavone, D.; Bonato, M.; Ghizzani Marcìa, F.; Genovesi, S.; Lemmi, F.; Rosselli, L.; Chiarenza, N.; Colombo, M.; et al. Web Mapping and Real–Virtual Itineraries to Promote Feasible Archaeological and Environmental Tourism in Versilia (Italy). ISPRS Int. J. Geo-Inf. 2022, 11, 460. [Google Scholar] [CrossRef]
  20. Sánchez-Aparicio, L.J.; Masciotta, M.-G.; García-Alvarez, J.; Ramos, L.F.; Oliveira, D.V.; Martín-Jiménez, J.A.; González-Aguilera, D.; Monteiro, P. Web-GIS Approach to Preventive Conservation of Heritage Buildings. Autom. Constr. 2020, 118, 103304. [Google Scholar] [CrossRef]
  21. Theocharaki, A.M.; Costaki, L.; Papaefthimiou, W.; Pigaki, M.; Panagiotopoulos, G. Mapping Ancient Athens: A Digital Map to Rescue Excavations. In Proceedings of the Trandisciplinary Multispectral Modelling and Cooperation for the Preservation of Cultural Heritage; Moropoulou, A., Georgopoulos, A., Doulamis, A., Ioannides, M., Ronchi, A., Eds.; Springer International Publishing: Cham, Switzerland, 2022; pp. 55–65. [Google Scholar]
  22. Chalkias, C.; Papadias, E.; Vradis, C.; Polykretis, C.; Kalogeropoulos, K.; Psarogiannis, A.; Chalkias, G. Developing and Disseminating a New Historical Geospatial Database from Kitchener’s 19th Century Map of Cyprus. ISPRS Int. J. Geo-Inf. 2023, 12, 74. [Google Scholar] [CrossRef]
  23. Obe, R.O.; Hsu, L. PostGIS in Action; Manning: Shelter Island, NY, USA, 2011; ISBN 978-1-935182-26-9. [Google Scholar]
  24. Gregory, I.N.; Ell, P.S. Historical GIS Technologies, Methodologies, and Scholarship; Cambridge University Press: Cambridge, UK, 2007; ISBN 978-0-521-85563-1. [Google Scholar]
  25. Bodenhamer, D.J.; Corrigan, J.; Harris, T.M. The Spatial Humanities GIS and the Future of Humanities Scholarship; Indiana University Press: Bloomington, UK, 2010; ISBN 978-0-253-22217-6. [Google Scholar]
  26. Marian, C.V.; Iacob, M. The ArchTerr Project—A GIS-Based Integrated System for Cultural and Archaeological Heritage Protection (Pilot Phase Tested in Romania). Appl. Sci. 2022, 12, 8123. [Google Scholar] [CrossRef]
  27. Costantino, D.; Angelini, M.G.; Alfio, V.S.; Claveri, M.; Settembrini, F. Implementation of a System WebGIS Open-Source for the Protection and Sustainable Management of Rural Heritage. Appl. Geomat. 2020, 12, 41–54. [Google Scholar] [CrossRef]
  28. Kokkalas, A.; Patenidis, A.T.; Stathopoulos, E.A.; Mitsopoulou, E.E.; Diplaris, S.; Papadopoulos, K.; Vrochidis, S.; Votis, K.; Tzovaras, D.; Kompatsiaris, I. E-Tracer: A Smart, Personalized and Immersive Digital Tourist Software System. In Proceedings of the Information Integration and Web Intelligence; Pardede, E., Delir Haghighi, P., Khalil, I., Kotsis, G., Eds.; Springer Nature Switzerland: Cham, Switzerland, 2022; pp. 581–587. [Google Scholar]
  29. Paliokas, I.; Patenidis, A.T.; Mitsopoulou, E.E.; Tsita, C.; Pehlivanides, G.; Karyati, E.; Tsafaras, S.; Stathopoulos, E.A.; Kokkalas, A.; Diplaris, S.; et al. A Gamified Augmented Reality Application for Digital Heritage and Tourism. Appl. Sci. 2020, 10, 7868. [Google Scholar] [CrossRef]
  30. Slingerland, E.; Atkinson, Q.; Ember, C.; Sheehan, O.; Muthukrishna, M.; Bulbulia, J.; Gray, R. Coding Culture: Challenges and Recommendations for Comparative Cultural Databases. Evol. Hum. Sci. 2020, 2, E29. [Google Scholar] [CrossRef]
  31. Kuna, J.; Jeremicz, J.; Kociuba, D.; Niedźwiadek, R.; Janus, K.; Chachaj, J. Interactive HGIS Platform Union of Lublin (1569): A Geomatic Solution for Discovering the Jagiellonian Heritage of the City. J. Cult. Herit. 2022, 53, 47–71. [Google Scholar] [CrossRef]
  32. Tice, J. The GIS Forma Urbis Romae Project: Creating a Layered History of Rome. Humanist Stud. Digit. Age 2013, 3, 70–85. [Google Scholar] [CrossRef] [Green Version]
  33. Curtius, E.; Kaupert, J.A. Karten von Attika 1895. Available online: https://digi.ub.uni-heidelberg.de/diglit/curtius1895a/0001/image,info (accessed on 27 March 2023).
  34. Korres, M. Maps of Attica; Curtius, E., Kaupert, J.A., Attiki Odos, S.A., Eds.; Melissa Publishing House: Athens, Greece, 2008; ISBN 978-960-204-292-2. [Google Scholar]
  35. Cajthaml, J. Methods of Georeferencing Old Maps on the Example of Czech Early Maps. In Proceedings of the 25th International Cartographic Conference; ICA: Paris, France, 2011. [Google Scholar]
  36. Livieratos, E.; Boutoura, C.; Koussoulakou, A.; Ploutoglou, N.; Tsorlini, A. Karten von Attika: A Major German Contribution to Greek Cartographic Heritage and Its Digital Approach. In Proceedings of the 26th International Cartographic Conference; ICA: Dresden, Germany, 2013; pp. 25–30. [Google Scholar]
  37. Pethen, H. Errors, Inaccuracies, Resolution and RMSE: Georeferencing a Difficult Map of Abu Rawash’s Pyramid and Cemeteries. Scribe in the House of Life: Hannah Pethen Ph.D. 2021. Available online: https://hannahpethen.com/2021/04/28/errors-inaccuracies-resolution-and-rmse-georeferencing-a-difficult-map-of-abu-rawashs-pyramid-and-cemeteries/ (accessed on 27 March 2023).
  38. Schaffer, G.; Levin, N. Reconstructing Nineteenth Century Landscapes from Historical Maps—The Survey of Western Palestine as a Case Study. Landsc. Res. 2015, 41, 360–379. [Google Scholar] [CrossRef]
  39. Conolly, J.; Lake, M. Geographical Information Systems in Archaeology; Cambridge University Press: Cambridge, UK, 2006; ISBN 978-0-511-80745-9. [Google Scholar]
  40. Kulawiak, M.; Dawidowicz, A.; Pacholczyk, M.E. Analysis of Server-Side and Client-Side Web-GIS Data Processing Methods on the Example of JTS and JSTS Using Open Data from OSM and Geoportal. Comput. Geosci. 2019, 129, 26–37. [Google Scholar] [CrossRef]
  41. Bećirspahić, L.; Karabegović, A. Web Portals for Visualizing and Searching Spatial Data. In Proceedings of the 2015 38th International Convention on Information and Communication Technology, Electronics and Microelectronics (MIPRO), Opatija, Croatia, 25–29 May 2015; pp. 305–311. [Google Scholar]
  42. Keates, J.S. Understanding Maps, 2nd ed.; Routledge: Abingdon-on-Thames, UK, 1996; ISBN 978-0-582-23927-2. [Google Scholar]
Figure 1. Representation of the steps of the methodology to achieve the research aim of this work.
Geographies 03 00021 g001
Figure 2. The twenty-four stitched adjacent cartographic sheets of Kaupert’s Maps of Attica.
Geographies 03 00021 g002
Figure 3. Difficulty identifying the word. Tränke (DE)/Brücke (DE).
Geographies 03 00021 g003
Figure 4. The towers were digitized using point instead of line geometry, avoiding reflecting their floor plan that sometimes appears on the map. In this case, the aim was to preserve the position of the archaeological remains rather than their geometry.
Geographies 03 00021 g004
Figure 5. The water conduits were digitized using line geometry. In two different cases, by joining the individual point symbols as they indicate the original/surviving length of the aqueduct or by digitizing the line symbol. The aim was to demonstrate the continuity and the length of the aqueducts.
Geographies 03 00021 g005
Figure 6. The settlements were digitized using polygon geometry. The polygon was implemented to enclose all the black signs, which are identified as houses, trying in this way to reflect the extent of each settlement.
Geographies 03 00021 g006
Figure 7. The labels were digitized using line geometry, following the shape of the word. If the label is written in two lines, then the digitization line is placed between them. The location of the digitization line reflects the position of the label in the web mapping application.
Geographies 03 00021 g007
Figure 8. An artificial grid constructed on Kaupert’s Maps of Attica by transforming the coordinates at the edges of each map sheet.
Geographies 03 00021 g008
Figure 9. The distribution of the 514 GCPs.
Geographies 03 00021 g009
Figure 10. The distribution of GCPs on the map with the size of the arrow proportionally reflects the size of the residual of each GCP.
Geographies 03 00021 g010
Figure 11. The general architecture of the web mapping application.
Geographies 03 00021 g011
Figure 12. Screenshots of the web mapping application displaying the two key tools used in the raster image (the historical Maps of Attica) to facilitate map exploration based on a modern map.
Geographies 03 00021 g012
Figure 13. Screenshot of the final version of the web mapping application, showing the capabilities of overlaying the Maps of Attica and the digitized features on top of a modern cartographic map.
Geographies 03 00021 g013
Figure 14. Screenshot of the final version of the web mapping application, showing the feature of linking Milchoefer’s Explanatory Text with the Maps of Attica and vice versa.
Geographies 03 00021 g014
Figure 15. Screenshot of the final version of the web mapping application, demonstrating the filtering functionality.
Geographies 03 00021 g015
Table 1. The classification of cartographic data depicted on the Maps of Attica.
Domestic Spacefarm/metochihousesettlement/village
Defensefortificationsmilitary facilitiesnaval base
Transportcoastal navigationrailroadroad network
Water Supplycisternfountainhydraulic structurewater conduitwell
Cultchurchmonasterysanctuary
Funerary Spacecemeterygravetumulus
Port Infrastructuresferrylighthouseportshipshed
Economyagricultureanimal husbandrycoastal activitiesindustrymines/quarriesservices
Recreationhippodromeobservation towerstadiumtheaterwildlife park
Healthbathhospitalquarantine
Civilparliament
Educationeducational institutionmuseumobservatory
Sites
Scattered Materialarchitecturalburialsculpturesvarious
Other Remainsarchitecturalexcavationinscriptionsvarious
Natural Featuresfluvial featureshuman interventionlandform featuresmarine features
Table 2. Signs and labels data entries.
Signs Data EntriesLabels Data Entries
domestic space163475
defense124137
transport343103
water supply677704
cult587491
funerary space471300
port infrastructures1322
economy656695
recreation67
health56
civil11
education45
sites0107
scattered material4565
other remains824551
natural features145673
Disclaimer/Publisher’s Note: The statements, opinions and data contained in all publications are solely those of the individual author(s) and contributor(s) and not of MDPI and/or the editor(s). MDPI and/or the editor(s) disclaim responsibility for any injury to people or property resulting from any ideas, methods, instructions or products referred to in the content.

