Article

A Constraint-Based Generalization Model Incorporating a Quality Control Mechanism

1
Cartography Laboratory, School of Rural, Surveying and Geoinformatics Engineering, National Technical University of Athens, 15780 Zografou, Greece
2
Internal Quality Unit, Hellenic Cadastre, 15562 Holargos, Greece
*
Author to whom correspondence should be addressed.
Geographies 2023, 3(2), 321-343; https://doi.org/10.3390/geographies3020017
Submission received: 31 January 2023 / Revised: 2 April 2023 / Accepted: 24 April 2023 / Published: 8 May 2023
(This article belongs to the Special Issue Geovisualization: Current Trends, Challenges, and Applications)

Abstract

:
Automation in map production has created the need for modeling the map composition process. Generalization is the most critical process in map composition, with considerable impact on the quality of features portrayed on the maps. Modeling of the generalization process has been an area of research for several years in the international cartographic community. Constraint-based generalization modeling prevailed, and it is evolving to an agent model or to other optimization models. The generalization model presented in this paper is based on constraint-based modeling. It introduces the standardization of the semantic and cartographic generalization process together with an evaluation mechanism for the assessment of the quality of the resulting cartographic data considering simultaneously the preservation of the shape of the portrayed linear and area features. For cartographers, quality management is a key factor in creating an evidence-based, reliable product. To achieve this objective, cartographers, drawing on international experience, should implement a quality policy and adopt a quality management system (QMS) as an integral part of the map production process, starting with the quality assessment of the input data and finishing with the evaluation of the final product.

1. Introduction

As a means of depicting the geography of an area, maps aim to store and display the geographic information of the area, considering the geographic features and their relationships. When considering the purpose of the map, scale restricts the display of geospatial entities (features’ arrangement and their relationships), which is implemented through generalization (semantic and cartographic). The selection of the features to be depicted, along with their accuracy and clarity in portrayal together with the integrity of their relationships, are the goal of generalization.
Generalization is the most critical transformation in cartography, causing modification of features’ shape and—occasionally—a partial to complete elimination of spatial information. Generalization modeling aims to control the process of generalization and has been a field of extensive research since the 1990s. A turning point in generalization modeling was the development of the constraint-based generalization model, which approaches generalization holistically through the integration of an evaluation mechanism for assessing the state of the data before, during and after generalization.
This article elaborates on the development of a constraint-based generalization model integrating a quality model with a shape evaluation mechanism, which was introduced partially in the previous work of the authors [1,2]. Considering generalization as the transition from a geospatial database (digital landscape model—DLM) to a cartographic one (digital cartographic model—DCM) as proposed by [3] and adopted by several European national mapping agencies [4], two complete topographic maps at scales 1:500,000 and 1:1,000,000 are composed. The maps produced are the result of the generalization process (semantic and cartographic) implemented on the EuroRegional Map geodatabase at scale 1:250,000 (area 15,143 km2). The map feature classes include populated areas (points/polygons), coastline, road, railway and hydrographic network (linear features), and lakes and islands (polygons). Generalization is guided and evaluated in the framework of the constraint-based generalization model. A fundamental prerequisite for the accomplishment of the smooth and uninterrupted model function is the suitable quality of the input data. Therefore, the preliminary transition process from the geographic database to the initial spatial database is evaluated through the implementation of a separate quality model. This is also incorporated as a special issue in this article, together with a test case regarding the construction of the spatial database (at scale 1:25,000) derived from cadastral data. Attempting to extend the implementation of the introduced constraint-based generalization model to geodatabases at larger scales, containing cadastral data as proposed in [2], an additional test case is presented for the transition of the spatial database at scale 1:25,000 to a cartographic database at scale 1:50,000 and the production of the relevant map (with generalization applied on the road network feature class).
In the following sections, three processes are described for the successful construction of a cartographic database to be used for map composition, utilizing data of suitable quality and considering shape preservation of linear and polygonal features: (a) transition from a geographic database to the spatial database, (b) semantic generalization and (c) cartographic generalization. Each one of the three processes is based on a methodology for controlling data quality and securing an outcome of acceptable quality. Map specifications and ISO standards for spatial data quality are used, and new specifications and quality requirements, together with their corresponding measures and conformance levels, are composed. Test cases are demonstrated as a proof of concept for the validity of the proposed methodology.

1.1. Background and Recent Achievements on the Evaluation of Generalization

Generalization modeling has occupied the scientific community as a special research issue in automated map production since the 1990s. Three generalization models have been developed: (a) condition-action modeling or rule-based systems, (b) human interaction modeling and (c) constraint-based modeling, which prevailed among the three [5]. Constraint-based modeling introduced by [6] attempts to identify a state where a variety of constraints are satisfied [7]. Constraints are connected to measures and guide the generalization process through their satisfaction [5]. Constraint-based modeling constitutes the base for the development of optimization models (agent modeling, combinatorial optimization, continuous optimization) [5], as it integrates an evaluation mechanism to control the generalization process.
Quality evaluation and assessment in generalization has been identified as an inextricable part of the generalization models since the first attempts on the topic [8,9,10,11,12]. Current approaches regarding the integration of an evaluation process in generalization are based on the research conducted in the framework of: (a) the AGENT project (IGN, France), on the methodologies proposed by [13] and that of [14]; and (b) the EuroSDR project and the studies conducted by [15,16]. To encompass the scientific knowledge on generalization modeling and evaluation, three sub-processes are defined [17]:
  • evaluation for tuning before the commencement of generalization;
  • evaluation for controlling during generalization;
  • evaluation for assessing at the end of the generalization where the three processes are integrated, as proposed by [14].
In addition, considering the proposed conceptual framework by [17], the generalization model suggested by [9] and the methodologies proposed by [13,14] and [18] identify three basic components of the automated evaluation process:
  • definition and formation of map requirements as constraints;
  • identification of measures for automated evaluation;
  • execution of data matching between initial and resulting data.
In recent years, several national mapping agencies have implemented automated or semi-automated processes in map production (Ordnance Survey of Great Britain (OSGB); Institut Geographique National—IGN, France; The Netherlands Kadaster; Institut Cartografic de Catalunya—ICC, Spain; AdV—Germany; Swisstopo—Switzerland; KMS—Denmark; and USG-S—USA) [4,19,20,21] with multi-agent systems prevailing in generalization processes. Despite the evolution of automation in map production, there is a lack of a high-impact methodology concerning generalization modeling [22]. Emerging research on deep learning integration in generalization modeling has appeared, but it is still at an early stage [22,23,24].

1.2. Research Goals and Innovation

As it is pointed out in the introduction, the work presented in this article is the amalgamated outcome of the efforts presented in [1,2] concerning the design of a constraint-based generalization model, together with a quality model for each phase of generalization (semantic and cartographic) and its implementation for the construction of a complete topographic map. With the aim to contribute to the constraint-based modeling evolution, the work presented here covers special issues where scientific knowledge in generalization modeling needs to be enhanced with methods concerning the evaluation of shape preservation and legibility violation tolerances [18], as well as simplified techniques for the resolution of geometric conflicts which perform better—in some cases—than those used by the complex multi-agent systems [4]. It also incorporates the design of the semantic constraint-based generalization model applied to a geospatial database, which is considered a prerequisite for cartographic generalization in the current multi-agent systems but is not described formally in published scientific literature. In addition, a new shape measure is introduced along with a method for the selection of the appropriate generalized feature for display preserving shape [2].
In this article, a comprehensive methodology for the design of the proposed constraint-based generalization model is analyzed. The article is structured in three sections. In the first section, the proposed constraint-based generalization model is presented together with the special case of quality management in transitioning a geographic database to a geospatial one (Section 2.1). The semantic generalization process, first introduced in [1], is further analyzed to be the fundamental generalization process as it constitutes the reference for the creation of the cartographic database. A new technique for a network’s density reduction is also developed, including legibility violation tolerances, based on the features’ geometric characteristics. Cartographic generalization is also presented briefly (Section 2.3), based on [2], in order to prove the functionality of the proposed constraint-based generalization model as it results in the cartographic database used for display. Along with the synoptic approach to cartographic generalization, guidelines are provided for the configuration of the method introduced in [2] for the evaluation and assessment of shape preservation. In Section 2.4, a formulated example of the semantic and cartographic generalization of the road network at scale 1:500,000 is presented. In Section 3, the results of the test cases are presented with the corresponding maps. Finally, in Section 4, a discussion based on the results is included, followed by topics for future research.
Regarding the constraint-based model application environment, it is clarified that functions of the ESRI ArcGIS software (ESRI’s file geodatabases, ESRI’s point remove simplification algorithms, and ESRI’s bend simplify algorithm) are used in combination with free-access library tools in the Python programming language (SciPy, https://scikit-learn.org/stable/, Scikit-learn, https://scipy.org/, Shapely, https://pypi.org/project/Shapely/, accessed on 20 January 2021). New functions have been developed in the Python programming language in the context of the research on similarity measures, shape representation techniques, measures of horizontal accuracy, topological consistency, conceptual consistency, relative position, legibility evaluation, network density reduction techniques and process automation. ESRI’s ArcMap software is used to compose and display the maps.

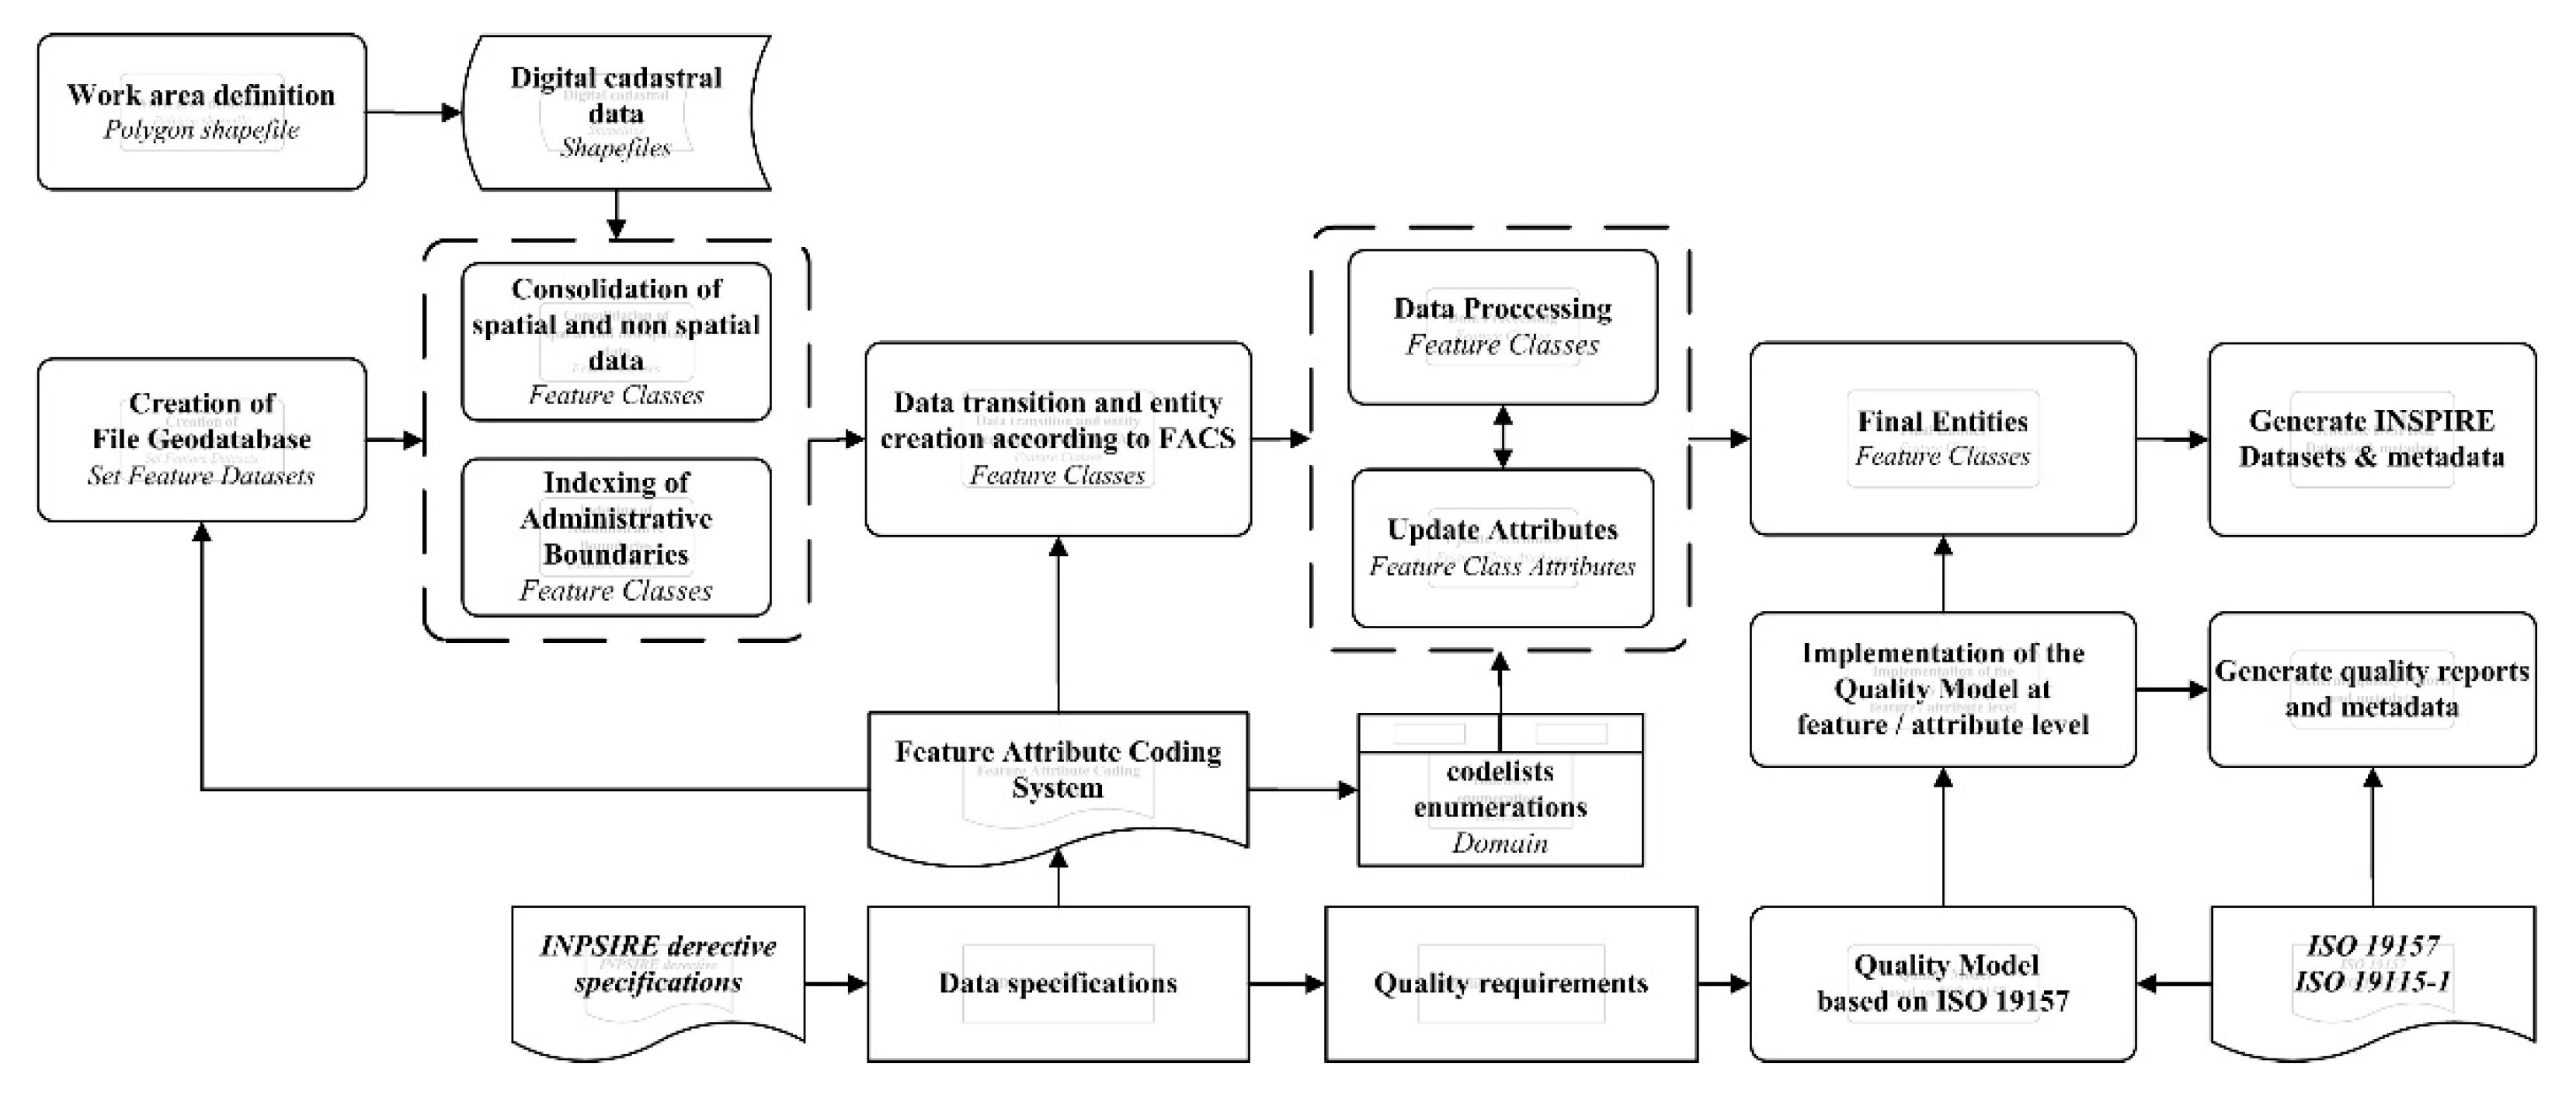
2. A Constraint-Based Generalization Model Encompassing an Evaluation and Assessment Methodology for Cartographic Data

The proposed generalization model adopts the approach introduced by [3] that defines the generalization process as the transition from a spatial database originating from a geographic database to a cartographic one. Constraint-based modeling is used as the prototype for the design of the proposed generalization model, which integrates an evaluation routine designed according to [17] as a quality model for each phase of the generalization process (semantic and cartographic). The proposed quality model is composed of three elements and is constructed according to [18]. The three structural elements of the quality model are adequate for the implementation of each phase of the generalization process (introduced partially in [1]), and they are presented complete as follows:
  • Structural element 1: It includes a) the map specifications expressed as constraints along with their violation thresholds for guiding the generalization process, and b) the map quality specifications expressed as quality requirements along with their conformance levels for the evaluation and the quality assessment of the resulting cartographic data;
  • Structural element 2: It includes the measures and techniques for the evaluation of the features’ state, the assessment of their compliance with the constraints before and during generalization, and their compliance with the quality requirements after the generalization transformations;
  • Structural element 3: It includes the constraint-based generalization process (semantic and cartographic) and the quality control stage configured as follows:
    • The process for the selection of the appropriate generalization transformation with its corresponding algorithm through the evaluation and the assessment of the state of the features before generalization with respect to the set constraints;
    • The execution of the transformation algorithms and the evaluation of the features’ condition through the assessment of their compliance with the constraints during the generalization process. In case of non-compliance issues, a different calibration of the parameters of the algorithm used is performed, or a different algorithm suitable for the selected transformation is utilized;
    • The quality checks evaluate the condition of the features at the end of each phase of the generalization process through the assessment of their compliance with the quality requirements. In the case of error detection, an extra generalization transformation is carried out, such as elimination or displacement.
The formulation of constraints is based on the EuroSDR project approach as described in [25] (legibility and appearance preservation constraints), enriched with new features concerning semantic generalization. Quality requirements are formed considering the three quality components: (a) geometric quality regarding the features’ shape and position, (b) thematic quality regarding the features’ categorization and their attributes’ values, and (c) graphic/Gestalt quality regarding the map’s legibility and its ability to represent geographic phenomena, namely the features’ relationships (conceptual and topological).
As mentioned in the introduction, the knowledge of the quality of the input data is critical for the implementation of the proposed constraint-based generalization model. Therefore, a methodology for the assessment of the quality of the spatial data and the method for the transition of a geographic database to a spatial one are also incorporated in the next section as a special subject matter utilizing data from the Hellenic Cadastre (Section 2.1).

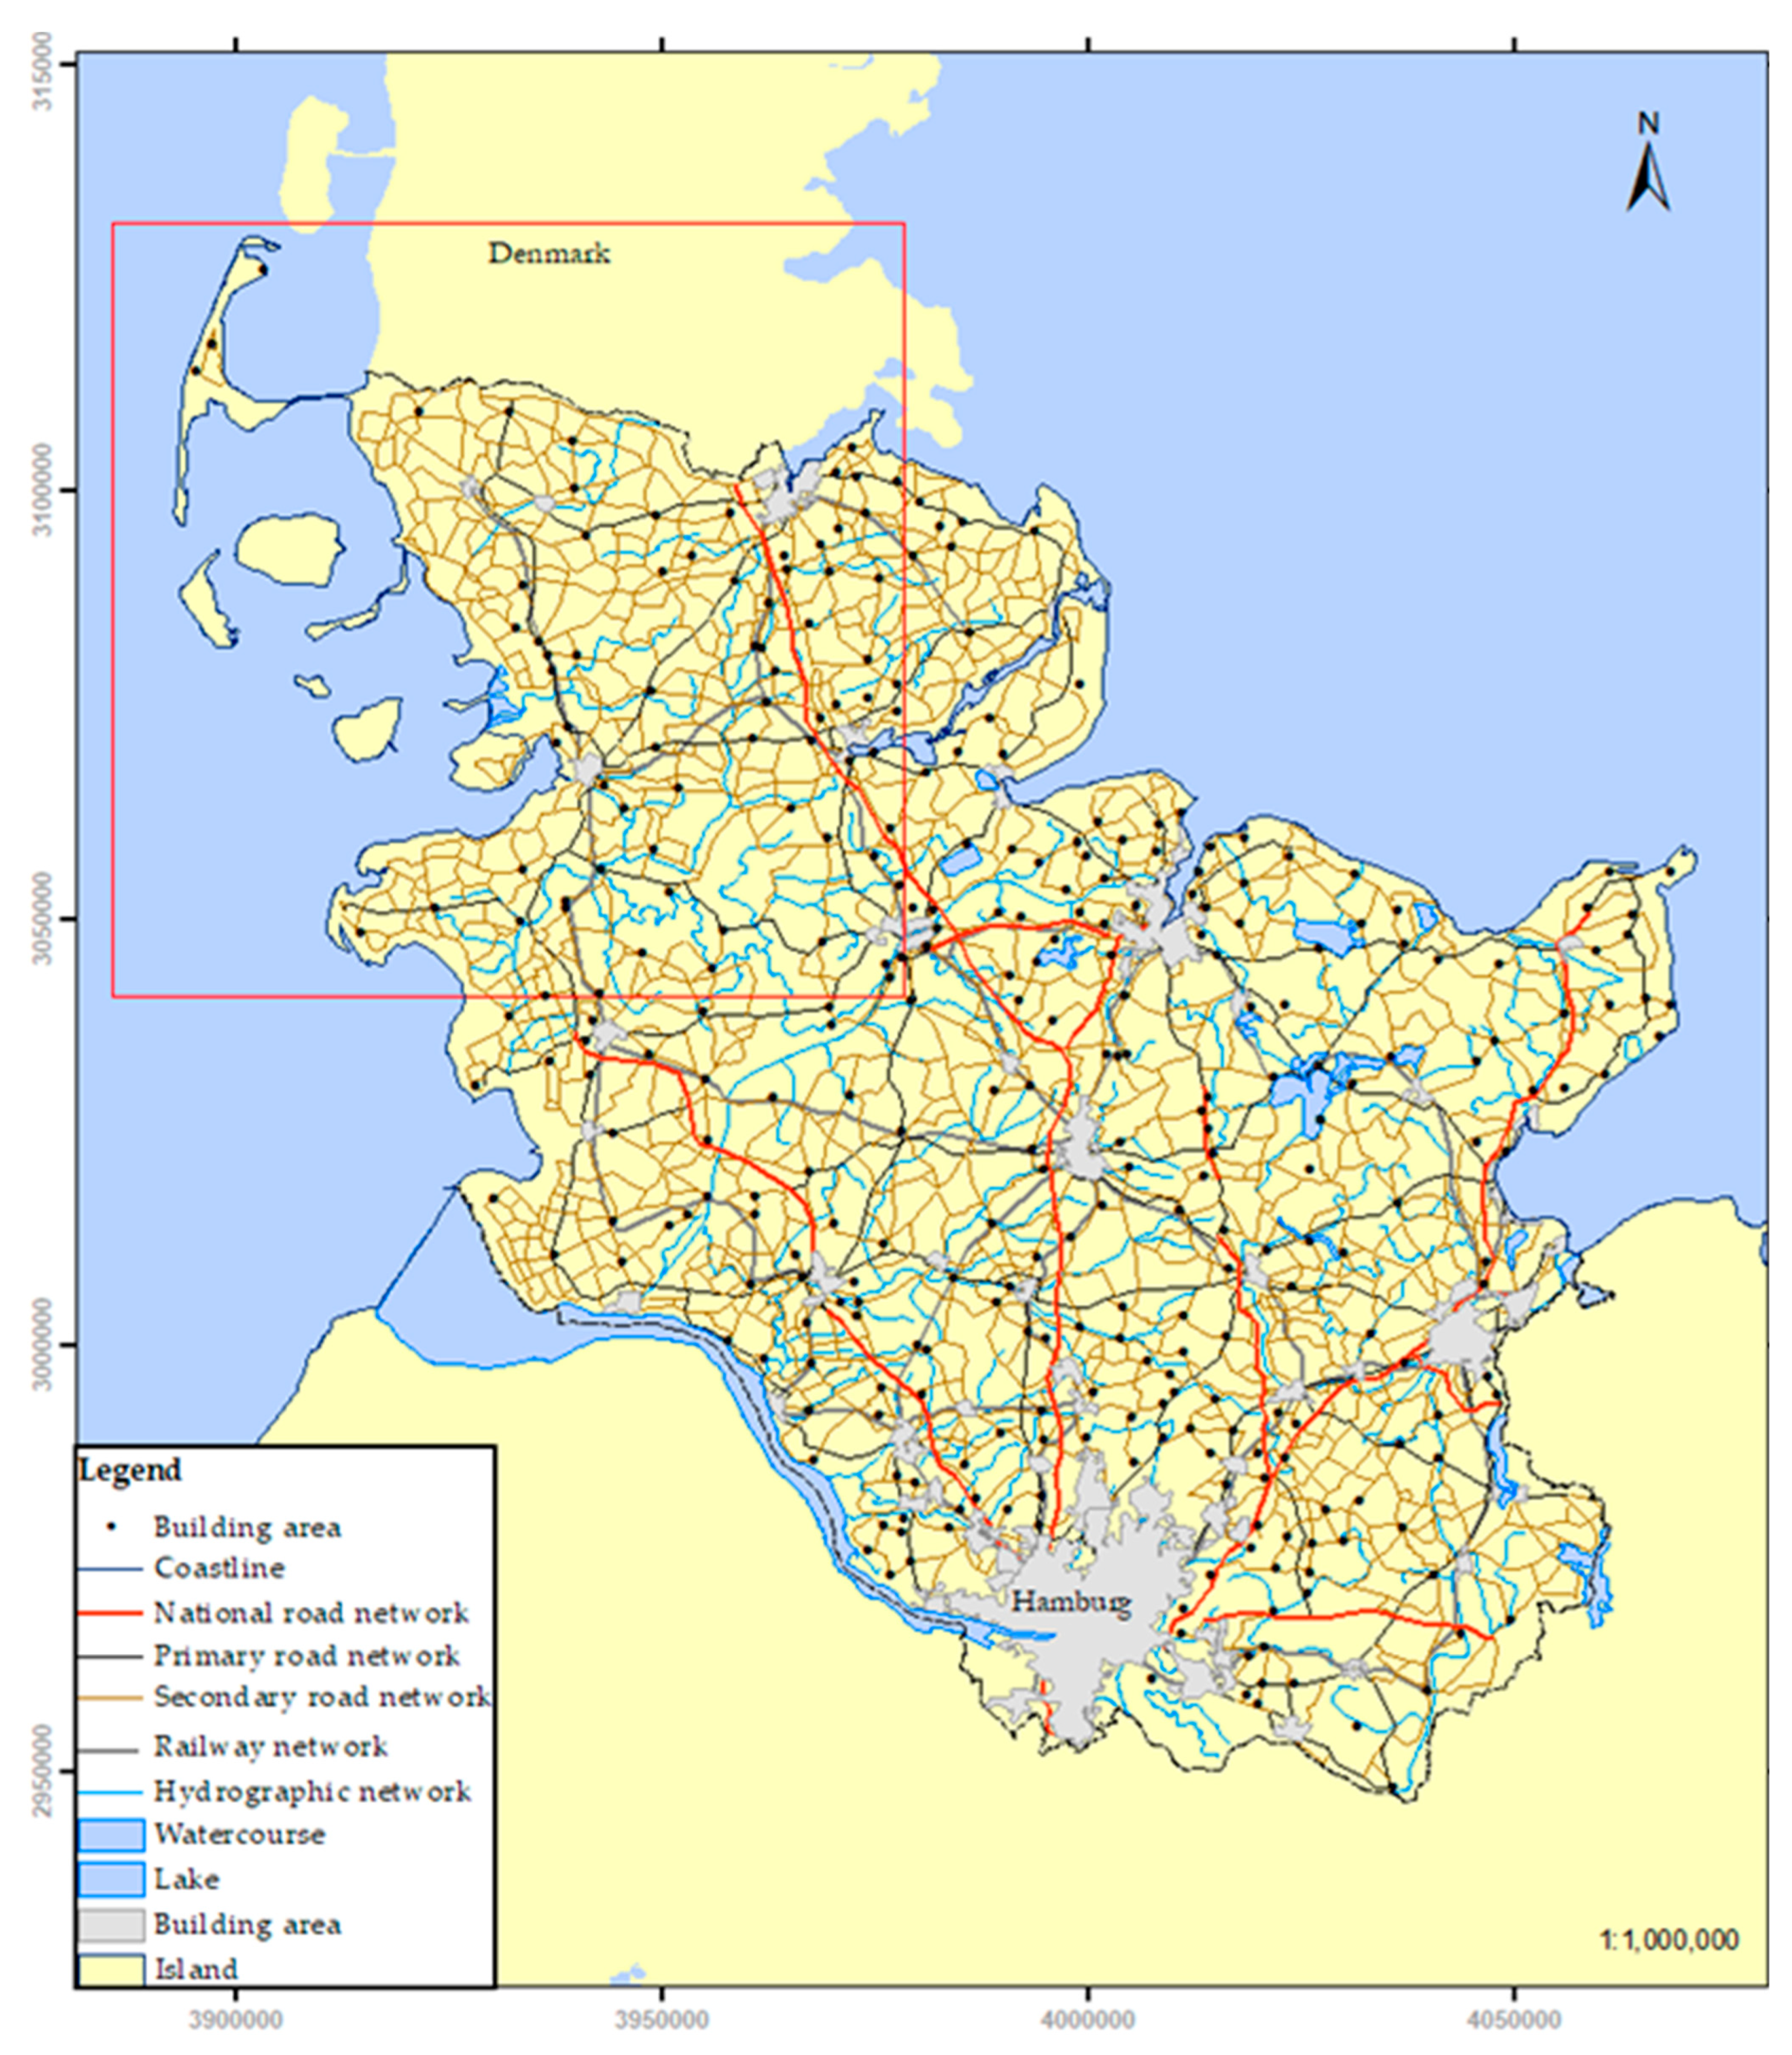
2.1. Quality Management in Transitioning Geographic Databases to Spatial Databases at Different Scales

In map composition, map producers use different types of geospatial data from a variety of sources collected for different purposes. They then integrate this data into software applications and process it using various procedures and methodologies, which are additional sources of error for the resulting product. It is important for cartographers that quality management is a key factor in the creation of an evidence-based, reliable product. To achieve this objective, the cartographer, drawing on international experience, should implement a quality policy and adopt a quality management system (QMS) as an integral part of the map production process. By applying QMS to the production of geospatial data, quality management is involved in all phases of its production, from the definition of user requirements to the delivery of the final product. The adoption of a QMS based on international standards will ensure the expected quality of the map to the satisfaction of its users.
In this context, and as far as quality management is concerned, cartographers are required to consider user requirements to define quality requirements and quality objectives at each implementation phase, to use monitoring indicators in order to determine whether or not the quality objectives are achieved, to adequately document the quality of the map produced, and to assess the degree of user satisfaction with a view to further improve the quality of the map. To optimize quality management within a QMS, it is indispensable—as best practice—to develop and implement a quality model that will form the core of the QMS.
Table 1 shows how quality management is involved in the main phases of the geospatial data production process.
Interpreting the contents of Table 1, the core of the quality system is the compilation and implementation of a quality model. In the following paragraphs, the methodology for developing and implementing the quality model applied to evaluate and document the quality of the spatial database created is elaborated.

2.1.1. Spatial Database Development—Data Model

A software application is developed to integrate the cadastral data held by the Hellenic Cadastre, at scale 1:1000 for urban areas and 1:5000 for other areas of Greece, into a spatial database. The aim of the application is to create the necessary spatial data to be used as reference data to produce a topographic map at scale 1:25,000 for the country.
The structure of the spatial database is implemented based on a predefined feature attributes coding system (FACS) that includes the following categories of entities:
  • AdministrativeUnits;
  • Topography;
  • SpotElevation;
  • Hydrography;
  • TransportNetworks;
  • PopulatedPlaces;
  • LandUse;
  • ProtectedSites;
  • UtilityNetworks;
  • NamedPlaces;
  • GeneralFeatures.
For the coding of the entities, the selection of their attributes, and their field of definition, the technical specifications of the INSPIRE directive adapted to the data are used. This is because the geospatial database to be created will contain data fully compliant with the specifications of the INSPIRE Directive.
The design and implementation of the spatial database include the stages of conceptual, logical, and physical design. Following the building of the feature attribute coding system (FACS), the data’s conceptual, logical, and physical model is compiled.
Figure 1 shows the implementation flow of the spatial database based on its conceptual and logical design.
A standalone software application for Microsoft Windows has been developed to create, feed, and update the spatial database and to assess the quality of the data. The application has been developed in the Microsoft Visual Studio environment, which is the main management platform of the application and is used in the implementation of its interface with the operator. The management of spatial information and the application of the quality model are executed in ArcMap. For data analysis, data integration and data processing code are developed in Python programming language using the ArcPy site package.

2.1.2. Compilation and Implementation of the Quality Model

According to [27], a quality model for geospatial data is defined as “a model describing the quality of a geospatial data set according to the technical specifications” (fit-for-purpose QM). According to [26], a quality model for geospatial data is defined as “a framework for the measurement and the representation of the quality of a dataset”. The Quality Knowledge Exchange Network (Q-KEN) Committee of Eurogeographics, propose a more comprehensive definition, which defines the geospatial data quality model as “A framework for defining, evaluating, documenting, and presenting the quality of spatial data sets and geo-services according to their specifications” [28]. During its implementation, the differences between the dataset and the “Universe of Discourse” (UoD) are identified, detected and measured to assess their significance and to be documented in the quality reports and transcripts.
The “quality” of data is involved in all phases of the production process (see Table 1). The best methodology to ensure data quality and achieve quality objectives is the development and implementation of a spatial data quality model (SDQM) using international standards [26,29,30]. The goal of a successful implementation of an SDQM is to measure the extent to which the requirements of the specifications are met and to ensure that the needs of data users are met in a timely and efficient manner. When implemented, a SDQM provides (a) a common understanding of data quality issues across all stakeholders, (b) improved performance, (c) lower production costs, (d) confidence in the data, and (e) more effective management and monitoring of data quality.
Quality in geospatial data sets refers to the entity level, which is the basic building block. The SDQM identifies the quality requirements at the entity level, detects the sources of potential errors affecting data quality, and identifies the metrics required to quantify quality and to assess and ensure the quality of the data. The first and foremost step in the design and development of an effective quality model is the analysis and identification of quality requirements and objectives.
For each quality requirement, the quality parameters are selected consisting of a combination of a quality element and a quality measure. Based on the above, the quality model is developed using the ISO 19157:2013 [31] standard. For each combination of quality element and quality measure, a method of evaluation is used to assess the quality and quantify possible errors in the data set. Table 2 shows a part of the SDQM. It shows the quality parameters selected to assess the quality of the administrative unit’s data set (polygon entities).
In addition, the cell color indicates the evaluation technique chosen to evaluate the quality and quantify the quality measure:
  • Sampling inspection according to ISO 2859–1 [32] (yellow cells);
  • Sampling inspection according to ISO 3951–1:2013 [33] to determine sample size and FGDC standard [34], [35] for the distribution of the checkpoints (green cells);
  • Full inspection (orange cells).

2.1.3. Quality Results

The application of the quality model for each combination of quality element/quality measure results in a quality value. The software application developed provides specific functionality that helps the evaluator to implement the quality model and the chosen evaluation techniques. The results of the assessment are stored automatically or manually (depending on the evaluation technique used) in a specific table within the geodatabase (see Table 3). The evaluator then automatically derives the evaluation results in the form of a quality report and/or metadata file based on the requirements of ISO 19157 [31]. For the cartographer to decide whether and to what extent the geospatial data created are suitable for use to produce a map, they should assess the resulting quality outcome. The evaluation of the quality results is carried out in comparison with the quality objectives established in advance. If the results of data quality are appropriate, they can proceed to the next stage of simplification/generalization. If one or more of the quality objectives are not met, revision of the specifications, selection of new reference data sets, update of the quality model and/or revision of the levels of compliance set is required.
An example of the evaluation of the quality outcomes associated with the dataset for the administrative units in the work area is shown in Table 3. The cadastral data used as reference data have documented but unpublished quality.
For sampling inspection of completeness and thematic accuracy (yellow cells), recent data and the administrative division of Greece were used as references. As expected, the resulting qualitative results are zero, confirming the quality of the reference data. The logical consistency of the data is assessed automatically through full inspection. The quality results detected three topological errors referring to invalid sliver polygons. These errors are identified and quantified, and their location in the geodatabase is recorded. As their exact spatial location in the dataset is known, it is feasible to eliminate them in the next stage of the mapping process. The sliver polygons identified create very small gaps in the data in relation to the intended accuracy of the map, and their presence is not considered significant. The results of the positional accuracy checks, as expected, confirm the suitability of reference data. The inspection of temporal validity also gives zero results.
In conclusion, based on the evaluation of all quality results at the entity level of the spatial database, the predefined quality objectives are achieved, and the data are suitable for the production of smaller-scale maps. The data included in the spatial database are of acceptable quality and can be used as input data in the next stage of generalization.

2.2. Semantic Generalization Process

In this section, the semantic generalization process is deployed in the framework of the proposed quality model based on constraint-based generalization modeling. The semantic generalization process may alter the features’ categorization and attribution [36]. The presented generalization model adopted the semantic generalization transformations proposed by [36] on the schema level (class abstraction, class elimination, class composition, attribute elimination, attribute aggregation, modification of the feature class intension—namely the feature class joining rules) and the instance level (feature elimination, feature reclassification, features aggregation, feature merging, attribute values modification).
The semantic generalization constraints are formulated considering the process as a transition between the spatial and the cartographic databases [1]. It is implemented through the transfer of features from the spatial to the cartographic database and is based: (a) on the identification of the relation between the features classes of the initial database and those of the new one (one-to-one, many-to-one, one-to-none), and (b) to the determination of the semantic generalization transformations. Constraints include the legibility preservation requirement (features’ separation, minimum area, and length), the preservation of appearance (features’ arrangement/patterns and distribution), the compatibility between spatial and cartographic databases schemata (feature classes, feature attributes), the compatibility between spatial and cartographic databases physical structures (features’ geometric types, attributes fields types, attributes domains, projections), and the features’ compliance with their feature class rules (geometric and thematic). The quality requirements are formulated based on the quality components (thematic and graphic/Gestalt quality). The thematic quality checks include the examination of the information completeness of the features and their attributes, the features’ classification correctness, the domain consistency, and the attribute values’ correctness. The graphic/Gestalt quality checks include the examination of the legibility preservation (distance between features, density) and conceptual consistency. The constraints violation threshold and the quality requirements conformance levels are set to acceptable or unacceptable.
Quality measures provided by the ISO 19157 standard [31] for geospatial data quality are used for the evaluation of the features state and for the assessment of their compliance with the set thresholds and the quality requirements conformance levels. The ISO quality element “completeness” is used for the evaluation of feature classes and their attributes’ presence in both databases—namely, the spatial and the cartographic databases schemata. The ISO quality element “logical consistency” is adopted for the evaluation of the features’ conceptual consistency, the attribute values’ compliance with their attribute domain, and the spatial and cartographic databases’ physical structures compatibility. The ISO quality element “thematic accuracy” is adopted for the evaluation of the features categorization and their attribute values’ correctness. The graphic/Gestalt quality regarding map legibility is evaluated with a simple technique based on buffer zones. A network’s density reduction proved to be more complex; therefore, a special technique has been developed based on the features’ geometric characteristics when semantic information is missing. Five cases are examined and resolved regarding a network’s density reduction.
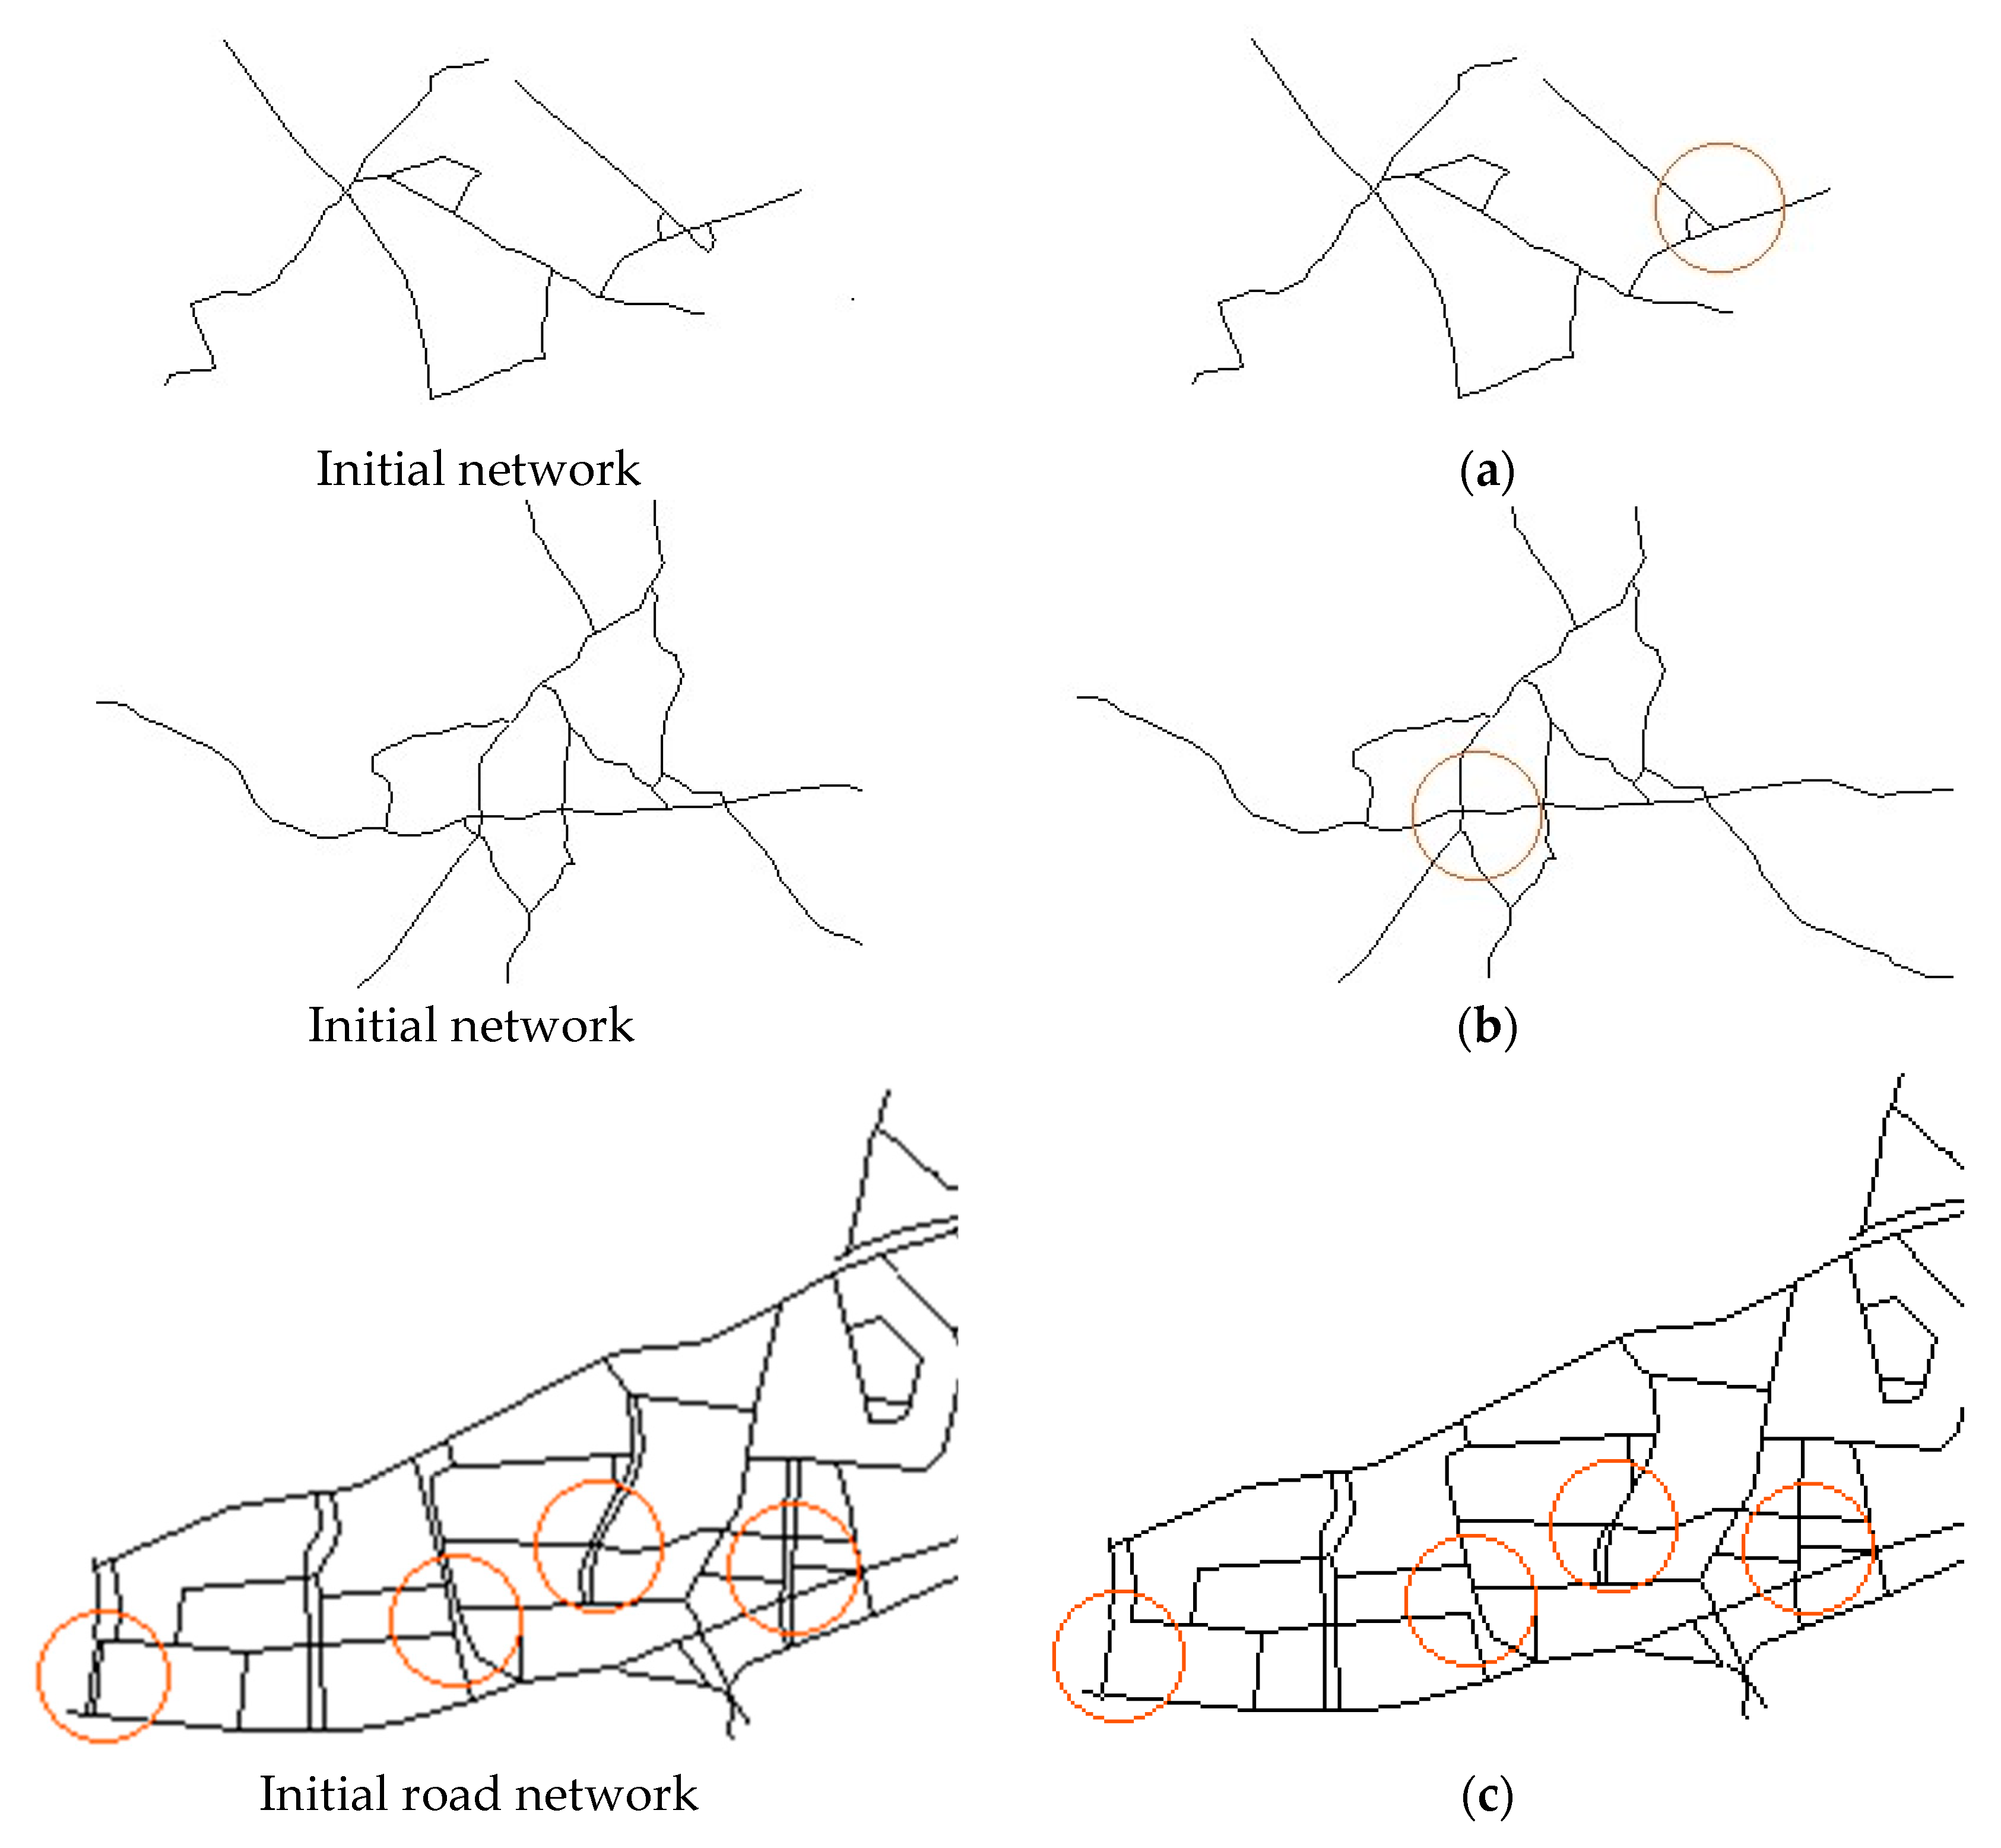
  • Junction of two lines (Figure 2a). A junction of two lines is detected when the endpoints of two lines coincide, and the lines are not closed (they do not have the same coordinates at the start and the endpoints). Two lists with the coordinates of the endpoints of the reference line are created, as well as the other two lists with the coordinates of the endpoints of the intersected lines. When the coordinates of the intersected lines lists belong to the lists of the reference line, then there is a junction of two lines. A line is eliminated when 20% of its length is included in the buffer zone (buffer zone width is set according to the separation distance limit of 0.25 mm at the generalization scale) of the reference line. Regarding railway and road networks, the line with the shortest length is the reference line because it is retained considering that the longest line is a siding line. The reverse case is applied on the hydrographic network considering that the longest line is the main river due to its shape sinuosity.
  • Junction of three lines (Figure 2b). A junction of three lines is detected when two lines having a node coinciding with each endpoint of the reference line have also another coinciding node that does not belong to the reference line. The longest line is eliminated, considering it as a bend when 20% of its length is included in the buffer zone (buffer zone width is set according to the separation distance limit of 0.25 mm at the generalization scale) of the reference line.
  • Junction of lines constitutes a polygon with an area less than the threshold. A polygon-to-area transformation is applied, and the longest line is eliminated in the case of the railway and road networks and the smallest in the case of the hydrographic network.
  • Two non-connected lines distinction (Figure 2c). A buffer zone is created around a reference line (buffer zone width is set according to the separation distance threshold of 0.25 mm at the generalization scale) of the reference line. The examined line included in the buffer zone of the reference line is eliminated if it does not intersect the reference line. To retain road continuity and considering that a road consists of several segments, a list is created containing the intersecting lines with the eliminated line each time an action is implemented. Each time an elimination need occurs for two lines, the elimination of the line included in the list is preferred.
  • Elimination of lines with a dangling node that is not included in the buffer zone (buffer zone width is set according to the separation distance limit of 0.25 mm at the generalization scale) of a point or polygon is conceptually inconsistent considering that lines in a network should be connected to a location or to each other.
  • “Orphan” lines. An “orphan” line is considered a line with dangling nodes at the endpoints. “Orphan” lines are eliminated as conceptually inconsistent.
The semantic generalization process is carried out per theme for each feature class following the order: polygons, lines, and points. Considering that: (a) the new cartographic database schema, and (b) the correspondence between feature classes and features attributes of the initial database schema with the new one is known; the progress of semantic generalization is carried out as follows:
  • Before generalization:
    • Compatibility evaluation between the initial and the cartographic database schemata regarding features classes and features’ attributes correspondence leading to the application of semantic transformations on features classes and features’ attributes (transformations on the schema level);
    • Compatibility of projections, feature classes’ geometric types, features’ attributes field types, and domains compatibility evaluation (transformations on the schema level).
  • During generalization: Transferring data between databases (from the spatial database to the cartographic one), implementing transformations on the instance level, and assessing transformation results per feature class to resolve possible conflicts.
    • Features’ compatibility evaluation against each feature’s class rules (geometric and thematic) leading to features reclassification/merging, elimination/aggregation, and their attributes’ value modification (transformations on the instance level);
    • Features’ compatibility evaluation to legibility rules (features distinction, density) leading to the features’ reclassification/merging, elimination/aggregation, and their attributes’ value modification (transformations on the instance level;
    • The three kinds of relationships between feature classes of the initial database and the new one (one-to-one, many-to-one, none-to-one) correspond to transformations on the schema level along with feature class attributes’ transformation (attribute elimination, attribute aggregation). They signify the transformations to be applied on the instance level for the successful completion of the transferring process. Specifically, the class abstraction transformation applies feature reclassification or feature merging followed by attribute values modification. Class elimination/class composition transformations apply feature elimination and feature aggregation;
    • Quality controls per feature class regarding features compliance with quality requirements: features number completeness (compatibility to the feature class rules), features correct categorization when subcategories’ attribute values are not null, attribute values completeness and correctness (no null values), attributes values compatibility to the attributes’ domains (domain consistency), conceptual consistency regarding “holes” creation when features are eliminated or merged.
  • At the end of the generalization process: Quality controls between feature classes.
    • Conceptual consistency evaluation and assessment in feature relationships regarding invalid overlaps usually occur because of the polygons merging when the space between them is filled. Conflicts are resolved by altering the features participating in the merging process or by canceling the action;
    • Legibility preservation evaluation regarding features distinction
With respect to map production at scales 1:500,000 and 1:1,000,000, legibility constraints are configured as follows: (a) the separation distance threshold is set at 0.25 mm at the generalization scale, (b) the polygons area threshold is set less than 1 km2 at scale 1:500,000 and less than 3 km2 at scale 1:1,000,000, (c) the lines length threshold is set shorter than 1 km at scale 1:500,000 and less than 2 km at scale 1:1,000,000 concerning lines in a network (railway, road, hydrographic) carrying one dangling node. Other constraints which lead to feature elimination or geometric transformation (e.g., polygon-to-point) are formulated based on thematic information like the built areas’ population or the missing information like rivers without names which are considered of minor importance. Semantic generalization on the railway, road, and hydrographic network is implemented basically as network reduction by using the techniques mentioned earlier. Semantic generalization on polygonal features (building areas and lakes) is based on thematic information (same names) and legibility constraints, and it is implemented through merging along with the integration of a polygon-to-point geometric transformation regarding the building areas’ feature class. The polygonal features at both scales (1:500,000 and 1:1,000,000) which are involved in a merging process, are derived directly from the initial spatial database at scale 1:250,000. The results of the quality controls at the end of the semantic generalization process are presented in Section 3.

2.3. Cartographic Generalization Process

In this section, the cartographic generalization process (following the semantic generalization phase) is deployed in the framework of the proposed quality model based on constraint-based generalization modeling. It aims to produce data suitable for display on the map. Cartographic generalization transformations have an impact on the features’ geometry and alter their spatial rendering. Based on this approach, the constraints in cartographic generalization refer to features shape preservation: (a) position and orientation preservation and (b) shape preservation. Respectively, the quality requirements in cartographic generalization are related to the geometric and graphic/Gestalt quality. The geometric quality assumes features relative position correctness. The graphic/Gestalt quality assumes legibility preservation, topological consistency (connectivity), and conceptual consistency. The constraints violation threshold and the quality requirements conformance levels are set to acceptable or unacceptable except for the case of the shape preservation constraint. The ISO 19157 [31] standard on quality measures for spatial data quality is used to evaluate the features’ condition and assess the features’ compliance with the constraint’s violation thresholds and the quality requirements conformance levels. The evaluation of the shape preservation constraint and the assessment of the features’ compliance with it (elaborated in [2]) requires the comparison of the initial feature’s shape with its new shape (after generalization). The shape-matching process is carried out through shape transformation (shape representation in another form, e.g., Fourier series, turning function, etc.) and measurement of its similarity using a similarity measure [37]. Considering the two approaches, guidelines are developed for the evaluation and assessment of the shape preservation degree during the generalization process. This includes:
  • Parametric description of the feature’s shape based on its geometric characteristics or its representation;
  • Evaluation of the feature’s shape condition through the application of a similarity measure for measuring the distance (dissimilarity) between the initial and the generalized feature, considering that a short distance corresponds to similarity and a long distance corresponds to dissimilarity [37];
  • Evaluation of the feature’s shape condition through the implementation of a legibility measure in the feature’s geometric elements (vertices, part-lines) for the evaluation of its shape sharpness;
  • Evaluation of the feature’s shape state through the application of a horizontal accuracy measure;
  • Evaluation of the feature’s shape state through the application of a topological consistency measure regarding the feature’s geometry for the evaluation of its shape integrity;
  • Assessment of the feature’s shape preservation degree based on the feature’s compliance with legibility, horizontal accuracy, and topological consistency constraints;
  • Assessment of the feature’s shape through a technique for the determination of the suitable shape for portrayal.
Based on these guidelines, a new shape measure was introduced in [2] along with shape parameterization and a technique for the selection of the most suitable shape for portrayal (test case included the simplification algorithms examination: ESRI’s point remove [38], and ESRI’s bend simplify [39]). Specifically, the turning function weighted length difference was introduced as a new shape measure. It is configured as the difference between the weighted turning function length of the original feature to the weighted turning function length of the generalized feature considering weight as the ratio of the number of vertices of the generalized feature to the number of vertices of the original feature:
L t f x N g N o , w e i g h t e d   t u r n i n g   f u n c t i o n   l e n g t h   o f   t h e   g e n e r a l i z e d   f e a t u r e
L t f x N o N o , w e i g h t e d   t u r n i n g   f u n c t i o n   l e n g t h   o f   t h e   i n i t i a l   f e a t u r e
  • No, Νg = the number of vertices of the initial, generalized lines;
  • Ltf = the turning function length considering the turning function as a step-function where on the x-axis, the normalized feature length [0,1] is set, and on the y-axis, the counterclockwise cumulative angle of the tangent at each feature vertex is set.
The proposed parameterization for shape description is based on the comparison between the shape measures and their suitability for the assessment of shape preservation in cartographic generalization. Hausdorff distance, modified Hausdorff distance, Fréchet distance, turning function distance as area, and distance between Fourier descriptors for different representation techniques were examined in [2]. Between them, the turning function weighted length and the modified Hausdorff distance proved to be the most appropriate for shape description as they are increasing along with spatial information reduction. The modified Hausdorff distance [40] between lines A and B is defined as follows:
f d A , B , d B , A = max d A , B , d B , A
  • d A , B = 1 N a a A d a , B ,
    t h e   d i s t a n c e   b e t w e e n   t h e   s e t   o f   p o i n t s   o n   l i n e   A   a n d   t h e   s e t   o f   p o i n t s   o n   l i n e   B ;
  • d B , A = 1 N β b Β d b , A ,
    t h e   d i s t a n c e   b e t w e e n   t h e   s e t   o f   p o i n t s   o n   l i n e   B   a n d   t h e   s e t   o f   p o i n t s   o n   l i n e   A ;
  • Na,Νβ = the number of points in each set of points on lines A and B;
  • d a , B = min | a b | ;
    the minimum Euclidean distance between point a on line A and the set of points on line B;
  • d b , A = min | b a | ,
    the minimum Euclidean distance between point b on line B and the set of points on line A.
The legibility constraints are related to the distinction between the features’ geometric elements (minimum accepted resolution of 0.25 mm at generalization scale). They are evaluated on the basis of measures estimating the “bottleneck phenomenon” and very sharp corners. The horizontal accuracy constraint is evaluated through the measurement of the percentage of the length of the generalized line located outside the buffer zone of the original line [41]. Aiming to avoid visual conflicts between features, the horizontal accuracy acceptable conformance level is set according to the minimum accepted resolution (0.25 mm) at the generalization scale. Topological accuracy constraints are evaluated based on measures provided by the ISO 19157 standard [31] regarding self-intersections and self-overlaps. Techniques for the implementation of the legibility measures, the horizontal accuracy and the topological consistency constraints are also provided in [2]. The selection of the suitable feature for portrayal is made from the group of features complying with legibility, horizontal accuracy, and topological consistency constraints. The hierarchical clustering process is applied to the feature’s shape description parameters estimated per the tolerance value of the simplification algorithm. For each cluster, a representative having the highest silhouette correlation coefficient is identified, and among them, the representative corresponding to the maximum tolerance value is considered the most appropriate for portrayal. In Figure 3, a test case of the proposed method for the selection of a suitable generalized line for portrayal is presented.
The cartographic generalization process is carried out in two stages. In the first stage, the generalization algorithm (simplification) is applied, and the selection method of the suitable feature for portrayal is carried out. In the second stage, quality controls are implemented for the evaluation and assessment of the resulting features in the first stage, including (a) topological consistency (overshoots, undershoots, sliver polygons); (b) conceptual consistency (invalid overlaps); (c) relative position preservation; and (d) legibility preservation (features distinction). Techniques for the application of the measures of the quality requirements concerning topological consistency, conceptual consistency, relative position accuracy, and legibility preservation are also provided in [2].
The simplification algorithm of ESRI’s point remove [38] is applied on the road and railway network, and ESRI’s bend simplify [39] is applied on polygonal features and hydrographic network to produce the maps at scales 1:500,000 and 1:1,000,000. Regarding the simplification of the road network at scale 1:50,000, the ESRI’s point remove [38] algorithm is utilized.

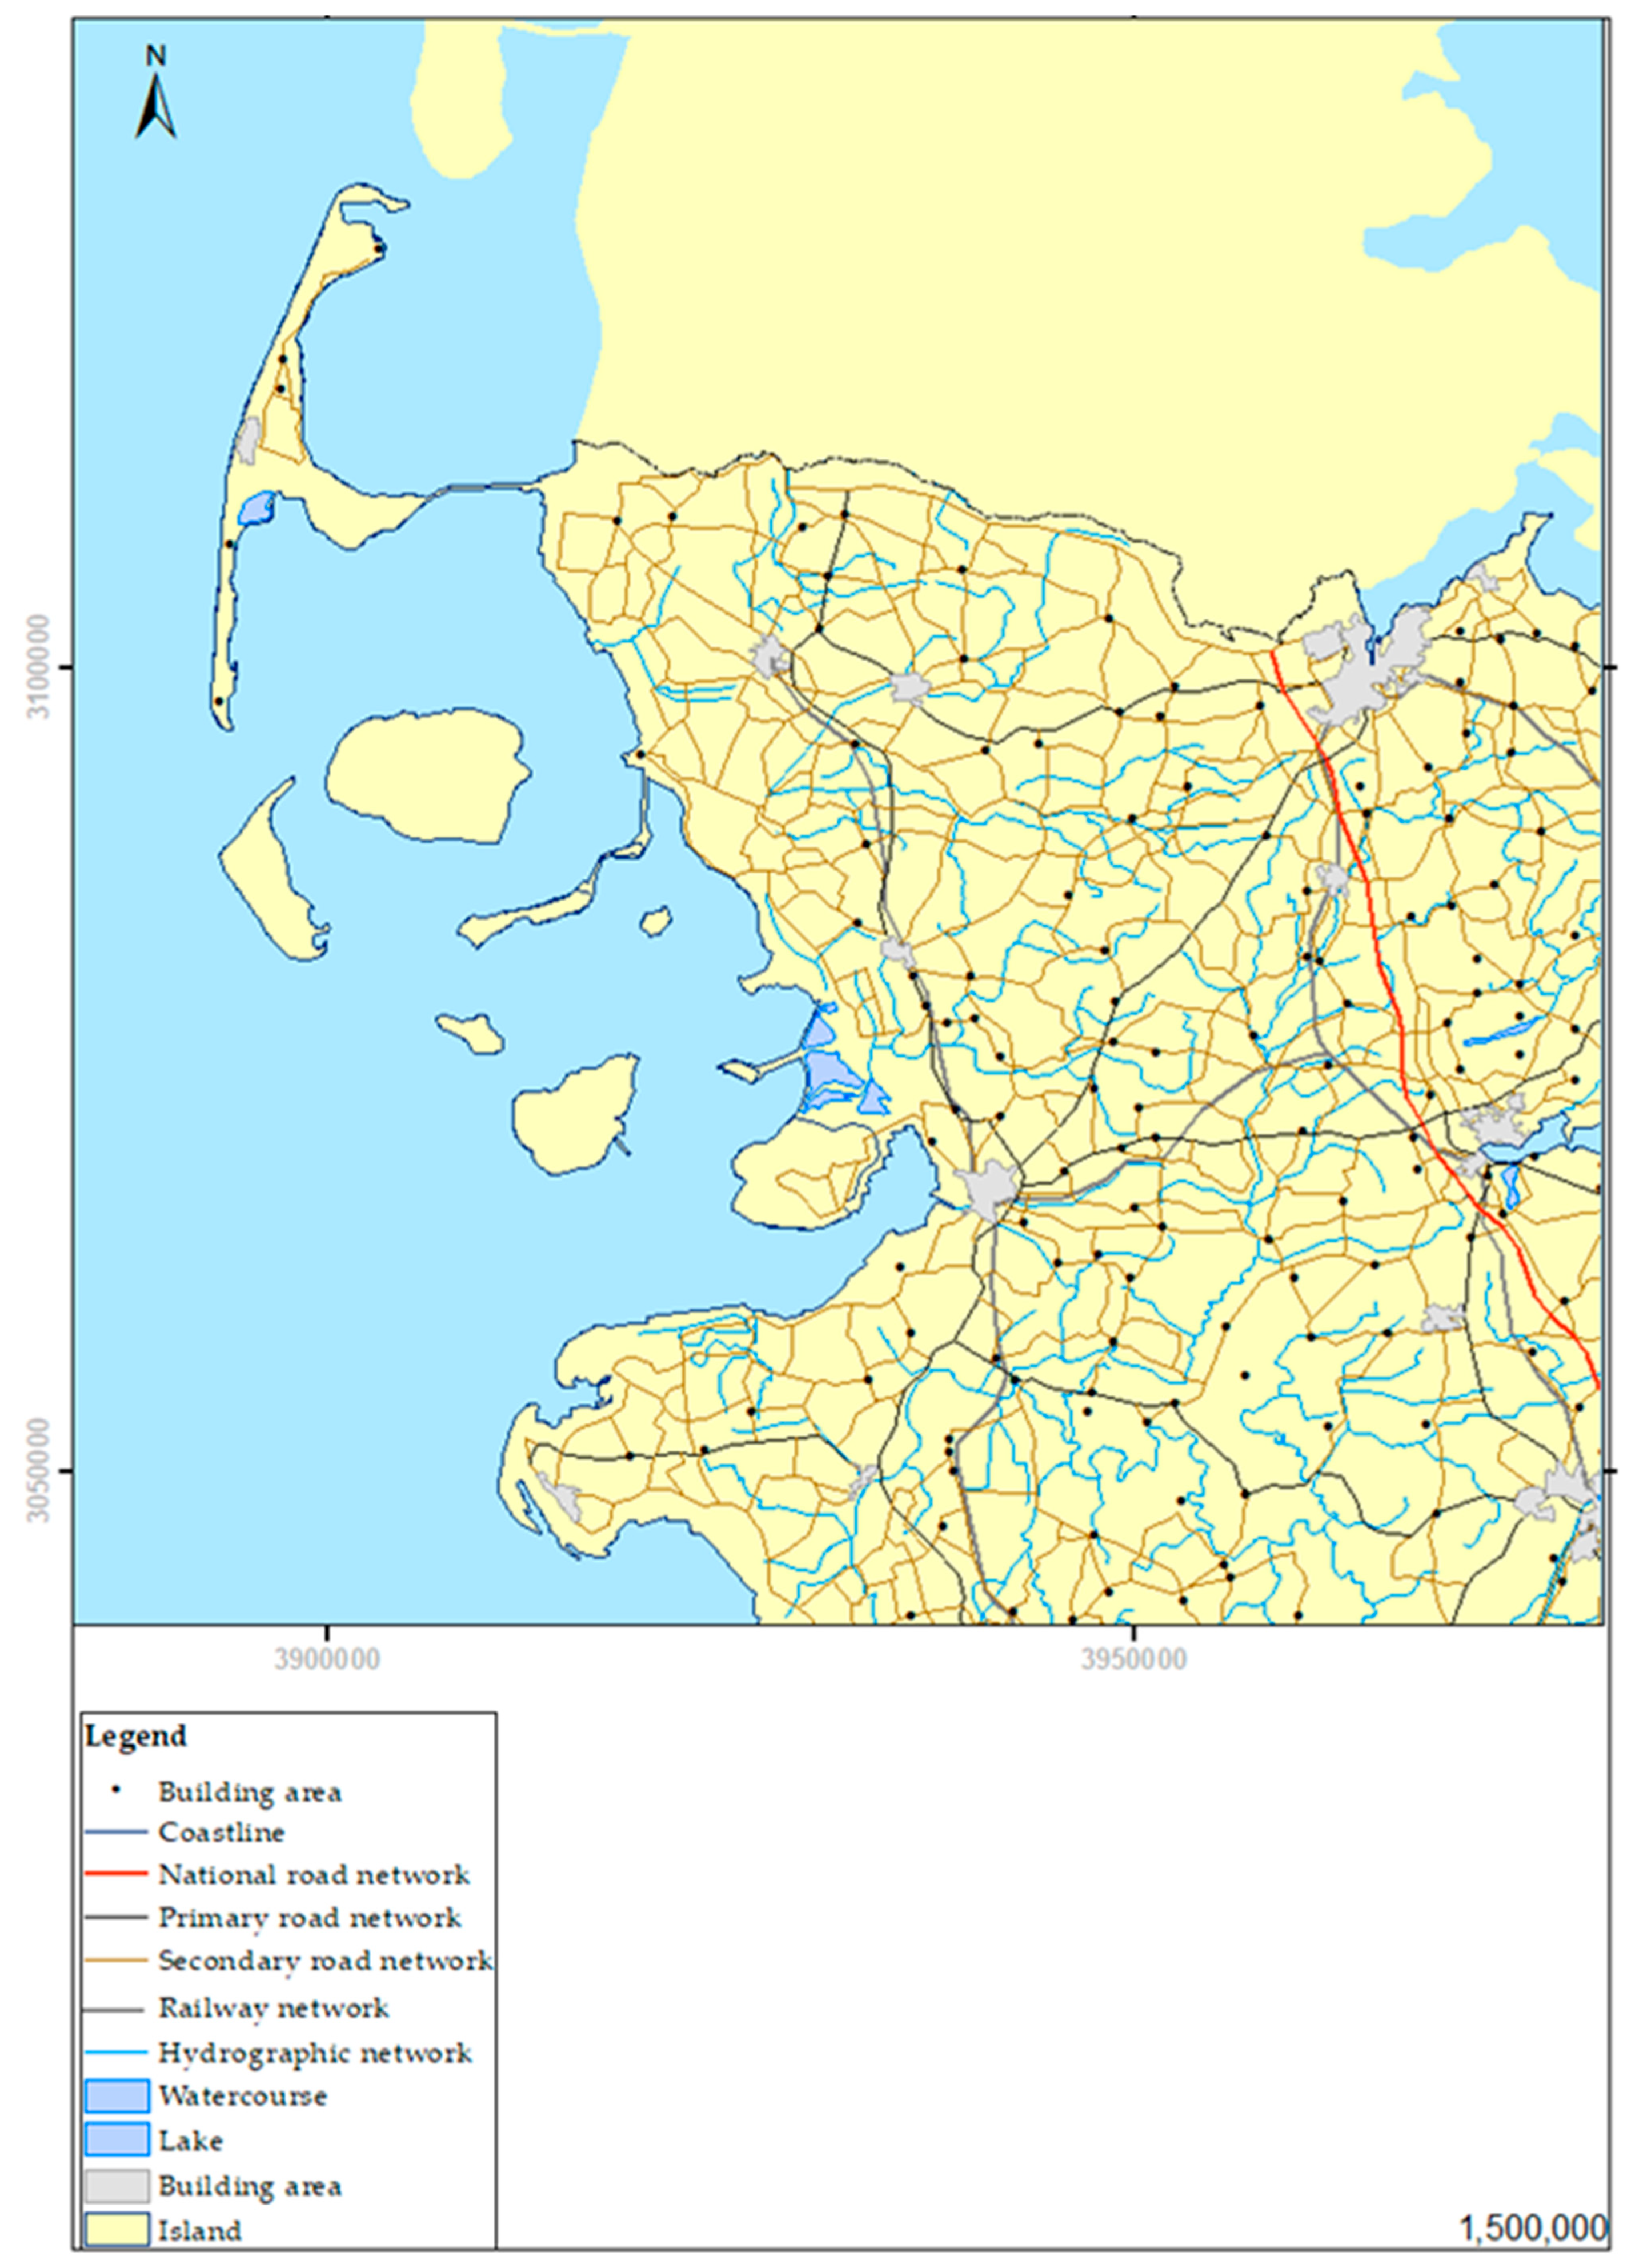
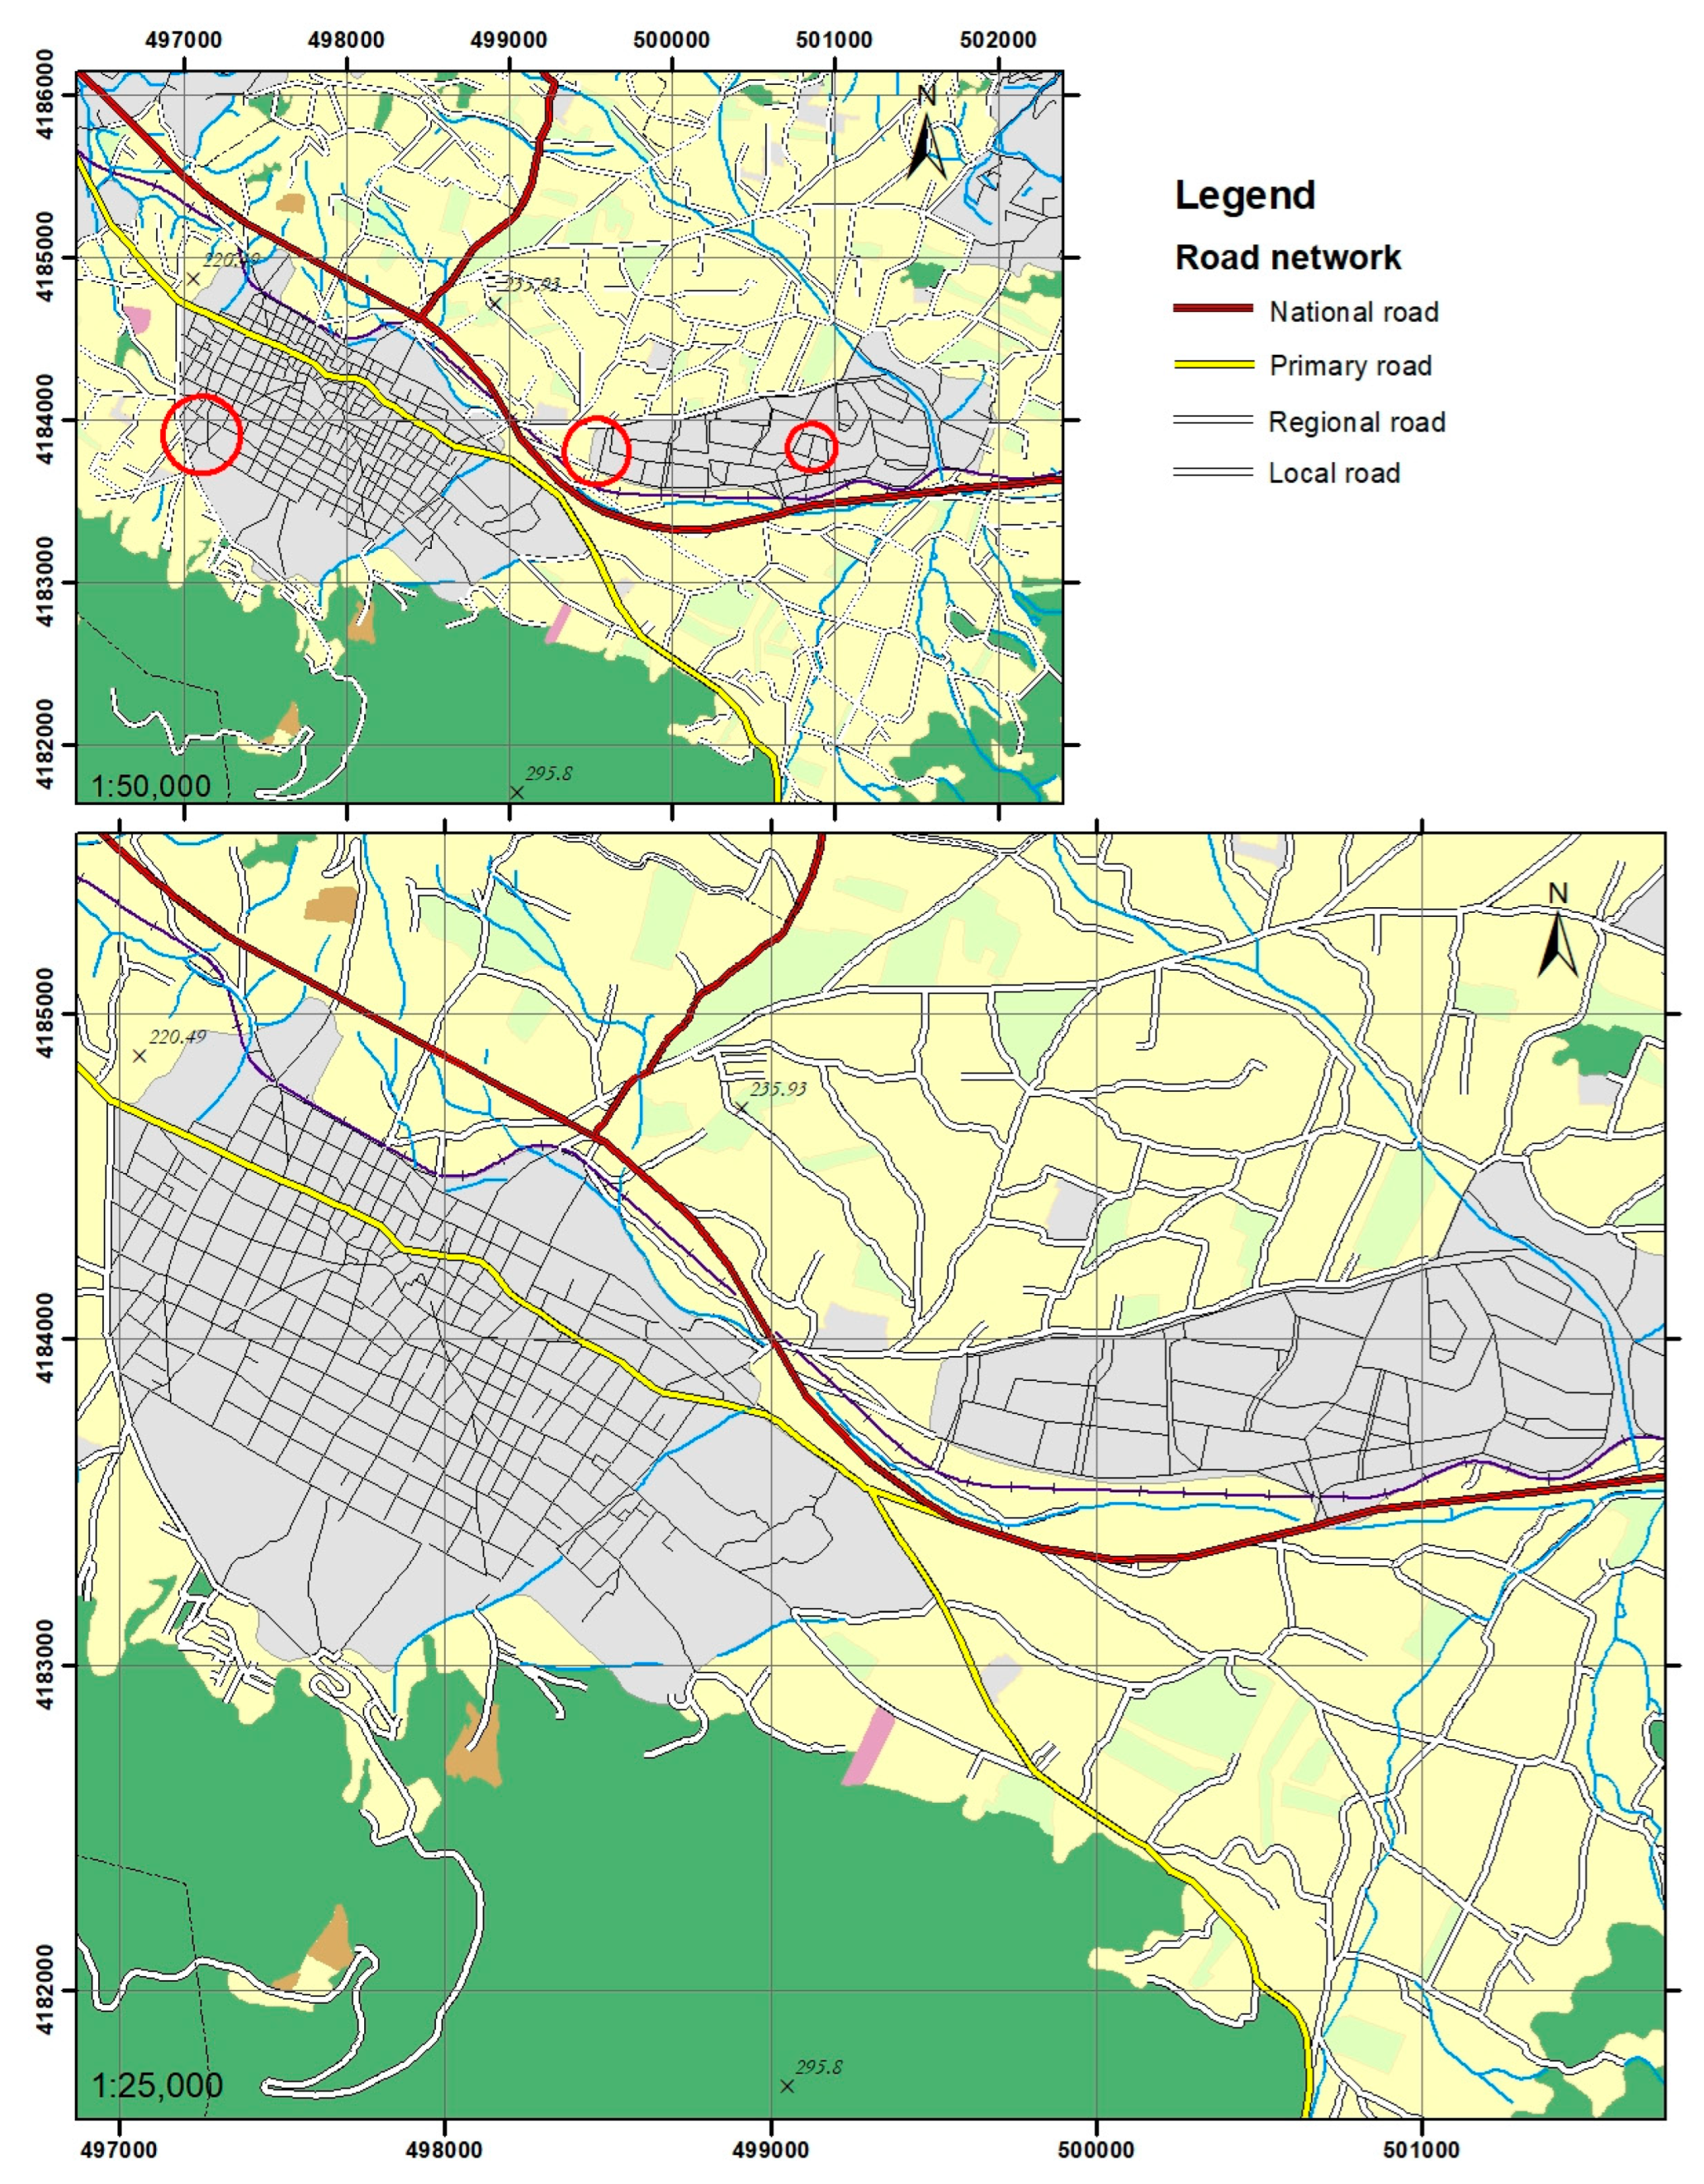
2.4. Road Network Generalization Example

Specifications: Horizontal accuracy is set to 500 m at scale 1:500,000 and 1000 m at scale 1:1,000,000. The minimum separation distance is set to 125 m at scale 1:500,000 and 250 m at scale 1:1,000,000.

2.4.1. Semantic Generalization of the Road Network (scale 1:500,000)

Constraints: Compatibility between the initial and the new schema must exist regarding features geometric types, attributes fields types, attributes domains, and projections to ensure the successful features transfer from the initial to the final geodatabase. Legibility must also be retained. The constraints’ conformance levels are set to acceptable or unacceptable.
Quality requirements: Domain consistency attribute values’ correctness, and legibility preservation (minimum separation distance) must be retained. The quality requirements conformance levels are set to acceptable or unacceptable.
The process:
  • Geodatabases compatibility controls (initial vs. final). Geometric types, attributes’ field types, and their domains and projections are compatible. All features are transferred from the geodatabase at scale 1:250,000 to the geodatabase at scale 1:500,000.
  • Three out of the four categories of the road network are retained. The “national”, “primary” and “secondary” roads are retained. The “local” roads are eliminated.
  • Junction cases (i), (ii), and (iii) described in Section 2.2 are simplified to achieve the network’s density reduction. The minimum separation distance is set to 125 m and the threshold of the polygon area considered as a junction (case iii) is set to 1 km2.
  • The road hierarchy (national, primary, and secondary roads is retained in case there is a need for feature elimination.
  • Elimination of lines with a dangling node that does not fall in the buffer zone of 500 m (map specification) of a built-up area.
  • “Orphan” lines elimination.
  • Quality controls are carried out on the feature class level regarding attribute fields with “null”/ “none” values and attributes fields values compatibility to their domains. No extra quality control regarding the network’s density is required.
  • Quality controls are carried out between feature classes with respect to conceptual consistency (overlays) and legibility (features belonging to different classes) when the semantic generalization process is completed for each feature class. The road network’s conceptual consistency is checked against features of aggregated lakes (roads are not allowed to pass through lakes unless their initial condition implies that). The road network’s feature separation is checked against the railway and hydrographic network. In the case of conflicts, only the conflicts where elimination is applied are resolved. Displacement as a solution to resolve visual conflicts is implemented in cartographic generalization.
  • Results are shown in Section 3.

2.4.2. Cartographic Generalization of the Road Network (scale 1:500,000)

Constraints: Shape preservation and horizontal accuracy. The horizontal accuracy threshold is set to 125 m based on the minimum separation distance to avoid visual conflicts.
Quality requirements: Features legibility, relative position consistency, topological consistency (overshoots, undershoots), and conceptual consistency (overlays). The quality requirements conformance levels are set to acceptable or not acceptable.
The process:
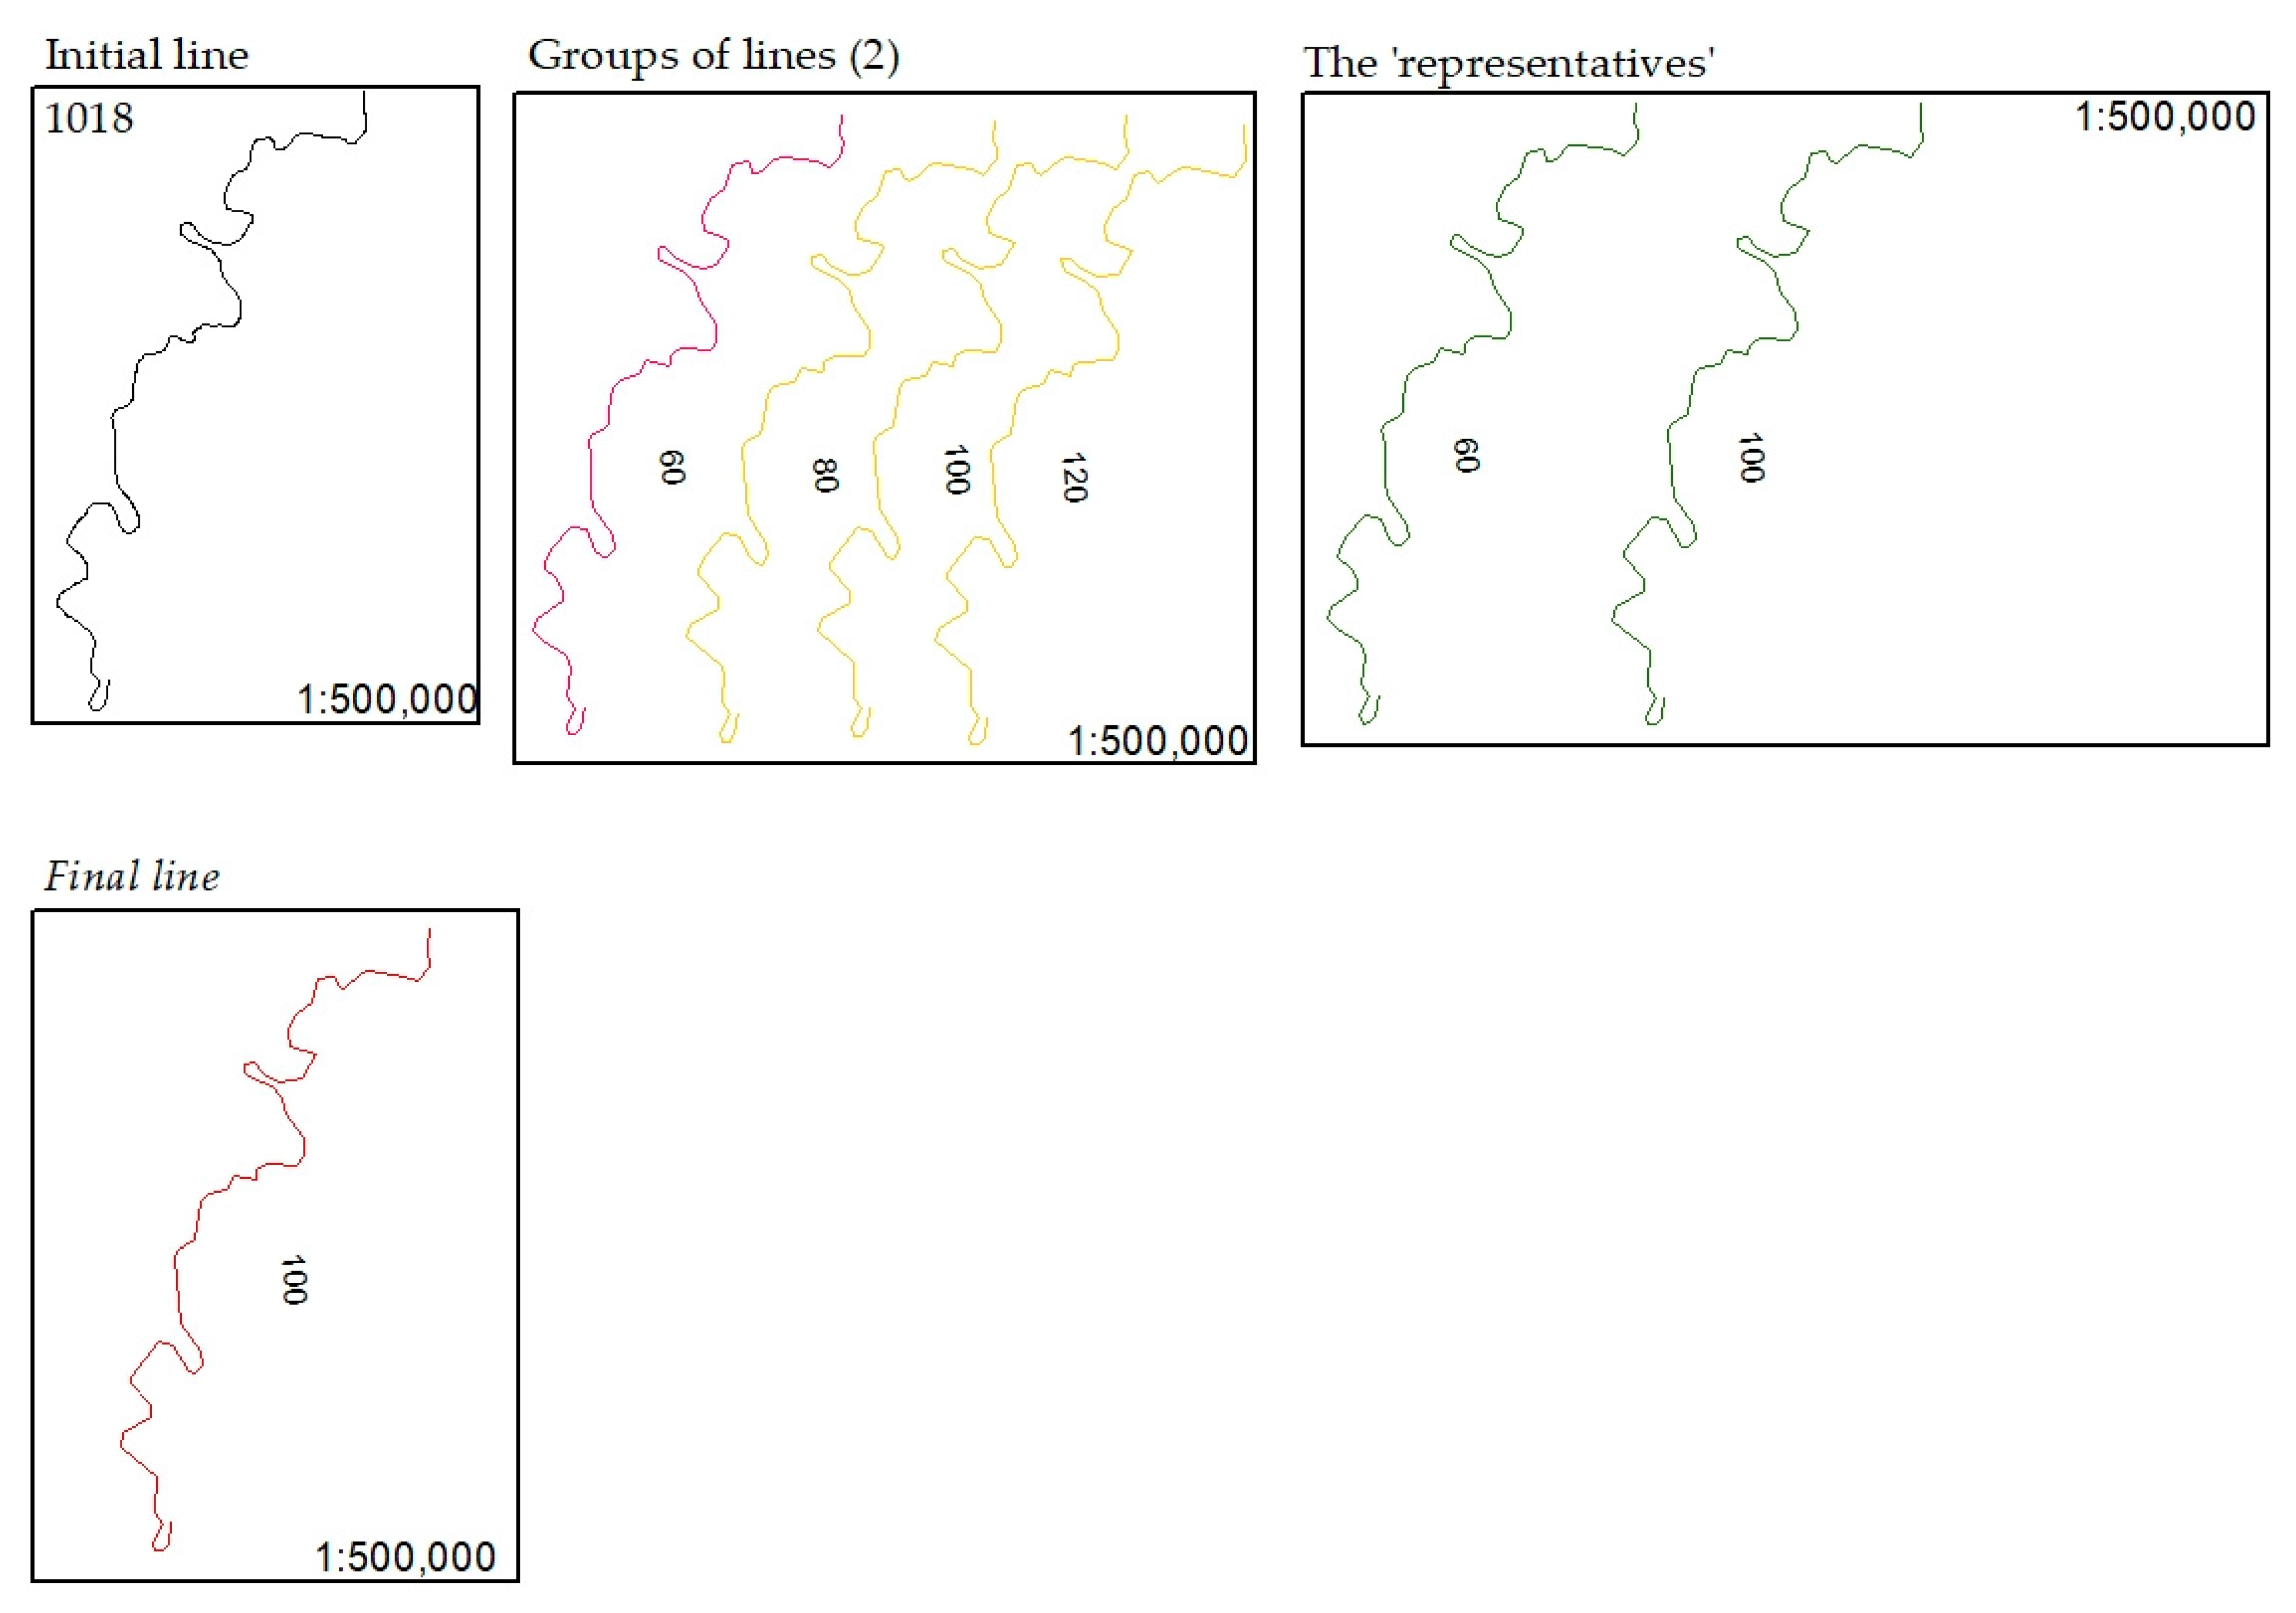
  • Point remove simplification algorithm [38] is applied. Tolerance is set in the range 20 m to 1000 m with 20 m intervals resulting in 50 generalized lines corresponding to each line of the initial road network;
  • Legibility between features geometric elements (‘bottleneck phenomenon’ and very sharp corners), horizontal accuracy, and features topological consistency (self-intersections, self-overlaps) is checked for each generalized line. A group of generalized features complying with conformance levels is created, which corresponds to each initial line of the road network. Each feature of the group is bound to a tolerance value;
  • Modified Hausdorff distance between the initial and the generalized line and the difference between the turning function weighted lengths of the initial and the generalized line are computed for each line in each group formed in the previous step (ii). These two parameters describe the shape of each line in each group;
  • Hierarchical clustering is carried out on each group. Shape parameters computed in the previous step (iii) are used in clustering. The process is applied for the different number of clusters and different linkage criteria (Ward’s, average, complete, single). The best number of clusters of each group is chosen, the one which: a) retains the highest mean silhouette correlation coefficient, and b) clusters with members that present a positive value for the silhouette correlation coefficient. For each cluster of each group, the member with the highest silhouette correlation coefficient is selected as the “representative” one. Among the representative members, the one corresponding to the maximum tolerance value is selected as suitable for display on the map;
  • Quality control at the feature class level is not necessary. Topological inconsistencies (overshoots, undershoots) are not expected as the applied point remove algorithm retains the endpoints of the lines. Quality control is carried out between feature classes. Legibility errors, such as features separation, are expected in cases where features displacement is required. Results are shown in Section 3.

3. Results and Conclusions

Section 2.2 and Section 2.3 elaborate on the design of the proposed constraint-based model along with its implementation on (a) the EuroRegional Map geodatabase at scale 1:250,000 for the creation of two maps at scales 1:500,000 and 1:1,000,000, and (b) on a geodatabase at scale 25,000 with cadastral data for the creation of a map at scale 1:50,000 (the generalization model was applied only on the road network). In Figure 4 and Figure 5, maps at scales 1:500,000 and 1:1,000,000 are shown. In addition, in Figure 6, the road network at scale 1:50,000 is displayed in comparison to its initial form at scale 1:25,000.
Semantic generalization results concerning spatial information reduction are presented in Table 4, and quality controls at the end of the process are as follows:
  • Twelve (12) legibility conflicts were identified concerning roads and rivers (4364 lines were examined), fourteen (14) legibility conflicts were identified concerning roads and railways (3792 lines were examined) at scale 1:500,000;
  • Twenty-seven (27) legibility conflicts were identified concerning roads and rivers (3974 lines were examined), twenty (20) legibility conflicts were identified concerning roads and railways (3699 lines were examined) at scale 1:1000,000.
Cartographic generalization results regarding quality controls at the end of the process are presented below:
  • Four (4) legibility conflicts were identified concerning roads and rivers (4364 lines were examined), 2 legibility conflicts were identified concerning road and railway networks (3792 lines were examined) at scale 1:500,000;
  • Twenty-eight (28) legibility conflicts were identified concerning roads and rivers (3974 lines were examined), twenty (20) legibility conflicts were identified concerning road and railway networks (3699 lines were examined), one (1) legibility conflict was identified involving rail and rivers (479 lines were examined) at scale 1:1,000,000.
    Semantic and cartographic generalization quality control on the geodatabase at scale 1:50,000 with cadastral data resulted in no errors (as expected).
Analyzing the quality results, the satisfactory functionality of the proposed constraint-based generalization model is documented. As shown, a small number of errors occur, which allows the visual inspection of each case and the manual handling of errors, where needed.

4. Discussion and Future Work

In this article, a constraint-based generalization model with a quality evaluation mechanism, as introduced originally by the authors in [1,2], is presented together with its implementation to produce topographic maps. The proposed model provides a concise organizational framework and a comprehensive generalization methodology for linear and area features. The proposed techniques are simple with straightforward parameterization compared to more sophisticated generalization systems such as multi-agent systems. The new shape measure and the new parameterization method of the features’ shape introduced are more sensitive in capturing any change of shape caused due to generalization in comparison to the existing measures in the literature. Finally, quantitative legibility violation thresholds are configured for the selection of the suitable feature’s shape for portrayal. The methodology developed incorporates the fundamental constraints, the quality requirements, the quality measures, and the implementation techniques for the evaluation and assessment of the cartographic data resulting from generalization together with a new method for the selection of the suitable feature for portrayal on the map with respect to the preservation of its shape. As it is derived from the examination of the maps produced (Figure 4, Figure 5 and Figure 6), the implementation of the proposed model results in the composition of high-quality maps at any scale. The novelty of the work presented is based on: a) the analysis and standardization of the semantic generalization process, which is not demonstrated sufficiently in published work; b) the integration of the quality model with the aforementioned new shape evaluation mechanism; c) the location and resolution of legibility violations according to quantitative conformance levels; d) the network’s density reduction techniques for the resolution of geometric conflicts in a simplified way using quantitative legibility violation thresholds; e) the application of the ISO 19157 Standard on quality and the associated map specifications. An additional advantage of the proposed constraint-based generalization model is its applicability in any geographic information system environment.
Future work will be related to the expansion of the proposed model. Methods for the evaluation of the information density and legibility regarding symbolization could be integrated. In addition, optimization techniques that will trigger automated displacement of the features for the resolution of geometric conflicts could also be incorporated.

Author Contributions

Conceptualization, N.B., I.K. and L.T.; methodology, N.B., I.K. and L.T.; software, N.B. and I.K.; validation, N.B., I.K. and L.T.; investigation, N.B., I.K.; resources, N.B., I.K. and L.T.; data curation, N.B., I.K.; writing—original draft preparation, N.B., I.K.; writing—review and editing, L.T.; visualization, N.B. and I.K; supervision, L.T. All authors have read and agreed to the published version of the manuscript.

Funding

This research received no external funding.

Data Availability Statement

Data made available by the NTUA Cartography Laboratory.

Conflicts of Interest

The authors declare no conflict of interest.

References

  1. Blana, N.; Tsoulos, L. Constraint-Based Spatial Data Management for Cartographic Representation at Different Scales. Geographies 2022, 2, 258–273. [Google Scholar] [CrossRef]
  2. Blana, N.; Tsoulos, L. Generalization of Linear and Area Features Incorporating a Shape Measure. ISPRS Int. J. Geo-Inf. 2022, 11, 489. [Google Scholar] [CrossRef]
  3. Grünreich, D. Computer-Assisted Generalization; Papers CERCO Cartography Course; Institut für Angewandte Geodäsie: Frankfurt, Germany, 1985. [Google Scholar]
  4. Duchêne, C.; Touya, G.; Taillandier, P.; Gaffuri, J.; Ruas, A.; Renard, J. Multi-Agents Systems for Cartographic Generalization: Feedback from Past and On-Going Research; Research Report; IGN (Institut National de l’Information Géographique et Forestière); LaSTIG, équipe COGIT: Saint Mandé, France, 2018; Available online: https://hal.archives-ouvertes.fr/hal-01682131/document (accessed on 28 February 2022).
  5. Harrie, L.; Weibel, R. Modelling the overall process of generalisation. In Generalisation of Geographic Information: Cartographic Modelling and Applications; Mackaness, W., Ruas, A., Sarjakoski, T., Eds.; Series of International Cartographic Association; Elsevier Science: Amsterdam, The Netherlands, 2007; pp. 67–88. [Google Scholar]
  6. Beard, K. Constraints on rule formation. In Map Generalisation: Making Rules for Knowledge Representation; Buttenfield, B.P., McMaster, R.B., Eds.; Longman Group: Harlow, UK, 1991; pp. 121–135. [Google Scholar]
  7. Sarjakoski, L.T. Conceptual models of generalization and multiple representation. In Generalisation of Geographic Information: Cartographic Modelling and Applications; Mackaness, W., Ruas, A., Sarjakoski, T., Eds.; Series of International Cartographic Association; Elsevier Science: Amsterdam, The Netherlands, 2007; pp. 11–37. [Google Scholar]
  8. McMaster, R.B.; Shea, K.S. Generalization in Digital Cartography; Association of American Geographers: Washington, DC, USA, 1992. [Google Scholar]
  9. Weibel, R. Three essential building blocks for automated generalization. In GIS and Generalization: Methodology and Practice; Mueller, J., Lagrange, J.P., Weibel, R., Eds.; Taylor & Francis: London, UK, 1995; pp. 56–70. [Google Scholar]
  10. Ehrliholzer, R. Quality assessment in generalization: Integrating quantitative and qualitative methods. In Proceedings of the 17th International Cartographic Conference, Barcelona, Spain, 3–9 September 1995. [Google Scholar]
  11. João, E.M. Causes and Consequences of Map Generalization; Taylor and Francis: London, UK, 1998. [Google Scholar]
  12. Brazile, F. Semantic Infrastructure and Methods to Support Quality Evaluation in Cartographic Generalisation. Ph.D. Thesis, Department of Geography, University of Zurich, Zurich, Switzerland, 2000. [Google Scholar]
  13. Bard, S. Quality Assessment of Cartographic Generalisation. Trans. GIS 2004, 8, 63–81. [Google Scholar] [CrossRef]
  14. Bard, S.; Ruas, A. Why and How Evaluating Generalised Data? In Developments in Spatial Data Handling, Proceedings of the 11th International Symposium on Spatial Data Handling; Springer: Berlin/Heidelberg, Germany, 2004; pp. 327–342. [Google Scholar]
  15. Burghardt, D.; Schmid, S.; Duchêne, C.; Stoter, J.; Baella, B.; Regnauld, N.; Touya, G. Methodologies for the evaluation of generalised data derived with commercially available generalisation systems. In Proceedings of the 11th ICA Workshop of the ICA Commission on Generalisation and Multiple Representation, Montpellier, France, 20–21 June 2008. [Google Scholar]
  16. Stoter, J.; Baella, B.; Blok, C.; Burghardt, D.; Duchêne, C.; Pla, M.; Regnauld, N.; Guillaume, T. State-of-the-Art of Automated Generalization in Commercial Software; EuroSDR Publication: Frankfurt, Germany, 2010. [Google Scholar]
  17. Mackaness, W.; Ruas, A. Evaluation in the map generalisation process. In Generalisation of Geographic Information: Cartographic Modelling and Applications; Mackaness, W., Ruas, A., Sarjakoski, T., Eds.; Series of International Cartographic Association; Elsevier Science: Amsterdam, The Netherlands, 2007; pp. 89–111. [Google Scholar]
  18. Stoter, J.; Zhang, X.; Hanna, S.; Harrie, L. Evaluation in Generalisation. In Abstracting Geographic Information in a Data Rich World. Methodologies and Applications of Map Generalisation Lecture Notes in Geoinformation and Cartography; Burghardt, D., Duchêne, C., Mackaness, W., Eds.; Springer: Cham, Switzerland, 2014; pp. 259–297. [Google Scholar]
  19. Stoter, J.; Post, M.; Van Altena, V.; Nijhuis, R.; Bruns, B. Fully automated generalization of a 1:50k map from 1:10k data. Cartogr. Geogr. Inf. Sci. 2014, 41, 1–13. [Google Scholar] [CrossRef]
  20. Regnauld, N.; Touya, G.; Gould, N.; Foerster, T. Process Modelling, Web Services and Geoprocessing. In Abstracting Geographic Information in a Data Rich World. Methodologies and Applications of Map Generalisation Lecture Notes in Geoinformation and Cartography; Burghardt, D., Duchêne, C., Mackaness, W., Eds.; Springer: Cham, Switzerland, 2014; pp. 197–225. [Google Scholar]
  21. Duchêne, C.; Baella, B.; Brewer, C.; Burghardt, D.; Buttenfield, B.; Gaffuri, J.; Käuferle, D.; Lecordix, F.; Maugeais, E.; Nijhuis, R.; et al. Generalisation in Practice Within National Mapping Agencies. In Abstracting Geographic Information in a Data Rich World. Methodologies and Applications of Map Generalisation Lecture Notes in Geoinformation and Cartography; Burghardt, D., Duchêne, C., Mackaness, W., Eds.; Springer: Cham, Switzerland, 2014; pp. 329–391. [Google Scholar]
  22. Touya, G.; Zhang, X.; Lokhat, I. Is deep learning the new agent for map generalization? Int. J. Cartogr. 2019, 5, 142–157. [Google Scholar] [CrossRef]
  23. Kronenfeld, B.J.; Buttenfield, B.P.; Stanislawski, L.V. Map Generalization for the Future: Editorial Comments on the Special Issue. ISPRS Int. J. Geo-Inf. 2020, 9, 468. [Google Scholar] [CrossRef]
  24. Sester, M. Cartographic generalization. J. Spat. Inf. Sci. 2020, 21, 5–11. [Google Scholar] [CrossRef]
  25. Burghardt, D.; Schmid, S.; Stoter, J. Investigations on cartographic constraint formalisation. In Proceedings of the Workshop of the ICA Commission on Generalization and Multiple Representation at the 23nd International Cartographic Conference ICC, Moscow, Russia, 4–10 August 2007. [Google Scholar]
  26. Jakobsson, A.; Holmes, J. (Eds.) Update Guideline for Implementing the ISO 19100 Geographic Information Quality Standards in National Mapping and Cadastral Agencies; EuroGeographics Quality Knowledge Exchange Network (Q-KEN): Brussels, Belgium, 2018. [Google Scholar]
  27. Rocha, L.A.; Montoya, J. Spatial Data Quality Model for “Fit-For-Purpose” Methodology in Colombia; FIG Working Week 2020: Amsterdam, The Netherlands, 2020. [Google Scholar]
  28. Eurogeographics Quality-Knowledge Experts Network (Q-KEN). Creating a Data Quality Model. In Proceedings of the 3rd International Workshop on Spatial Data Quality, Valetta, Malta, 28–29 January 2020; Eurogeographics Q-KEN: Brussels, Belgium, 2020. [Google Scholar]
  29. Kavadas, I. ISO Standards in the Development of a Spatial Information Quality Model. Postgraduate Thesis, Geoinformatics Postgraduate Programme, School of Rural and Surveying Engineering, National Technical University of Athens, Athens, Greece, 2007. (In Greek). [Google Scholar]
  30. Kavadas, I. Assessment of Spatial Information Quality using the ISO International Standards. In Proceedings of the 11th National Cartography Conference, Nafplio, Greece, 8–10 November 2010; Hellenic Cartographic Society: Thessaloniki, Greece, 2010; pp. 467–483. (In Greek). [Google Scholar]
  31. ISO 19157; Geographic Information—Data Quality. International Organization for Standardization: Geneva, Switzerland, 2013.
  32. ISO 2859-1; Sampling Procedures for Inspection by Attributes—Part 1: Sampling Schemes Indexed by Acceptance Quality Limit (AQL) for Lot-By-Lot Inspection. International Organization for Standardization: Geneva, Switzerland, 2006.
  33. ISO 3951-1; Sampling Procedures for Inspection by Variables—Part 1: Specification for Single Sampling Plans Indexed by Acceptance Quality Limit (AQL) for Lot-By-Lot Inspection for a Single Quality Characteristic and a Single AQL. International Organization for Standardization: Geneva, Switzerland, 2013.
  34. No FGDC-STD-007.3-1998; Geospatial Positioning Accuracy Standards—Part 3: National Standard for Spatial Data Accuracy. FGDC: Washington, DC, USA, 1998.
  35. No FGDC-STD-002-1999; Spatial Data Transfer Standard (SDTS). FGDC: Washington, DC, USA, 1999.
  36. Regnauld, N.; McMaster, R.B. A synoptic View of Generalisation Operators. In Generalisation of Geographic Information: Cartographic Modelling and Applications; Mackaness, W., Ruas, A., Sarjakoski, T., Eds.; Series of International Cartographic Association; Elsevier Science: Amsterdam, The Netherlands, 2007; pp. 37–66. [Google Scholar]
  37. Veltkamp, R. Shape matching: Similarity measures and algorithms. In Proceedings of the International Conference on Shape Modeling and Applications, Genova, Italy, 7–11 May 2001; pp. 188–197. [Google Scholar]
  38. Douglas, D.; Peucker, T. Algorithms for the Reduction of the Number of Points Required to Represent a Digitized Line or its Caricature. Can. Cartogr. 1973, 10, 112–122. [Google Scholar] [CrossRef]
  39. Wang, Z.; Muller, J.C. Line generalization based on analysis of shape characteristics. Cartogr. Geogr. Inf. Sci. 1998, 25, 3–15. [Google Scholar] [CrossRef]
  40. Dubuisson, M.P.; Jain, A. A Modified Hausdorff distance for object matching. In Proceedings of the 12th International Conference on Pattern Recognition, Jerusalem, Israel, 9–13 October 1994; Volume 1, pp. 566–568. [Google Scholar]
  41. Goodchild, M.; Hunter, G. A Simple Positional Accuracy Measure for Linear Features. Int. J. Geogr. Inf. Sci. 1997, 11, 299–306. [Google Scholar] [CrossRef]
Figure 1. Workflow for the creation of the spatial database based on its conceptual and logical design.
Geographies 03 00017 g001
Figure 2. (a) refinement-junction of two lines, (b) refinement-junction of three lines, (c) refinement-two non-connected lines distinction. Reducing network density through lines elimination (red cycle).
Geographies 03 00017 g002
Figure 3. Test case for the selection of the suitable generalized line for portrayal according to the proposed proceedure.
Geographies 03 00017 g003
Figure 4. Topographic map at scale 1:500,000.
Geographies 03 00017 g004
Figure 5. Topographic map at scale 1:1,000,000.
Geographies 03 00017 g005
Figure 6. Road network map at scales 1:25,000 (initial geodatabase) and 1:50,000. Red circles displayed on the map at scale 1:50,000, indicate the impact of semantic generalization.
Geographies 03 00017 g006
Table 1. Interpretation of quality in different phases of production [26].
Phase of productionQuality DocumentationGoal for QualityQuality MethodsLevel
Before productionSpecifications
Quality model
Define quality requirementsAnalysis of customer
requirements
Entity/Feature type level
ProductionDatabase
Process history
Meet the specifications
Record expected quality to database
InspectionEntity/Feature instance
After productionMetadata
Test reports
Measure conformance to quality requirementsEvaluation
Reporting
Dataset level
Table 2. Quality model (part). It includes the set of quality elements proposed by the ISO 19157 Standard. The colored cells describe the combination of quality element and quality measure that is selected at the entity or entity attribute level of the data element. Each cell indicates the type of quality measure chosen with reference to the identification number compliant with ISO 19157 Annex D.
Geospatial Database—Quality Model—ISO
Entity Type &
Attribute
Quality Elements
CompletenessLogical ConsistencyPositional Accuracy
CommissionOmissionConceptual
Consistency
Domain
Consistency
Format
Consistency
Topological
Consistency
Absolute
Accuracy
Relative
Accuracy
Gridded Data
Accuracy
AdministrativeUnitError count
id 2
Error count id 6Correctness indicator
id 9
Error indicator
id 119
Error count
id 2
Error count id 6
inspireId Error indicator
id 14
country Error indicator
id 14
geometryError count
id 4
Error count
id 11
Error count
id 23, id 24
id 25, id 26
id 27
id 28
name
nationalCode Error indicator
id 14
HCCode Error indicator
id 14
nationalLevel Error indicator
id 14
nationalLevelName Error indicator
id 14
surfaceArea
beginLifespanVersion
endLifespanVersion
Entity Type &
Attribute
Geospatial Database—Quality Model ISO
Quality Elements
Temporal AccuracyThematic Accuracy
Accuracy
of a Time Measurement
Temporal
Consistency
Temporal
Validity
Classification
Correctness
Non-Quantitative
Attribute
Correctness
Quantitative
Attribute
Accuracy
AdministrativeUnit Error count
id 60
inspireId
country
geometry
name Error count
id 60
Error count
id 65
nationalCode Error count
id 65
HCCode Error count
id 65
nationalLevel Error count
id 65
nationalLevelName Error count
id 65
surfaceArea LE99.8
id 73
beginLifespanVersion Error indicator
id 14
endLifespanVersion
Table 3. Implementation results of the QM of the spatial database (part).
FCIDFeatureType_
Attribute
DQ ELEMENTDQ Sub_ELEMENTName of
Measure
Measure
Identification
DQ_
Quantitative
Result
Result
ValueType
AU01Administrative UnitCompletenessCommissionerror count20Integer
AU02Administrative UnitCompletenessOmissionerror count60Integer
AU03Administrative UnitLogical ConsistencyConceptual Consistencycorrectness indicator9TrueBoolean
AU04Administrative UnitLogical ConsistencyFormat Consistencyerror indicator119TrueBoolean
AU05Administrative UnitThematic AccuracyClassification Correctnesserror count600Integer
AU06inspireIdLogical ConsistencyDomain Consistencyerror indicator14TrueBoolean
AU07countryLogical ConsistencyDomain Consistencyerror indicator14TrueBoolean
AU08geometryCompletenessCommissionerror count40Integer
AU09geometryLogical ConsistencyConceptual Consistencyerror count110Integer
AU10geometryLogical ConsistencyTopological Consistencyerror count230Integer
AU11geometryLogical ConsistencyTopological Consistencyerror count240Integer
AU12geometryLogical ConsistencyTopological Consistencyerror count253Integer
AU13geometryLogical ConsistencyTopological Consistencyerror count260Integer
AU14geometryLogical ConsistencyTopological Consistencyerror count270Integer
AU15geometryPositional AccuracyAbsolute AccuracyMean value of positional uncertainties281.22Meters
AU16nameThematic AccuracyNon-quantitative Attribute Correctnesserror count600Integer
AU17nameThematic AccuracyNon-quantitative Attribute Correctnesserror count650Integer
AU18nationalCodeThematic AccuracyNon-quantitative Attribute Correctnesserror count650Integer
AU19nationalCodeLogical ConsistencyDomain Consistencyerror indicator14TrueBoolean
AU20HCCodeThematic AccuracyNon-quantitative Attribute Correctnesserror count650Integer
AU21HCCodeLogical ConsistencyDomain Consistencyerror indicator14TrueBoolean
AU22nationalLevelThematic AccuracyNon-quantitative Attribute Correctnesserror count650Integer
AU23nationalLevelLogical ConsistencyDomain Consistencyerror indicator14TrueBoolean
AU24nationalLevelNameThematic AccuracyNon-quantitative Attribute Correctnesserror count650Integer
AU25nationalLevelNameLogical ConsistencyDomain Consistencyerror indicator14TrueBoolean
AU26surfaceAreaThematic AccuracyQuantitative Attribute CorrectnessLE99.873TrueBoolean
AU27beginLifespanVersionTemporal AccuracyTemporal Validityerror indicator14TrueBoolean
Table 4. Features reduction per feature class caused due to semantic generalization.
1:250,0001:500,0001:1,000,000
Built area (polygon)21011363
Built area (point)1829552317
Road network14,522 km9014 km8831 km
Railway network1680 km987 km957 km
Lake13294917
Watercourse (polygon)18411
Watercourse (line)5968 km4294 km2551 km
Island85208
Coastline
(None of its parts are deleted)
1356 km1356 km1356 km
Disclaimer/Publisher’s Note: The statements, opinions and data contained in all publications are solely those of the individual author(s) and contributor(s) and not of MDPI and/or the editor(s). MDPI and/or the editor(s) disclaim responsibility for any injury to people or property resulting from any ideas, methods, instructions or products referred to in the content.

