
Risk Analysis of Thyroid Cancer in China: A Spatial Analysis

Abstract
:1. Introduction
2. Materials and Methods
2.1. Data Sources
2.1.1. Data of TC
2.1.2. Geographic Information Data
2.1.3. Socioeconomic Factors Data
2.1.4. Dietary Behavior Factors Data
2.1.5. PM2.5 Concentration
2.2. Statistical Analysis
2.2.1. Descriptive and Geographical Analysis
2.2.2. Spatial Autocorrelation Analysis
2.2.3. Analysis of Influencing Factors of TC
- (a)
- Univariate Correlation Analysis
- (b)
- Generalized Linear Poisson Regression Model (GLM)
- (c)
- Sensitivity analysis
3. Results
3.1. Descriptive Analysis
3.2. Geographical Analysis
3.3. Spatial Autocorrelation Analysis
3.4. Factors Associated with TC
3.4.1. Univariate Correlation Analysis
- (a)
- Prefecture Level—Socioeconomic Factors
- (b)
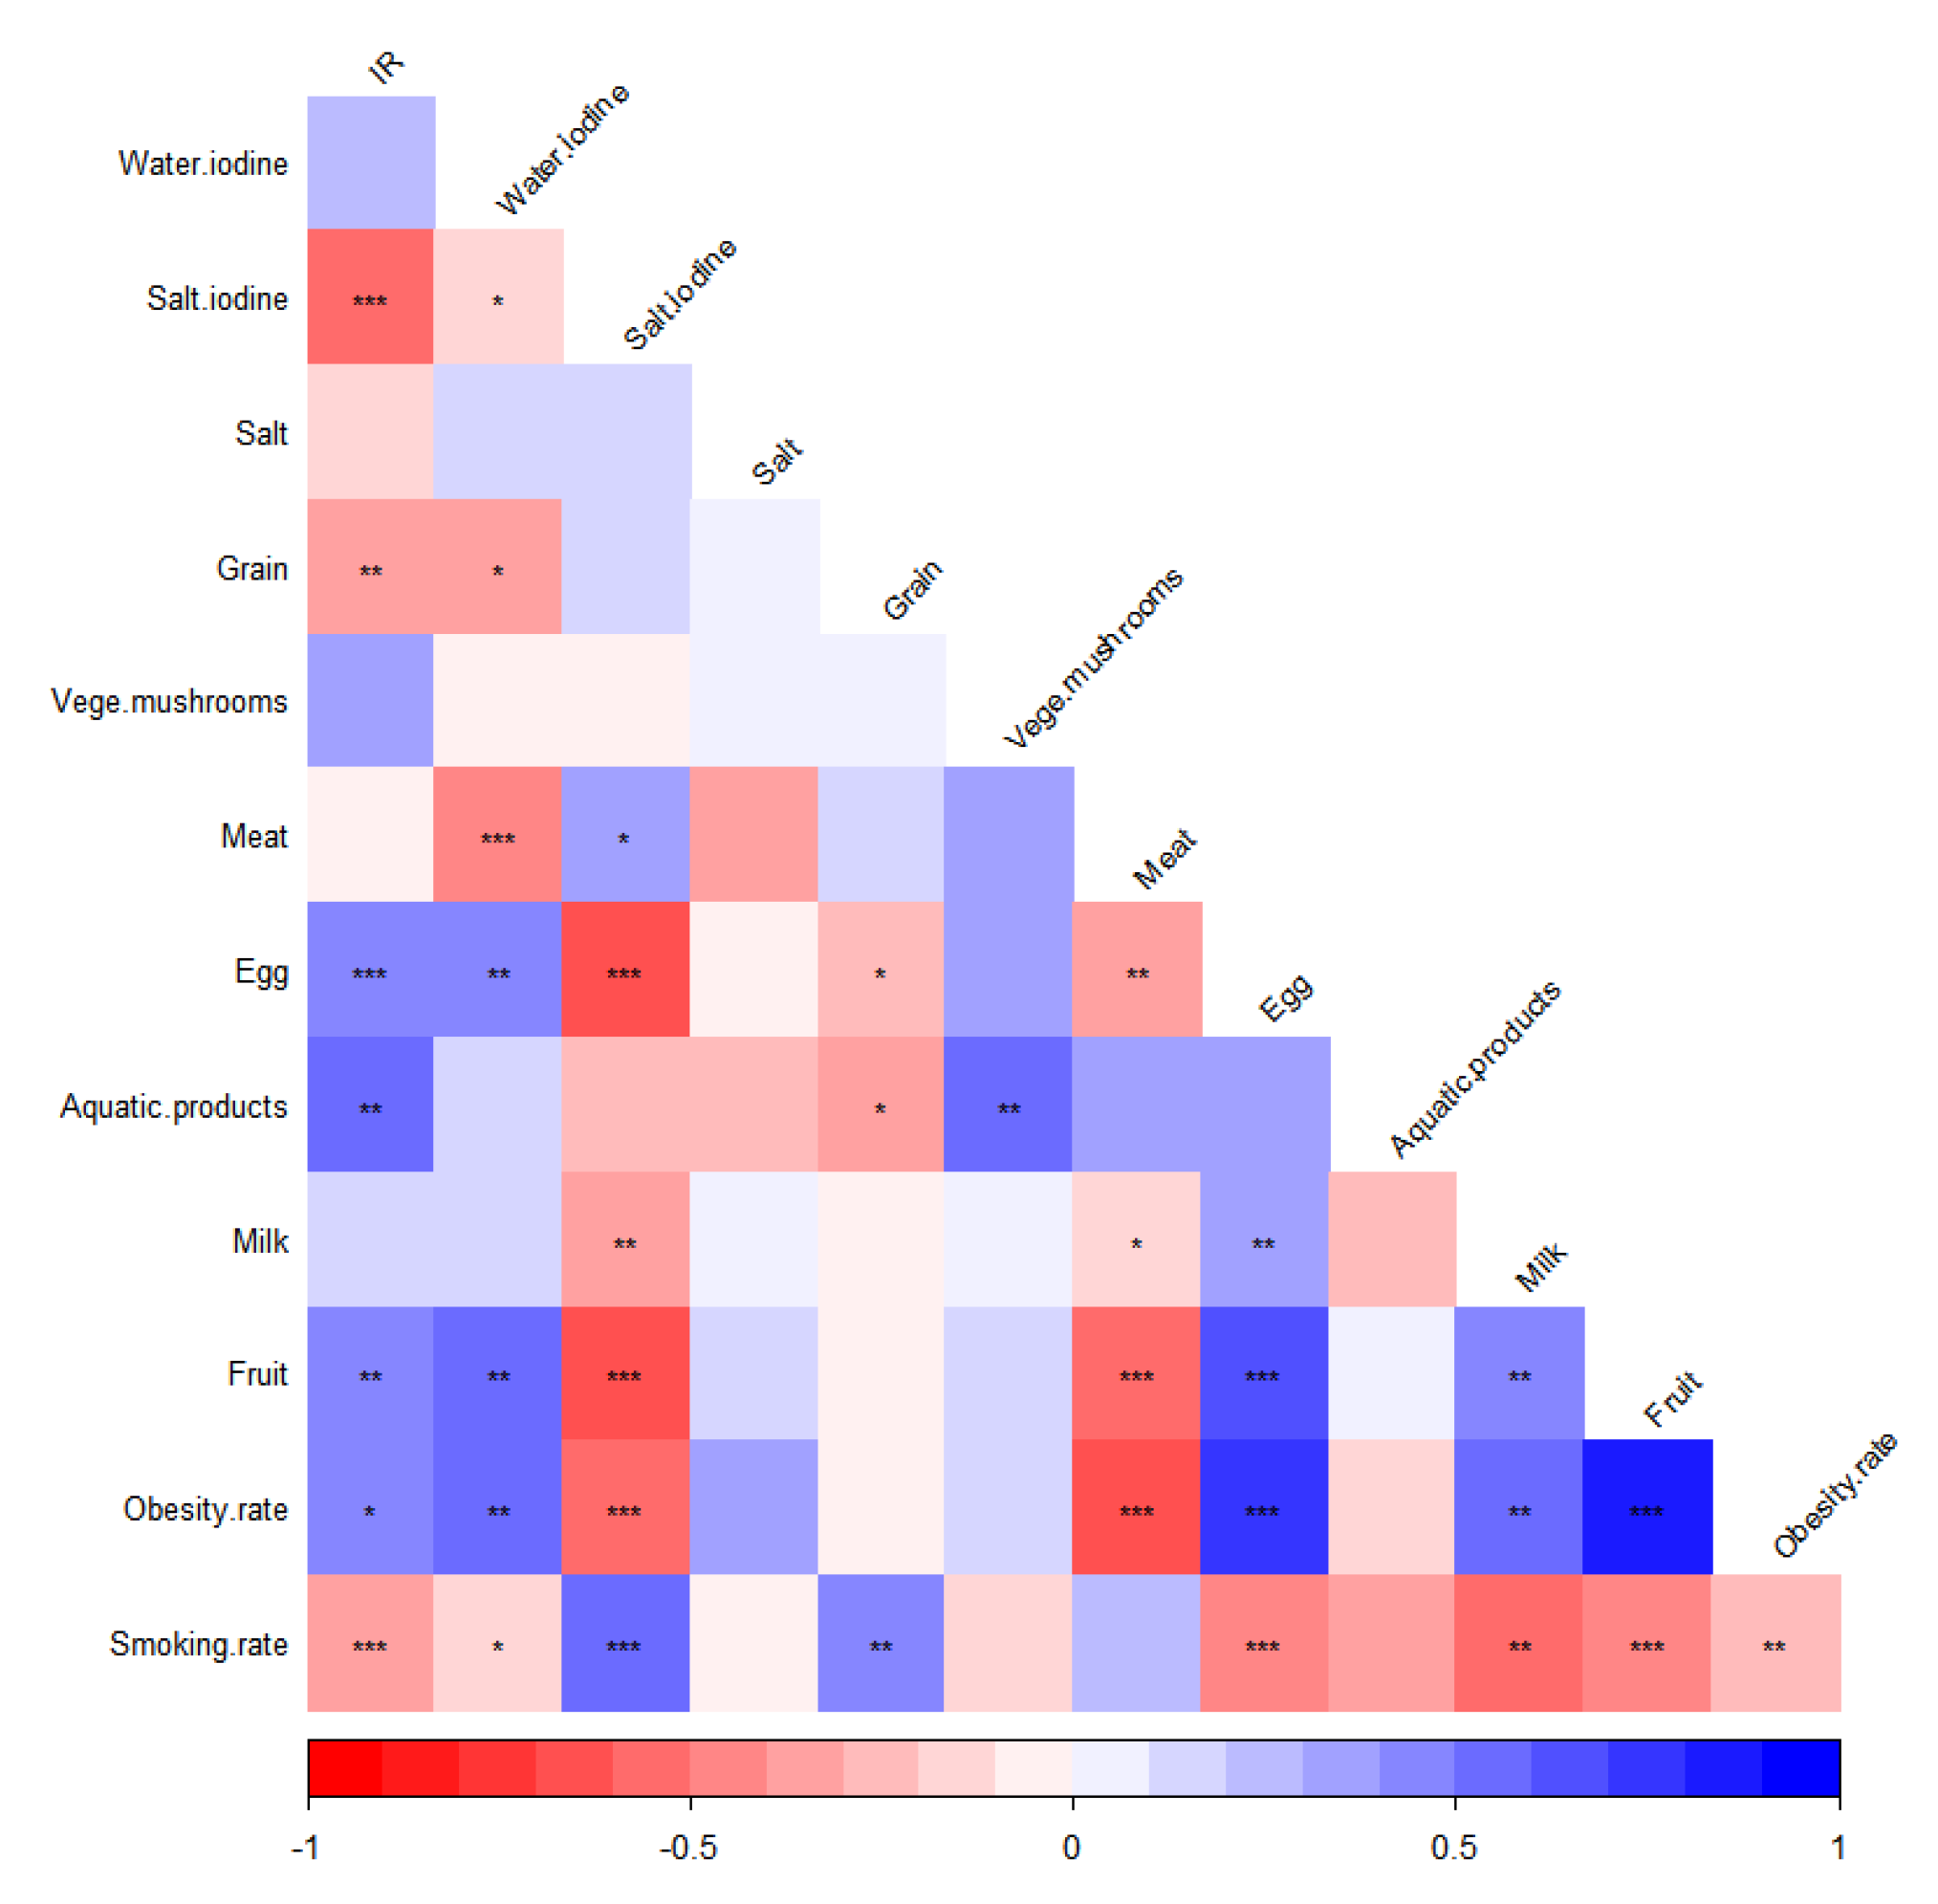
- Provincial Level—Dietary Behavior Factors
3.4.2. Generalized Linear Poisson Regression Model
- (a)
- Prefecture Level—Socioeconomic Factors
- (b)
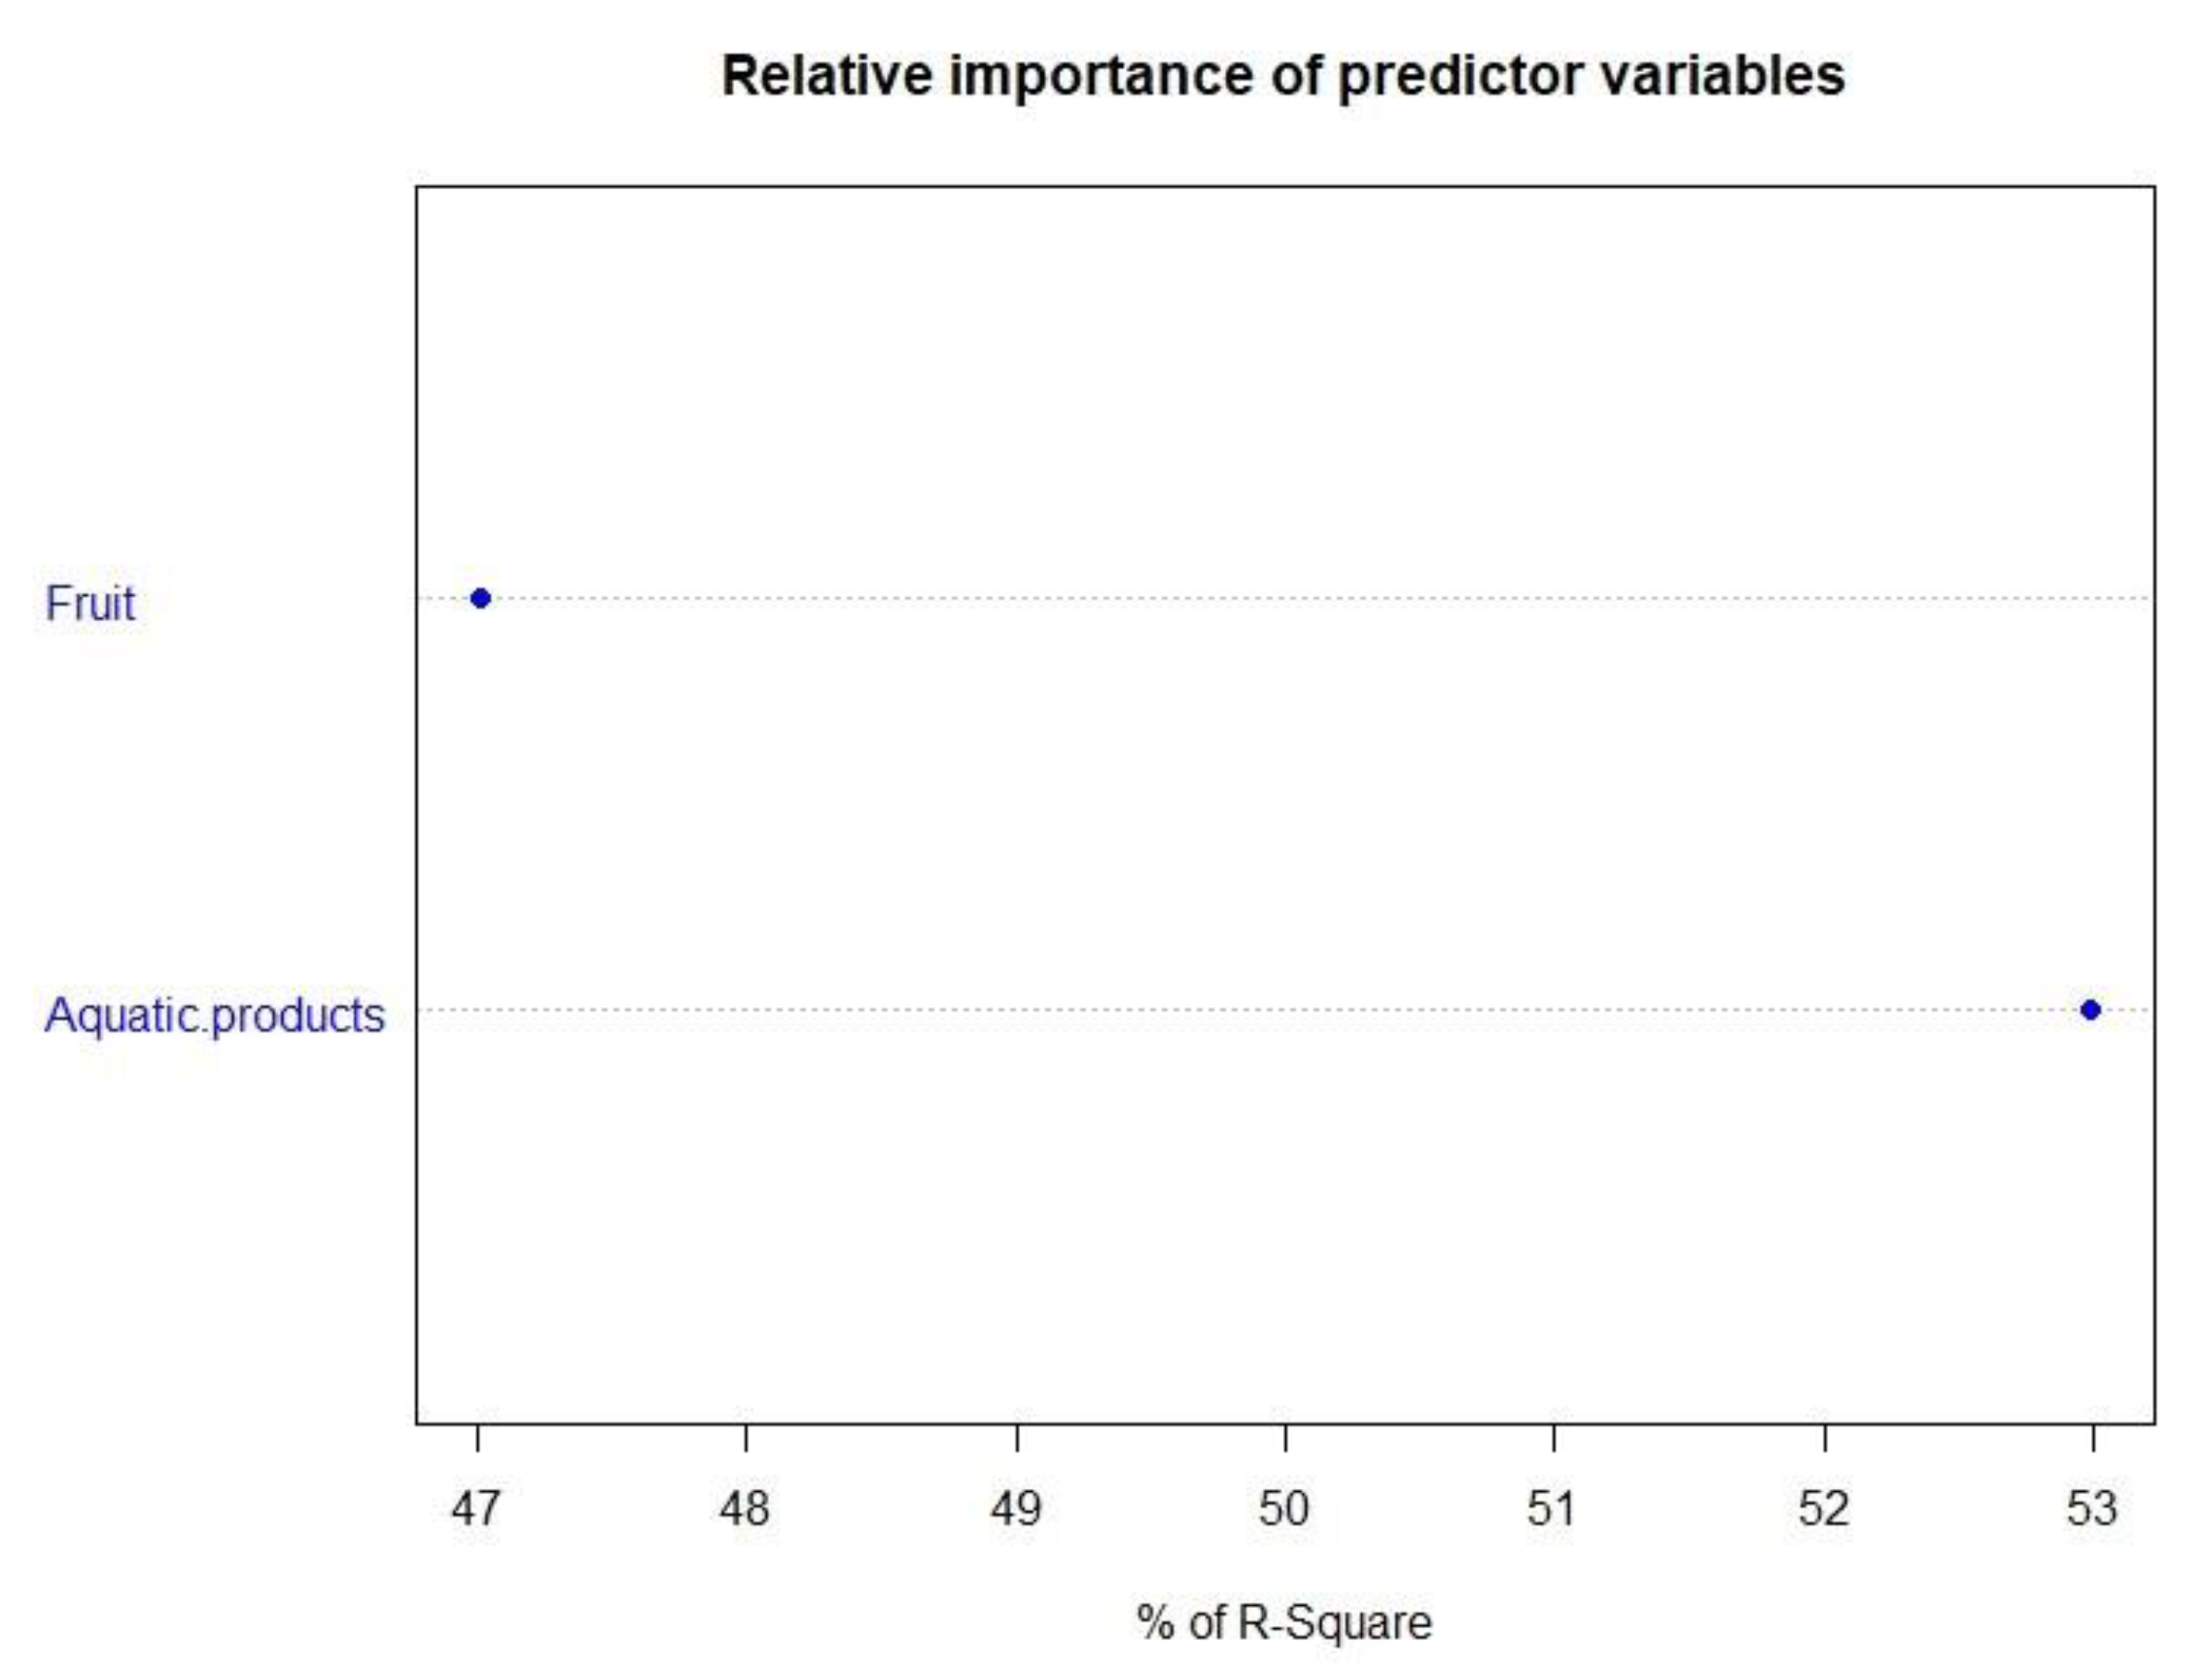
- Provincial Level—Dietary Behavior Factors
3.4.3. Sensitivity Analysis
- (a)
- Prefecture Level—Socioeconomic Factors
- (b)
- Provincial Level—Dietary Behavior Factors
4. Discussion
5. Conclusions
Author Contributions
Funding
Institutional Review Board Statement
Informed Consent Statement
Data Availability Statement
Conflicts of Interest
References
- Fei, X.; Chen, W.; Zhang, S.; Liu, Q.; Zhang, Z.; Pei, Q. The spatio-temporal distribution and risk factors of thyroid cancer during rapid urbanization–A case study in China. Sci. Total Environ. 2018, 630, 1436–1445. [Google Scholar] [CrossRef] [PubMed]
- Salamat, F.; Aryannia, A.; Rajaei, S.; Naeimi-Tabiei, M.; Afghani, R.; Sedaghat, S.M.; Naeimi-Tabiei, E.; Salamat, F.; Hosseinpour, R.; Fazel, A.; et al. Temporal and Geographical Trends of Incidence of Thyroid Cancer in Golestan, Iran, 2004–2013. Arch. Iran. Med. 2021, 24, 1–6. [Google Scholar] [CrossRef] [PubMed]
- Fitzmaurice, C.; Akinyemiju, T.F.; Al Lami, F.H.; Alam, T.; Alizadeh-Navaei, R.; Allen, C.; Alsharif, U.; Alvis-Guzman, N.; Amini, E.; Anderson, B.O.; et al. Global, Regional, and National Cancer Incidence, Mortality, Years of Life Lost, Years Lived With Disability, and Disability-Adjusted Life-Years for 29 Cancer Groups, 1990 to 2016: A Systematic Analysis for the Global Burden of Disease Study. JAMA Oncol. 2018, 4, 1553–1568. [Google Scholar] [PubMed]
- Sung, H.; Ferlay, J.; Siegel, R.L.; Laversanne, M.; Soerjomataram, I.; Jemal, A.; Bray, F. Global Cancer Statistics 2020: GLO-BOCAN Estimates of Incidence and Mortality Worldwide for 36 Cancers in 185 Countries. CA Cancer J. Clin. 2021, 71, 209–249. [Google Scholar] [CrossRef] [PubMed]
- Rahib, L.; Smith, B.D.; Aizenberg, R.; Rosenzweig, A.B.; Fleshman, J.M.; Matrisian, L.M. Projecting cancer incidence and deaths to 2030: The unexpected burden of thyroid, liver, and pancreas cancers in the United States. Cancer Res. 2014, 74, 2913–2921. [Google Scholar] [CrossRef]
- Li, M.; Pei, J.; Xu, M.; Shu, T.; Qin, C.; Hu, M.; Zhang, Y.; Jiang, M.; Zhu, C. Changing incidence and projections of thyroid cancer in mainland China, 1983–2032: Evidence from Cancer Incidence in Five Continents. Cancer Causes Control 2021, 32, 1095–1105. [Google Scholar] [CrossRef]
- Cardis, E.; Kesminiene, A.; Ivanov, V.; Malakhova, I.; Shibata, Y.; Khrouch, V.; Drozdovitch, V.; Maceika, E.; Zvonova, I.; Vlassov, O.; et al. Risk of Thyroid Cancer After Exposure to 131 I in Childhood. J. Natl. Cancer Inst. 2005, 97, 724–732. [Google Scholar] [CrossRef]
- Bhaskaran, K.; Douglas, I.; Forbes, H.; dos-Santos-Silva, I.; Leon, D.A.; Smeeth, L. Body-mass index and risk of 22 specific cancers: A population-based cohort study of 5.24 million UK adults. Lancet 2014, 384, 755–765. [Google Scholar] [CrossRef]
- Lee, J.-H.; Hwang, Y.; Song, R.-Y.; Yi, J.W.; Yu, H.W.; Kim, S.-J.; Chai, Y.J.; Choi, J.Y.; Lee, K.E.; Park, S.K. Relationship between iodine levels and papillary thyroid carcinoma: A systematic review and meta-analysis. Head Neck 2017, 39, 1711–1718. [Google Scholar] [CrossRef]
- Karzai, S.; Zhang, Z.; Sutton, W.; Prescott, J.; Segev, D.L.; McAdams-DeMarco, M.; Biswal, S.S.; Ramanathan, M., Jr.; Mathur, A. Ambient particulate matter air pollution is associated with increased risk of papillary thyroid cancer. Surgery 2022, 171, 212–218. [Google Scholar] [CrossRef]
- Park, S.J.; Min, C.; Yoo, D.M.; Choi, H.G. National cohort and meteorological data based nested case–control study on the association between air pollution exposure and thyroid cancer. Sci. Rep. 2021, 11, 21562. [Google Scholar] [CrossRef] [PubMed]
- Siu, S.; McDonald, J.T.; Rajaraman, M.; Franklin, J.; Paul, T.; Rachinsky, I.; Morrison, D.; Imran, S.A.; Burrell, S.; Hart, R.; et al. Is Lower Socioeconomic Status Associated with More Advanced Thyroid Cancer Stage at Presentation? A Study in Two Ca-nadian Centers. Thyroid 2014, 24, 545–551. [Google Scholar] [CrossRef] [PubMed]
- Choi, S.-W.; Ryu, S.-Y.; Han, M.-A.; Park, J. The Association Between the Socioeconomic Status and Thyroid Cancer Prevalence; Based on the Korean National Health and Nutrition Examination Survey 2010–2011. J. Korean Med Sci. 2013, 28, 1734–1740. [Google Scholar] [CrossRef] [PubMed]
- Jang, J.; Yoo, D.-S.; Chun, B.C. Spatial distribution and determinants of thyroid cancer incidence from 1999 to 2013 in Korea. Sci. Rep. 2021, 11, 22474. [Google Scholar] [CrossRef]
- Fei, X.; Lou, Z.; Christakos, G.; Liu, Q.; Ren, Y.; Wu, J. Contribution of industrial density and socioeconomic status to the spatial distribution of thyroid cancer risk in Hangzhou, China. Sci. Total Environ. 2018, 613, 679–686. [Google Scholar] [CrossRef]
- Parad, M.T.; Fararouei, M.; Mirahmadizadeh, A.R.; Afrashteh, S. Thyroid cancer and its associated factors: A population-based case-control study. Int. J. Cancer 2021, 149, 514–521. [Google Scholar] [CrossRef]
- Giannoula, E.; Melidis, C.; Frangos, S.; Papadopoulos, N.; Koutsouki, G.; Iakovou, I. Ecological Study on Thyroid Cancer Incidence and Mortality in Association with European Union Member States’ Air Pollution. Int. J. Environ. Res. Public Health 2020, 18, 153. [Google Scholar] [CrossRef]
- Getis, A. Reflections on spatial autocorrelation. Reg. Sci. Urban Econ. 2007, 37, 491–496. [Google Scholar] [CrossRef]
- Han, J.; Kang, Y. Prevalence and influencing factors of thyroid cancer. Pract. Prev. Med. 2018, 25, 894–897. [Google Scholar]
- Li, M.; Zheng, R.; Maso, L.D.; Zhang, S.; Wei, W.; Vaccarella, S. Mapping overdiagnosis of thyroid cancer in China. Lancet Diabetes Endocrinol. 2021, 9, 330–332. [Google Scholar] [CrossRef]
- Liu, P.; SU, X.; Shen, H.; Meng, F.; Fan, L.; Liu, S.; Sun, D. National iodine deficiency disorders: An analysis of surveillance data in 2011. Chin. J. Endem. 2015, 34, 181–185. [Google Scholar]
- Wang, Y.; Wang, W. Increasing Incidence of Thyroid Cancer in Shanghai, China, 1983-2007. Asia-Pac. J. Public Health 2015, 27, 223–229. [Google Scholar] [CrossRef] [PubMed] [Green Version]
- Chen, Y.C.; Gao, X.H.; Cao, M.Q.; Li, X.F.; Ma, L. Risk factors of thyroid cancer: A case-control study. Chin. J. Public Health 2014, 30, 955–957. [Google Scholar]
- Jung, S.K.; Kim, K.; Tae, K.; Kong, G.; Kim, M.K. The effect of raw vegetable and fruit intake on thyroid cancer risk among women: A case–control study in South Korea. Br. J. Nutr. 2012, 109, 118–128. [Google Scholar] [CrossRef] [PubMed]
- Barrea, L.; Pugliese, G.; Frias-Toral, E.; Laudisio, D.; Rodriguez, D.; Vitale, G.; Colombo, C.; Colao, A.; Savastano, S.; Muscogiuri, G. Diet as a possible influencing factor in thyroid cancer incidence: The point of view of the nutritionist. Panminerva Med. 2021, 63, 349–360. [Google Scholar] [CrossRef] [PubMed]
- Zamora-Ros, R.; Béraud, V.; Franceschi, S.; Cayssials, V.; Tsilidis, K.K.; Boutron-Ruault, M.C.; Weiderpass, E.; Overvad, K.; Tjønneland, A.; Eriksen, A.K.; et al. Consumption of fruits, vegetables and fruit juices and differentiated thyroid carcinoma risk in the European Prospective Investigation into Cancer and Nutrition (EPIC) study. Int. J. Cancer 2018, 142, 449–459. [Google Scholar] [CrossRef]
- Marcello, M.; Sampaio, A.C.; Geloneze, B.; Vasques, A.C.J.; Assumpção, L.V.M.; Ward, L.S. Obesity and Excess Protein and Carbohydrate Consumption Are Risk Factors for Thyroid Cancer. Nutr. Cancer 2012, 64, 1190–1195. [Google Scholar] [CrossRef]
- Anna, P.; Jordi, B.; Lia, A.; Ruth, M.; Marc, C.; Marta, C.; Mark, N.; Mar, G.M.D.; Rafel, R. Impact of residential greenness on myocardial infarction in population with diabetes: A sex-dependent association? Environ. Res. 2021, 205, 112449. [Google Scholar]
- Kua, K.; Lee, S. The influence of residential greenness on mortality in the Asia-Pacific region: A systematic review and meta-analysis. Perspect. Public Health 2021, 141, 342–353. [Google Scholar] [CrossRef]
- Eldeirawi, K.; Kunzweiler, C.; Zennk, S.; Finn, P.; Nyenhuis, S.; Rosenberg, N.; Persky, V. Associations of urban greenness with asthma and respiratory symptoms in Mexican American children. Ann. Allergy Asthma Immunol. 2018, 122, 289–295. [Google Scholar] [CrossRef]


| Category | Name | Source | Type | Attributes |
|---|---|---|---|---|
| TC data | TC cases, CIR, IR | 2019 Annual Report of China Cancer Registry * | Quantitative data | - |
| Geographic information data | 2021 geographic information layers of provinces, prefectures and nine-dash line, water towns | 1:250,000 National Catalogue Service for Geographic Information (https://www.webmap.cn/, accessed on 20 September 2022) | Vector data | shape |
| Socioeconomic factors data | Sex ratio, UR, PGDP, beds, MIR, GR, education | Statistical yearbook, statistical bulletin, the sixth national census | Quantitative data | - |
| Dietary behavior factors data | Aquatic product, grain, vegetable and edible mushroom, meat, egg, milk, dried and fresh fruits, daily salt intake, salt and water iodine, smoking rate, obesity rate | Statistical yearbook, local research and government active report | Quantitative data | - |
| PM2.5 data | PM2.5 concentration of year 2006, 2011, 2016 | NASA, (https://search.earthdata.nasa.gov/, accessed on 20 September 2022) | Grid data | - |
| Category | Cases (%) | CIR | IR |
|---|---|---|---|
| Male | 12,240(24.27) | 6.32 | 4.71 |
| Female | 38,184(75.73) | 20.32 | 14.79 |
| National | 50,424 | 13.22 | 9.70 |
| Variables | p-Value | r | |
|---|---|---|---|
| IR (per 100,000) | Sex ratio | 0.010 | −0.350 * |
| UR (%) | <0.001 | 0.448 * | |
| PGDP (CNY ten thousand) | <0.001 | 0.503 * | |
| Education (year) | 0.011 | 0.370 * | |
| MIC (%) | 0.009 | 0.345 * | |
| Beds | 0.523 | 0.054 | |
| 2006 PM2.5 (μg/m3) | 0.073 | −0.144 | |
| 2011 PM2.5 (μg/m3) | 0.085 | −0.114 | |
| 2016 PM2.5 (μg/m3) | 0.126 | −0.075 | |
| GR2006 (%) | 0.303 | 0.083 | |
| GR2011 (%) | 0.390 | 0.100 | |
| GR2016 (%) | 0.307 | 0.118 |
| Variables | p-Value | r | |
|---|---|---|---|
| IR (per 100,000) | Water iodine (μg/L) | 0.054 | 0.261 |
| Salt iodine (mg/kg) | <0.001 | −0.555 * | |
| Salt (kg) | 0.379 | −0.138 | |
| Grain (kg) | 0.004 | −0.363 * | |
| Veg and mushrooms (kg) | 0.078 | 0.340 | |
| Meat (kg) | 0.296 | 0.025 | |
| Egg (kg) | 0.001 | 0.416 * | |
| Aquatic products (kg) | 0.005 | 0.551 * | |
| Milk (kg) | 0.094 | 0.197 | |
| Fruit (kg) | 0.008 | 0.484 * | |
| Obesity rate (%) | 0.034 | 0.396 * | |
| Smoking rate (%) | <0.001 | −0.355 * |
| Dependent Variable | Covariate | RR | 95%CI | |
|---|---|---|---|---|
| Upper Limit | Lower Limit | |||
| IR (per 100,000) | UR (%) | 1.109 | 1.084 | 1.135 |
| PGDP (CNY ten thousand) | 1.013 | 1.007 | 1.018 | |
| Dependent Variable | Covariate | RR | 95%CI | |
|---|---|---|---|---|
| Upper Limit | Lower Limit | |||
| IR (per 100,000) | Salt iodine (μg/L) | 0.876 | 0.750 | 1.025 |
| Aquatic product (kg) | 1.047 | 1.020 | 1.075 | |
| Dry and fresh fruit (kg) | 1.024 | 1.007 | 1.040 | |
| Grain (kg) | 0.995 | 0.984 | 1.006 | |
Publisher’s Note: MDPI stays neutral with regard to jurisdictional claims in published maps and institutional affiliations. |
© 2022 by the authors. Licensee MDPI, Basel, Switzerland. This article is an open access article distributed under the terms and conditions of the Creative Commons Attribution (CC BY) license (https://creativecommons.org/licenses/by/4.0/).
Share and Cite
Wang, Y.; Wang, W.; Li, P.; Qi, X.; Hu, W. Risk Analysis of Thyroid Cancer in China: A Spatial Analysis. Geographies 2022, 2, 577-592. https://doi.org/10.3390/geographies2040035
Wang Y, Wang W, Li P, Qi X, Hu W. Risk Analysis of Thyroid Cancer in China: A Spatial Analysis. Geographies. 2022; 2(4):577-592. https://doi.org/10.3390/geographies2040035
Chicago/Turabian StyleWang, Yu, Wenhui Wang, Peng Li, Xin Qi, and Wenbiao Hu. 2022. "Risk Analysis of Thyroid Cancer in China: A Spatial Analysis" Geographies 2, no. 4: 577-592. https://doi.org/10.3390/geographies2040035