Article

An Automated Approach to Instrumenting the Up-on-the-Toes Test(s)

1
Department of Biomedical and Electronics Engineering, Faculty of Engineering and Informatics, University of Bradford, Bradford BD7 1DP, UK
2
Department of Computer and Information Sciences, University of Northumbria, Newcastle upon Tyne NE1 8ST, UK
*
Author to whom correspondence should be addressed.
Biomechanics 2023, 3(3), 278-290; https://doi.org/10.3390/biomechanics3030024
Submission received: 19 April 2023 / Revised: 19 June 2023 / Accepted: 20 June 2023 / Published: 26 June 2023
(This article belongs to the Special Issue Inertial Sensor Assessment of Human Movement)

Abstract

:
Normal ankle function provides a key contribution to everyday activities, particularly step/stair ascent and descent, where many falls occur. The rising to up-on-the-toes (UTT) 30 second test (UTT-30) is used in the clinical assessment of ankle muscle strength/function and endurance and is typically assessed by an observer counting the UTT movement completed. The aims of this study are: (i) to determine whether inertial measurement units (IMUs) provide valid assessment of the UTT-30 by comparing IMU-derived metrics with those from a force-platform (FP), and (ii) to describe how IMUs can be used to provide valid assessment of the movement dynamics/stability when performing a single UTT movement that is held for 5 s (UTT-stand). Twenty adults (26.2 ± 7.7 years) performed a UTT-30 and a UTT-stand on a force-platform with IMUs attached to each foot and the lumbar spine. We evaluate the agreement/association between IMU measures and measures determined from the FP. For UTT-30, IMU analysis of peaks in plantarflexion velocity and in FP’s centre of pressure (CoP) velocity was used to identify each repeated UTT movement and provided an objective means to discount any UTT movements that were not completed ‘fully’. UTT movements that were deemed to have not been completed ‘fully’ were those that yielded peak plantarflexion and CoP velocity values during the period of rising to up-on-the-toes that were below 1 SD of each participant’s mean peak rising velocity across their repeated UTT. The number of UTT movements detected by the IMU approach (23.5) agreed with the number determined by the FP (23.6), and each approach determined the same number of ‘fully’ completed movements (IMU, 19.9; FP, 19.7). For UTT-stand, IMU-derived movement dynamics/postural stability were moderately-to-strongly correlated with measures derived from the FP. Our findings highlight that the use of IMUs can provide valid assessment of UTT test(s).

1. Introduction

The functions of the foot and ankle are important to everyday locomotion/functional ability [1,2,3], including step/stair descent and ascent [4,5]. For example, the ankle provides a key contribution to maintaining dynamic balance during the single-limb support phase of stair descent when the contralateral limb is being lowered to contact the next (lower) step [4]. The rising to up-on-the-toes (UTT) 30 s test (UTT-30, also referred to as the calf-raise or heel-rise test) is used in the clinical assessment of ankle muscle strength, performance, and endurance [6] and ultimately the properties of the calf muscle–tendon unit [7]. The test has been deployed in the assessment of impairment, injury, and treatment outcomes of the lower limb [7]. The test assesses a person’s ability to repetitively rise-UTT as many times as possible in 30 s and is typically timed using a stopwatch and assessed by an observer. To encourage the patient to complete each repeated rising-UTT repetition over a ‘full’ (acceptable) range of motion (ROM), various monitoring devices have been developed. For example, using an electrogoniometer to measure ankle motion, 50% of each participant’s maximum ankle ROM as determined prior to testing was used as the target ROM to indicate acceptable UTT movements [8,9]. Another study deployed a height-adjustable elastic band device placed beneath one heel, the height of which was adjusted to the height of the heel during a single UTT movement completed over a maximum comfortable height. Failure of the heel to then clear the band on two consecutive movements ended the UTT-30 test [10]. Elsewhere, monitoring of UTT movements has been achieved by placing a foam-board above the participant’s head, the height of which was adjusted to the height attained when completing a single, controlled UTT movement that was as high as comfortably possible. Participants were asked to touch the board with their head on each UTT movement of the UTT-30 [6]. Although the use of such devices may encourage patients to complete the repeated rising-UTT movements over a ‘full’ (acceptable) ROM, they typically require an observer to keep track of the monitoring device to determine which repetitions are completed over an acceptable range and to count how many are completed. This may explain why none of these devices have become widely used.
In addition, whilst in past studies the inter-rater reliability for determining/observing the number of UTT repetitions completed in a UTT-30 has been shown to be high (ICC = 0.93–0.96) [6], a poorer intra-rater reliability (ICC = 0.79–0.84) [6], suggests that counting errors can happen and that these are likely to occur when administering the test consecutively for multiple participants (e.g., in a clinical setting). There is a need for objective approaches for determining the number of repeated rise-UTT movements that are completed and how many are completed over a ‘full’/acceptable range, which could then be used in a range of testing environments. Inertial measurement units (IMU) may provide a pragmatic approach for such testing.
In a preliminary study we demonstrated how IMUs might be used to assess the UTT-30, by determining the number of UTT movements completed and by suggesting how movement consistency across the repeated UTT movements might be assessed [11]. The present study has two aims: (i) to determine whether IMUs provide a valid assessment of the UTT-30, by evaluating whether IMU-derived assessment metrics are comparable to those gained from a force-platform (FP); and (ii) to determine whether IMUs provide valid assessment of a single UTT movement when the participant is asked to hold the position of being UTT for 5 s (UTT-stand). For this (newly presented) UTT-stand test, we describe how IMUs could be used to assess the movement dynamics during the rise-UTT, as well as the postural control exhibited whilst holding the UTT position, and again evaluate whether IMU-derived assessment metrics are comparable to those gained from an FP. There are many daily living locomotor activities that involve being momentarily balanced on just the ball (toes region) of the foot e.g., during the single-limb support phase of stair descent when reaching downwards with the leading limb to contact the next (lower) step. Thus, use of the instrumented UTT-stand test to assess a person’s ability to balance on their toes could provide relevant additional insights regarding ankle strength and function that are adjunct to those provided by the UTT-30.

2. Methods

2.1. Participant Recruitment

Twenty young, healthy adults (13 males, 7 females; 26.2 ± 7.7 years, 1.7 ± 0.1 m and 69.9 ± 16.1 kg) were recruited from the University of Bradford and its surrounding local area. Participants were excluded if they had any neurological, cardiovascular or musculoskeletal conditions that could affect their balance. All participants self-reported that they were lightly-to-vigorously physically active (as defined by the American College of Sports Medicine (ACSM) physical activity guidelines) [12]. The study received ethical approval, and all participants gave informed consent. Participants wore comfortable clothing and flat-soled shoes (trainers), and any corrective vision lens/spectacles that they habitually wore for walking.

2.2. Protocol

Participants stood on a floor-mounted FP (AMTI OR6-6, Watertown, MA, USA) in an upright position (arms by the sides, feet comfortably apart). They were asked to maintain their gaze at an eye-level visual target placed 5 m in front of them. The test proceeded as follows:
  • Twenty seconds of stationary standing.
  • a UTT-30. Here, participants were instructed to rise-UTT as high as comfortably possible and at a comfortable speed until indicated to stop (after 30 s), ensuring the heel contacted the ground between each movement. Note, all UTT movements were accepted for later analysis.
  • Twenty seconds of stationary standing.
  • a UTT-stand. Here, participants were instructed to rise-UTT as fast as comfortably possible and then hold this position until indicated to “return” to normal standing (after 5 s).
  • Twenty seconds of stationary standing.
A stopwatch (iPhone XS) was used to time each element. If a participant lost their balance during the UTT-stand, they were asked to repeat steps 4 and 5, above.

2.3. Data Collection

Ground reaction force (GRF) data (at 100 hertz, Hz) were collected for the entire UTT protocol i.e., steps 1–5 as described above. Data were low-pass filtered (Butterworth) with a cut-off of 20 Hz. The filtered GRF data in the vertical (Fz) direction along with the centre of pressure (CoP) coordinate data in the anteroposterior (CoPy) directions were exported in ASCII (‘.csv’) format for further analysis.
Two IMUs (AX6, Axivity Ltd., Newcastle, UK, https://axivity.com/ accessed on 3 May 2021: tri-axial accelerometer and tri-axial gyroscope) were attached to the upper surface of each shoe (i.e., on the shoelaces/tongue area). A third IMU (AX3, Axivity Ltd., tri-axial accelerometer) was attached over the lower back (fifth lumbar vertebrae, L5). The technologies have been previously evaluated and deemed suitable to capture data on human movement [13]. Using the proprietary software [14], IMUs (16-bit resolution, ±8 g, ±1000°/s) were set to capture data at 100 Hz. Prior to attachment, they were held together in the hands of the researcher (all oriented in the same direction) who then ‘banged’ their hands (with the IMUs)’ on a desk. This introduced an acceleration spike in each IMU, which was used as a ‘time stamp’ to retrospectively synchronize/align data from each IMU in time. Once the UTT-tests were concluded, IMUs were removed, and data were downloaded for further analysis.

2.4. Data Treatment and Analysis

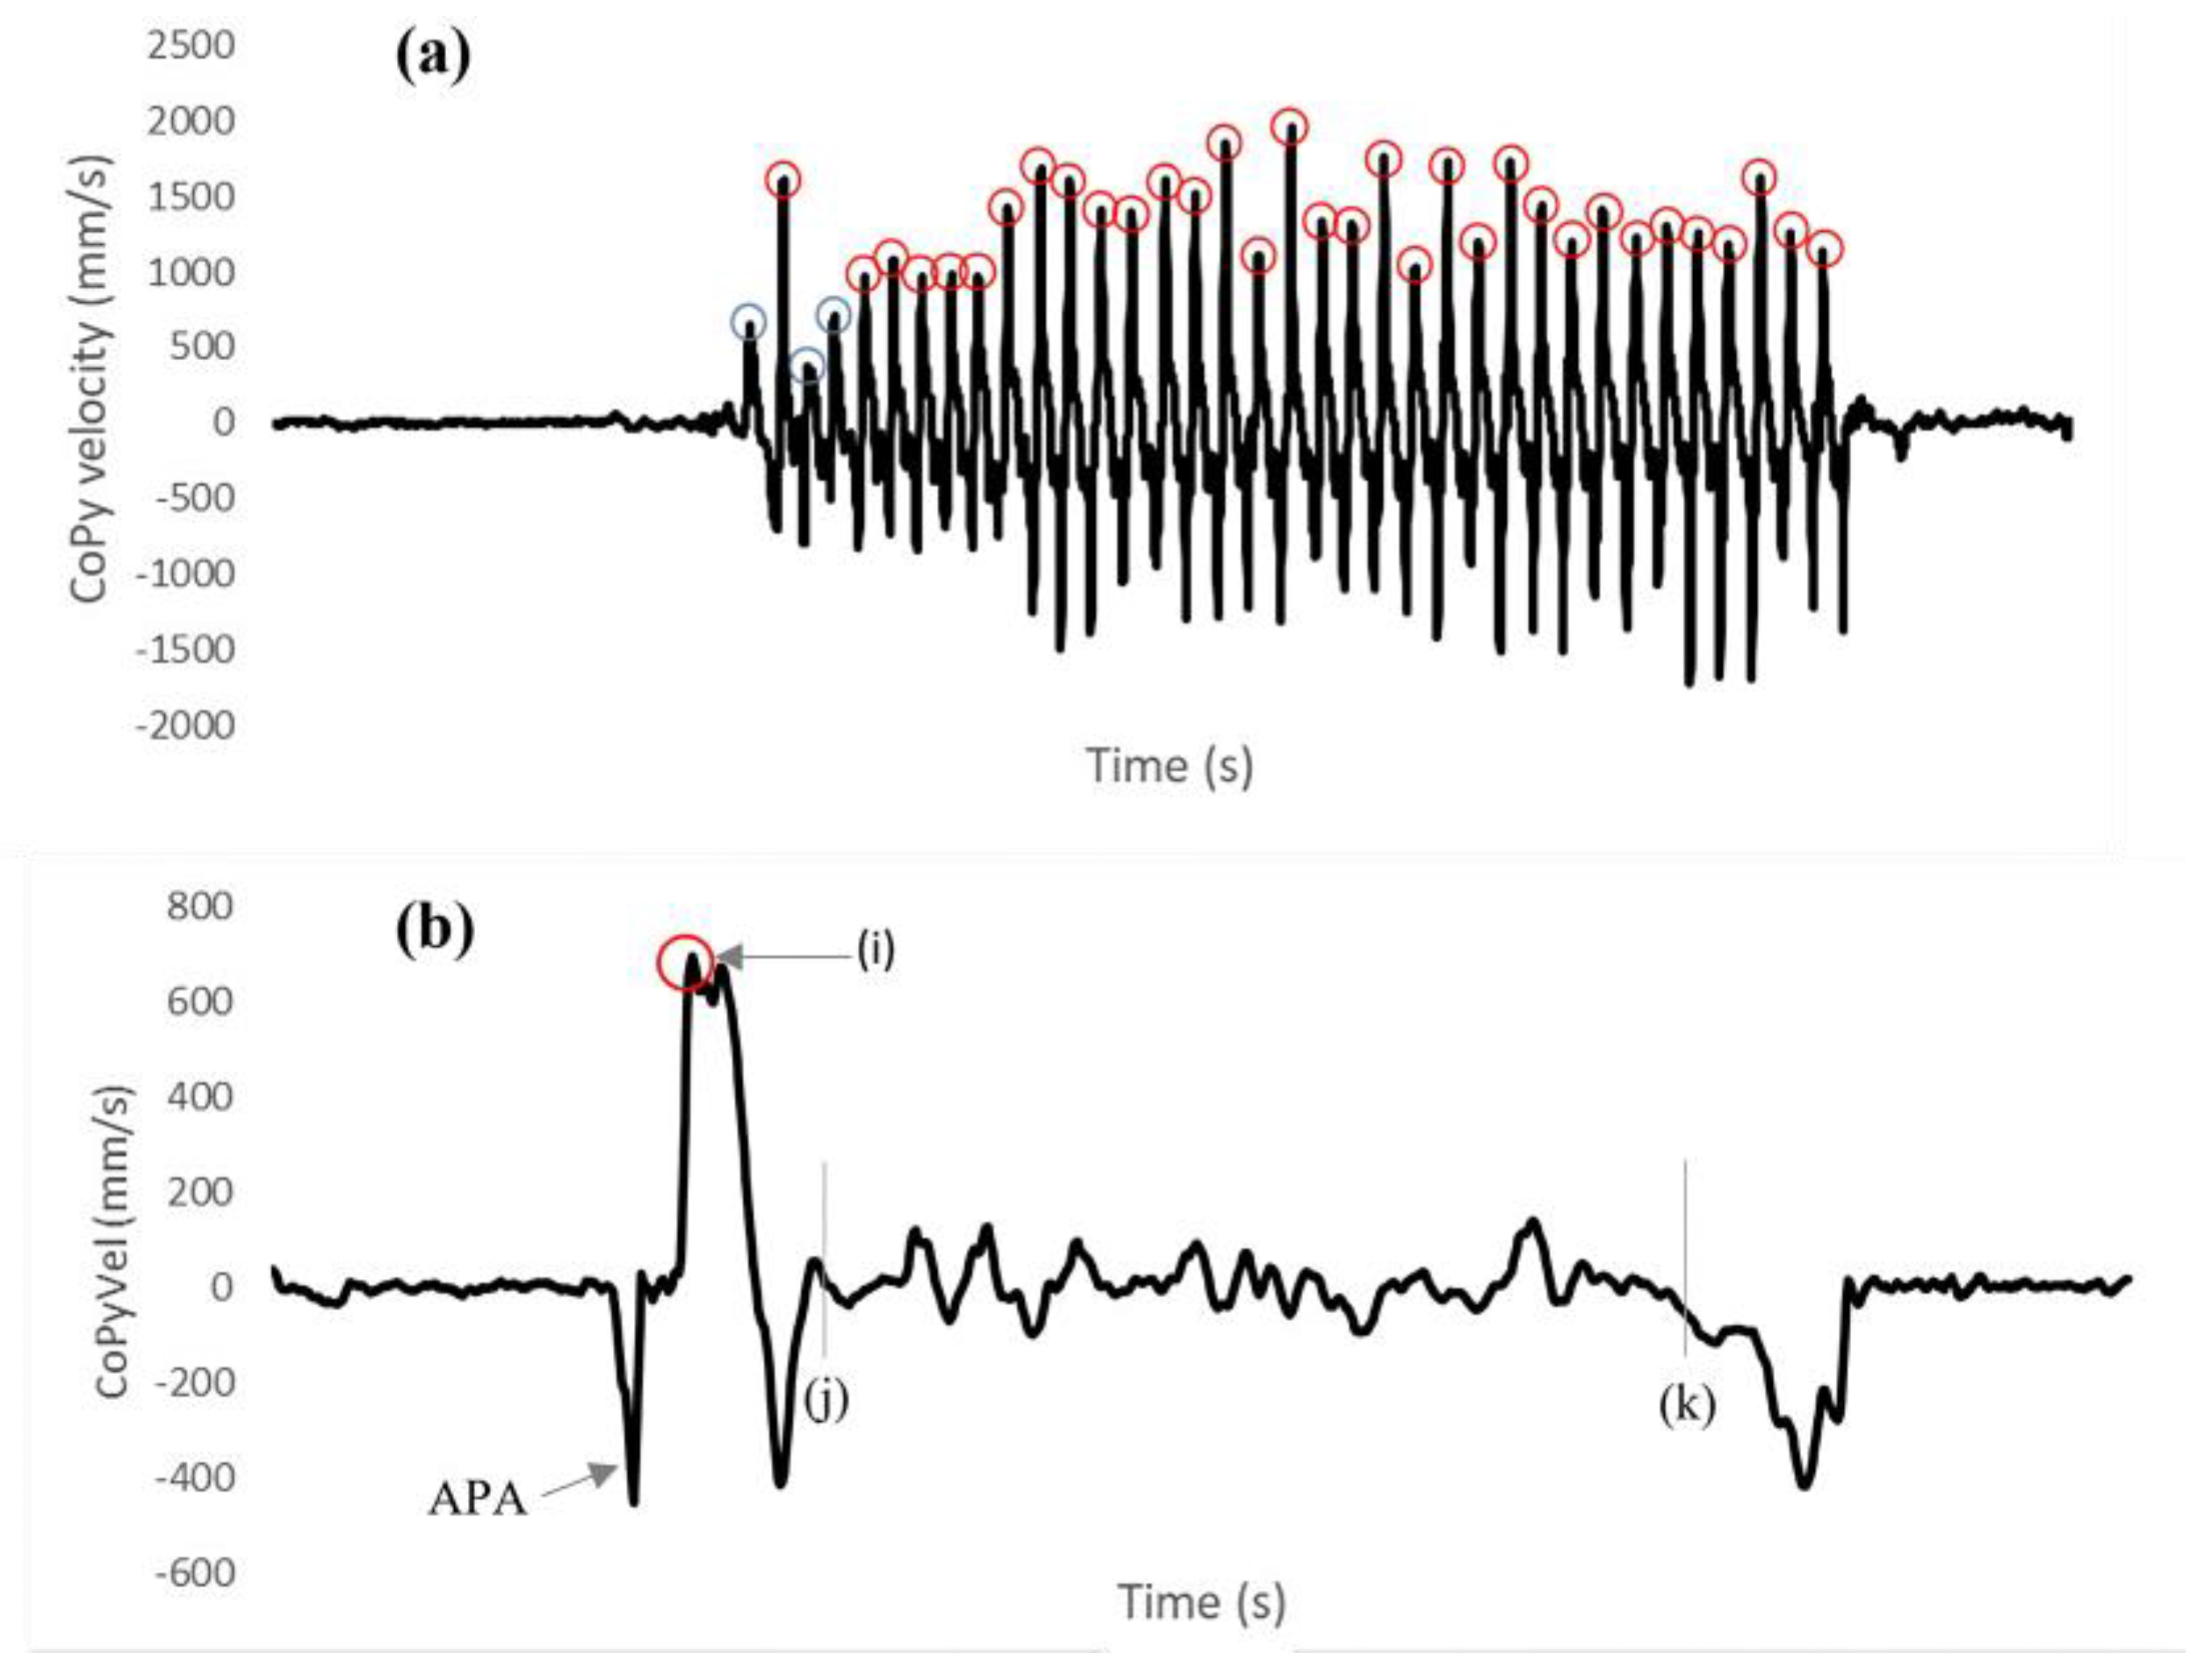
2.4.1. Forceplatform Data Analysis

Using CoPy (anteroposterior, AP) data, CoP AP velocity (CoPyVel) and CoP AP acceleration (CoPyAccel) were determined using a 4-point moving window differentiation approach. The following were then determined:

UTT-30 (Figure 1a): Num. UTT Movements Completed, and Mean Peak CoPyVel

The occurrence of a UTT movement was visually identified as a distinct peak (local maximum) in the CoPyVel. For each participant, the mean and standard deviation (SD) in peak CoPyVel across their repeated UTT movements were calculated, and any CoPyVel peaks with a magnitude less than 1 SD below the mean were highlighted. The total number of CoPyVel peaks identified indicated the number of UTT movements attempted, and the number of CoPyVel peaks within 1 SD of the mean, indicated the number of UTT movements that were ‘fully’ completed. Each participant’s mean peak CoPyVel was then recalculated from the fully completed UTT movements.
In our previous (sister) study, we identified movements completed over a sufficiently ‘full’ range as those with a peak CoPyVel that were within 2 SD of the mean CoPyVel [11]. However, because identifying a peak in CoPyVel to identify each UTT movement attempted provides an indication of UTT speed but not of its ROM, we highlighted that instead of identifying (and discounting) UTT movements that are not completed over an acceptable/‘full’ ROM, an alternative approach would be to determine UTT consistency. Consistency could be evaluated simply by determining how many UTT movements, in percentage terms, had a peak CoPyVel that was within a certain threshold of the mean peak CoPyVel [11]. We also suggested consistency could be determined for a range of thresholds, e.g., within 1 SD, 1.5 SD and 2 SD of the mean. As the key aim in the present study was to determine the validity of the use of IMUs in comparison with the use of an FP, for pragmatic purposes we chose a 1 SD threshold to identify movements completed with an acceptable range. Such a threshold is the most widely used when assessing movement variability.

UTT-Stand (Figure 1b): Peak CoPyVel, and Peak CoPy Accel (Figure 1b)

The UTT-stand was identified by a single distinct increase in the CoPyVel following an anticipatory postural adjustment (APA) that indicated the initiation of the UTT-stand. The APA was identified by a distinct negative peak in CoPyVel. The peak CoPyVel and peak CoPy Accel occurring during the rising UTT position were recorded.
When standing stationary, a force averaging one body weight (BW) is applied to the ground, and hence there will be a vertical (z) reaction force of 1 BW. Thus, having a vertical reaction force (Fz measured in Newtons) greater than BW applied over a time period, will create a vertical impulse that causes the centre of mass to rise upwards. The Fz impulse (above BW threshold) for rising UTT was calculated for the UTT-stand using the Simpson’s Rule (Equation (1)).
X o X n f x d x = 1 2 h γ o + γ n + 2 ( γ 1 + γ 2 + + γ n 1 ) ( N s )
where h is the interval in time (0.01) and y is each Fz value from the instance Fz first rose above 1 BW for 5 samples/frames (o) to the instance the Fz fell back to 1 BW following the holding of the UTT position.
The instant that the UTT holding position was begun was determined as the instant that the CoPyVel reduced to less than 50 mm/s, following a brief increase in CoPyVel after it had become negative as participants moved to the UTT position. The instant that the holding of the UTT position was ended was determined as the instant CoPyVel first reduced below −50 mm/s prior to a negative peak in CoPyVel, as participants returned to normal standing. The postural stability when holding the UTT position was determined as the SD in the CoPyVel for the period that participants held the UTT position.

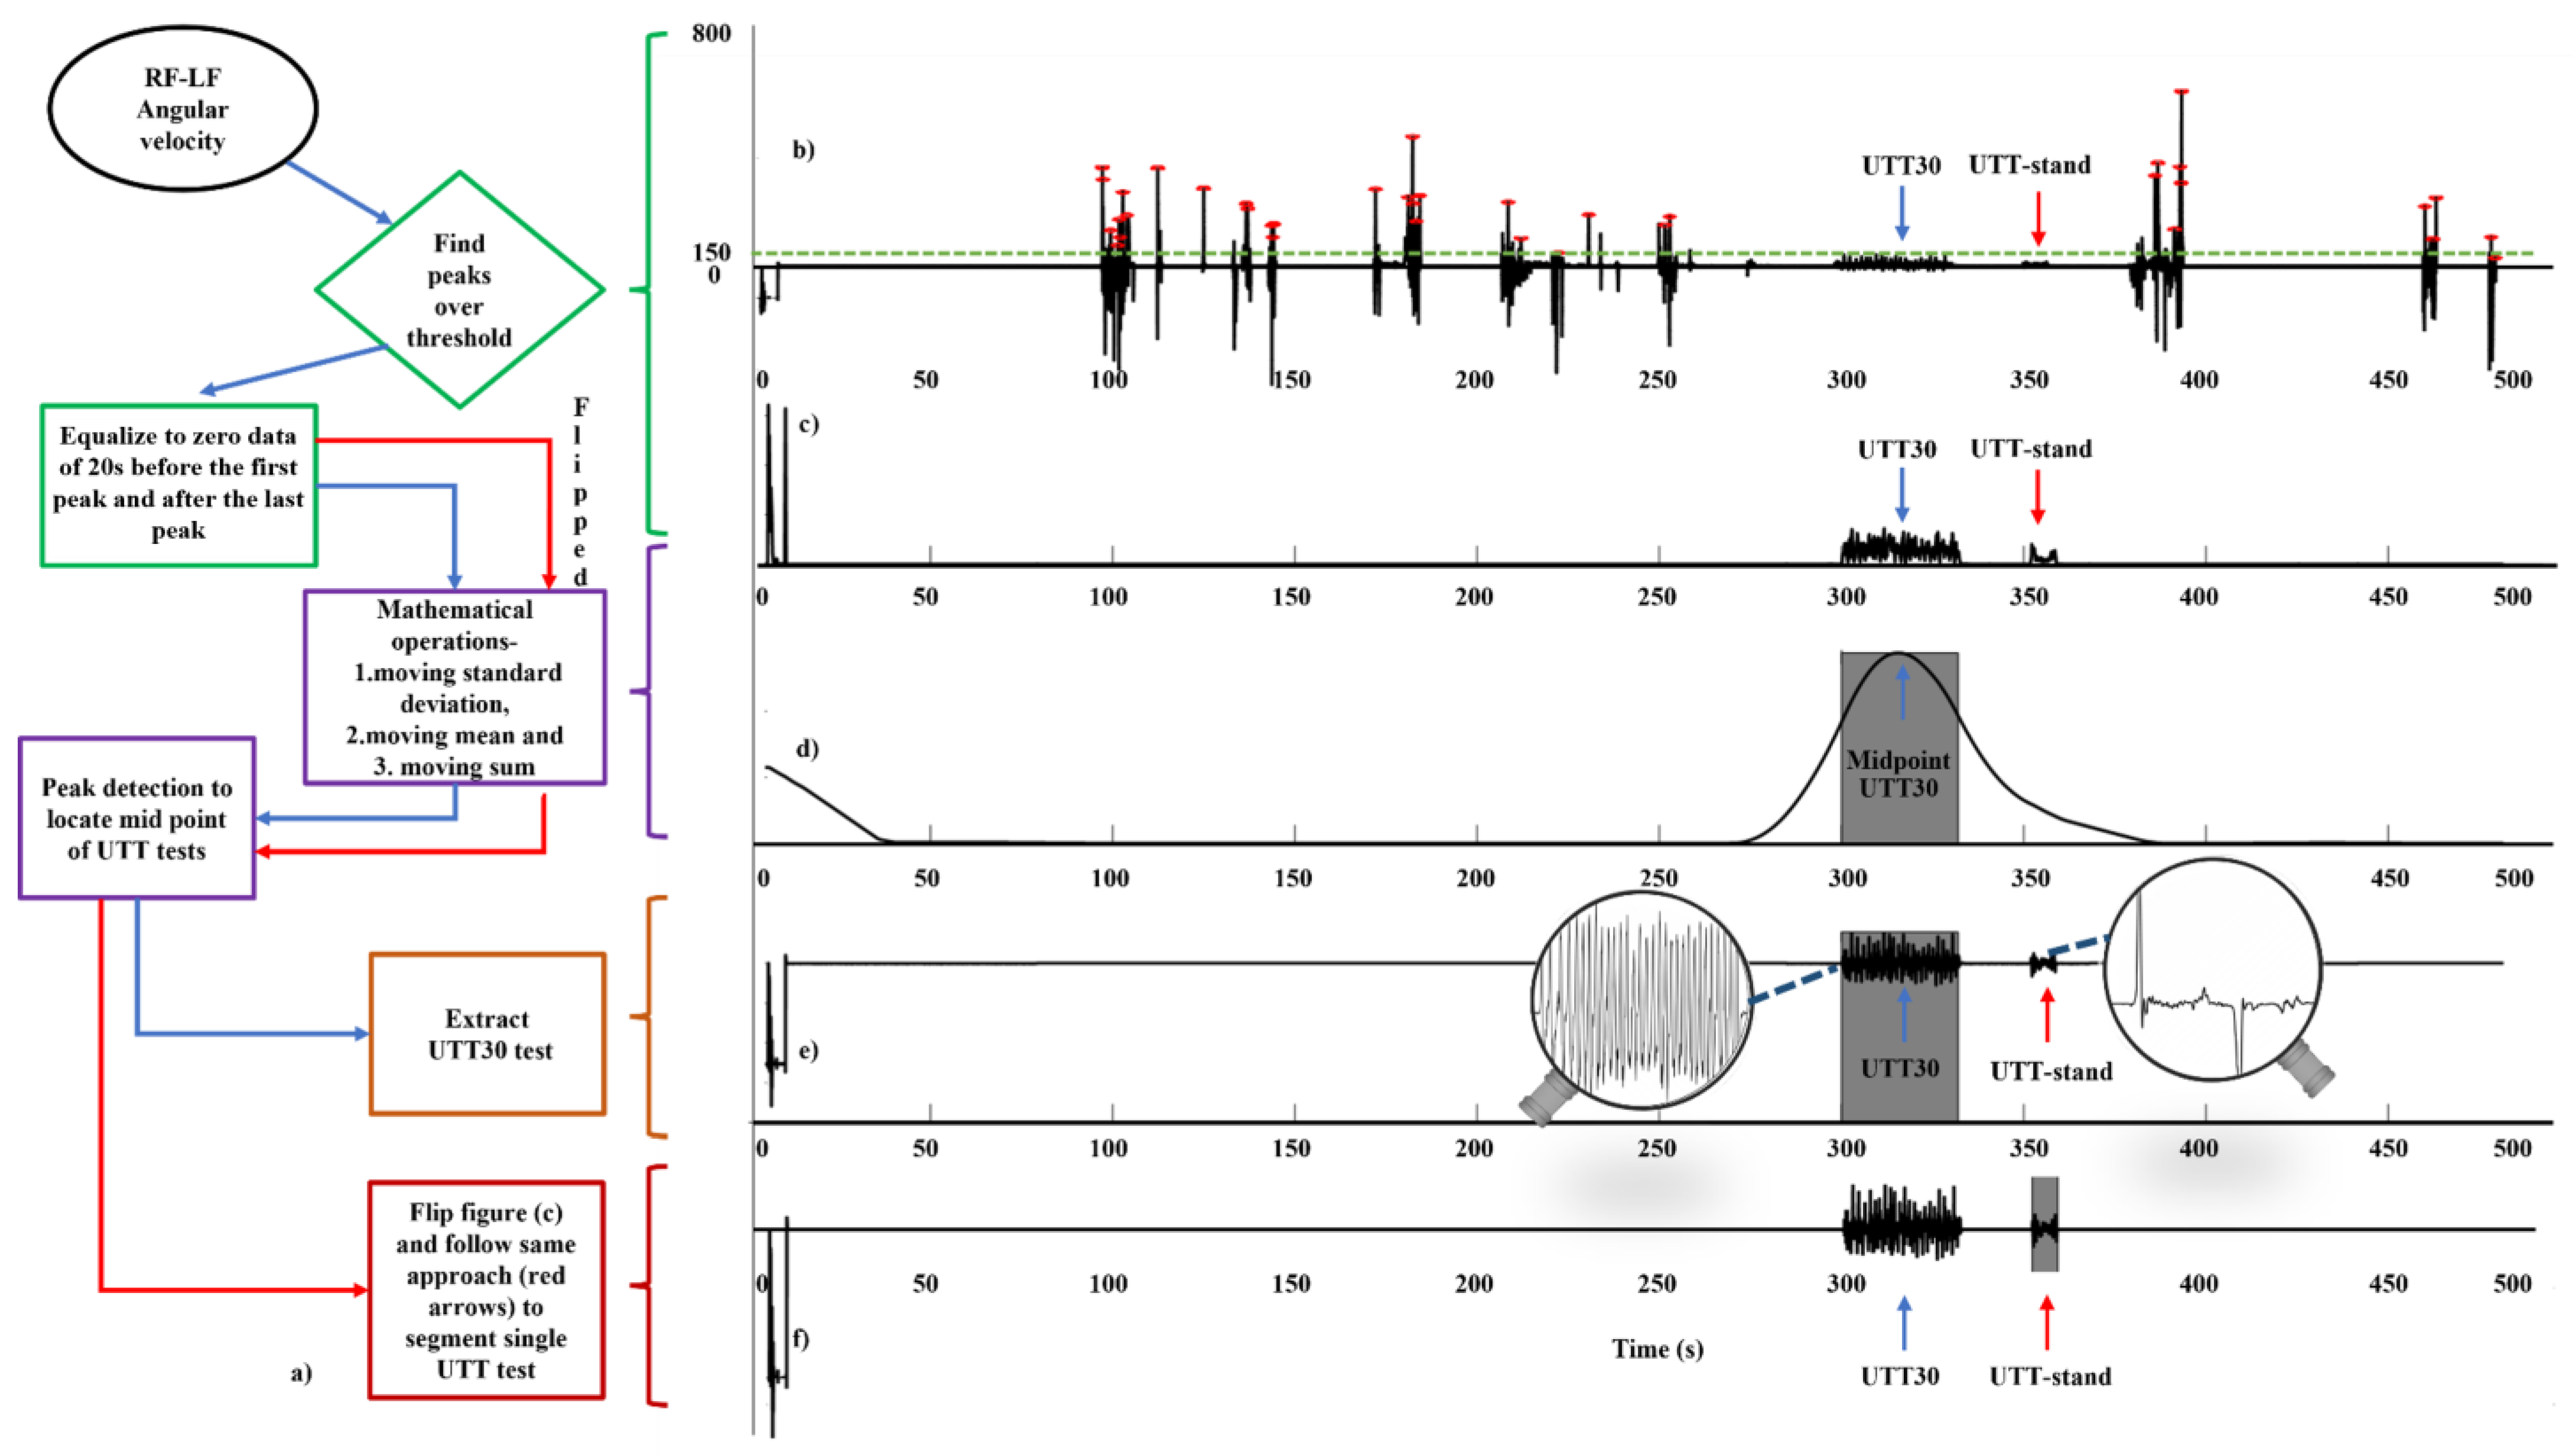
2.4.2. IMU Data Analysis

Custom programs in MATLAB® (2019, MathWorks, Inc., Natick, MA, USA: www.mathworks.com (accessed on 31 May 2023)) were used to automatically segment each UTT test from the continuous streams of IMU data and extract outcomes. Moving SD, mean and sum operations were initially used to shape the signal for use in segmentation of UTT tests. Figure 2a highlights the segmentation processes.
Analysis was begun by identification/extraction of the UTT-30 data as it generated clear and repetitive angular velocity patterns for the right and left feet (RF and LF) in the sagittal plane during plantar flexion. From a visual examination of all participants’ data, a threshold value of 150°/s was set to extract the UTT tests (Figure 2b, green dashed line). The automated segmentation algorithm is as follows:
  • A peak detection algorithm was used to detect the peaks (local maxima) above the 150°/s threshold.
  • Data for the 20 s before the first peak and after the last peak was equalized/set to zero, i.e., the algorithm requires and makes use of periods of 20 s stationary standing before and after the UTT-30 (Figure 2c).
  • Moving SD and moving mean operations with a 5 s sliding window were used to differentiate the UTT-30 from UTT-stand.
  • Moving summing operations along with peak detection was used to detect the midpoint of the repeated UTT-30 (Figure 2d). The sliding window size of the moving sum operation was set to 30 s (i.e., the length of UTT-30).
  • The UTT-30 was segmented considering 15 s before and after the calculated midpoint/peak location (Figure 2e).
  • Once the UTT-30 was segmented, the signal was flipped in the time domain (MATLAB® ‘flipud’ function), reversing the chronological order of the data. This allowed the UTT-stand to be segmented using the same approach as described in step 3 above (e.g., moving SD, Figure 2f), with the sliding window size of the moving sum operation set to 5 s (i.e., length of a UTT-stand).
Reversing the signal in time ensured the last (successful) UTT-stand was segmented if a participant had to repeat the test due to losing their balance in their first attempt. The automatic segmentation (Figure 2) was performed for LF and RF separately. Once the UTT tests were segmented, timestamp information of LF-RF IMUs was used to segment UTT tests from the AX3 sensors attached to L5.

Number of Movements, and Mean Peak Foot Angular Velocity

A UTT movement was identified as a distinct peak (local maximum) in RF and LF plantarflexion angular velocity (sagittal plane). The mean and SD peak angular velocity across the repeated UTT movements were calculated, and any peaks with a magnitude of less than 1 SD below the mean were highlighted. The total number of angular velocity peaks identified indicated the number of UTT movements attempted, and the number of peaks within 1 SD of the mean indicated how many UTT movements were completed ‘fully’. (As highlighted above, a threshold of 1 SD below the mean was for pragmatic purposes.) Each participant’s mean peak plantarflexion velocity was then recalculated from the fully completed UTT.

Peak Plantarflexion Angular Velocity

Each foot’s maximum plantarflexion angular velocity (sagittal plane) during the rising-to-the-toes movement was extracted. From the values determined for both the RF and LF, the average value was recorded as peak plantarflexion angular velocity.

Peak CoM (L5) Upwards Acceleration (When Rising to Toes)

Data from the IMU attached to L5 were low-pass filtered (2 Hz, zero-lag 4th-order Butterworth) [13]. Then the peak acceleration in the vertical direction during the rise-to-toes movement was identified. This peak was recorded as peak body centre of mass (CoM) upwards acceleration.

Postural Stability Whilst Holding UTT Position

Postural stability was then assessed as the variability (SD) in the AP acceleration of the L5 IMU (CoM) whilst holding the UTT position. The holding position was deemed to start at 0.4 s after the peak in upward acceleration and to end 0.4 s before the peak in downward acceleration.

2.5. Analysis: Comparison between IMU and FP Outcomes

As parameters derived from the IMU and FP were determined from different (transducer) technologies, it would be inappropriate to determine ‘agreement’ between their outcome measures. However, it was expected that the measures derived would be related to some extent. For example, (i) to evaluate how quickly an individual rose to their toes during the UTT-stand, the peak CoPy velocity (FP) and the peak foot angular velocity (IMU) were determined and thus one would expect the two different measures would be correlated and; (ii) the peak foot angular velocity during rising to the toes might also be associated with how much ‘push’ is developed in raising the whole-body CoM. Accordingly, one might expect that this measure would also be closely related to the Fz-impulse generating when rising up to the toes. Therefore, to highlight the relationship between IMU and FP measures, we created a series of scatter (x, y) graphs (using data for all participants), plotting each outcome measure determined from the IMU and corresponding FP measure. Each plot contains a linear regression line where the r-value indicates the strength of the relationship (correlation) between IMU and FP measures. R-values <0.35 were considered to indicate a low-to-weak relationship between IMU and FP measures; 0.36–0.67 moderate; and ≥0.68 as strong [15].
For the UTT-30 test, the following graphs were plotted:
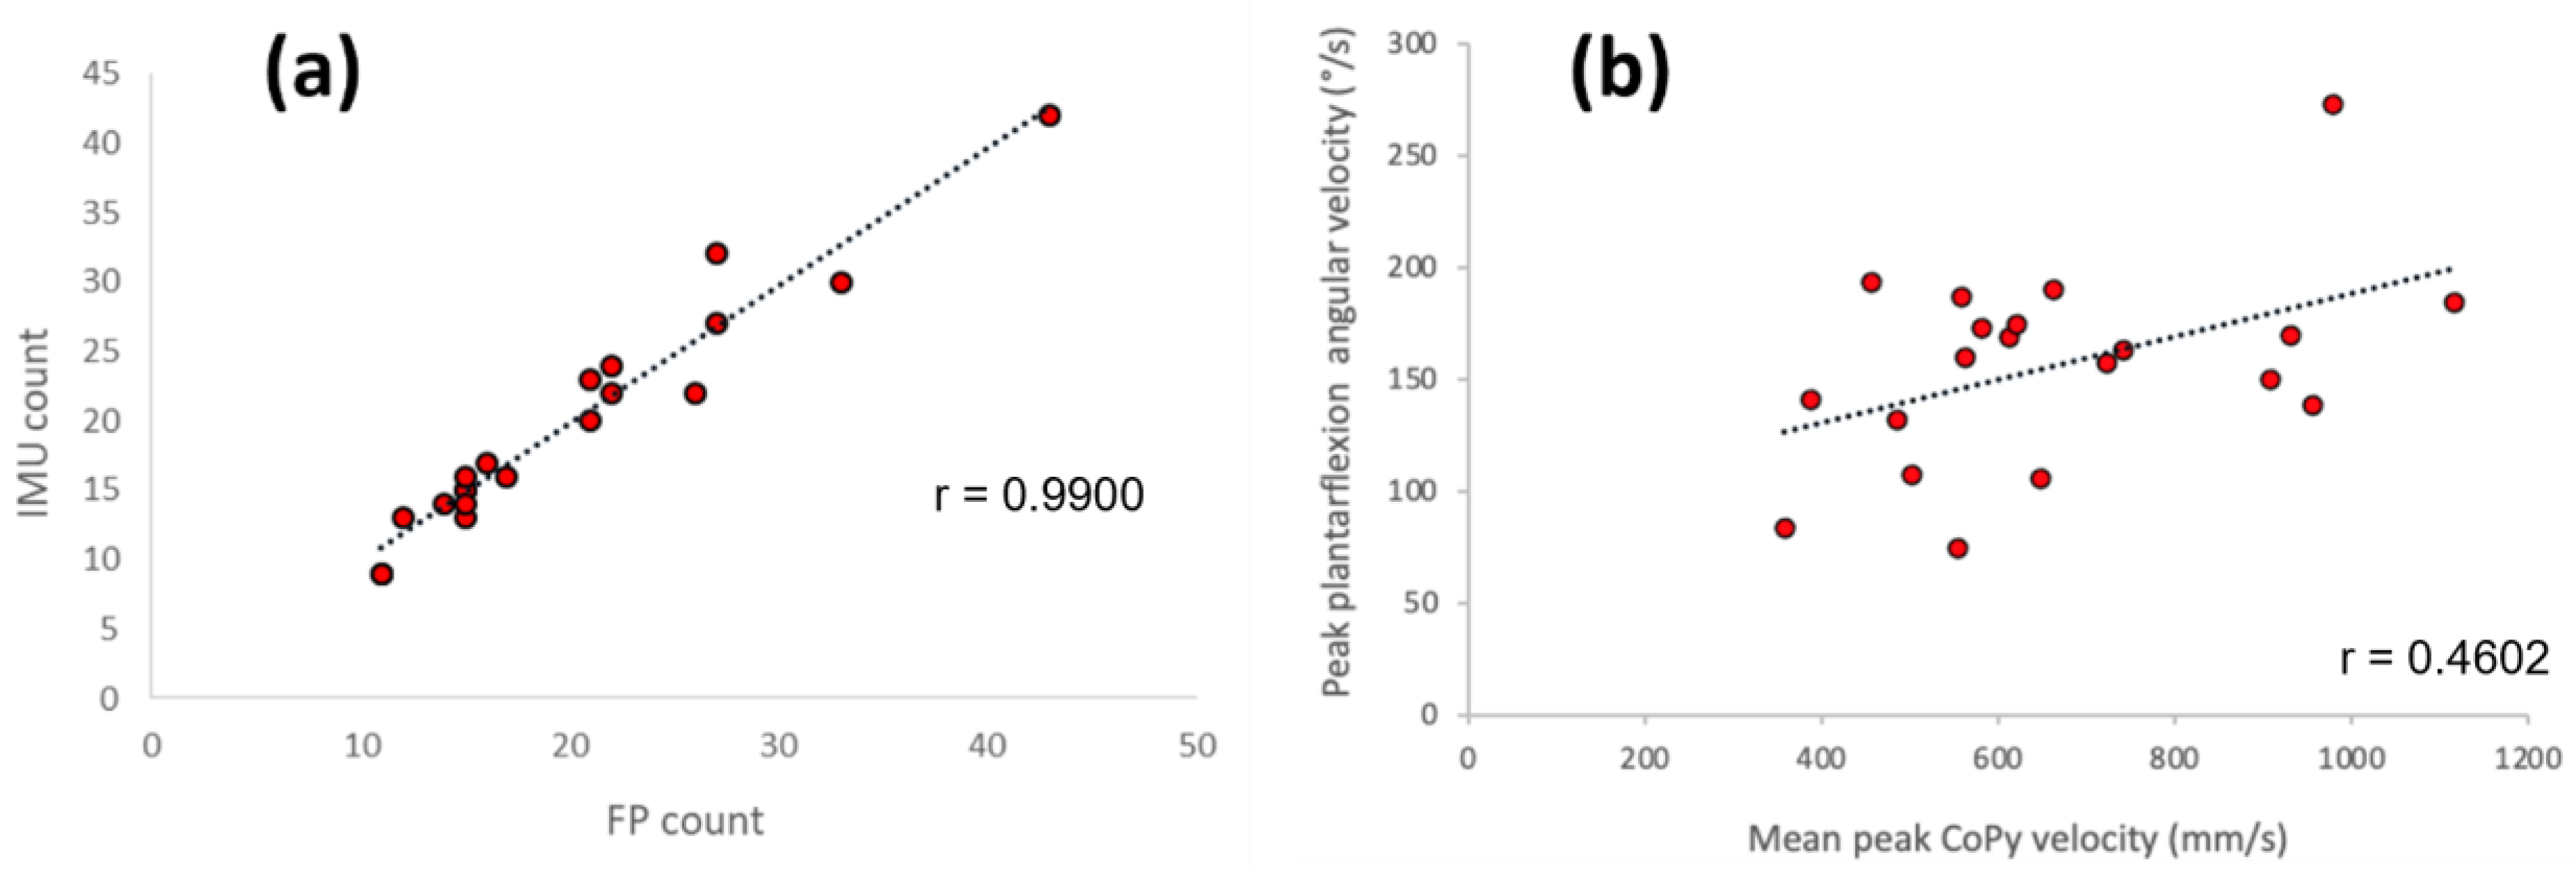
  • number of fully completed UTT movements determined by IMU against number determined by FP (Figure 4a).
  • the mean peak plantarflexion angular velocity against the mean peak CoPy velocity (Figure 4b).
For the UTT-stand, the following graphs were plotted:
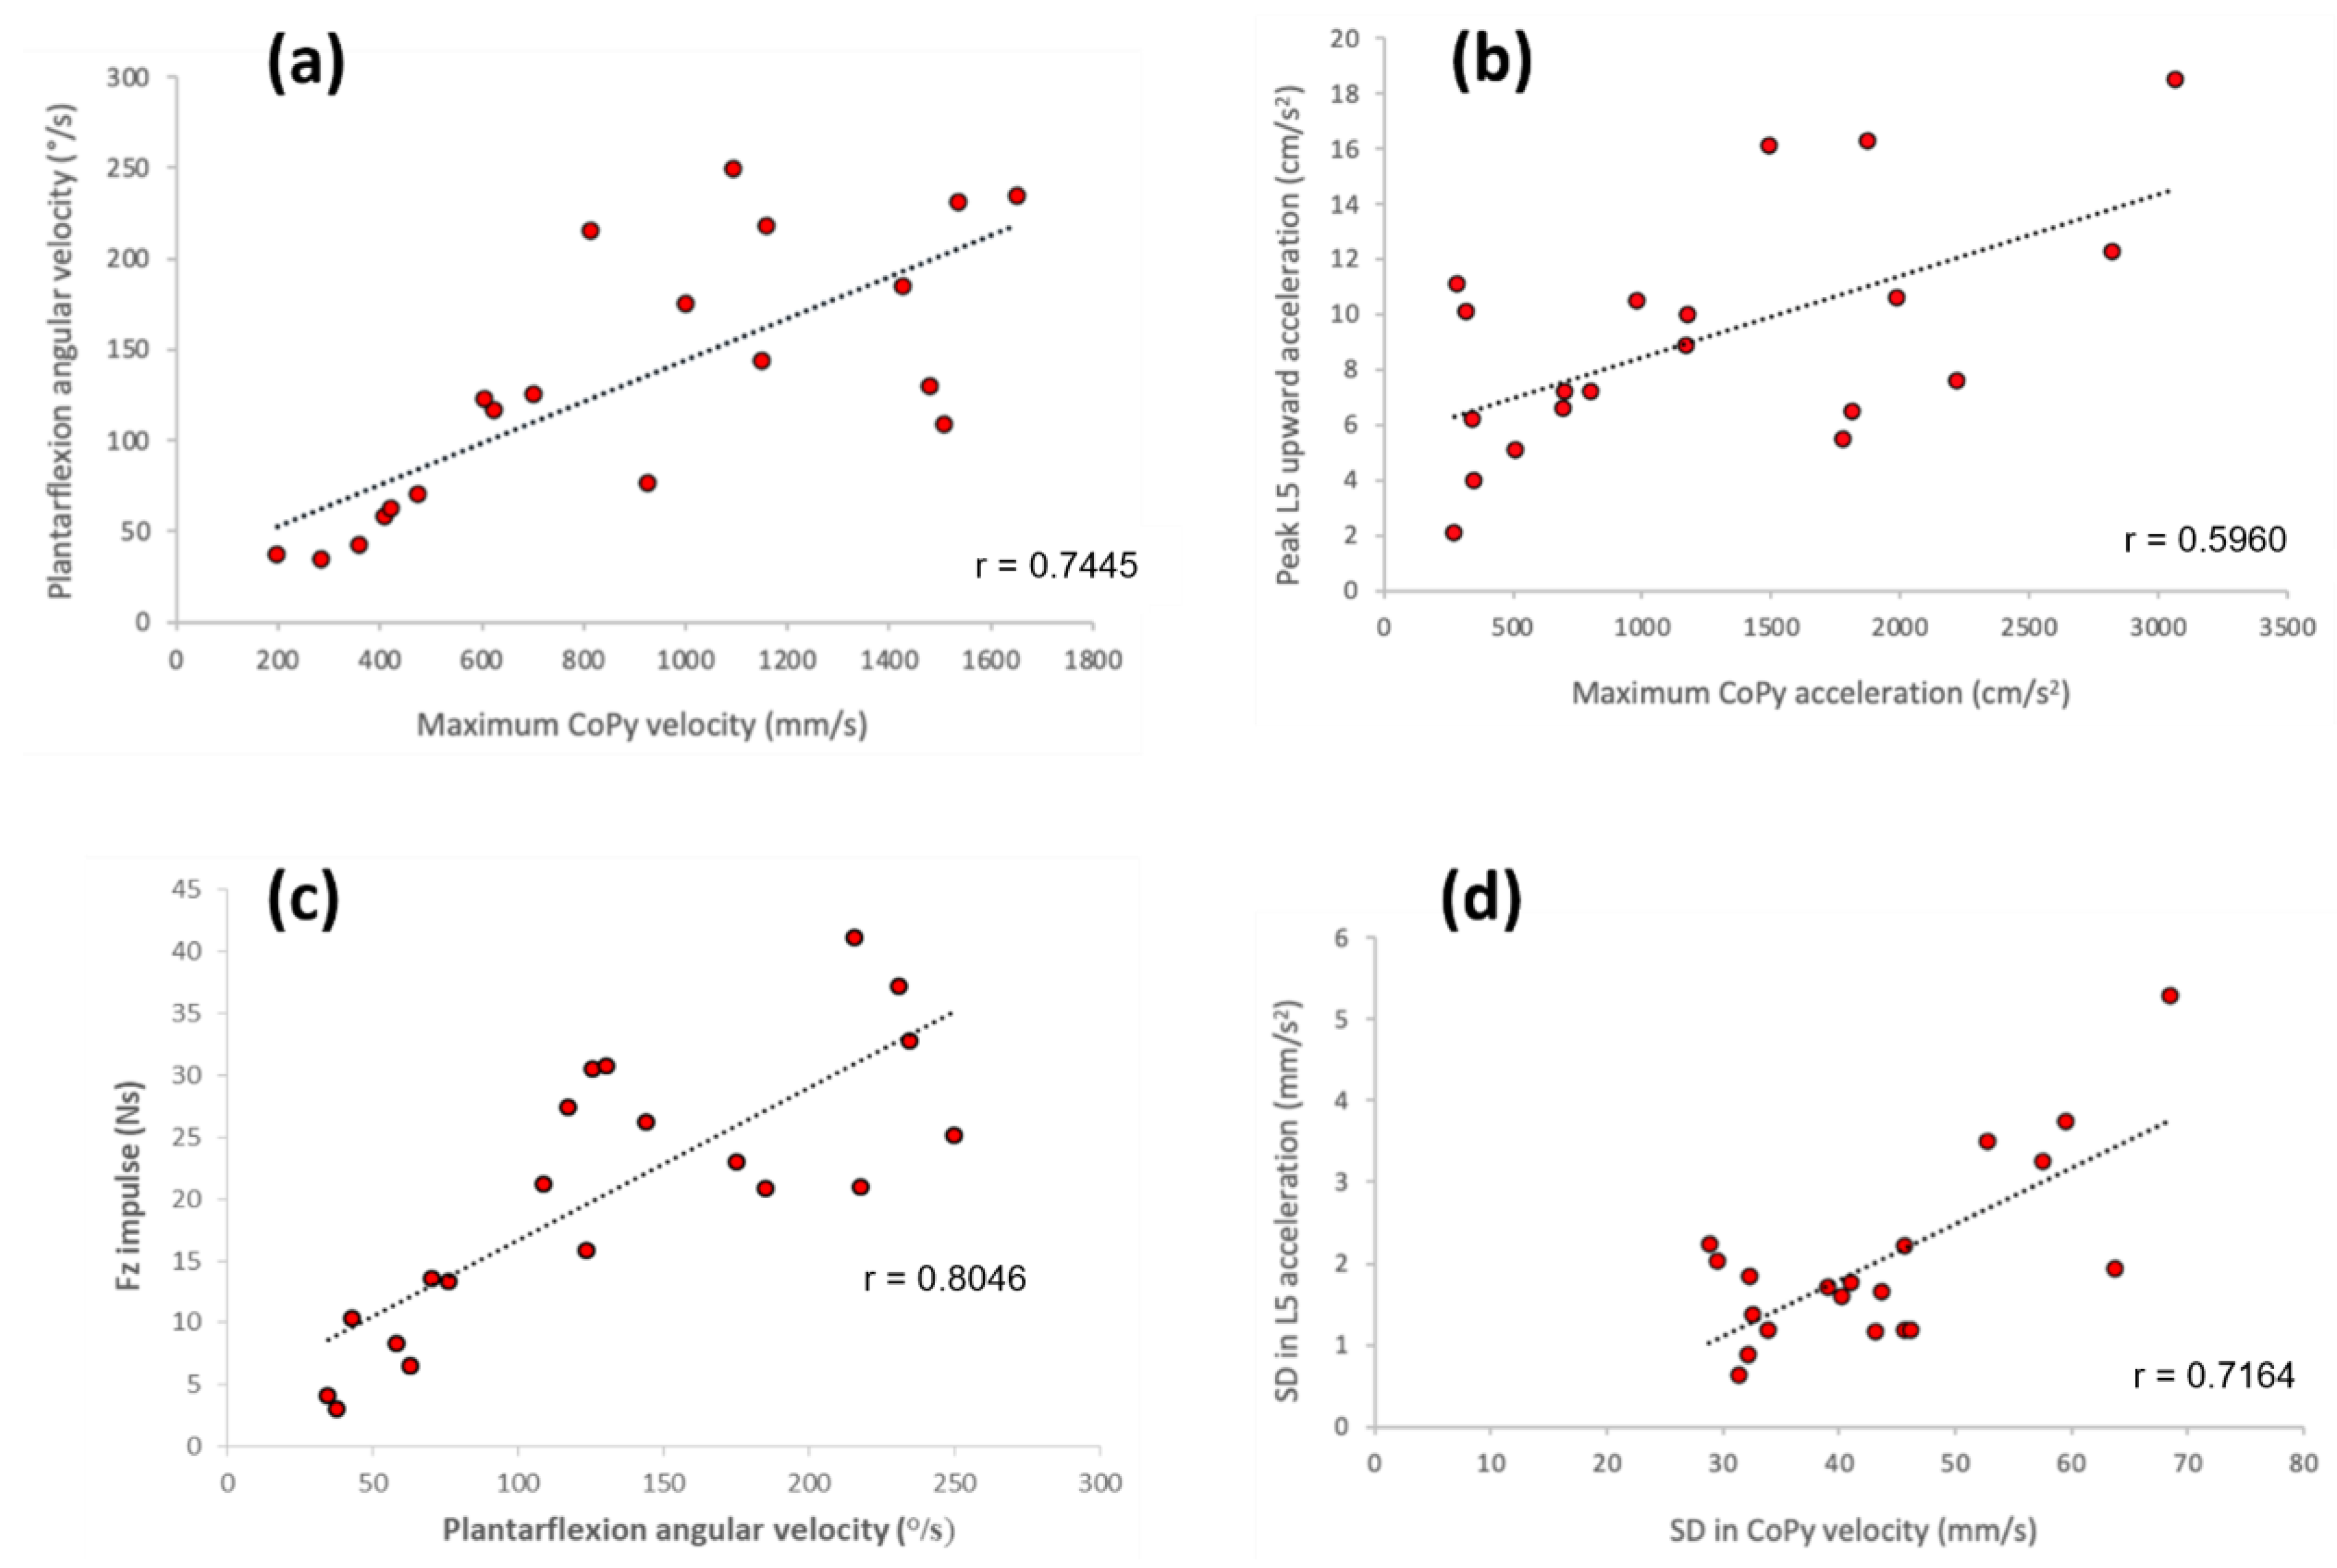
  • for the period when moving UTT: peak plantarflexion angular velocity against the maximum CoPy velocity (Figure 5a); the peak L5 upward acceleration against the maximum CoPy acceleration (Figure 5b); and the peak plantarflexion angular velocity against the vertical (Fz) impulse (Figure 5c).
  • for the period when holding the UTT position: the SD in L5 horizontal acceleration against the SD in CoPy velocity (Figure 5d).

3. Results

All 20 participants completed the UTT tests and showed no signs of excessive discomfort, fatigue, or pain during the assessments. Figure 3 shows an example of the raw (sample level) IMU and FP data.

3.1. UTT-30

3.1.1. Number of Movements

The group average number of movements (full or partial) detected by IMU (23.5) and FP (23.6), matched the number counted by an observer (23.6) (Table 1). After elimination of any detected movements not completed within 1 SD of each participant’s mean peak angular velocity (IMU) or mean peak CoPyVel (FP), the number of movements determined decreased to 19.7 (IMU) and 19.9 (FP), respectively (Table 1), indicating a strong correlation between assessment approaches (r = 0.99, Figure 4a). The mean difference between the IMU approach and the FP approach, in determining the number of UTT movements fully completed, was 0.25, with a 95% agreements limit of −3.7–4.2.

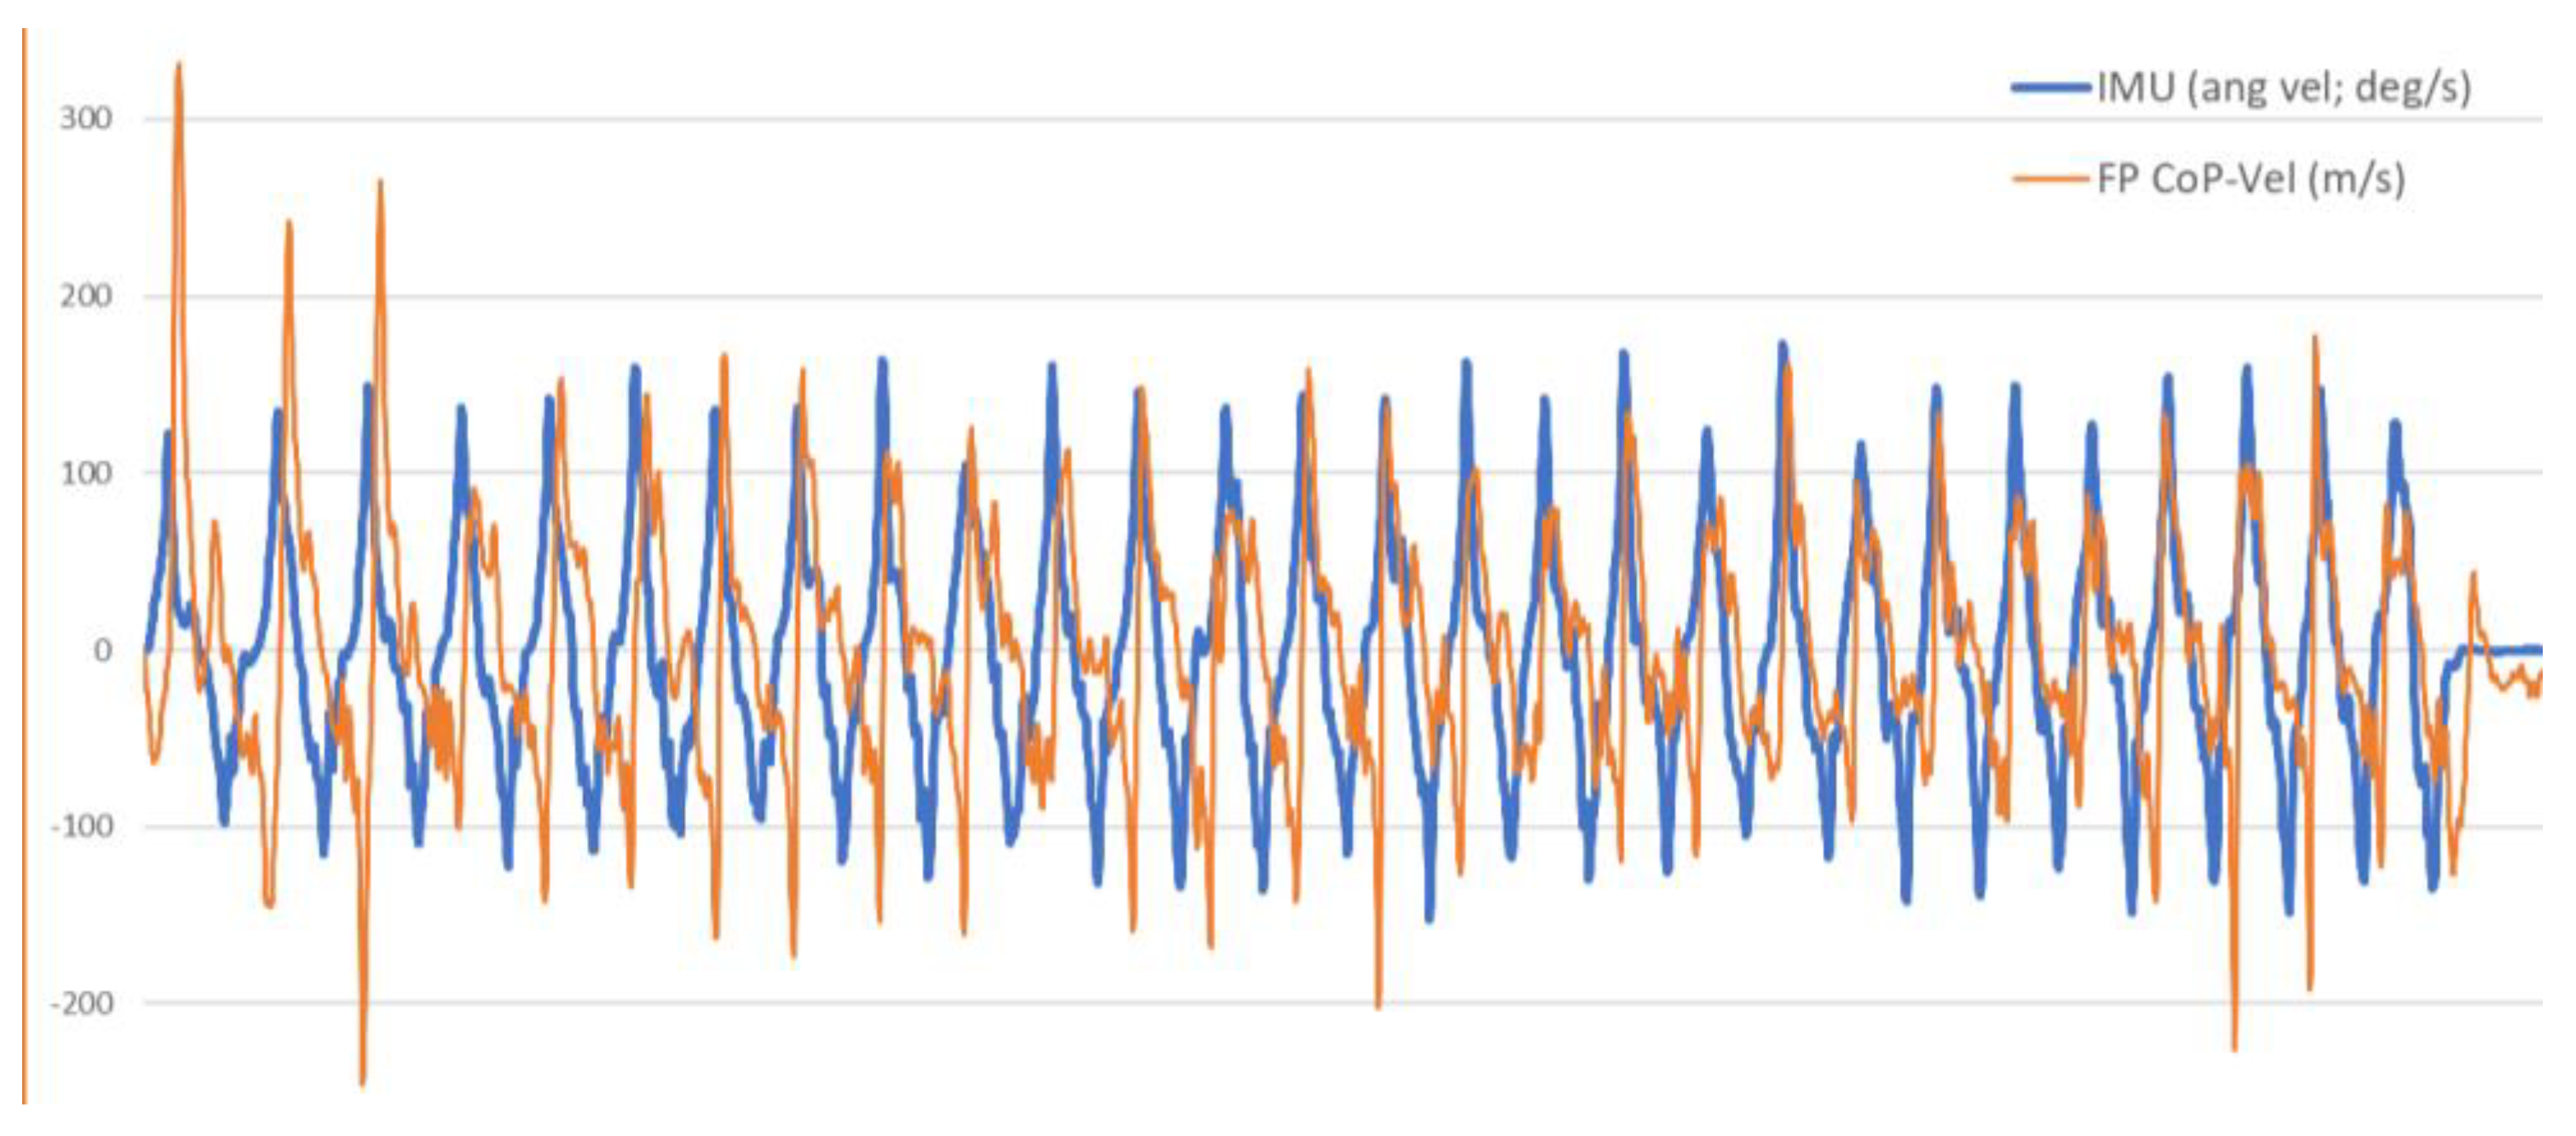
3.1.2. CoPy Velocity and Plantarflexion Angular Velocity

The strength of the relationship between participants’ mean peak CoPy velocity (FP) and their mean peak plantarflexion angular velocity (IMU), was moderate (r = 0.460, Figure 4b).

3.2. UTT-Stand

3.2.1. Period When Rising to the Toes

The strength of the relationship between participants’ plantarflexion angular velocity (IMU) and the maximum CoPy velocity (FP) or the Fz impulse (FP) was strong (r = 0.745 and r = 0.805 respectively, Figure 5a,c), whereas the strength of the relationship between peak L5 upward acceleration (IMU) and the maximum CoPy acceleration (FP) was moderate (r = 0.596, Figure 5b).

3.2.2. Period of Holding the UTT Position

The strength of the relationship between participants’ SD in L5 acceleration (IMU) and the SD in CoPy velocity (FP) was strong (r = 0.716, Figure 5d).

4. Discussion

The aims of the present study were to (i) determine if IMUs can provide valid assessment of the UTT-30 test, by evaluating whether IMU-derived assessment metrics are comparable to those gained from a force-platform, and (ii) to determine whether IMUs provide valid assessment of a single UTT movement when the participant is asked to hold the UTT position for 5 s (UTT-stand). For this (newly presented) UTT-stand test, we describe how IMUs could be used to assess the movement dynamics during the rise-UTT, as well as the postural control exhibited whilst holding the UTT position, and again evaluate whether IMU-derived assessment metrics are comparable to those gained from a FP. Our findings highlight that the IMU automated approach determined the same number of repeated UTT movements completed as that determined by an FP (UTT-30) and yielded movement and dynamic postural control measures that were comparable (i.e., had moderate-to-strong correlation) to those determined from using an FP (UTT-stand).
There is considerable recent work that has reported ways in which IMUs might be used for the assessment of standing postural stability and in the assessment of gait outcomes across a wide range of research disciplines [16,17,18,19,20,21,22,23]. In our sister study we demonstrated how IMUs might be used to assess the UTT-30 [11]. The current study extends upon this recent work by showing that IMU-derived assessment metrics are comparable to those gained from a force-platform, and thus highlights how IMUs might provide valid assessment of a UTT-30 test. It also extends this previous work by highlighting how IMUs can be used to assess a UTT-stand test. This newly presented test provides relevant additional insights of ankle strength and function that are adjunct to those provided by the UTT-30 test.

4.1. UTT-30

Results show that the IMUs detected the same number of UTT attempted movements as that determined by the FP (and counted by an observer). Furthermore, the IMUs and FP both provided an objective means to discount any UTT movements that were deemed to have not been completed ‘fully’. UTT movements that were not completed ‘fully’ were those that yielded a peak velocity value during the period of rising to up-on-the-toes that was less than 1 SD below each participant’s mean peak velocity (either plantarflexion velocity, IMU, or CoP AP-velocity, FP) of rising to up-on-the-toes for all their attempted repeated UTT movements. Identifying UTT movements that might not be completed properly (‘fully’) would be difficult to do by ‘the naked eye’, because an observer would only be able to count how many UTT movements were attempted. Both the IMUs and FP assessment approaches indicated that the average number of UTT movements completed ‘fully’ was 19.7–19.9 (±8; indicating a strong correlation between assessment approaches, r = 0.99), and this was, on average, 3.8 fewer than the number of UTT attempted movements.
As identifying a peak in CoPyVel to identify each UTT movement attempted provides indication of UTT speed but not its ROM, we highlighted in our previous study [11] that instead of trying to identify (and discount) UTT movements that are not completed over a sufficiently ‘full’ range, perhaps a better approach would be to determine UTT consistency. Consistency could be evaluated simply by determining how many UTT movements, in percentage terms, had a peak CoPyVel that was within a certain threshold of the mean peak CoPyVel [11]. We suggested that the threshold could be within 1 SD, 1.5 SD or 2 SD of the mean. UTT consistency may have more clinical relevance than determining the number of UTT movements ‘fully’ completed, though future work is needed to confirm this.
Each participant’s mean peak plantarflexion velocity, derived from the IMUs, for the ‘fully’ completed repeated UTT movements reflect how quickly, on average, an individual was rising up to their toes during the 30 s test period. The association between mean peak plantarflexion velocity and the mean peak CoPyVel was determined via regression analysis, which showed the strength of the relationship between the two outcome measures (r = 0.46). Having only a moderate strength relationship is likely due to the IMU signal representing local changes at the ankle as opposed to the FP signal representing the speed of movement of the whole-body CoM.

4.2. UTT-Stand

Our assessment focused on determining the velocity an individual rises up to their toes, and the postural stability of holding the UTT position. The results show the strength of the relationships between IMU-derived and FP-derived measures were moderate-to-strong for speed of rising onto the toes, and for the postural stability exhibited whilst holding the UTT position (Figure 5d). The UTT-stand test assesses a person’s ability to rise onto the toes and then to maintain postural stability when holding the UTT position. As such, it provides a complementary assessment of ankle function to the UTT-30 test. As this is a newly presented test, future work is needed to determine if and how outcomes from the UTT-stand test are related to traditional measures of ankle strength and function.

4.3. Limitations and Recommendations for Future Work

When analysing the L5 IMU UTT-stand data of two participants, our algorithm performed poorly in detecting any prominent acceleration peaks depicting when the participants started rising up on to their toes. Although there were acceleration peaks present, the amplitudes were much lower than expected (by the algorithm), which may have been due to these two participants performing the UTT movement much slower than the other participants. As the participants in the current study were all healthy, the two participants that performed the UTT movement much slower may have misunderstood instructions. This highlights further that work is needed to determine how the segmentation/analysis algorithm (used to analysis IMU data) could be automatically tailored when used, for example, in elderly, frail individuals who will likely perform UTT movements at a slower speed and with more variability.
Previous work has shown that ankle strength and function is related to falls risk [24,25,26]. Thus, further work should also determine if the measures from the UTT-30 and the UTT-stand are related to a person’s physical functioning (e.g., strength/endurance of ankle musculature) and/or a person’s falls history/ fall risk.
Although use of FP might be considered a gold standard method for measuring postural control during standing, reaching and rising to the toes, IMUs are versatile in assessing aspects of postural control due to their ability to be placed almost anywhere on the body. For instance, to investigate stability during balance tasks, an IMU can be placed on the trunk or hip to capture acceleration data. However, as the AX6s used in the current study contain integrated gyroscopes for angular velocity measurement, further measures such as angular displacement of the IMUs, i.e., segment-tilt angle, can also be derived. Hence, using these devices can provide complementary data/insights to those gained from the FP, in so far as acceleration of specific reference points and/or angular velocity of specific segments can be measured directly. Indeed, such direct measures can be undertaken beyond the lab in measuring physical functioning/activity in clinical tests or in free-living situations.

5. Conclusions

For both the UTT-30 and UTT-stand tests, IMU derived outcome metrics were comparable to FP derived metrics. This suggests that IMUs can provide a valid means to assess the UTT-30 and UTT-stand tests. Future work is needed to determine the most appropriate approach to assess UTT-30 performance using IMU-derived outcomes, and whether outcomes of the newly presented UTT-stand are associated with clinical outcomes.

Author Contributions

Conceptualization, S.A.Z., Y.C., A.G. and J.G.B.; methodology, Y.C.; software, Y.C.; validation, S.A.Z., Y.C., and J.G.B.; formal analysis, S.A.Z., Y.C., A.G. and J.G.B.; investigation, S.A.Z., Y.C., A.G. and J.G.B.; resources, S.A.Z., Y.C. and J.G.B.; data curation, S.A.Z.; writing—original draft preparation, S.A.Z.; writing—review and editing, S.A.Z., Y.C., A.G. and J.G.B.; visualization, Y.C. and J.G.B.; supervision, A.G. and J.G.B.; project administration, J.G.B. All authors have read and agreed to the published version of the manuscript.

Funding

This research received no external funding.

Institutional Review Board Statement

The study was conducted in accordance with the Declaration of Helsinki and Ethical approval was granted from University of Bradford’s Committee for Ethics in Research: approval reference E.119.

Informed Consent Statement

Informed consent was obtained from all subjects involved in the study.

Data Availability Statement

Data will be made available upon reasonable request to the corresponding author.

Acknowledgments

The authors would like to thank all those who volunteered for this study. Yunus Celik receives PhD studentship support from the Turkish Ministry of National Education.

Conflicts of Interest

The authors declare no conflict of interest.

References

  1. Pol, F.; Baharlouei, H.; Taheri, A.; Menz, H.B.; Forghany, S. Foot and ankle biomechanics during walking in older adults: A systematic review and meta-analysis of observational studies. Gait Posture 2021, 1, 14–24. [Google Scholar] [CrossRef] [PubMed]
  2. Spink, M.J.; Fotoohabadi, M.R.; Wee, E.; Hill, K.D.; Lord, S.R.; Menz, H.B. Foot and ankle strength, range of motion, posture, and deformity are associated with balance and functional ability in older adults. Arch. Phys. Med. Rehabil. 2011, 1, 68–75. [Google Scholar] [CrossRef]
  3. Menz, H.B.; Morris, M.E.; Lord, S.R. Foot and Ankle Characteristics Associated with Impaired Balance and Functional Ability in Older People. J. Gerontol. Ser. A 2005, 60, 1546–1552. [Google Scholar] [CrossRef]
  4. Buckley, J.G.; Cooper, G.; Maganaris, C.N.; Reeves, N.D. Is stair descent in the elderly associated with periods of high centre of mass downward accelerations? Exp. Gerontol. 2013, 48, 283–289. [Google Scholar] [CrossRef] [PubMed]
  5. Riener, R.; Rabuffetti, M.; Frigo, C. Stair ascent and descent at different inclinations. Gait Posture 2002, 15, 32–44. [Google Scholar] [CrossRef]
  6. André, H.I.; Carnide, F.; Borja, E.; Ramalho, F.; Santos-Rocha, R.; Veloso, A.P. Calf-raise senior: A new test for assessment of plantar flexor muscle strength in older adults: Protocol, validity, and reliability. Clin. Interv. Aging 2016, 11, 1661–1674. [Google Scholar] [CrossRef] [Green Version]
  7. Hébert-Losier, K.; Newsham-West, R.J.; Schneiders, A.G.; Sullivan, S.J. Raising the standards of the calf-raise test: A systematic review. J. Sci. Med. Sport 2009, 12, 594–602. [Google Scholar] [CrossRef] [Green Version]
  8. Jan, M.-H.; Chai, H.M.; Lin, Y.F.; Lin, J.C.; Tsai, L.Y.; Ou, Y.C.; Lin, D.H. Effects of age and sex on the results of an ankle plantar-flexor manual muscle test. Phys. Ther. 2005, 85, 1078–1084. [Google Scholar] [CrossRef] [Green Version]
  9. Lunsford, B.R.; Perry, J. The standing heel-rise test for ankle plantar flexion: Criterion for normal. Phys. Ther. 1995, 75, 694–698. [Google Scholar] [CrossRef] [PubMed]
  10. Sman, A.D.; Hiller, C.E.; Imer, A.; Ocsing, A.; Burns, J.; Refshauge, K.M. Design and reliability of a novel heel rise test measuring device for plantarflexion endurance. BioMed Res. Int. 2014, 2014, 391646. [Google Scholar] [CrossRef]
  11. Zahid, S.A.; Celik, Y.; Godfrey, A.; Buckley, J.G. Use of ‘wearables’ to assess the Up-on-the-toes test. J. Biomech. 2022, 143, 111272. [Google Scholar] [CrossRef]
  12. American College of Sports Medicine. ACSM’s Guidelines for Exercise Testing and Prescription; Lippincott Williams & Wilkins: Philadelphia, PA, USA, 2013. [Google Scholar]
  13. Ladha, C.; Jackson, D.; Ladha, K.; Nappey, T.; Olivier, P. Shaker table validation of OpenMovement AX3 accelerometer. In Proceedings of the Ahmerst (ICAMPAM 2013 AMHERST): 3rd International Conference on Ambulatory Monitoring of Physical Activity and Movement, Amherst, MA, USA, 17–19 June 2013. [Google Scholar]
  14. Github DigitalInteraction. AX3 GUI. Available online: https://github.com/digitalinteraction/openmovement/wiki/AX3-GUI (accessed on 2 December 2019).
  15. Taylor, R. Interpretation of the Correlation Coefficient: A Basic Review. J. Diagn. Med. Sonogr. 1990, 6, 35–39. [Google Scholar] [CrossRef]
  16. O’Brien, M.K.; Hidalgo-Araya, M.D.; Mummidisetty, C.K.; Vallery, H.; Ghaffari, R.; Rogers, J.A.; Lieber, R.; Jayaraman, A. Augmenting clinical outcome measures of gait and balance with a single inertial sensor in age-ranged healthy adults. Sensors 2019, 19, 4537. [Google Scholar] [CrossRef] [PubMed] [Green Version]
  17. Hasegawa, N.; Maas, K.C.; Shah, V.V.; Carlson-Kuhta, P.; Nutt, J.G.; Horak, F.B.; Asaka, T.; Mancini, M. Functional limits of stability and standing balance in people with Parkinson’s disease with and without freezing of gait using wearable sensors. Gait Posture 2021, 87, 123–129. [Google Scholar] [CrossRef] [PubMed]
  18. Kang, G.E.; Stout, A.; Waldon, K.; Kang, S.; Killeen, A.L.; Crisologo, P.A.; Siah, M.; Jupiter, D.; Najafi, B.; Vaziri, A.; et al. Digital Biomarkers of Gait and Balance in Diabetic Foot, Measurable by Wearable Inertial Measurement Units: A Mini Review. Sensors 2022, 22, 9278. [Google Scholar] [CrossRef] [PubMed]
  19. Noamani, A.; Nazarahari, M.; Lewicke, J.; Vette, A.H.; Rouhani, H. Validity of using wearable inertial sensors for assessing the dynamics of standing balance. Med. Eng. Phys. 2020, 77, 53–59. [Google Scholar] [CrossRef]
  20. Song, S.; Nordin, A.D. Balance Perturbations in Simulated Low-Gravity Modulate Human Premotor and Frontoparietal Electrocortical Theta, Alpha, and Beta Band Spectral Power. IEEE Open J. Eng. Med. Biol. 2023, 1–9. [Google Scholar] [CrossRef]
  21. Young, F.; Coulby, G.; Watson, I.; Downs, C.; Stuart, S.; Godfrey, A. Just Find It: The Mymo Approach to Recommend Running Shoes. IEEE Access 2020, 8, 109791–109800. [Google Scholar] [CrossRef]
  22. Celik, Y.; Powell, D.; Woo, W.L.; Stuart, S.; Godfrey, A. A feasibility study towards instrumentation of the Sport Concussion Assessment Tool (iSCAT). In Proceedings of the 2020 42nd Annual International Conference of the IEEE Engineering in Medicine & Biology Society (EMBC), Montreal, QC, Canada, 20–24 July 2020. [Google Scholar]
  23. Furtado, S.; Godfrey, A.; Del Din, S.; Rochester, L.; Gerrand, C. Are Accelerometer-based Functional Outcome Assessments Feasible and Valid After Treatment for Lower Extremity Sarcomas? Clin. Orthop. Relat. Res. 2020, 478, 482–503. [Google Scholar] [CrossRef]
  24. Cattagni, T.; Scaglioni, G.; Laroche, D.; Grémeaux, V.; Martin, A. The involvement of ankle muscles in maintaining balance in the upright posture is higher in elderly fallers. Exp. Gerontol. 2016, 1, 38–45. [Google Scholar] [CrossRef]
  25. Menz, H.B.; Morris, M.E.; Lord, S.R. Foot and Ankle Risk Factors for Falls in Older People: A Prospective Study. J. Gerontol. Ser. A 2006, 61, 866–870. [Google Scholar] [CrossRef] [PubMed] [Green Version]
  26. Cattagni, T.; Scaglioni, G.; Laroche, D.; Van Hoecke, J.; Gremeaux, V.; Martin, A. Ankle muscle strength discriminates fallers from non-fallers. Front. Aging Neurosci. 2014, 6, 336. [Google Scholar] [CrossRef] [PubMed] [Green Version]
Figure 1. (a) Exemplar centre of pressure anteroposterior velocity (CoPyVel) trajectory showing identification of local maxima (circled in red) for each repeated up-on-the-toes (UTT) movement during the UTT-30 s test with peaks falling below 1 SD of the mean (circled in blue). (b) Exemplar CoPyVel trajectory from UTT-stand test, (i) indicates the local maximum in CoPyVel when rising UTT, (j) indicates the beginning of ‘holding’ the UTT position, and (k) indicates the end of ‘holding’ the UTT position. NB, the local minimum in CoPyVel prior to the local maximum indicates the anticipatory postural adjustment (APA) made when initiating the UTT movement.
Biomechanics 03 00024 g001
Figure 2. Automatic segmentation of up-on-the-toes 30 s test (UTT-30, blue arrows) and UTT-stand test (UTT-stand, red arrows) from right foot (RF) and left foot (LF) inertial measurement units (IMUs). (a) Flow chart of the segmentation algorithm; (b) raw angular velocity signal with specified peaks and tests; (c) processed angular velocity signal; (d) signal after mathematical operations; (e) extracted UTT-30; and (f) extracted UTT-stand.
Biomechanics 03 00024 g002
Figure 3. Example of raw (example level) inertial measurement unit (IMU, angular velocity, blue line) and force-platform (FP) centre of pressure (CoP, orange line) velocity (m/s) signals from an up-on-the-toes 30 s test (UTT-30).
Biomechanics 03 00024 g003
Figure 4. (a) The number of up-on-the-toes (UTT) movements each participant completed fully during the UTT-30 test determined using inertial measurement units (IMUs) plotted against a number determined using forceplatform (FP). (b) Each participant’s mean peak plantarflexion angular velocity (from IMU) plotted against their mean peak centre of pressure anteroposterior (CoPy) velocity values (from FP) for the UTT-30 test. ‘r’ is Pearson correlation coefficient. Dotted line in each plot indicates the linear regression line.
Biomechanics 03 00024 g004
Figure 5. Outcomes for the up-on-the-toes (UTT) stand test: inertial measurement unit (IMU)-derived measures plotted against forceplatform (FP)-derived measures for the period when moving onto the toes. (a) Peak plantarflexion angular velocity (from IMU) plotted against peak centre of pressure anteroposterior (CoPy) velocity (from FP); (b) peak 5th lumbar vertebrae (L5) upward acceleration (from IMU) plotted against peak CoPy acceleration (from FP); (c) peak plantarflexion angular velocity (from IMU) plotted against the vertical ground reaction force (Fz) impulse (from FP) and the period when holding the UTT position; and (d) standard deviation (SD) in L5 acceleration (IMU) plotted against SD in CoPy velocity (FP). ‘r’ is Pearson correlation coefficient. Dotted line in each plot indicates the linear regression line.
Biomechanics 03 00024 g005
Table 1. The number of up-on-the-toes (UTT) movements completed by each participant as determined by an observer, and by analysis of the force-platform (FP) or inertial measurement units (IMUs) data and each participant’s mean peak centre of pressure anteroposterior (CoPy) velocity and mean plantarflexion (p-f) angular velocity (for fully completed UTT movements).
ParticipantNo. UTT Counted by ObserverNo of UTT Movements DetectedNo of UTT Movements DetectedNo. UTT Fully CompletedNo. UTT Fully CompletedMean Peak CoPyVel (mm/s)Mean Peak p-f Angular Velocity (°/sec)
FPIMUFPIMUFPIMU
12929292224613.0169.1
23636363330957.1138.4
3121212119932.0169.7
42424242222563.4159.9
53636362732980.6272.7
63131312727456.0193.4
71919191617663.2189.7
82828282622559.7186.8
92121211716741.6163.1
102323232120388.2140.5
1126262621231116.6183.9
121818181515581.7172.4
131717171414647.3105.5
14121212119358.583.1
151818181515485.6131.5
161515151213503.0106.9
171818181516724.0157.1
181717161513555.474.3
191919191514908.5149.9
205252524342621.9174.7
Mean ± SD23.6 ± 9.723.6 ± 9.723.5 ± 9.819.9 ± 8.119.7 ± 8.3
Disclaimer/Publisher’s Note: The statements, opinions and data contained in all publications are solely those of the individual author(s) and contributor(s) and not of MDPI and/or the editor(s). MDPI and/or the editor(s) disclaim responsibility for any injury to people or property resulting from any ideas, methods, instructions or products referred to in the content.

