
Agro-Waste Bean Fibers as Reinforce Materials for Polycaprolactone Composites

 , , ,
, , ,
Abstract
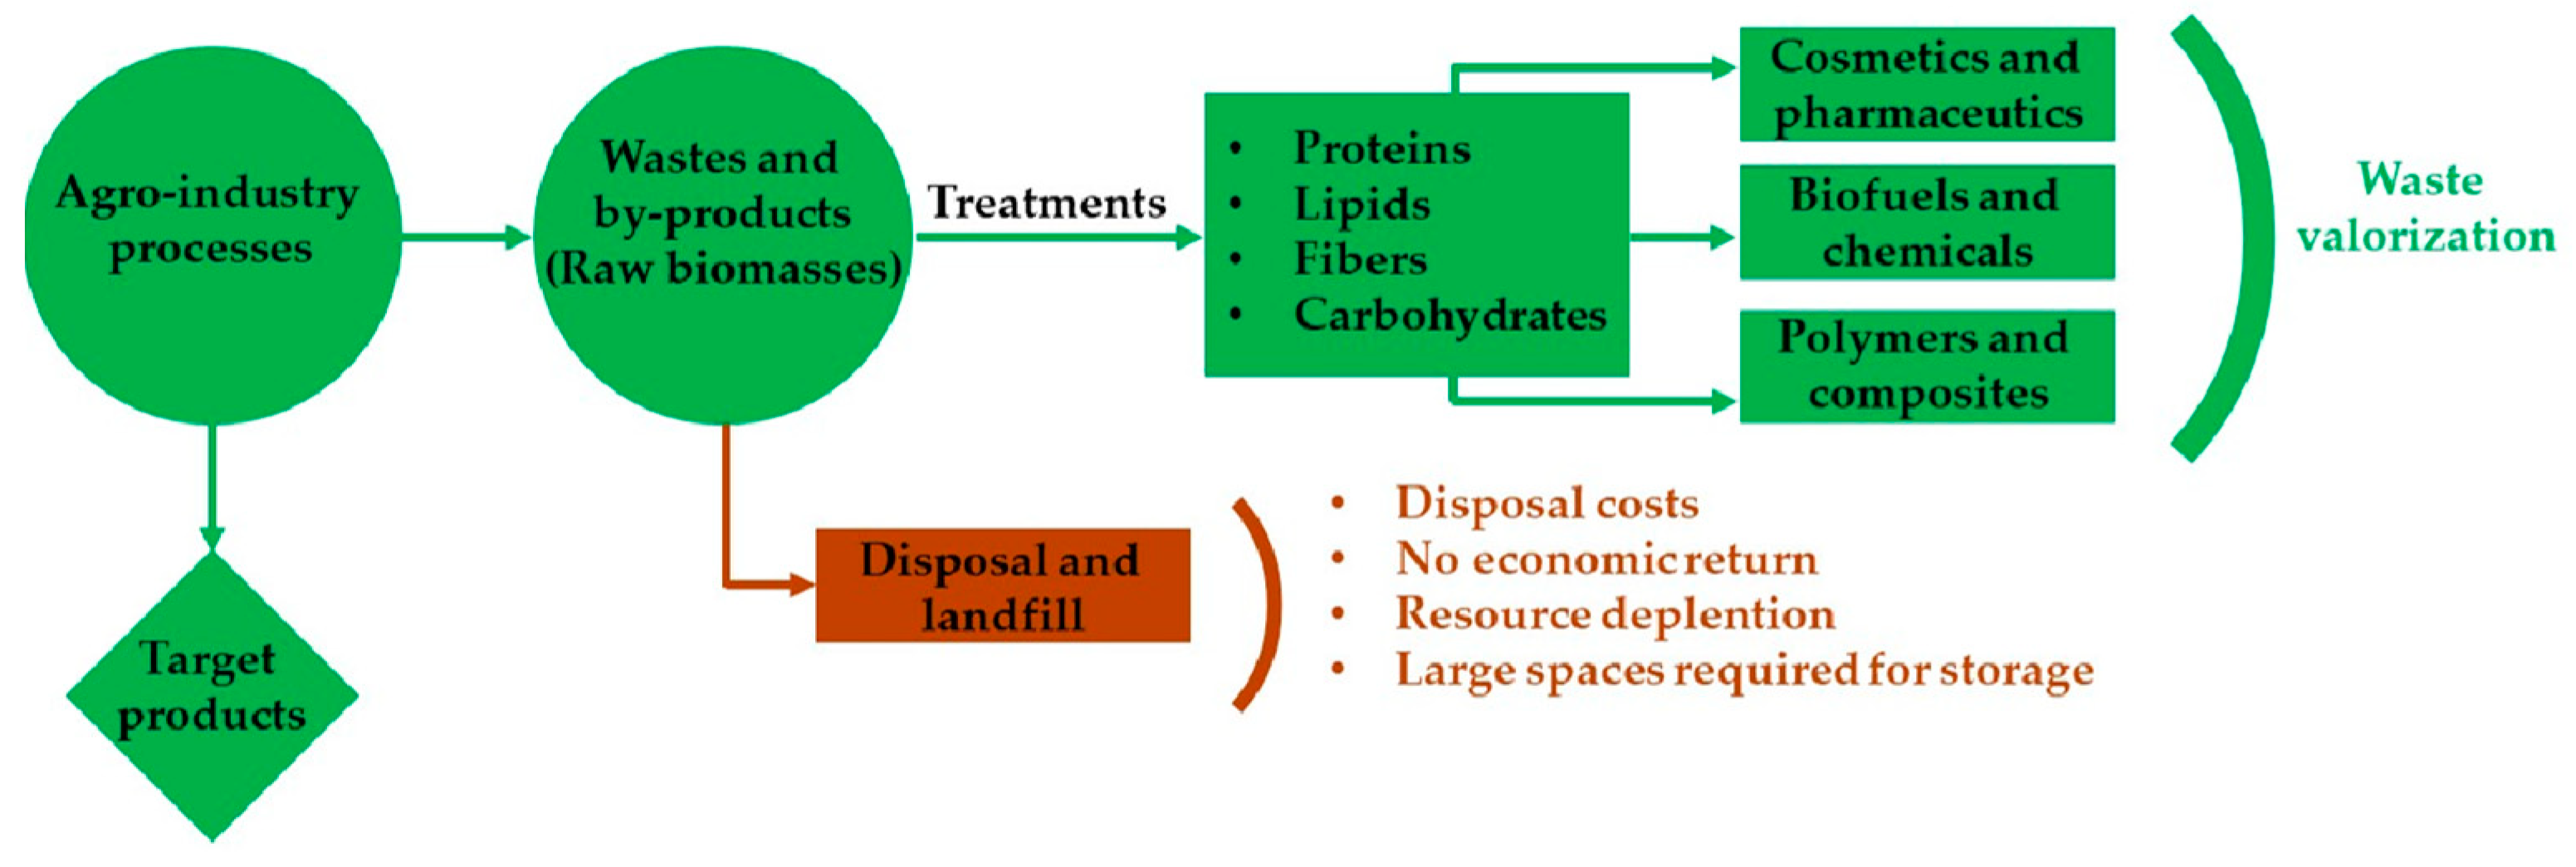
:1. Introduction
2. Materials and Methods
2.1. Materials
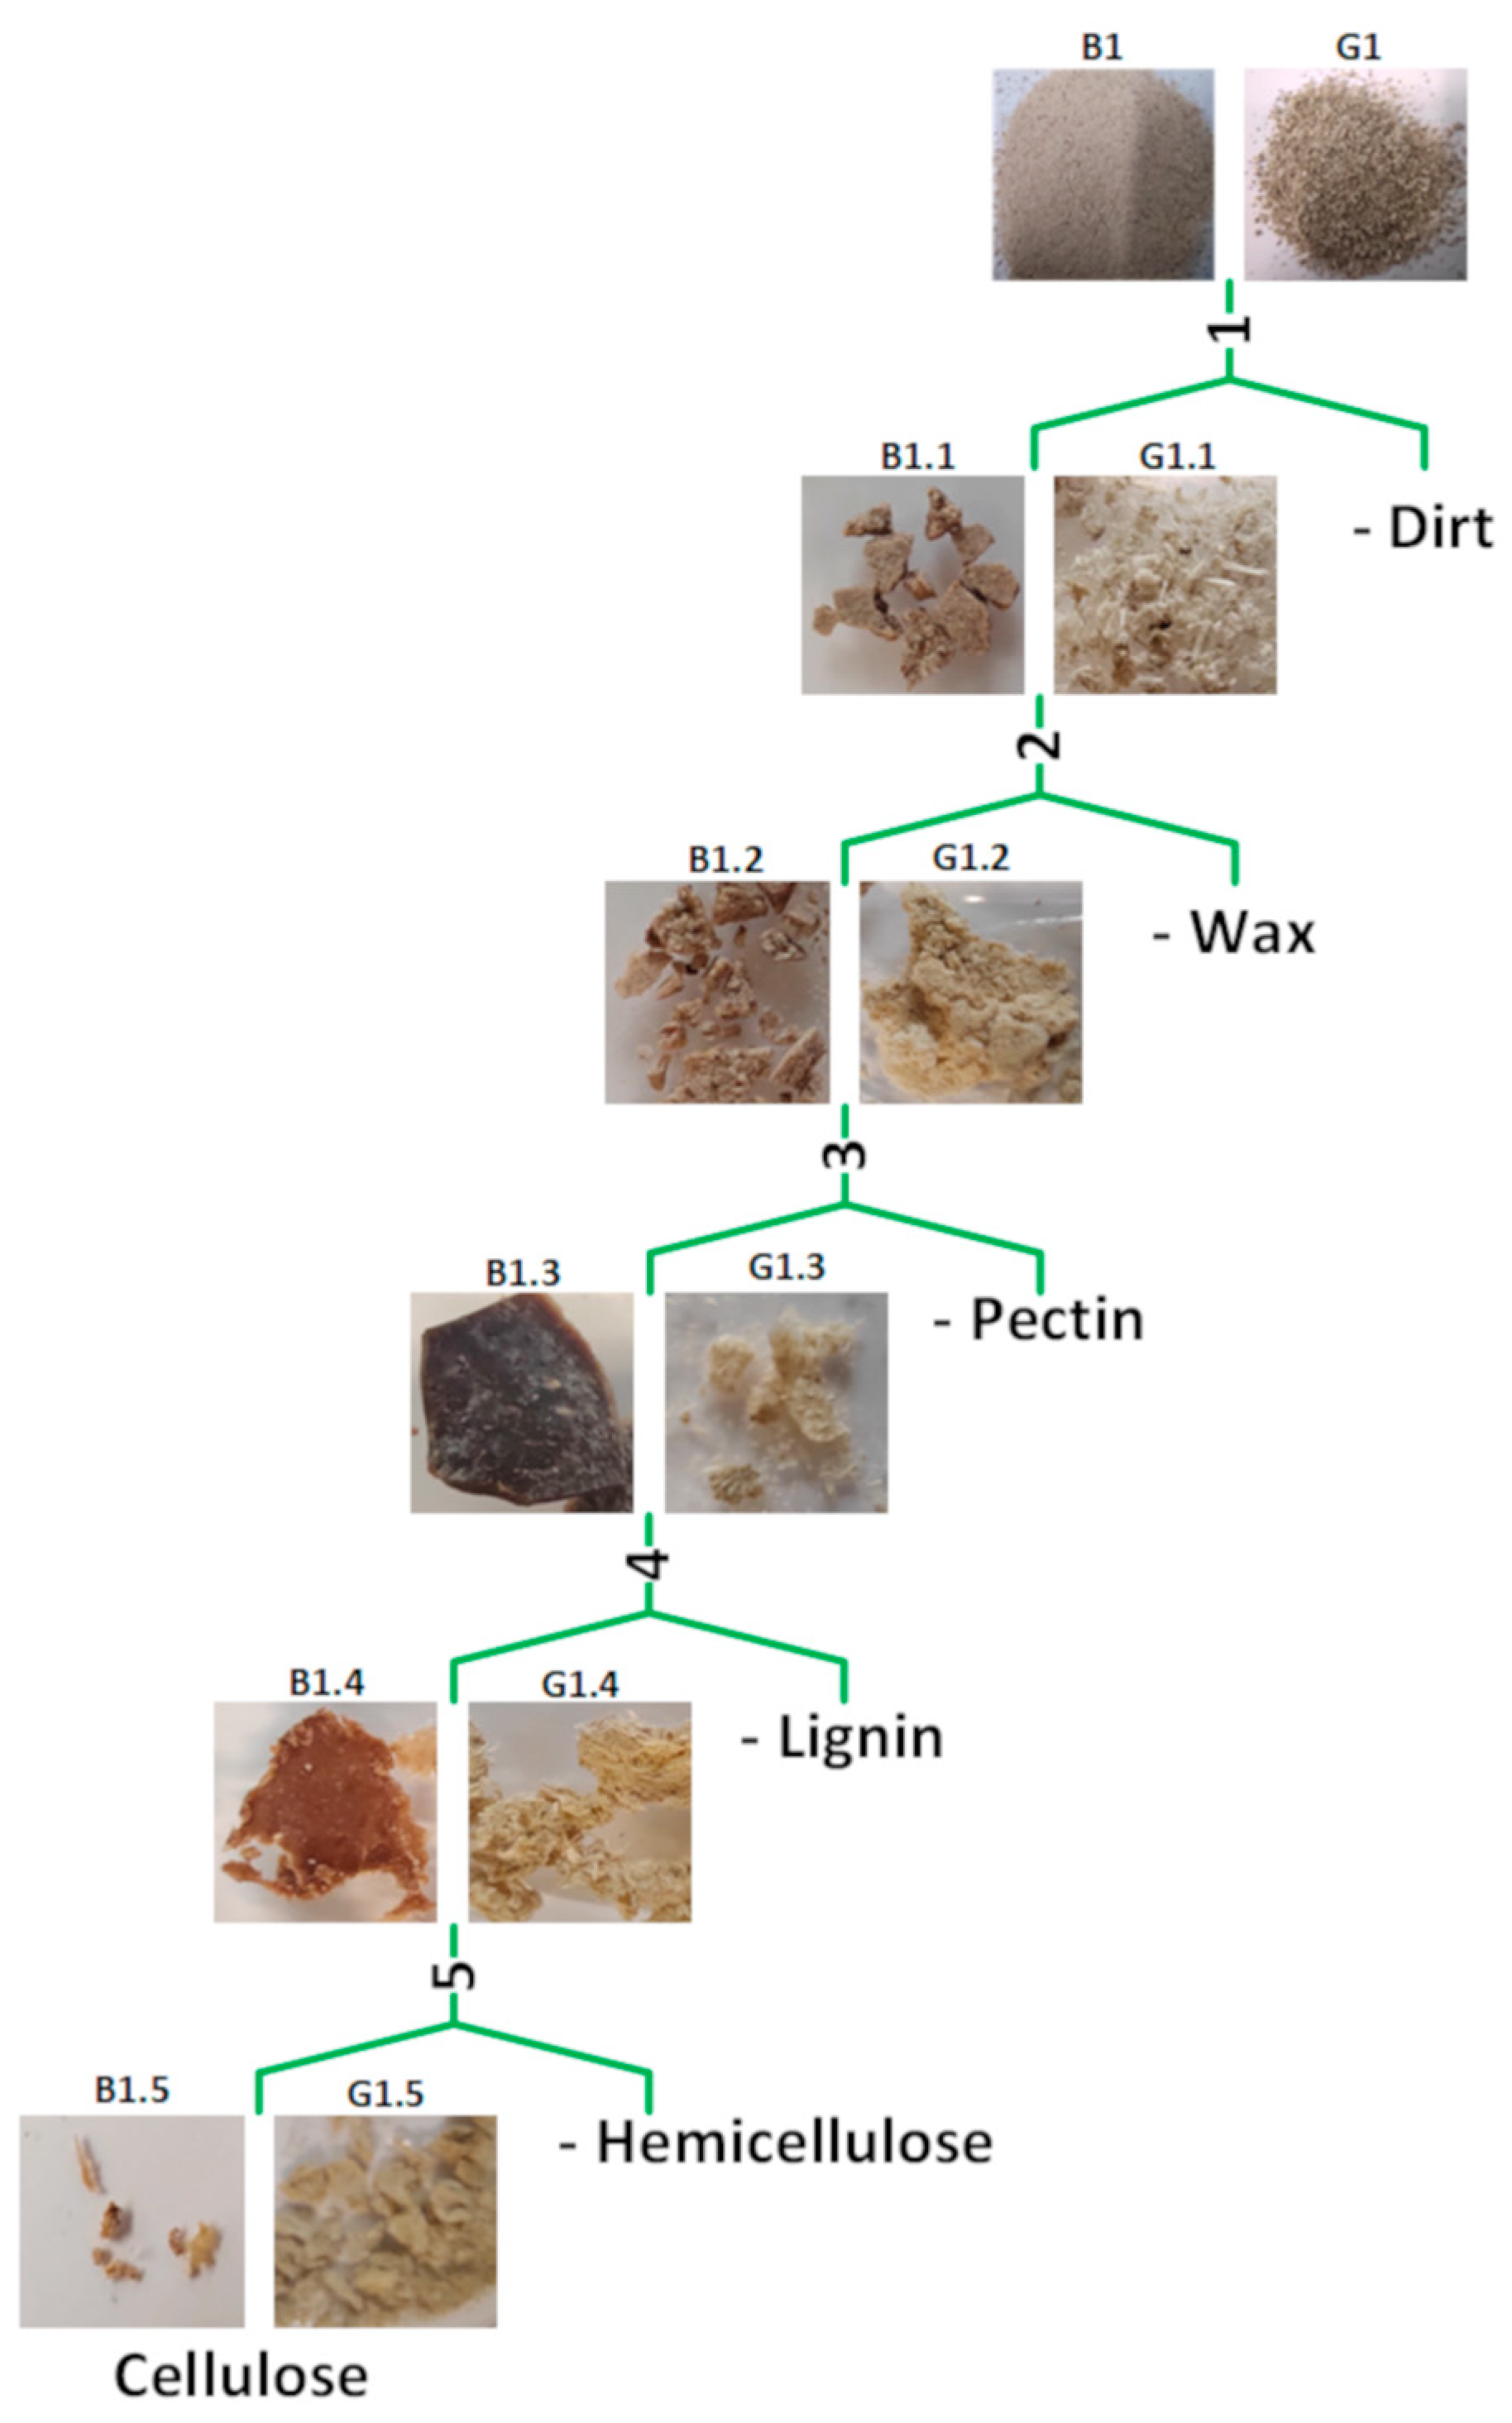
2.2. Fiber Fractionation
- Wax extraction;
- Pectin extraction;
- Lignin extraction;
- Cellulose and Hemicellulose extraction.
2.3. PCL Composite Preparation
2.4. Characterization Methods
3. Results and Discussion
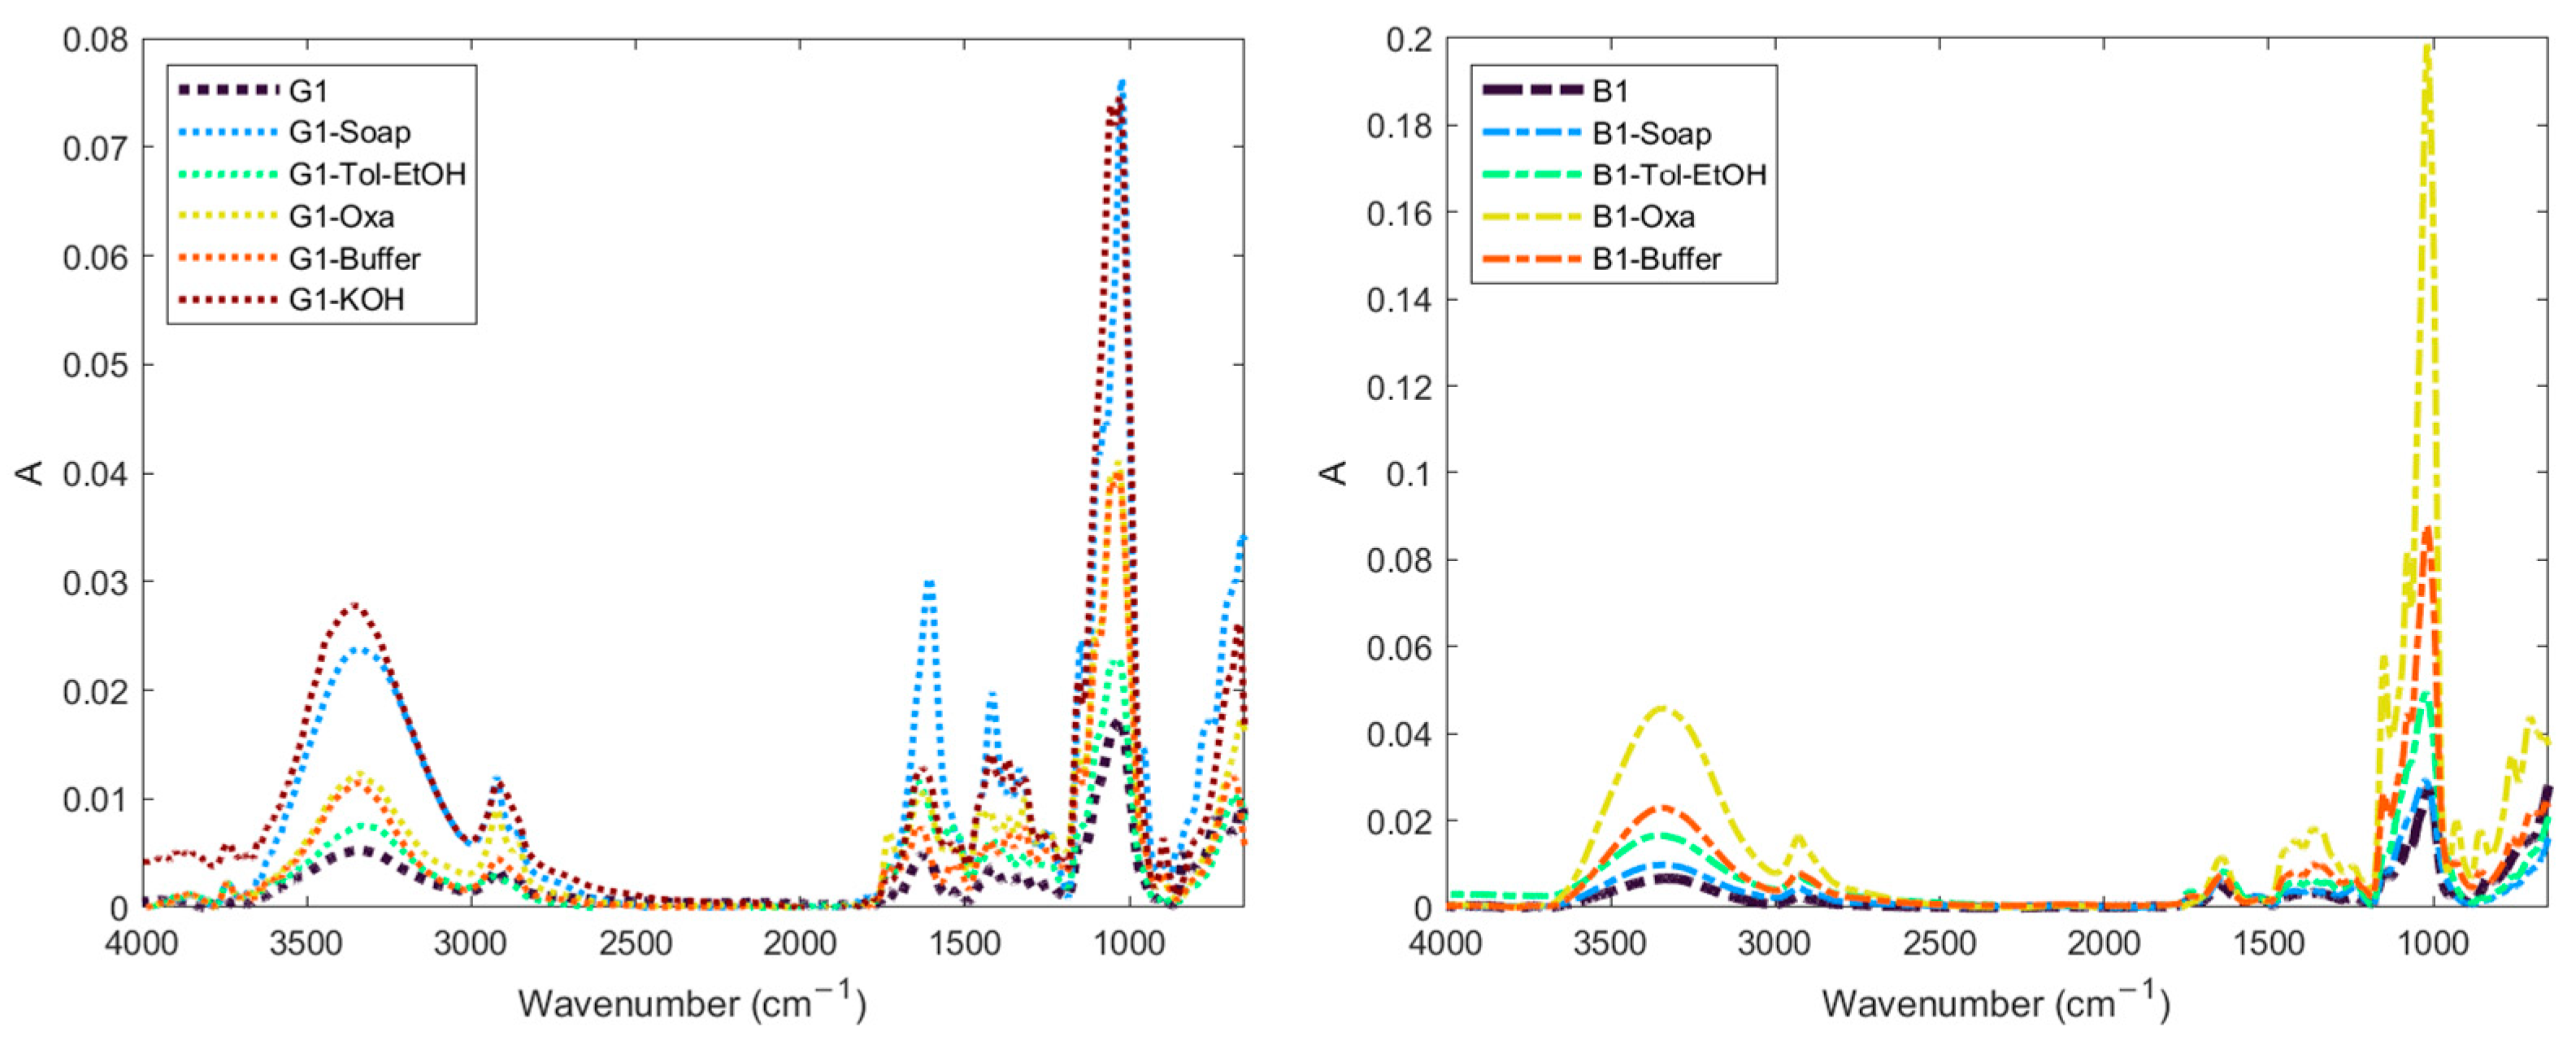
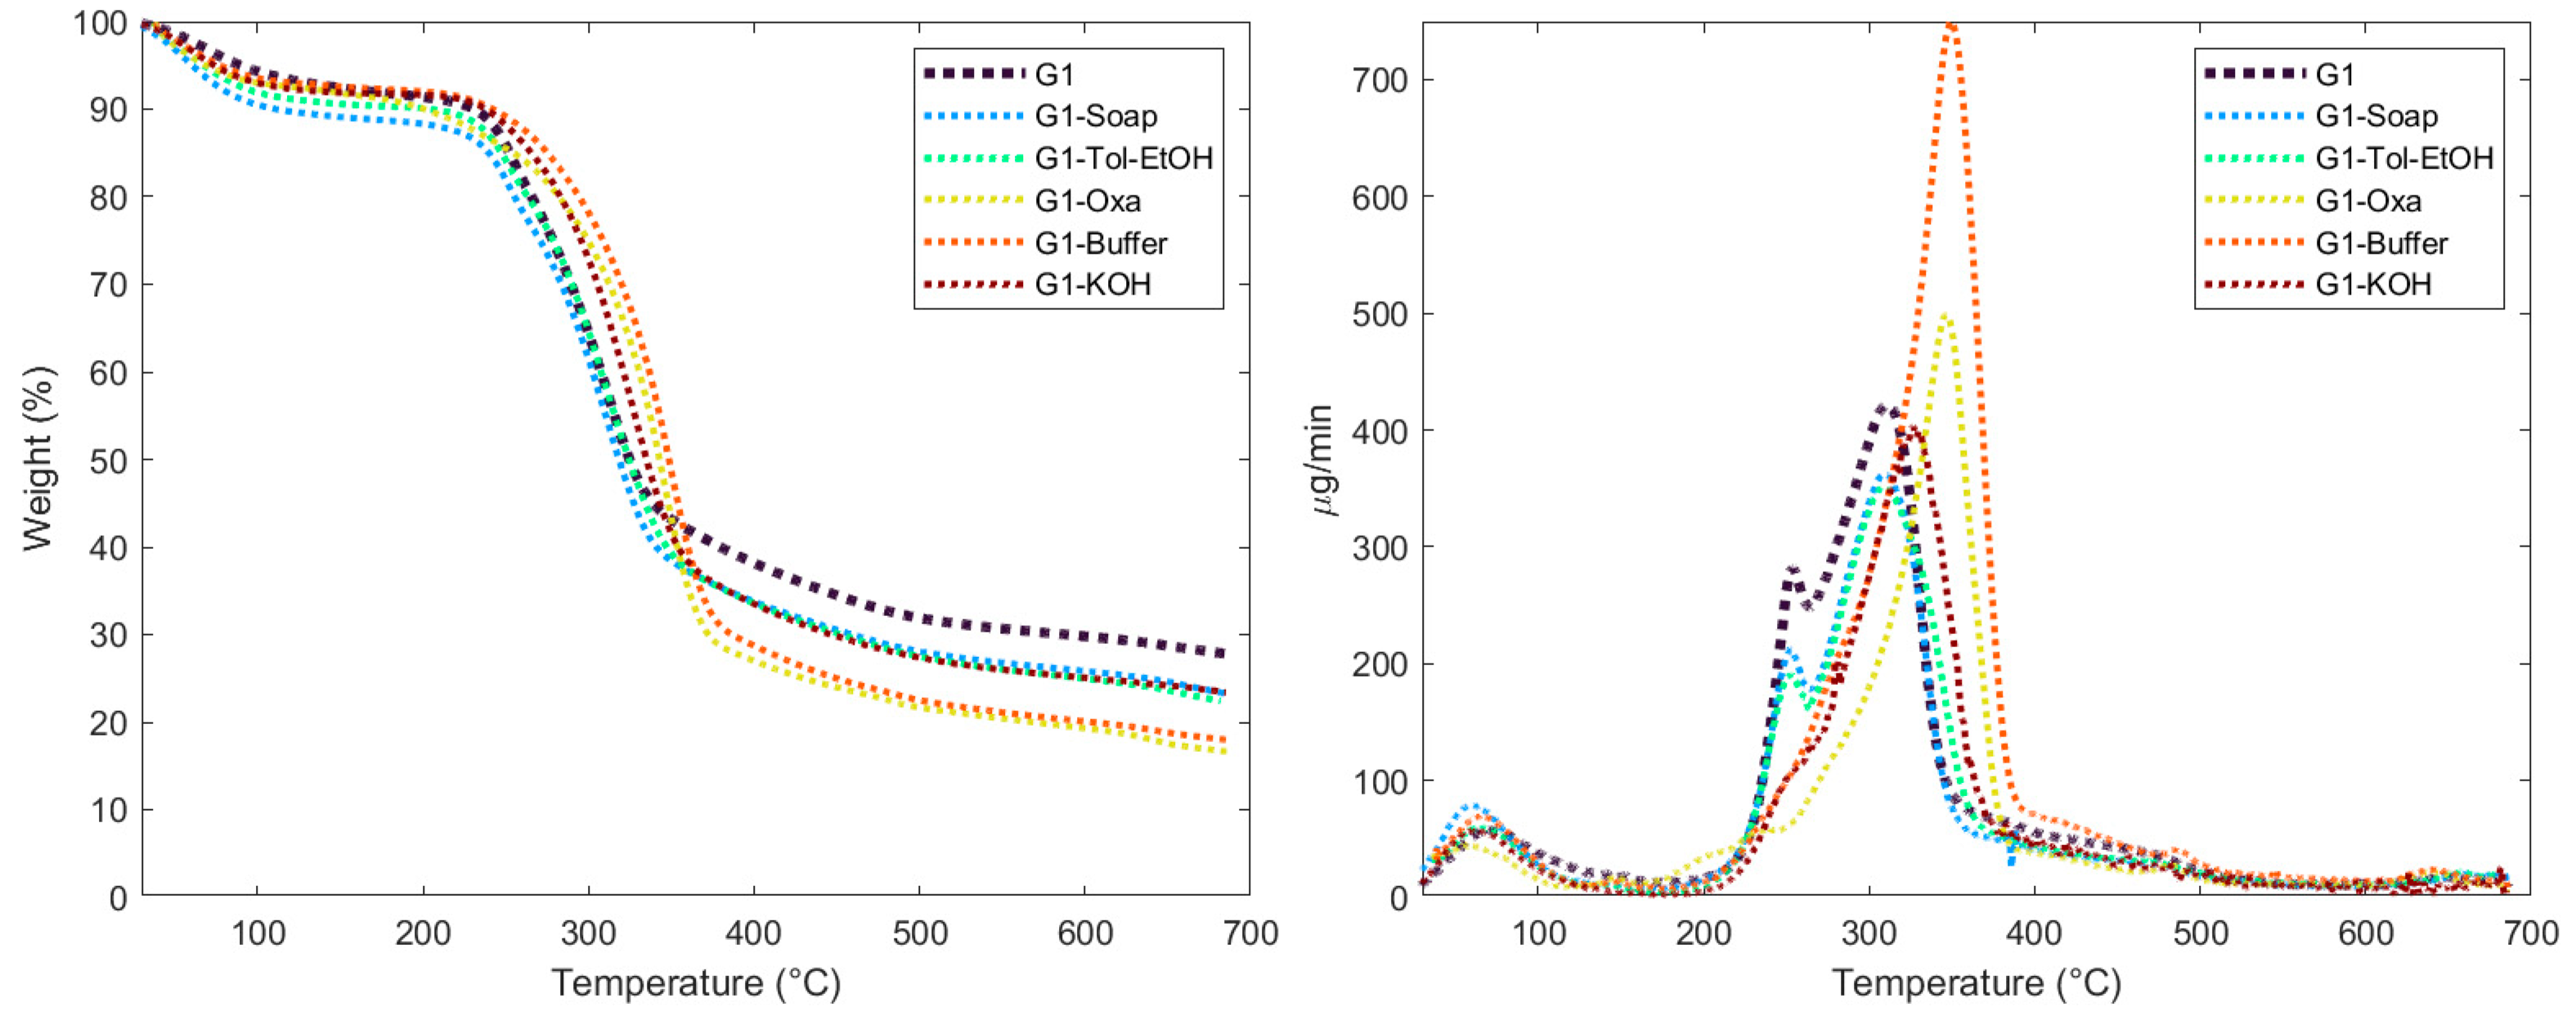
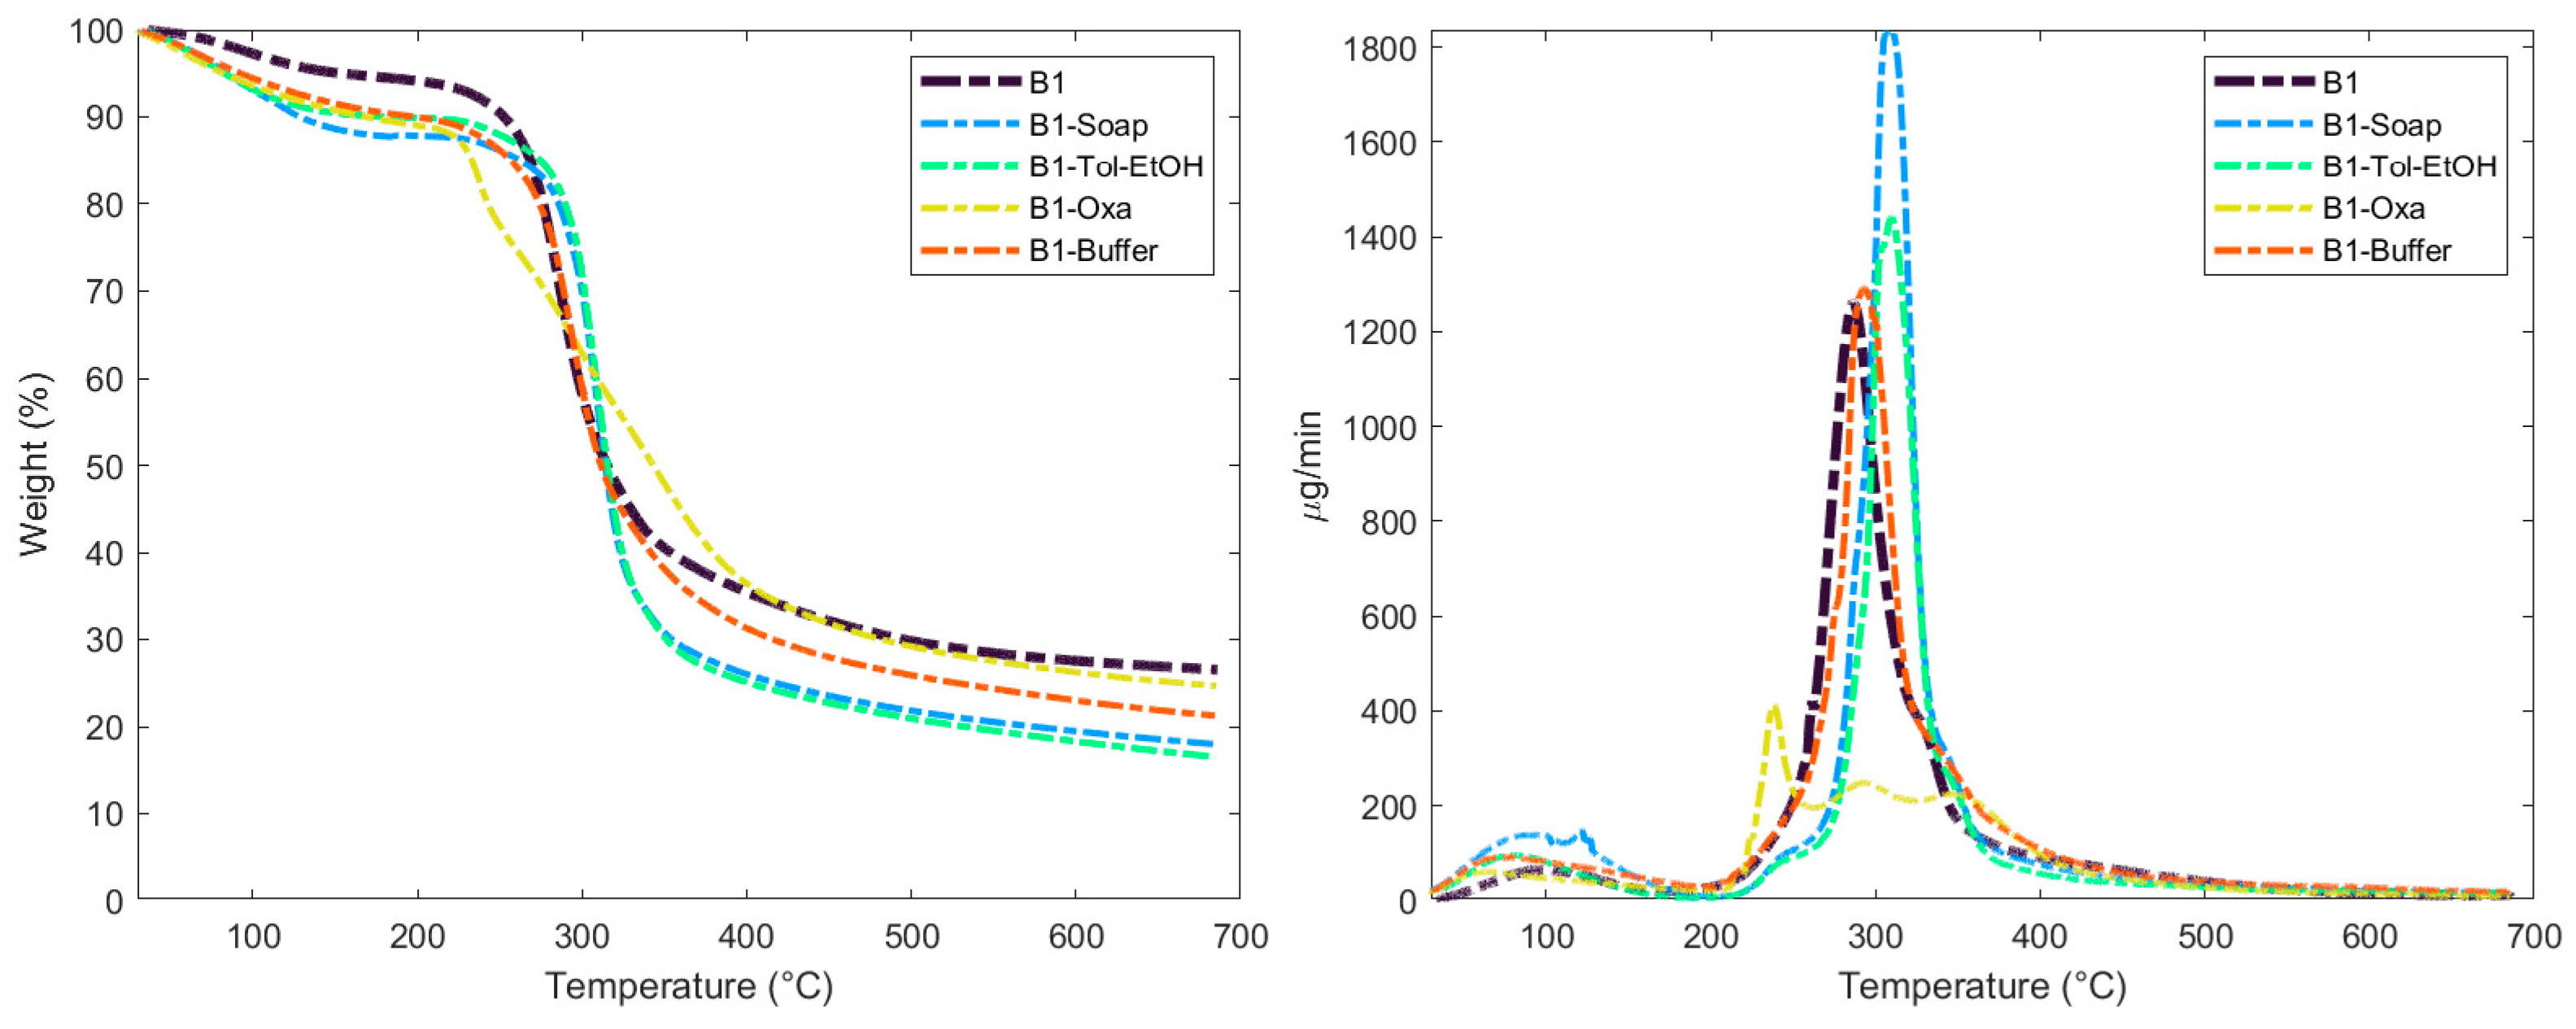
3.1. Analyses of Fibers: Chemical Fractionation and Characterizations
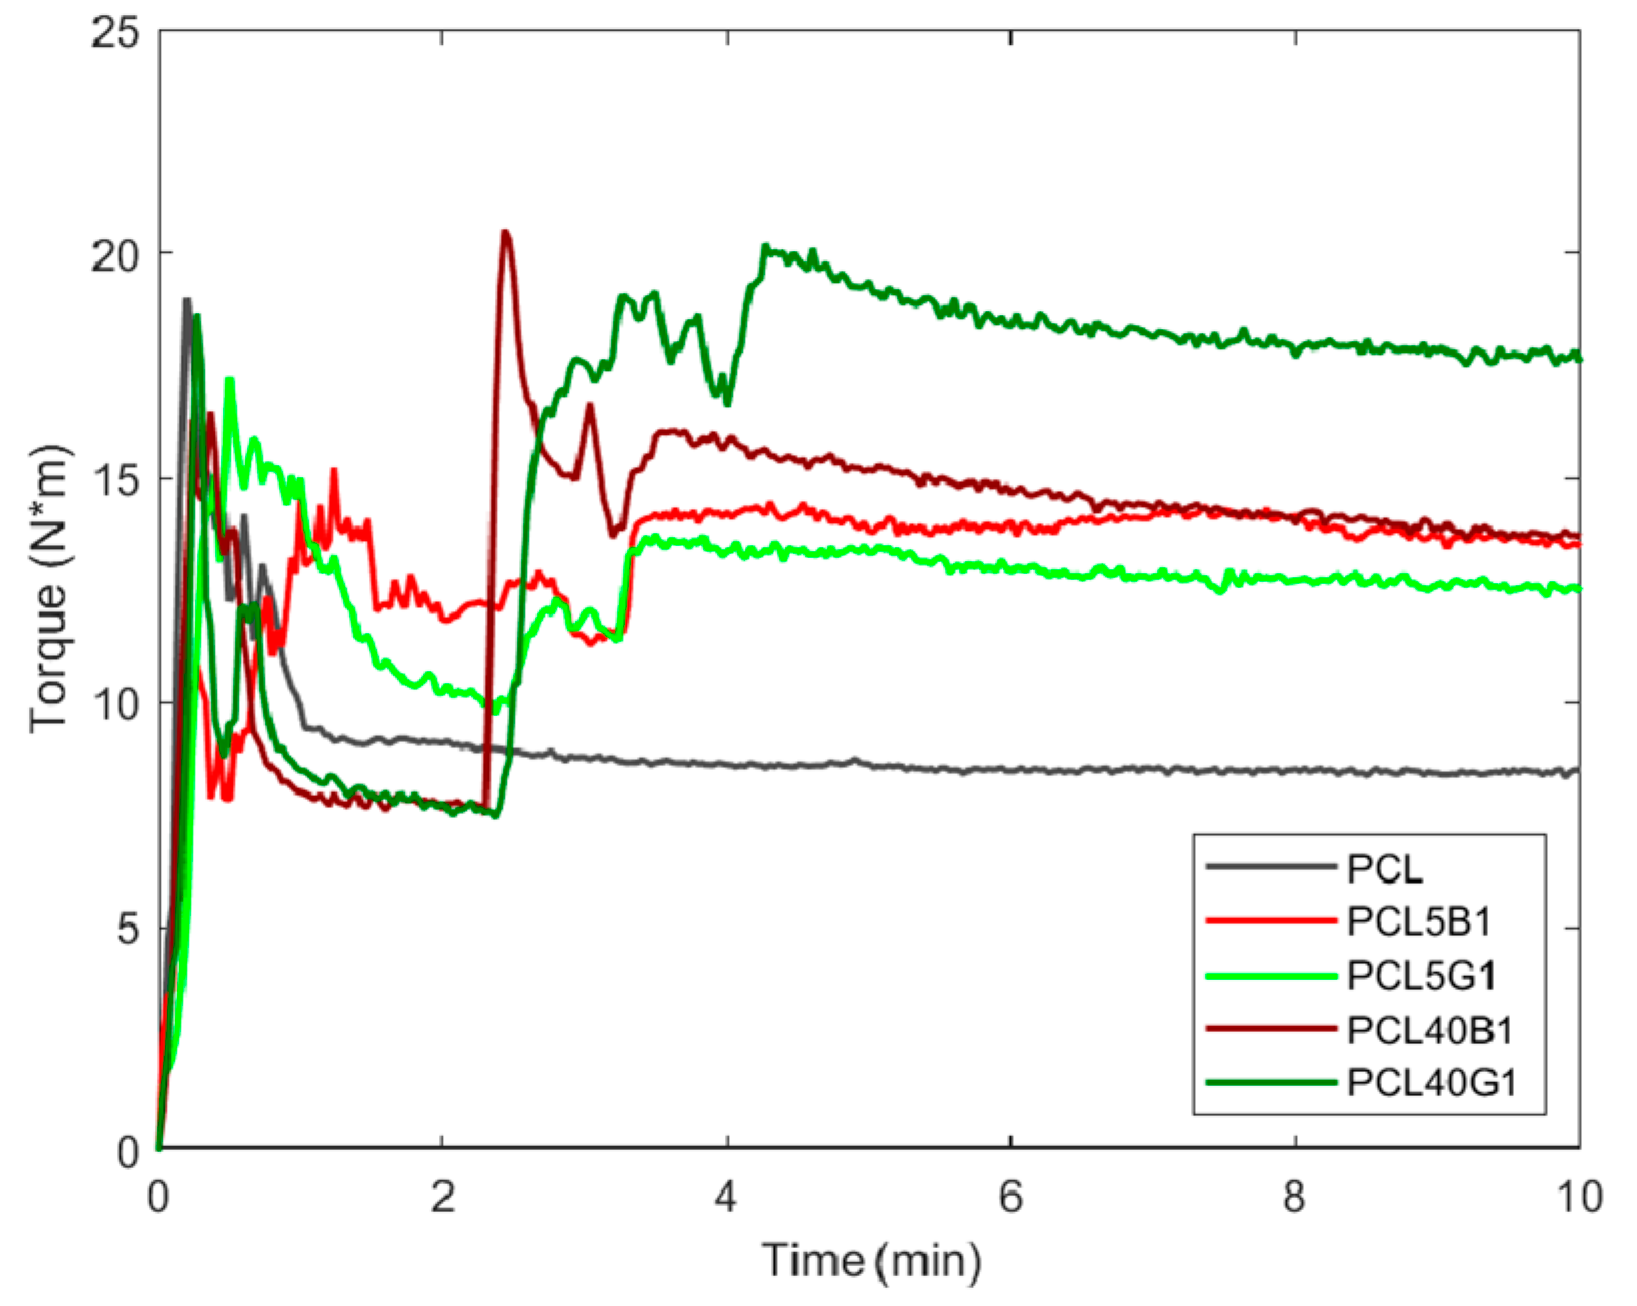
3.2. Preparation of Composites
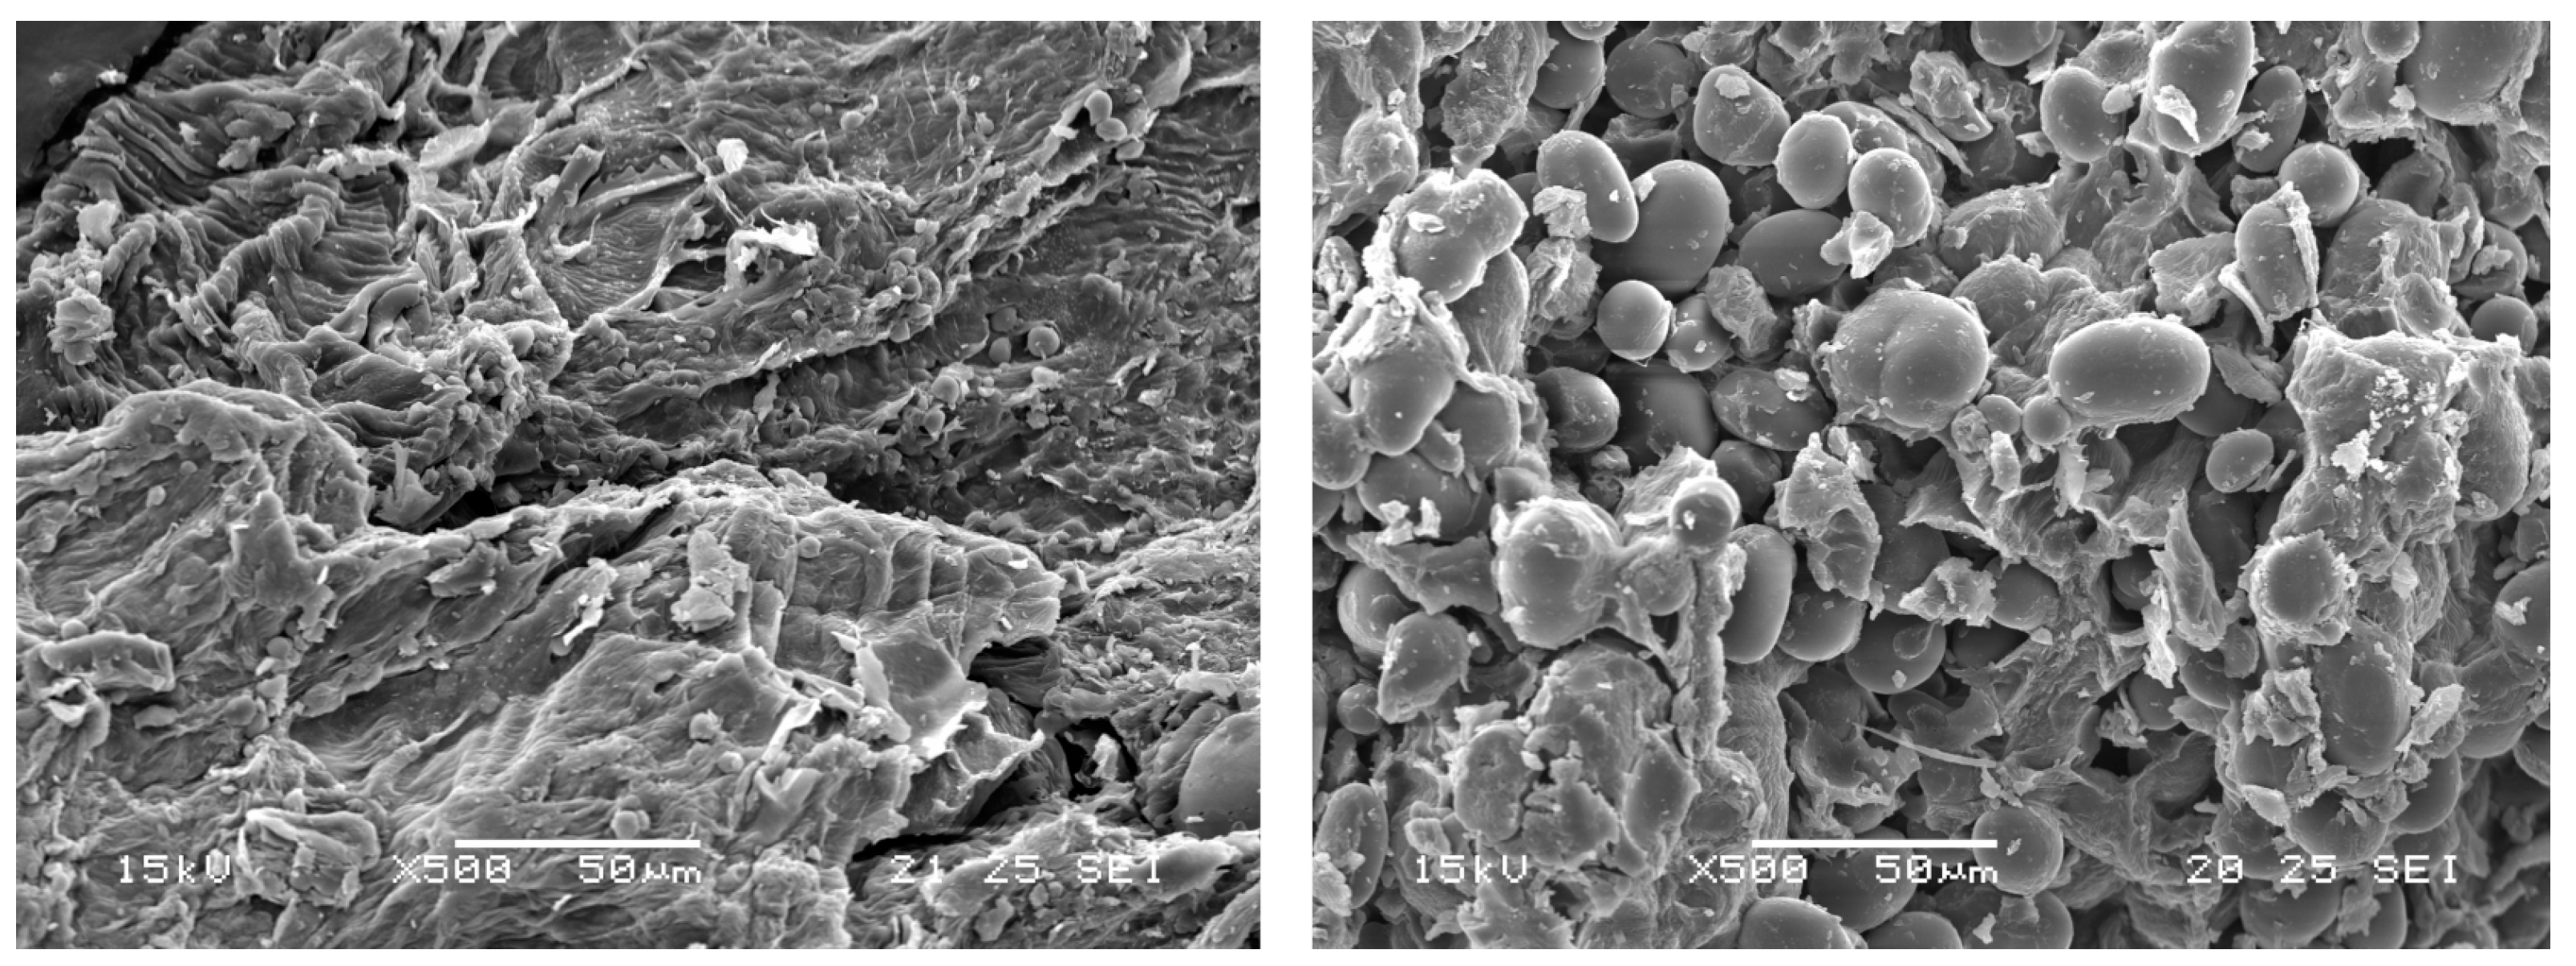
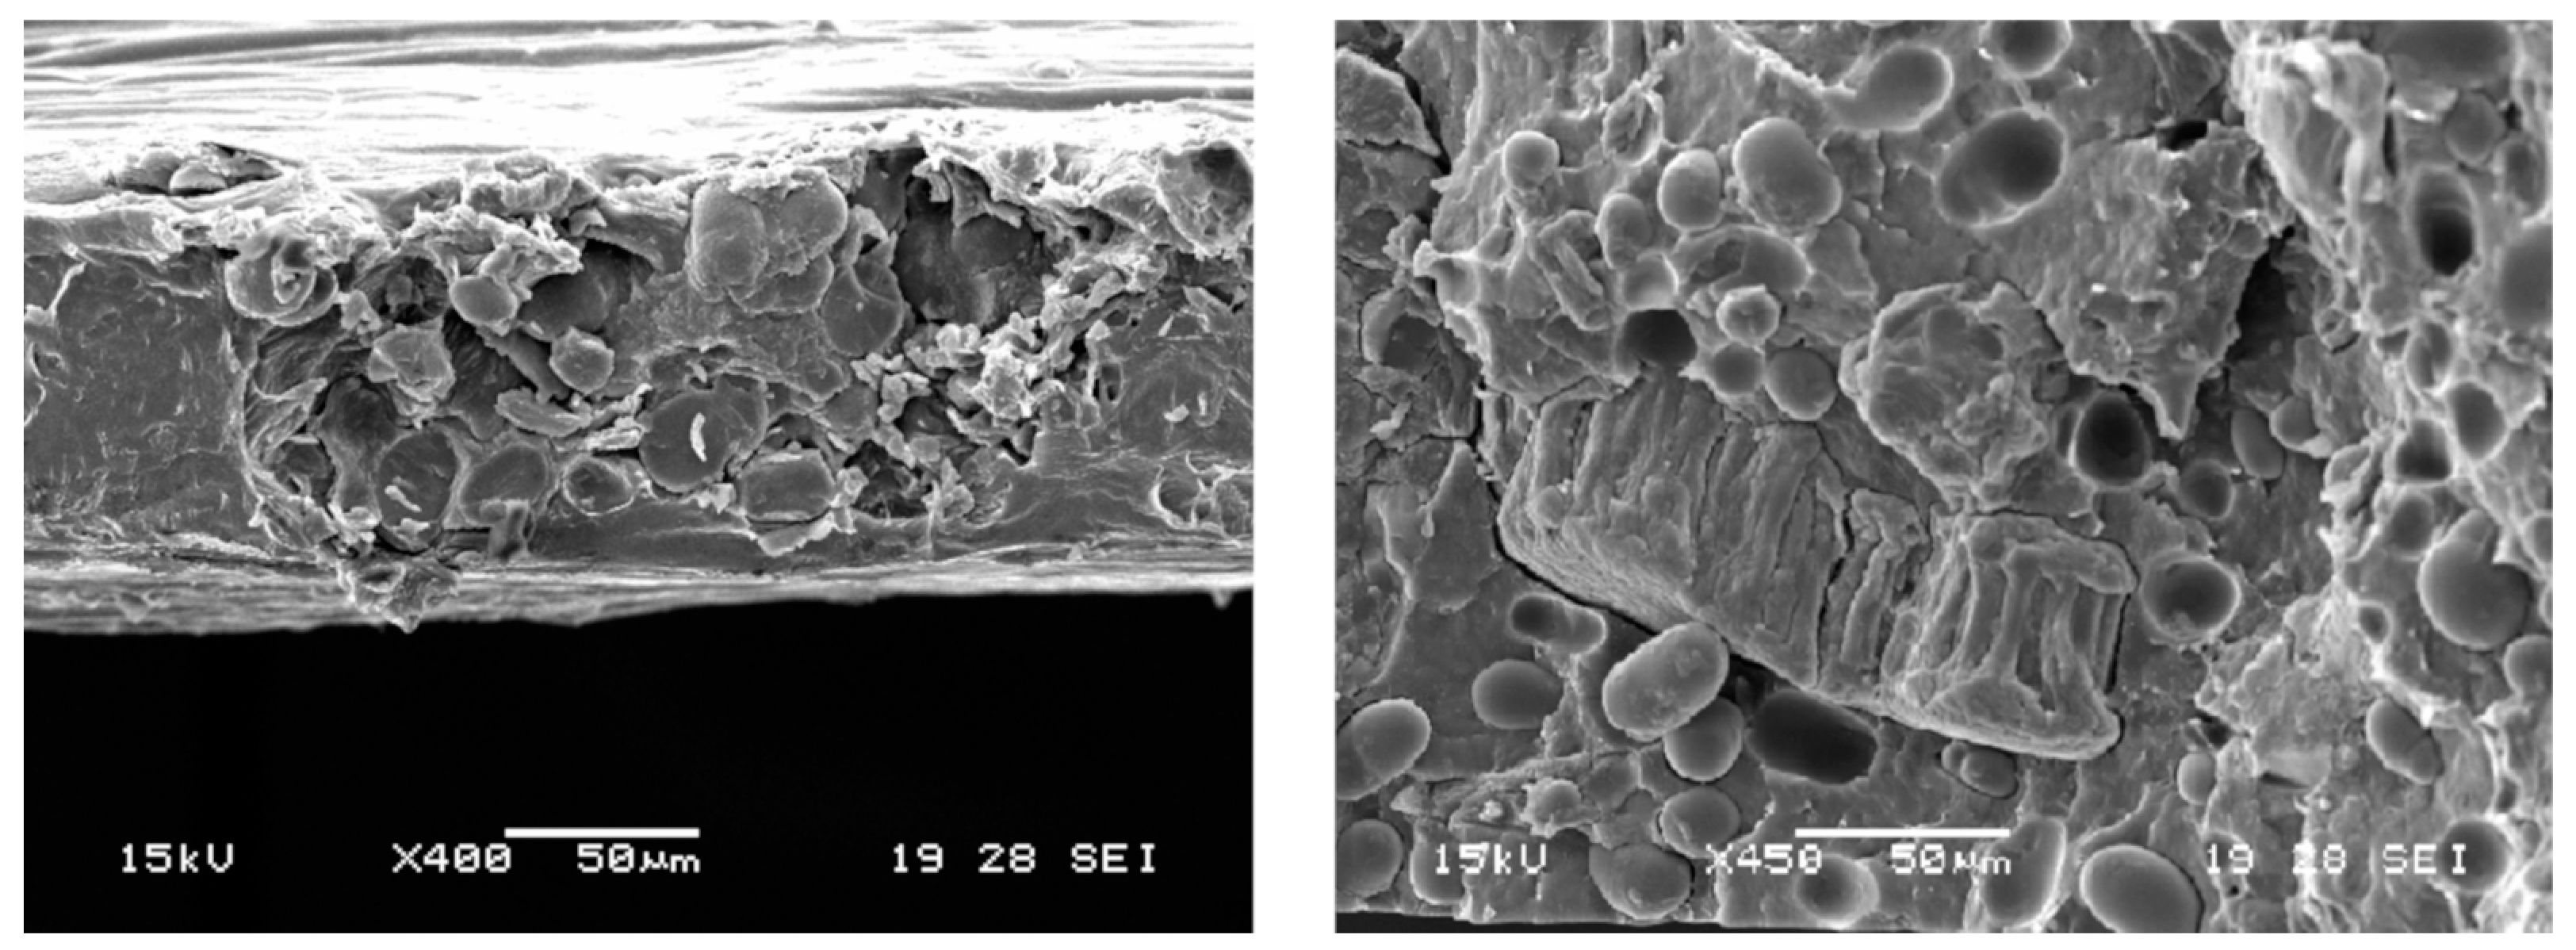
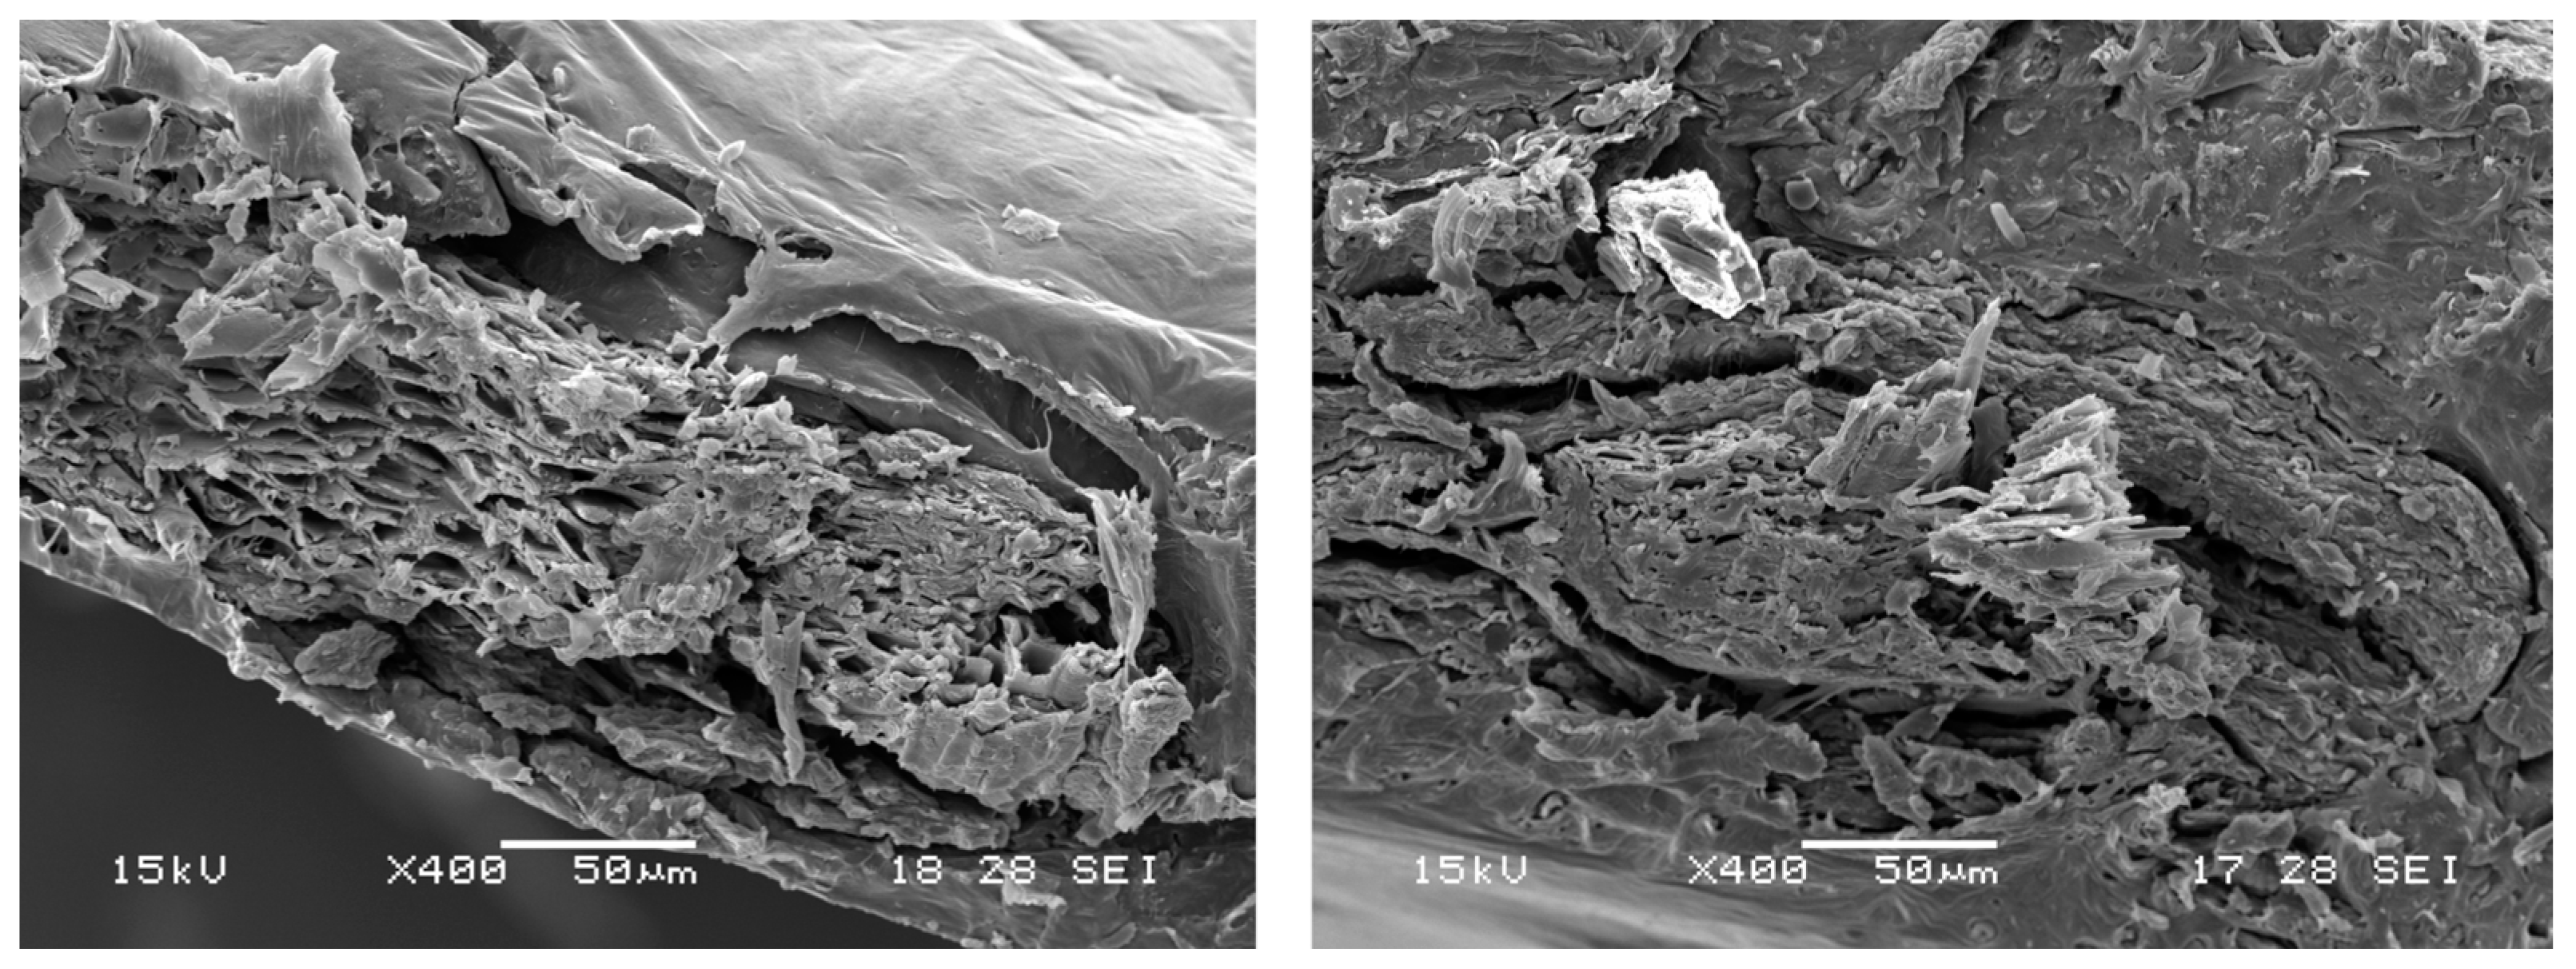
3.2.1. Morphological Properties of Composites
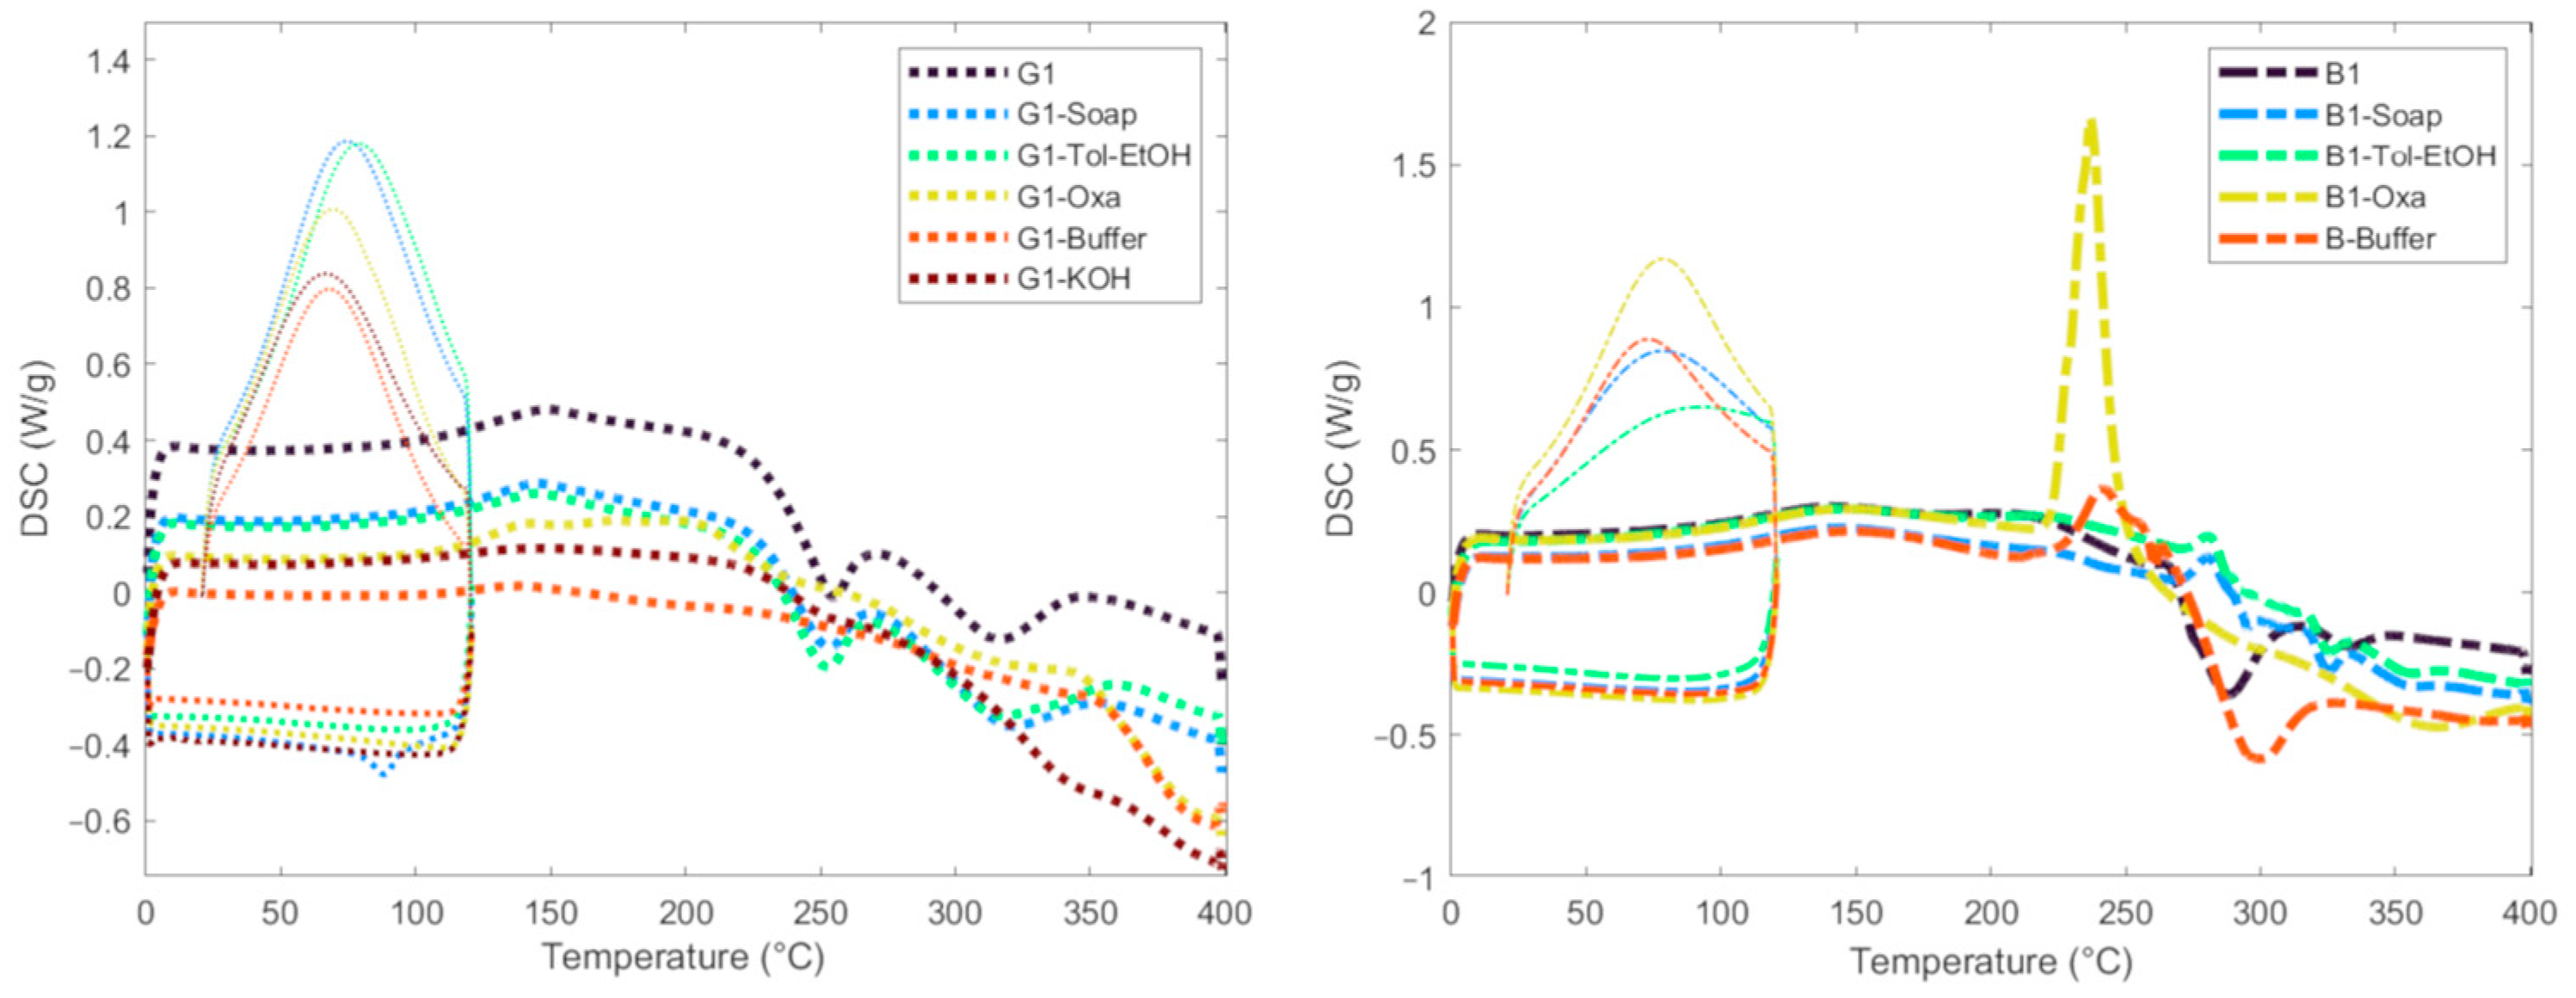
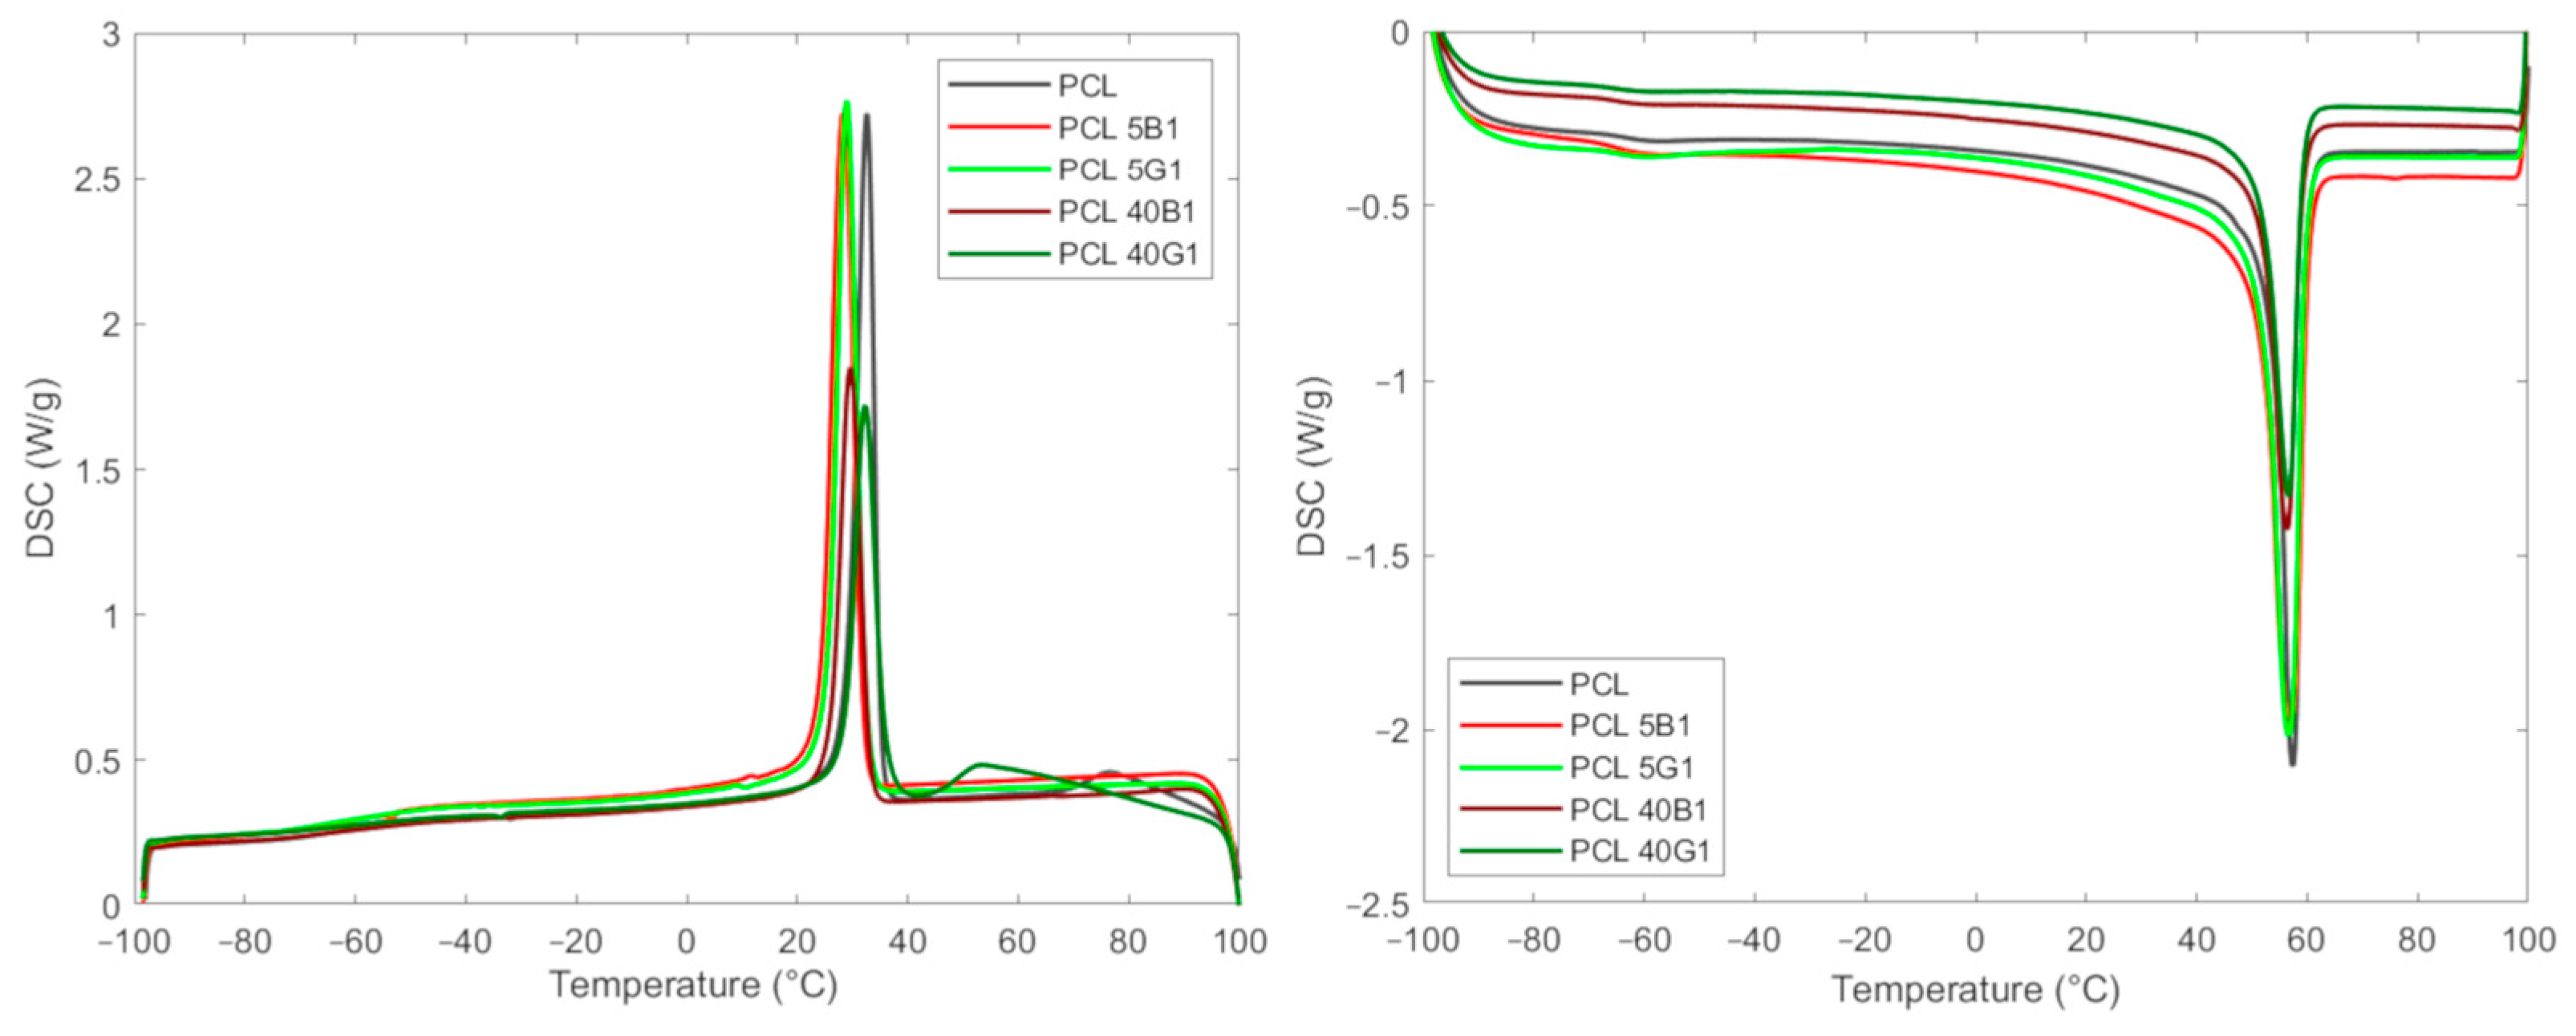
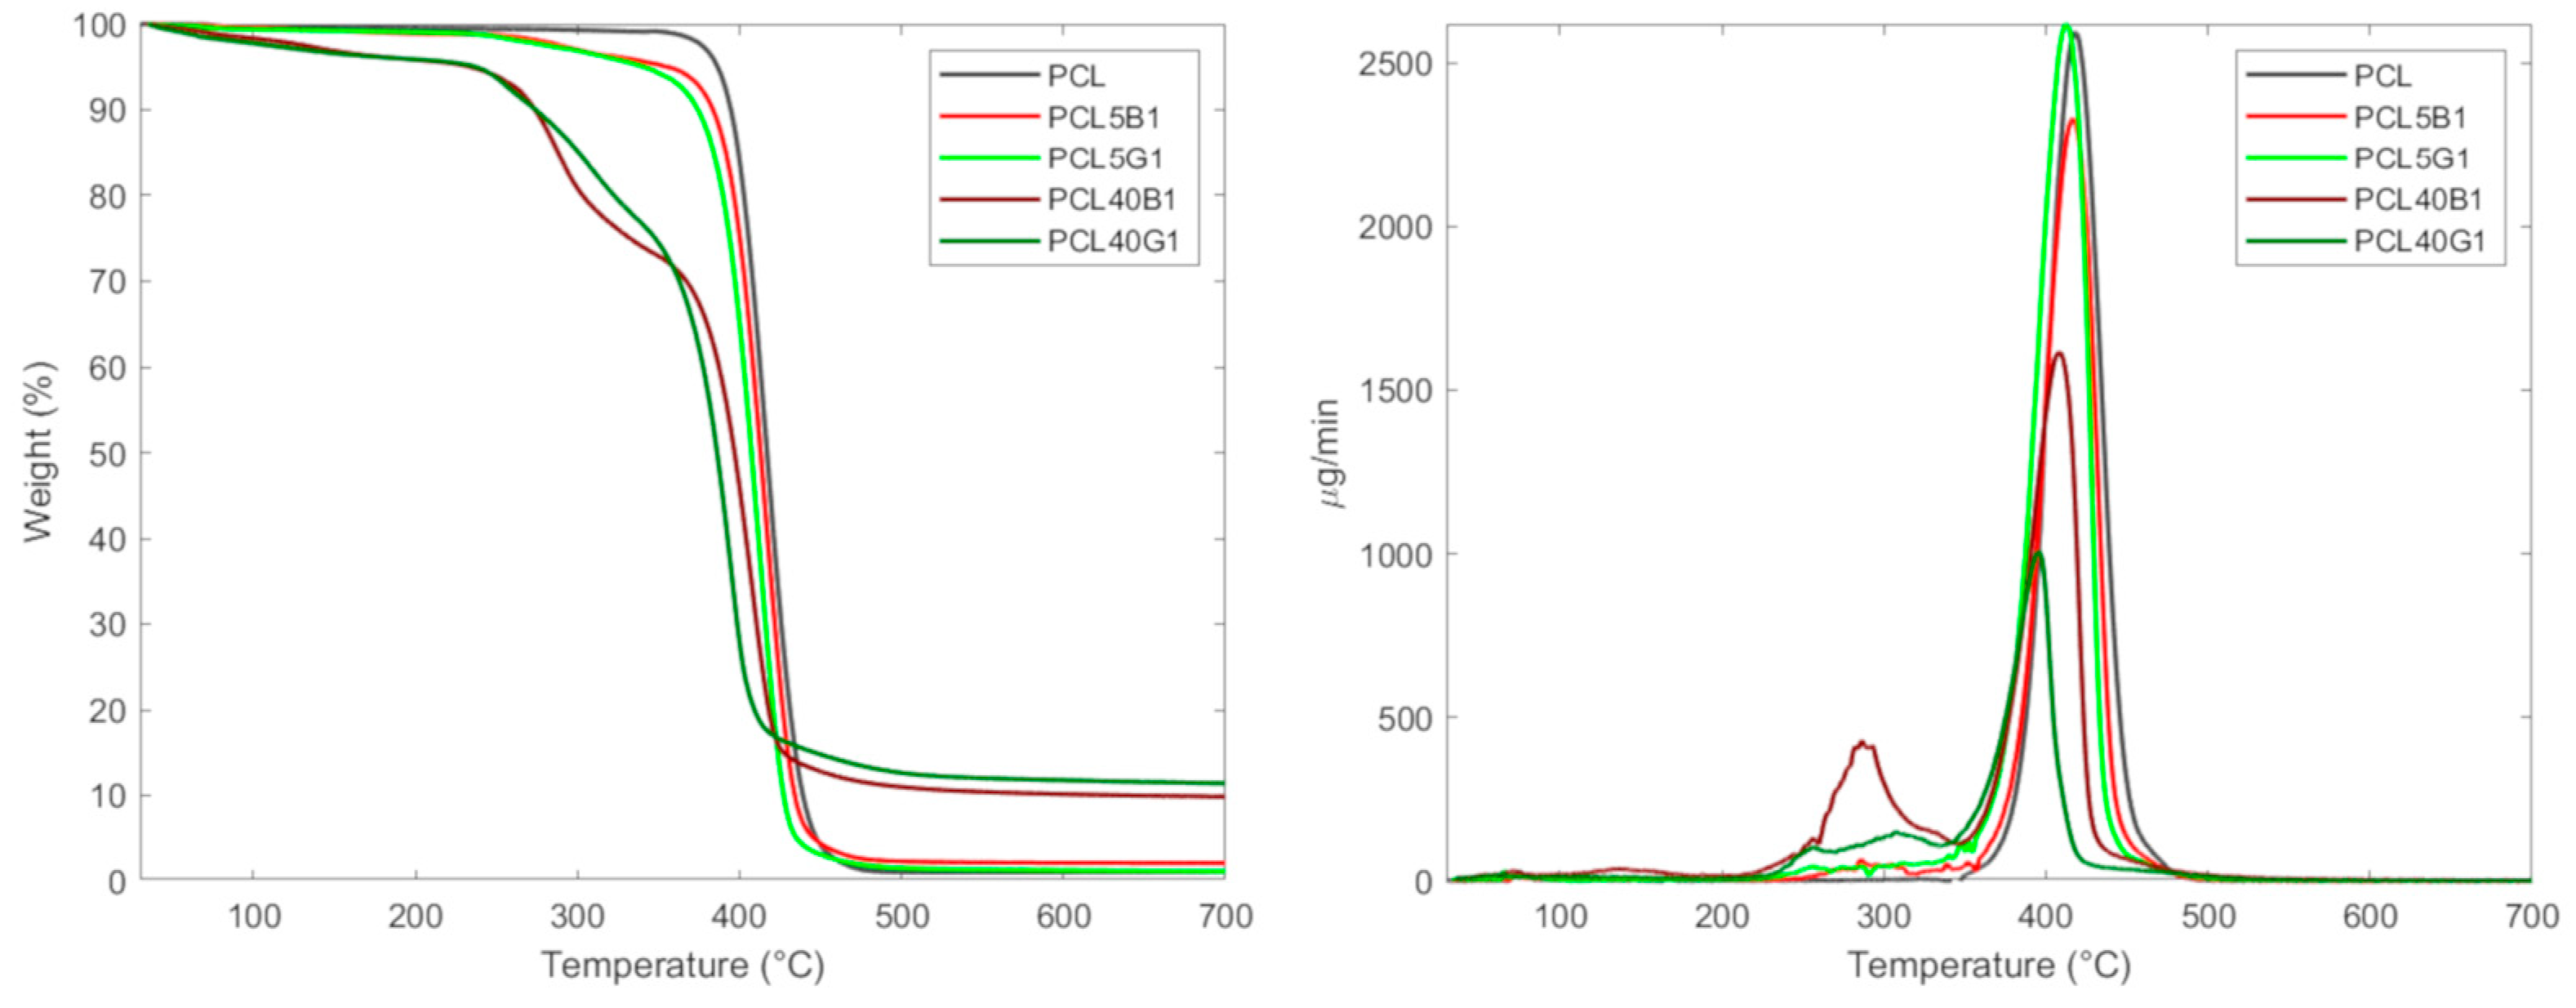
3.2.2. Thermal Properties of Composites
- Hindering crystallization by reducing chain mobility makes reorganization into ordered structures harder [34].
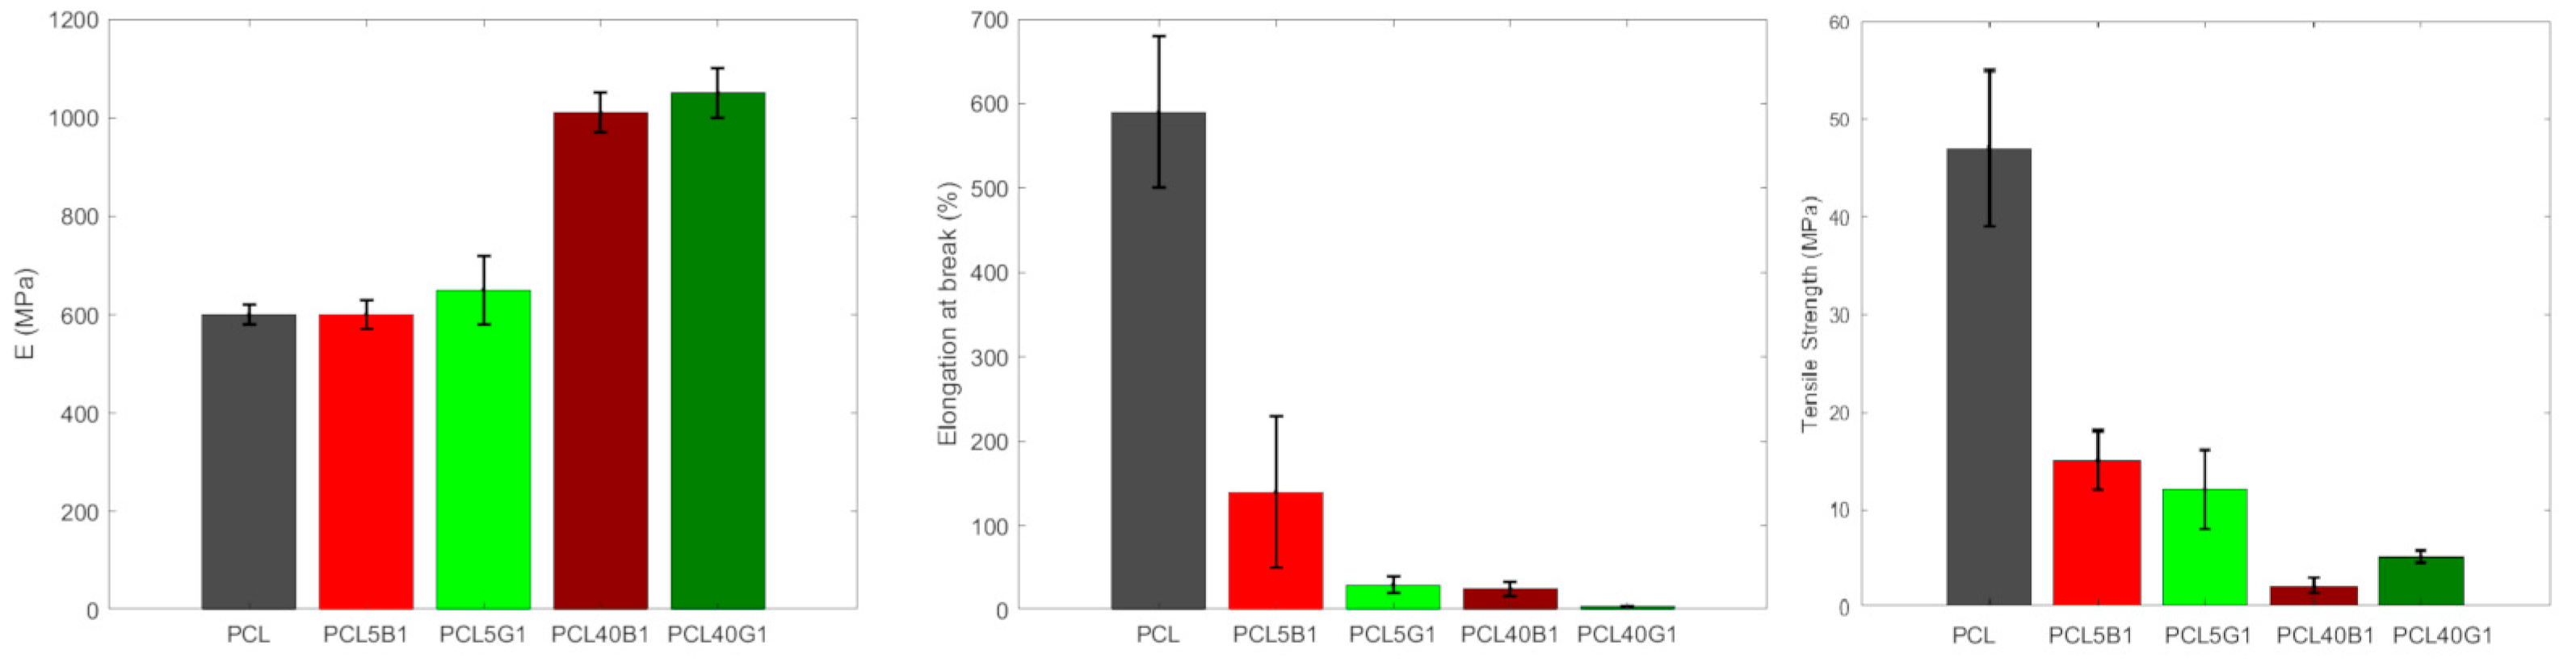
3.2.3. Mechanical Analyses
4. Conclusions
Author Contributions
Funding
Data Availability Statement
Acknowledgments
Conflicts of Interest
References
- World Population 1950–2023. Available online: https://www.macrotrends.net/countries/WLD/world/population (accessed on 2 June 2023).
- FAOSTAT Worldwide and European Production of Dry Beans and Green Beans. Available online: https://www.fao.org/faostat/en/#data/QCL (accessed on 9 March 2023).
- Bioplastics Market Data. Available online: https://www.european-bioplastics.org/market/ (accessed on 2 June 2023).
- Mohamed, R.M.; Yusoh, K. A Review on the Recent Research of Polycaprolactone (PCL). Adv. Mat. Res. 2015, 1134, 249–255. [Google Scholar] [CrossRef]
- Arbelaiz, A.; Fernandez, B.; Valea, A.; Mondragon, I. Mechanical properties of short flax fibre bundle/poly(3-caprolactone) composites: Influence of matrix modification and fibre content. Carbohydr. Polym. 2006, 64, 224–232. [Google Scholar] [CrossRef]
- Malinowski, R.; Raszkowska-Kaczor, A.; Moraczewski, K.; Głuszewski, W.; Krasinskyi, V.; Wedderburn, L. The structure and mechanical properties of hemp fibers-reinforced poly(ε-caprolactone) composites modified by electron beam irradiation. Appl. Sci. 2021, 11, 5317–5330. [Google Scholar] [CrossRef]
- Mwaikambo, L.Y. Review of the history, properties and application of plant fibres. AJST 2006, 7, 120–133. [Google Scholar]
- Roy, K.; Chandra Debnath, S.; Das, A.; Heinrich, G.; Potiyaraj, P. Exploring the synergistic effect of short jute fiber and nanoclay on the mechanical, dynamic mechanical and thermal properties of natural rubber composites. Polym. Test. 2018, 67, 487–493. [Google Scholar] [CrossRef]
- Zafar, M.T.; Maiti, S.N.; Ghosh, A.K. Effect of surface treatment of jute fibers on the interfacial adhesion in poly(lactic acid)/jute fiber biocomposites. Fibers Polym. 2016, 17, 266–274. [Google Scholar] [CrossRef]
- Dolez, P.I.; Arfaoui, M.A.; Dubé, M.; David, É. Hydrophobic treatments for natural fibers based on metal oxide nanoparticles and fatty acids. Procedia Eng. 2017, 200, 81–88. [Google Scholar] [CrossRef]
- Hachaichi, A.; Nekkaa, S.; Amroune, S.; Jawaid, M.; Alothman, O.Y.; Dufresne, A. Effect of alkali surface treatment and compatibilizer agent on tensile and morphological properties of date palm fibers-based high density polyethylene biocomposites. Polym. Compos. 2022, 43, 7211–7221. [Google Scholar] [CrossRef]
- Ricci, L.; Umiltà, E.; Righetti, M.C.; Messina, T.; Zurlini, C.; Montanari, A.; Bronco, S.; Bertoldo, M. On the thermal behavior of protein isolated from different legumes investigated by DSC and TGA. J. Sci. Food Agric. 2018, 98, 5368–5377. [Google Scholar] [CrossRef]
- Tassoni, A.; Tedeschi, T.; Zurlini, C.; Cigognini, I.M.; Petrusan, J.-I.; Rodríguez, O.; Neri, S.; Celli, A.; Sisti, L.; Cinelli, P.; et al. State-of-the-Art Production Chains for Peas, Beans and Chickpeas—Valorization of Agro-Industrial Residues and Applications of Derived Extracts. Molecules 2020, 25, 1383–1403. [Google Scholar] [CrossRef]
- Adekunle, K.; Patzelt, C.; Kalantar, A.; Skrifvars, M. Mechanical and viscoelastic properties of soybean oil thermoset reinforced with jute fabrics and carded lyocell fiber. J. Appl. Polym. Sci. 2011, 122, 2855–2863. [Google Scholar] [CrossRef]
- Chen, G.; Liu, H. Electrospun cellulose nanofiber reinforced soybean protein isolate composite film. J. Appl. Polym. Sci. 2008, 110, 641–646. [Google Scholar] [CrossRef]
- Hong, C.K.; Wool, R.F. Development of a bio-based composite material from soybean oil and keratin fibers. J. Appl. Polym. Sci. 2005, 95, 1524–1538. [Google Scholar] [CrossRef]
- Cinelli, P.; Mallegni, N.; Gigante, V.; Montanari, A.; Seggiani, M.; Coltelli, M.B.; Bronco, S.; Lazzeri, A. Biocomposites Based on Polyhydroxyalkanoates and Natural Fibres from Renewable Byproducts. Appl. Food Biotechnol. 2019, 6, 35–43. [Google Scholar]
- Novais Miranda, E.H.; Gomes, D.A.C.; Andrade, G.M.; Mendes, L.M.; Guimarães Júnior, J.B. Valorization of bean agricultural wastes for the production of polymeric composites. Res. Sq. 2023. [Google Scholar] [CrossRef]
- Alam, M.d.S.; Arifuzzaman Khan, G.M. Chemical analysis of okra bast fiber (Abelmoschus esculentus) and its physico-chemical properties. J. Text. Appar. Technol. Manag. 2007, 5, 1–9. [Google Scholar]
- Mella, C.; Vega-Gálvez, A.; Uribe, E.; Pasten, A.; Mejias, N.; Quispe-Fuentes, I. Impact of vacuum drying on drying characteristics and functional properties of beetroot (Beta vulgaris). Appl. Food Res. 2022, 2, 100120. [Google Scholar] [CrossRef]
- Beatrice, C.A.G.; Shimomura, K.M.B.; Backes, E.H.; Harb, S.V.; Costa, L.C.; Passador, F.R.; Pessan, L.A. Engineering printable composites of poly (ε-polycaprolactone)/β-tricalcium phosphate for biomedical applications. Polym. Comp. 2021, 42, 1198–1213. [Google Scholar] [CrossRef]
- Blázquez-Blázquez, E.; Pérez, E.; Lorenzo, V.; Cerrada, M.L. Crystalline characteristics and their influence in the mechanical performance in poly(ε-Caprolactone)/High Density Polyethylene Blends. Polymers 2019, 11, 1874–1895. [Google Scholar] [CrossRef]
- Ahmed, J.; Mulla, M.Z.; Siddiq, M.; Dolan, K.D. Micromeritic, thermal, dielectric, and microstructural properties of legume ingredients: A review. Legum. Sci. 2022, 4, e123. [Google Scholar] [CrossRef]
- Nagarajaganesh, B.; Ganeshan, P.; Ramshankar, P.; Raja, K. Assessment of natural cellulosic fibers derived from Senna auriculata for making light weight industrial biocomposites. Ind. Crops Prod. 2019, 139, 111546–111555. [Google Scholar] [CrossRef]
- Aburto, J.; Moran, M.; Galano, A.; Torres-García, E. Non-isothermal pyrolysis of pectin: A thermochemical and kinetic approach. J. Anal. Appl. Pyrolysis 2015, 112, 94–104. [Google Scholar] [CrossRef]
- Miranda, M.I.G.; Bica, C.I.D.; Nachtigall, S.M.B.; Rehman, N.; Rosa, S.M.L. Kinetical thermal degradation study of maize straw and soybean hull celluloses by simultaneous DSC-TGA and MDSC techniques. Thermochim. Acta 2013, 565, 65–71. [Google Scholar] [CrossRef]
- Rytlewski, P.; Stepczyńska, M.; Moraczewski, K.; Malinowski, R.; Jagodziński, B.; Żenkiewicz, M. Mechanical properties and biodegradability of flax fiber-reinforced composite of polylactide and polycaprolactone. Polimery 2018, 63, 603–610. [Google Scholar] [CrossRef]
- Cocca, M.; Avolio, R.; Gentile, G.; di Pace, E.; Errico, M.E.; Avella, M. Amorphized cellulose as filler in biocomposites based on poly(ε-caprolactone). Carbohydr. Polym. 2015, 118, 170–182. [Google Scholar] [CrossRef] [PubMed]
- Nevoralová, M.; Koutný, M.; Ujčić, A.; Starý, Z.; Šerá, J.; Vlková, H.; Šlouf, M.; Fortelný, I.; Kruliš, Z. Structure Characterization and Biodegradation Rate of Poly(ε-caprolactone)/Starch Blends. Front. Mater. 2020, 7, 141–154. [Google Scholar] [CrossRef]
- Puglia, D.; Dominici, F.; Badalotti, M.; Santulli, C.; Kenny, J.M. Tensile, Thermal and Morphological Characterization of Cocoa Bean Shells (CBS)/Polycaprolactone-Based Composites. J. Renew. Mater. 2016, 4, 199–205. [Google Scholar] [CrossRef]
- Shi, K.; Liu, G.; Sun, H.; Yang, B.; Weng, Y. Effect of Biomass as Nucleating Agents on Crystallization Behavior of Polylactic Acid. Polymers 2022, 14, 4305–4320. [Google Scholar] [CrossRef]
- Zdiri, K.; Elamri, A.; Harzallah, O.; Hamdaoui, M.; Brendlé, J. Properties of recycled PP/clay filaments used for simulation of wastewater treatment filter. J. Text. Inst. 2021, 112, 1753–1762. [Google Scholar] [CrossRef]
- Zdiri, K.; Elamri, A.; Harzallah, O.; Hamdaoui, M. Thermo-Mechanical Characterization of Post-consumer PP/Tunisian Organo-Clay Filaments. In Advances in Applied Research on Textile and Materials—IX. CIRATM 2020 Springer Proceedings in Materials; Msahli, S., Debbabi, F., Eds.; Springer Nature: Cham, Switzerland, 2022; Volume 17, pp. 29–35. [Google Scholar]
- binti Hashim, H.; binti Emran, N.A.A.; Isono, T.; Katsuhara, S.; Ninoyu, H.; Matsushima, T.; Yamamoto, T.; Borsali, R.; Satoh, T.; Tajima, K. Improving the mechanical properties of polycaprolactone using functionalized nanofibrillated bacterial cellulose with high dispersibility and long fiber length as a reinforcement material. Compos. Part A Appl. Sci. Manuf. 2022, 158, 106978–106986. [Google Scholar] [CrossRef]
- Liu, H.; Huang, Y.; Yuan, L.; He, P.; Cai, Z.; Shen, Y.; Xu, Y.; Yu, Y.; Xiong, H. Isothermal crystallization kinetics of modified bamboo cellulose/PCL composites. Carbohydr. Polym. 2010, 79, 513–519. [Google Scholar] [CrossRef]
- del Ángel-Sánchez, K.; Borbolla-Torres, C.I.; Palacios-Pineda, L.M.; Ulloa-Castillo, N.A.; Elías-Zúñiga, A. Development, fabrication, and characterization of composite polycaprolactone membranes reinforced with TiO2 nanoparticles. Polymers 2019, 11, 1955–1968. [Google Scholar] [CrossRef]
- Zdiri, K.; Elamri, A.; Hamdaoui, M.; Harzallah, O.; Khenoussi, N.; Brendlé, J. Valorization of Post-consumer PP by (Un)modified Tunisian Clay Nanoparticles Incorporation. Waste Biomass Valor. 2020, 11, 2285–2296. [Google Scholar] [CrossRef]
- Unger, M.; Vogel, C.; Siesler, H.W. Molecular Weight Dependence of the Thermal Degradation of Poly(ε-caprolactone): A Thermogravimetric Differential Thermal Fourier Transform Infrared Spectroscopy Study. Appl. Spectrosc. 2010, 64, 805–809. [Google Scholar] [CrossRef]
- Persenaire, O.; Alexandre, M.; Degée, P.; Dubois, P. Mechanisms and kinetics of thermal degradation of poly(ε-caprolactone). Biomacromolecules 2001, 2, 288–294. [Google Scholar] [CrossRef]
- Ruseckaite, R.A.; Jiménez, A. Thermal degradation of mixtures of polycaprolactone with cellulose derivatives. Polym. Deg. Stab. 2003, 81, 353–358. [Google Scholar] [CrossRef]
- Krokida, M.K.; Panagiotou, N.M.; Maroulis, Z.B.; Saravacos, G.D. Thermal conductivity: Literature data compilation for foodstuffs. Int. J. Food Prop. 2001, 4, 111–137. [Google Scholar] [CrossRef]
- Carmona, V.B.; de Campos, A.; Marconcini, J.M.; Mattoso, L.H.C. Kinetics of thermal degradation applied to biocomposites with TPS, PCL and sisal fibers by non-isothermal procedures. J. Therm. Anal. Calorim. 2014, 115, 153–160. [Google Scholar] [CrossRef]
- Masanabo, M.A.; Tribot, A.; Luoma, E.; Sharmin, N.; Sivertsvik, M.; Emmambux, M.N.; Keranen, J. Faba bean lignocellulosic sidestream as a filler for the development of biodegradable packaging. Polym. Test. 2023, 123, 108047–108056. [Google Scholar] [CrossRef]


| Component | Borlotti Beans (% wt) * | Green Beans (% wt) * |
|---|---|---|
| Waxes | 5 | 8 |
| Pectin | 11 | 27 |
| Lignin | 9 | 6 |
| Hemicellulose | 68 | 7 |
| Cellulose | 7 | 52 |
| From TGA | From DTG | ||||
|---|---|---|---|---|---|
| Samples | Water Loss % | Tonset (°C) | Residue % | Tmax1 (°C) | Tmax2 (°C) |
| G1 | 8.0 | 235.4 | 27.9 | 252.8 | 310.1 |
| G1-Soap | 10.4 | 233.0 | 23.5 | 252.3 | 308.8 |
| G1-Tol-EtOH | 8.0 | 232.6 | 22.6 | 252.1 | 309.4 |
| G1-Oxa | 7.4 | 284.2 | 16.7 | - | 346.2 |
| G1-Buffer | 7.0 | 284.0 | 18.1 | - | 349.3 |
| G1-KOH | 8.0 | 266.9 | 23.6 | - | 326.7 |
| From TGA | From DTG | ||||||
|---|---|---|---|---|---|---|---|
| Samples | Water Loss % | Tonset (°C) | Residue % | Tmax1 (°C) | Tmax2 (°C) | Tmax3 (°C) | Tmax4 (°C) |
| B1 | 5.2 | 267.3 | 26.6 | 261.2 | 286.4 | - | 325.7 |
| B1-Soap | 12.0 | 276.2 | 17.9 | 244.3 | - | 308.2 | 341.2 |
| B1-Tol-EtOH | 9.7 | 280.6 | 16.5 | 243.1 | 303.4 | 309.6 | 340.8 |
| B1-Oxa | 10.7 | 226.0 | 24.7 | 226.0 | 293.2 | - | 345.9 |
| B1-Buffer | 9.7 | 273.1 | 21.3 | 277.8 | 292.9 | - | - |
| From 1° Cooling | From 2° Heating | ||||||
|---|---|---|---|---|---|---|---|
| Samples | Tc (°C) | ΔHc (J/g) | Tg (°C) | ΔCp (J/g °C) | Tm (°C) | ΔHm (J/g) | χ% * |
| PCL | 32.6 | −63.4 | −64.0 | 0.085 | 57.4 | 66.7 | 49.4 |
| PCL5B1 | 28.4 | −78.3 | −64.7 | 0.14 | 56.9 | 92.2 | 71.9 |
| PCL40B1 | 29.4 | −48.9 | −64.5 | 0.10 | 56.3 | 58.0 | 71.6 |
| PCL5G1 | 29.0 | −76.5 | −64.6 | 0.11 | 56.6 | 84.3 | 65.7 |
| PCL40G1 | 32.3 | −44.7 | −65.0 | 0.12 | 56.7 | 51.5 | 63.6 |
| From TGA | From DTG | |||||||
|---|---|---|---|---|---|---|---|---|
| Samples | Tonset (°C) | T5% (°C) | T30% (°C) | T50% (°C) | T80% (°C) | Residue % | Tmax (°C) * | Other Peak (°C) |
| PCL ** | 395.3 | 386.5 | 408.1 | 417.1 | 431.2 | 1.1 | 418.0 | - |
| PCL5B1 | 264.2 | 355.6 | 403.4 | 413.0 | 426.8 | 2.1 | 417.1 | - |
| PCL40B1 | 263.6 | 233.9 | 367.3 | 397.0 | 418.0 | 9.9 | 410.0 | 287.5 |
| PCL5G1 | 239.2 | 340.9 | 397.2 | 407.3 | 420.9 | 1.2 | 411.6 | - |
| PCL40G1 | 239.2 | 237.2 | 362.8 | 386.1 | 409.2 | 11.4 | 395.1 | 256.0 308.0 |
| Samples | Young’s Modulus (MPa) | Elongation at Break (%) | Tensile Strength (MPa) |
|---|---|---|---|
| PCL | 600 ± 20 | 590 ± 90 | 47 ± 8 |
| PCL5B1 | 600 ± 30 | 140 ± 90 | 15 ± 3 |
| PCL40B1 | 1010 ± 40 | 25 ± 8 | 2.1 ± 0.8 |
| PCL5G1 | 650 ± 70 | 30 ± 10 | 12 ± 4 |
| PCL40G1 | 1050 ± 50 | 4.2 ± 0.9 | 5.1 ± 0.6 |
Disclaimer/Publisher’s Note: The statements, opinions and data contained in all publications are solely those of the individual author(s) and contributor(s) and not of MDPI and/or the editor(s). MDPI and/or the editor(s) disclaim responsibility for any injury to people or property resulting from any ideas, methods, instructions or products referred to in the content. |
© 2023 by the authors. Licensee MDPI, Basel, Switzerland. This article is an open access article distributed under the terms and conditions of the Creative Commons Attribution (CC BY) license (https://creativecommons.org/licenses/by/4.0/).
Share and Cite
De Monte, C.; Arrighetti, L.; Ricci, L.; Civello, A.; Bronco, S. Agro-Waste Bean Fibers as Reinforce Materials for Polycaprolactone Composites. Compounds 2023, 3, 504-520. https://doi.org/10.3390/compounds3030036
De Monte C, Arrighetti L, Ricci L, Civello A, Bronco S. Agro-Waste Bean Fibers as Reinforce Materials for Polycaprolactone Composites. Compounds. 2023; 3(3):504-520. https://doi.org/10.3390/compounds3030036
Chicago/Turabian StyleDe Monte, Cristina, Leonardo Arrighetti, Lucia Ricci, Alessandra Civello, and Simona Bronco. 2023. "Agro-Waste Bean Fibers as Reinforce Materials for Polycaprolactone Composites" Compounds 3, no. 3: 504-520. https://doi.org/10.3390/compounds3030036