Article

Perovskite-Type Oxide Catalysts in CO2 Utilization: A Principal Study of Novel Cu-Doped Perovskites for Methanol Synthesis

1
Institute of Materials Chemistry, Technische Universität Wien, Getreidemarkt 9/165-PC, 1060 Vienna, Austria
2
Department of Analytical and Physical Chemistry, Chair of Physical Chemistry, Montanuniversität Leoben, Franz Josef-Straße 18, 8700 Leoben, Austria
*
Author to whom correspondence should be addressed.
Compounds 2022, 2(4), 378-387; https://doi.org/10.3390/compounds2040031
Submission received: 26 August 2022 / Revised: 31 October 2022 / Accepted: 28 November 2022 / Published: 14 December 2022
(This article belongs to the Special Issue Feature Papers in Compounds (2022–2023))

Abstract

:
Six different perovskite-type oxides were investigated with respect to their ability for methanol synthesis via H2 and CO2: Fe-, Mn-, and Ti-based perovskites were prepared with and without Cu doping. For assessment, the catalysts were subjected to preliminary tests at atmospheric pressure to evaluate their ability to activate CO2. Additional catalytic tests with the doped versions of each catalyst type were carried out in a pressured reactor at 21 bar. After the measurements, the catalysts were characterized with X-ray diffraction (XRD) and scanning electron microscopy (SEM). All catalysts were able to produce methanol in the pressure tests. CO2 conversions between 14% and 23% were reached at 400 °C, with the highest methanol selectivity at the lower temperature of 250 °C. The combination of XRD and SEM revealed that the Fe-based and Ti-based perovskites were stable under reaction conditions and that catalytically highly active and stable nanoparticles had formed. The minor formation of CaCO3, which is a deactivating phase, was observed for one catalyst. These nanoparticles showed resistance to coking and sintering. However, the yield and selectivity for methanol need to be improved via the further tailoring of the perovskite composition.

Graphical Abstract

1. Introduction

CO2 concentrations in Earth’s atmosphere are steadily on the rise, contributing to climate change in a major way. Climate change not only constitutes a challenge to our current way of life; it also requires immediate action to reduce the CO2 level in the atmosphere. However, CO2 can be seen as an important C1 feedstock and therefore an abundant resource as well. A possible way to reduce CO2 emissions is to directly use it at its point of origin (for instance in manufacturing plants of heavy industry). Examples of suitable reactions for this approach are listed as follows. For instance, methane dry reforming could be utilised, where CO2 reacts directly with CH4 forming synthesis gas, which can be converted into more valuable products [1,2]. Another method of CO2 utilisation is the reverse Water-Gas Shift (rWGS) reaction, where CO2 reacts with H2, forming synthesis gas as well [3]. A reaction that eliminates the intermediate step via gas synthesis is direct methanol synthesis using CO2 and H2 according to Equation (1). The equation clearly shows that high pressures favour the reaction and are therefore needed for good yields:
CO2(g) +3H2(g) ⇌ CH3OH(g) + H2O(g)H = −50 kJ·mol−1)
According to Dang et al. [4], there are three main material categories for heterogeneous methanol catalysis: metal-based catalysts, e.g., Cu catalysts; oxygen-deficient materials, such as In2O3 [5]; and other systems with novel catalyst structures and mechanisms (e.g., frustrated Lewis pairs in UiO-66x [6]). In industry, a catalyst consisting of Cu on ZnO/Al2O3 has been used for the last 50 years. It is, however, suffering from stability problems caused by sintering [7].
In case of the metal-based systems, catalysts relying on Cu are the most prominent and interesting. For metallic Cu as the active site, both experimental results as well as DFT calculations have shown two possible pathways: One pathway proposes the formation of a formate intermediate, which is then hydrogenated stepwise to methanol [8,9]. The other pathway consists of a rWGS reaction of adsorbed CO2 and a subsequent hydrogenation of the formed CO [10]. In either pathway, the adsorption and activation of CO2 is the first reaction step. The adsorption site of the CO2 molecule was proposed to be the support oxide (mostly ZnO) in several studies [11,12,13].
Regarding catalysts with oxygen deficiency, In2O3 exhibited the most promising results [5]. According to DFT calculations by Ye et al. [14], methanol should be a favoured product on a In2O3 surface with oxygen defects. The calculated mechanism is based on an alternating filling and creation of these vacancies. Practical experiments carried out by Martin et al. [5] supported these findings, showing an extremely high selectivity at higher temperatures (100% methanol at 300 °C) and excellent catalyst stability over 1000 h reaction time.
In our work, we try to combine the two main approaches (catalytically active metal with oxygen deficiency) by utilizing Cu-doped perovskite oxides. Perovskite-type oxides have the general formula ABO3 with A and B being cations of different size. Both A- and B-sites can be doped, which leads to a very versatile class of materials with a lot of tuning potential [15]. Further doping with easily reducible elements can lead to the formation of stable, metallic nanoparticles on the catalyst surface during a pre-reduction step. This process is known as exsolution [16]. In previous work, our group has already shown the potential of utilizing these exsolved nanoparticles in heterogeneous catalysis. Specifically, CO2 utilization and activation with the rWGS reaction and the dry reforming of methane showed promising results [3,17]. Furthermore, in this reaction, the formation and reactivity of oxygen vacancies also play a substantial role. The exsolved nanoparticles have an advantage over deposited nanoparticles as they are socketed in the remaining perovskite support and are therefore resistant to sintering as well as cocking as demonstrated by Neagu et al. [16].
Therefore, we chose three classes of perovskite-type oxides and compared a B-site-doped version with Cu with a corresponding material without active metal species. Firstly, the Nd0.6Ca0.4Fe1−xCuxO3−δ (x = 0.0, 0.1) catalysts are based on materials that are very active for rWGS [3]. There, the Ca-doping on the A-site facilitates the formation of oxygen vacancies, while the Cu-doping on the B-site leads to the formation of active Cu nanoparticles. For the Ca0.9Ce0.1Mn1−xCuxO3−δ (x = 0.0, 0.1) catalysts, we wanted to investigate the rich redox chemistry of Ce and Mn and their influence on the catalytic activity. The SrTi0.7Fe0.3O3−δ and SrTi0.68Fe0.29Cu0.03O3−δ catalysts were chosen, as Ti shows good redox activity, and the material is already commonly used in the perovskite community.

2. Materials and Methods

2.1. Synthesis

Nd0.6Ca0.4Fe1−xCuxO3−δ (with x = 0.0 and x = 0.1 referred to as NCF and NCF-Cu, respectively) and Ca0.9Ce0.1Mn1−xCuxO3−δ (with x = 0.0 and x = 0.1 referred to as CCM and CCM-Cu, respectively) catalysts were synthesised via the Pechini method [3,15]. As raw materials, necessary amounts of Nd2O3 (99.9%, Strategic Elements, Deggendorf), CaCO3 (99.95%, Sigma-Aldrich, St. Louis, MO, USA), Fe (99.5%, Sigma-Aldrich, St. Louis, MO, USA), Cu(NO3)2·6H2O (99.99%, Sigma-Aldrich, St. Louis, MO, USA), Ce(NO3)3·7H2O (extra pure, Alfa Aesar, Havervill, MA, USA), and Mn(NO3)2·4H2O (99%, Merck, Darmstadt, Germany) were dissolved in HNO3 (doubly distilled, 65%, Merck, Darmstadt, Germany). After addition of an excess of citric acid (99.9998%, trace metal pure, Fluka, Honeywell International, Charlotte, NC, USA), the solutions were mixed, and the solvent was evaporated until self-ignition. The formed gel was calcinated at 800 °C for 3 h in air. Phase purity was determined with powder XRD measurements. To achieve phase purity for CCM and CCM-Cu, an additional sintering step at 1200 °C for 12 h was necessary.
For SrTi0.7Fe0.3O3−δ and SrTi0.68Fe0.29Cu0.03O3−δ (referred to as STF and STF-Cu, respectively) the proper amounts of SrCO3 (99.9%, Sigma-Aldrich, St. Louis, MO, USA), TiO2 (99.5%, Sigma-Aldrich, St. Louis, MO, USA), Fe (99.5%, Sigma-Aldrich, St. Louis, MO, USA), and Cu(NO3)2·6H2O (99.99%, Sigma-Aldrich, St. Louis, MO, USA) were mixed and ground in a planetary ball mill. Afterwards, the powder was sintered in two steps: at 1000 °C for 10 h and 1200 °C for 12 h with a grinding step in between. Phase purity was confirmed with powder XRD.

2.2. Catalytic Testing

For the preliminary test at ambient pressure, a setup already described in several other works [3,18] was used. The product gas was sampled continuously using a microgas chromatograph (Micro-GC, Fusion 3000A, Inficon). After an oxidizing pretreatment (600 °C, 10 mL·min−1 O2, 30 min) to achieve a defined starting point, the gas mixture was set to the reaction conditions (6 mL·min−1 Ar, 1.5 mL·min−1 CO2, and 4.5 mL·min−1 H2) and the temperature was raised from 200 °C to 600 °C in 100 °C steps, holding each step for 40 to 60 min. The exact masses used for the tests can be found in Table S1 in the Supporting Information.
The setup for the pressure measurements is described by Pacholik et al. [19]. 1 g of each catalyst was oxidized at 600 °C in O2 first, before being reduced in wet H2 (H2 led through a water saturator at room temperature) at the appropriate temperature (NCF-Cu: 500 °C, STF-Cu: 700 °C, CCM-Cu: 300 °C). Humidification of hydrogen was chosen to achieve comparability with upcoming work, where humidified hydrogen will be necessary to enable triggering of exsolution by electrical biases of the same reducing power. Afterwards the reaction gas mixture (1 mLN·min−1 He + 3 mLN·min−1 H2 + 1 mLN·min−1 CO2) as in the preliminary tests was introduced and the temperature was raised stepwise from 100 °C to 400 °C in 50 °C steps, equilibrating each step for 8 to 12 h. The setup was operating at 21 bar and the product gas was again analysed by Micro-GC.

2.3. Characterization Techniques

SEM (scanning electron microscopy) images were recorded using a Quanta 250 FEGSEM (FEI Company, Hillsboro, OR, USA) microscope additionally fitted with an Octane Elite X-ray detector (EDAX Inc, Mahwah, NJ, USA). An accelerating voltage of 5 kV was used.
For powder XRD (X-ray diffraction) experiments, a PANalytical X’Pert Pro diffractometer (Malvern PANalyticals, Malvern, UK) was used. It operated in Bragg–Brentano geometry (with separated Cu Kα1,2 radiation) with an X’Celerator linear detector (Malvern PANalytical, Malvern, UK).

3. Results

3.1. Preliminary Tests

To investigate the capability of the catalysts to activate CO2, they were first tested at ambient pressure as described in Section 2.2. Without applying pressure, the predominant reaction was rWGS, which we interpreted as an indication of the activity of the catalyst. It became clear that the NCF family yielded the most CO (Table 1) and hence were best suited to activate CO2. The CO yield in case of STF and STF-Cu catalysts was a bit lower with no significant difference between these two at the final temperature. CCM and CCM-Cu showed the lowest activity for CO2 activation, but there was still a significant amount of CO being produced. Interestingly, the only catalyst showing a pronounced effect of the Cu doping was the NCF: with B-site doping, the CO2 conversion nearly doubled. The reason for this appears to be in situ exsolution happening during the reaction. XRD measurements (see Figure S1 in the supporting information) before and after the reaction proved the emergence of metallic Cu and Fe as well as CaCO3. Metallic Cu acts as a catalyst for rWGS, thus explaining the increase in activity in comparison with the version without Cu. The SEM images after the reaction (see Figure S2 in the supporting information) showed no formed nanoparticles. However, flakes, most likely CaCO3, could be seen, which point to catalyst deactivation. This means that the formed nanoparticles were either too small to be detected in the SEM measurements or were still inside the catalyst and not on the surface.

3.2. Pressure Tests

3.2.1. Catalytic Performance

For the tests under pressure (21 bar), the three catalysts with Cu doping were chosen and pretreated in hydrogen to exsolve the metallic nanoparticles prior to the catalytic tests. The temperature after the pretreatment was increased stepwise as described in Section 2.2. In Figure 1, the results for NCF-Cu are displayed. Only CH4 and CH3OH were displayed for clarity. However, it should be noted that CO was clearly the main product of the reaction in all cases. For the two side products considered, it can be seen that the production of methanol started at 250 °C and increased up to 300 °C before falling again at higher temperatures. In contrast, CH4 was only detected above 250 °C, from which point its concentration increased at each step until the end of the measurement, overtaking CH3OH at 350 °C.
The other catalysts showed similar behaviour regarding the methanol production (as seen in Figures S3 and S4 in the supporting information). In every case, methanol was produced starting at low temperatures (250 °C), but the yield peaked between 300 °C and 350 °C and decreased at higher temperatures. CH4 is always the dominant species at 400 °C, but the point of overtaking happened at widely different temperatures for the different catalysts: For NCF-Cu (350 °C) and STF-Cu (400 °C) the temperatures at which CH4 overtook CH3OH lie in the upper range of the measurement, but with CCM-Cu, the same phenomenon had already occurred at 250 °C. Comparing the respective yields of the measurements shows that the NCF-Cu produced the most methanol, peaking at 0.17% yield. Meanwhile, CCM-Cu and STF-Cu both peaked at 0.11% yield for methanol.
CH4 production for STF-Cu started only at the 300 °C step. Afterwards, the yield of CH4 increased sharply. Methanol could be detected from the beginning of the measurement in low amounts. The yield for methanol remained constant before rising at 250 °C, peaking at 300 °C, and declining after that.
The CCM-Cu catalyst also started to produce methanol at 250 °C. At higher temperatures, the CH3OH yield peaked at 300 °C before declining. In contrast, the methane yield for this catalyst was present at 250 °C for the first time, matching the methanol yield for this step. Afterwards, a constant rise up to 350 °C was observed, where a plateau appeared to be reached. As discussed in latter sections, the CCM-Cu catalyst was decomposing during the measurement, meaning the catalyst changed completely during the experiment. Therefore, a direct comparison of the different temperature steps has to be done carefully.
Regarding conversion rates of CO2, thermodynamic equilibrium was not reached in any test: At 400 °C the CO2 conversion was around 23% for NCF-Cu, 14% for STF-Cu and 19% for CCM-Cu—therefore catalyst performance can be compared.
In Figure 2, the selectivities of each catalyst are compared. The main product at each step was CO by a large margin (the y-axis is cut off at 80% for that reason). For each temperature, the bars represent NCF-Cu, STF-Cu, and CCM-Cu from left to right. When looking at the filled-out parts of the bars (symbolizing methanol selectivity), the CH3OH selectivity is decreasing progressively with increasing temperature in case of NCF-Cu. The other two catalysts showed similar methanol selectivities at 250 °C and 300 °C, but in both cases, it decreased beyond that. The onset of the rWGS reaction seemed to have the largest adverse effect on CH3OH. In each case, the CO selectivity was above 95% at 400 °C. Furthermore, methane production started at higher temperatures as mentioned above. The methane selectivity is represented by the dotted area on the tops of the respective bars. For CCM-Cu, the methane selectivity already matched the methanol selectivity at 250 °C. In case of the other two catalysts, CH4 selectivity became an issue at 300 °C (NCF-Cu) and 350 °C (STF-Cu), respectively.

3.2.2. XRD Characterization

To analyse changes to the catalysts during the reaction, XRD measurements were performed. The results were compared with measurements of the respective pristine catalysts. In Figure 3, the XRD patterns for NCF-Cu before and after the reaction are compared. The reflexes corresponding to the perovskite are marked with triangles and remained unchanged after the reaction. This showed the backbone of the perovskite indeed to be stable under reaction conditions. Moreover, it proves that the catalyst still mainly consists of a perovskite phase. Additionally, there was some exsolution of metallic Fe and Cu visible, marked with a diamond and circles, respectively. These phases show that active metals were exsolved as intended. Unfortunately, CaCO3 (marked with a double triangle) could also be detected. This is a deactivation phenomenon also observed in previous works, where CaCO3 crystals start to cover the active catalyst surface [15,20].
For STF-Cu (Figure S5 in the supporting information), the perovskite structure was also stable throughout the reaction. Additional phases appearing after the reaction could be identified as Cu2O and Fe. Here, the Cu was present in an oxidic state, indicating some oxidation process along the way that interestingly did not affect the Fe. Additionally, a shift of about 0.2° in all reflexes to lower diffraction angles was observed, which indicates an increase in the perovskite lattice parameters.
The XRD measurements for CCM-Cu (Figure S6 in the supporting information) showed that this catalyst decomposed almost completely during the reaction, forming mainly oxides of its constituents. Aside from the expected MnO and CeO2, copper oxalate and metallic Cu could be detected as well. There was still a perovskite phase visible after the reaction, albeit with a significantly reduced intensity compared with the pristine catalyst. Additionally, a slight shift of the phase could be detected at higher diffraction angles, which points to a change of composition. Considering the other detected oxides, the more stable CaMnO3 would be a possibility.
A comparison of the XRD data for all catalysts reveals that the perovskite backbone was stable during the reaction in the cases of STF-Cu and NCF-Cu. Additionally, the active metal species did exsolve during the pre-treatment. These particles were distributed uniformly. These exsolved nanoparticles provide a stable alternative to deposited ones as has already been shown in previous work [16]. Furthermore, Fe could be also detected in both catalysts. In the NCF-Cu case, a deactivation phenomenon in the form of CaCO3 formation occurred. Unfortunately, CCM-Cu was not stable under reaction conditions and showed decomposition into its oxides. This shows that this catalyst is not useful for more in-depth investigations in its current form and needs to be modified to be of further interest. However, no traces of crystalline surface carbon could be detected in any experiment. We expect carbon deposition via CNT or other crystalline species formation, as the metallic nanoparticles can dissolve carbon and subsequently form CNTs. The formation of crystalline carbon on perovskite catalysts has already been reported by our group in previous works [3,17].

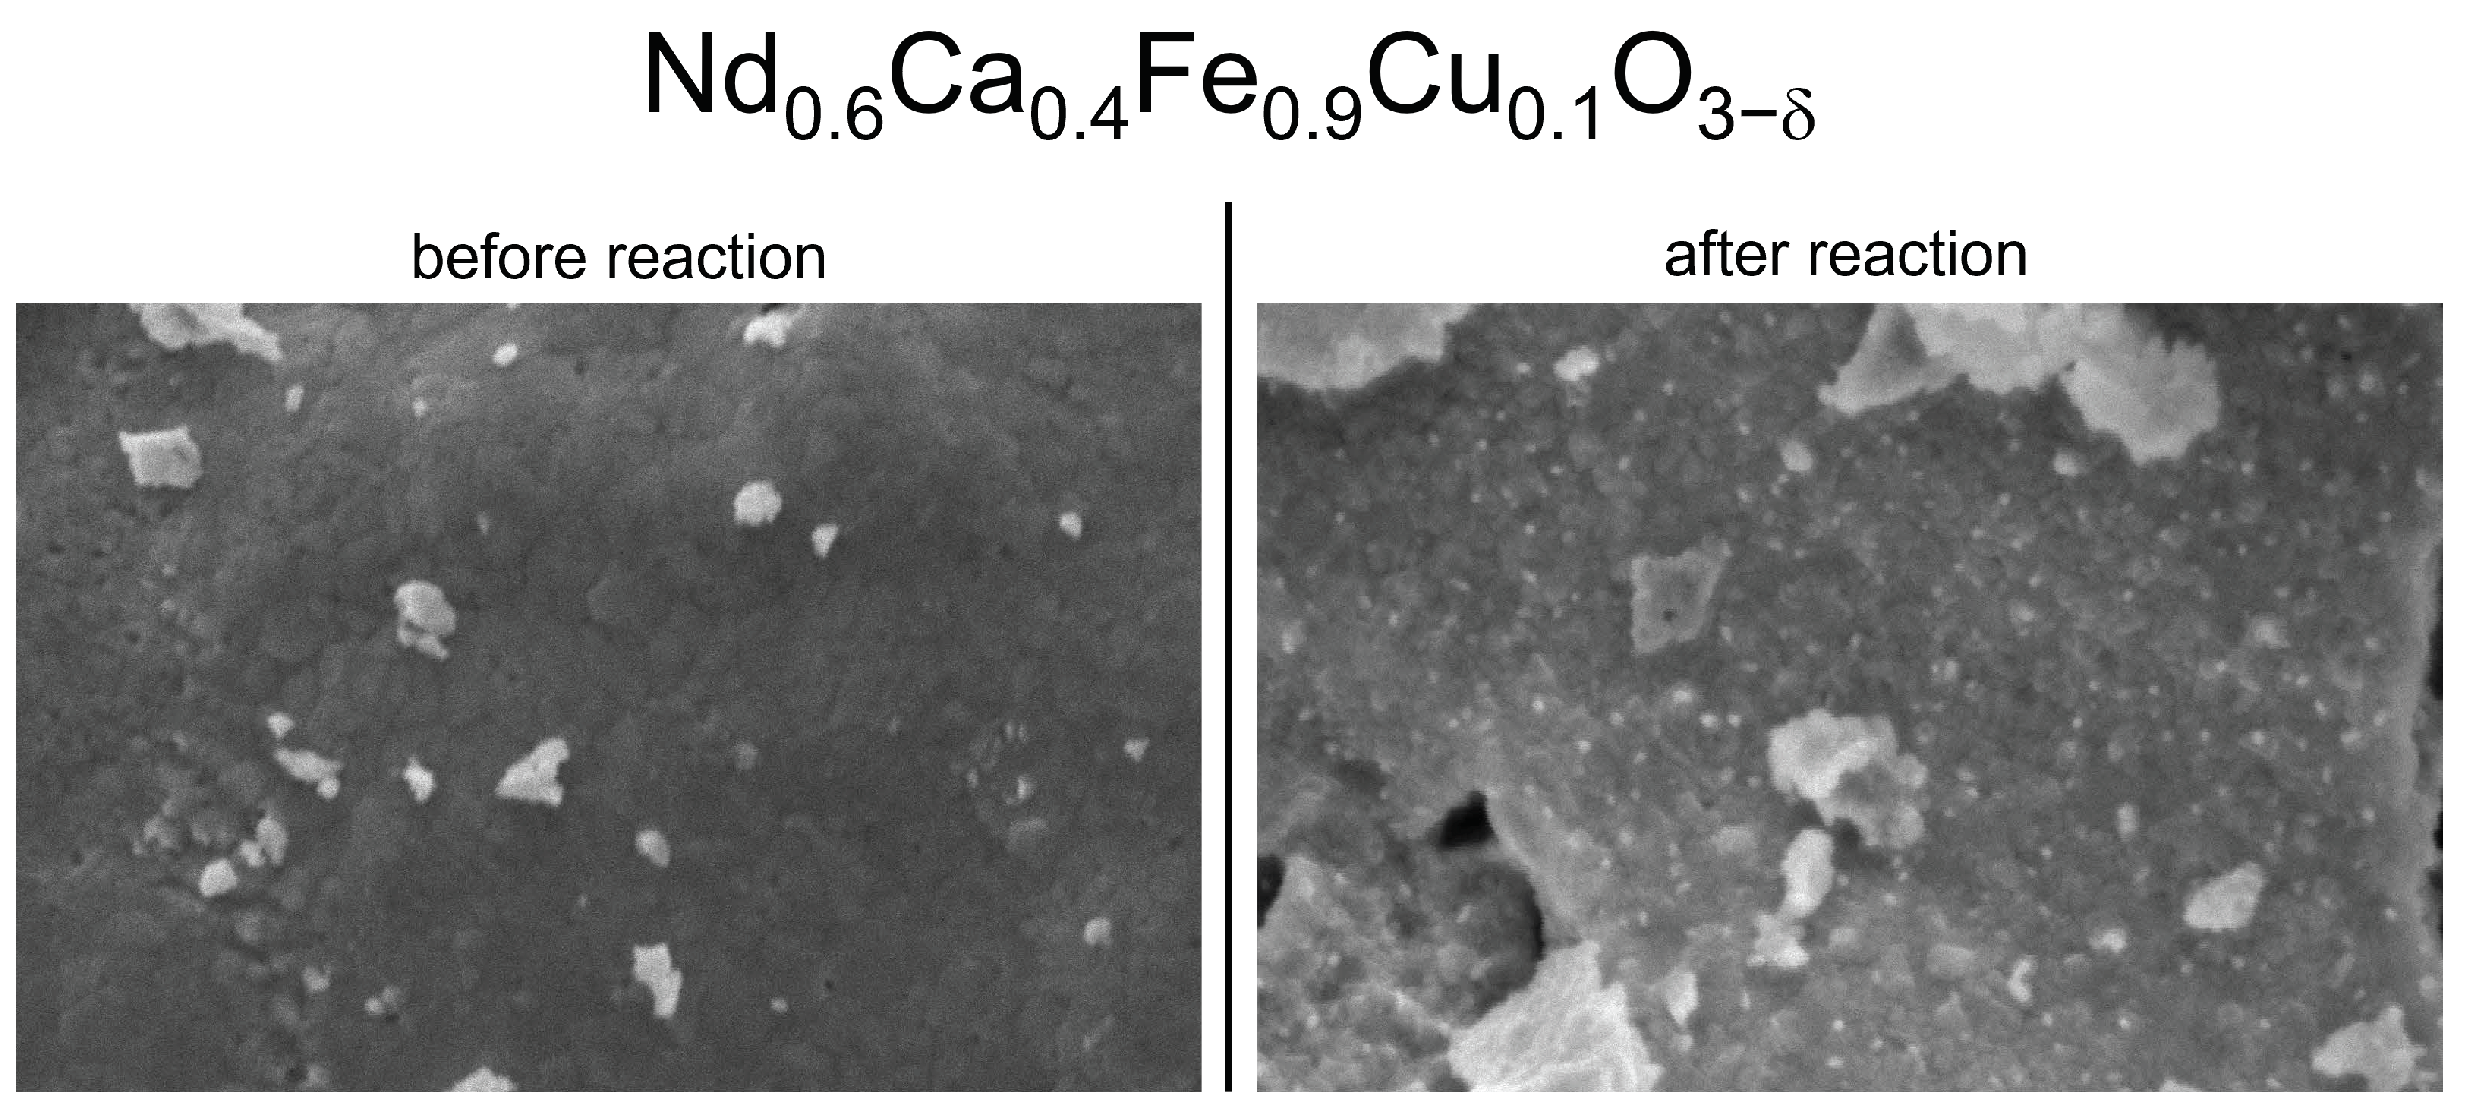
3.2.3. SEM Characterization

We studied the morphology of the catalyst surfaces before and after the reaction with scanning electron microscopy (SEM). In Figure 4, NCF-Cu is displayed exemplarily. On the left, the pristine sample is shown with a mainly smooth surface and some flakes (remnants of the grinding process) sitting on top. After the reaction, uniformly distributed nanoparticles can be seen. Measuring the sizes of the nanoparticles showed diameters between 40 nm and 60 nm. The formation of the nanoparticles most likely occurred during the reductive pretreatment, as the reductive power of the gas phase was the strongest in this step. Since the SEM measurements were carried out after the reaction, the formed nanoparticles were already subject to reaction conditions. The particles were still distributed uniformly, meaning they were resistant to sintering under these conditions.
In case of STF-Cu, the SEM images are displayed in Figure S7 in the supporting information. As this sample had a different synthesis method, the sample surface is very smooth from the beginning. The nanoparticles formed after pretreatment and reaction are smaller compared with NCF-Cu. They are ranging in diameter from 10 nm to 30 nm. Furthermore, the catalyst surface was still very smooth even with nanoparticles and did not show significant differences to the one before the reaction. This serves as additional proof that the fundamental perovskite structure is resistant to the reaction conditions, both structurally and morphologically.
For CCM-Cu, the decomposition products formed particles on the surface that contrasted strongly with the smooth surface before the reaction (Figure S8 in the supporting information). Before the reaction, the surface was very smooth, which is most likely due to the sintering process, and only a few particles were visible on the surface. Step-like structures were also visible before the reaction. None of these structures were present after the reaction took place. The formed oxides and other products seen in the XRD measurements changed the smooth surface into a collection of particles with sizes of a few 100 nm.
We could show that two out of our three chosen perovskites are stable under conditions suitable for methanol synthesis. The reducing pretreatment led to the exsolution of nanoparticles, which could be proven with SEM images. The nature of the nanoparticles was either metallic or oxidic in one instance (Cu2O in the case of STF-Cu), which was proven by XRD measurements. The catalysts produced methanol at higher pressures. It should be noted that the amount of methanol produced is at the moment far from the range of other catalysts that have been investigated recently [21,22]. The selectivity for methanol was the main problem as the main products of the reaction were CO and CH4 at higher temperatures. In the area of selectivity are recently investigated catalysts that currently outperform our materials as well [5,23]. However, our findings reported here should be interpreted as proof of concept and illustrate the potential of perovskite-type oxides as catalysts in methanol synthesis. As mentioned in Section 1, these materials are very versatile and can be tuned easily. Therefore, we encourage other researchers to investigate the use of perovskites in methanol synthesis further.

4. Conclusions

In conclusion, we showed that two of the three perovskites (NCF-Cu and STF-Cu) are stable under reaction conditions. These perovskites exsolved catalytically active nanoparticles during pretreatment. The third investigated catalyst (CCM-Cu) decomposed during the reaction. This catalyst needs further refinement to increase its stability under conditions suitable for methanol synthesis. Methanol was produced under pressure by all catalysts; however, the yield was low. The main reaction product was CO via rWGS reaction. With respect to deactivation effects, XRD measurements showed CaCO3 formation for NCF-Cu reducing its catalytically active surface area. In contrast, no crystalline carbon depositions were observed in the XRD measurements and the SEM images of the other catalysts. Moreover, the SEM images showed a homogenous distribution of the exsolved nanoparticles, highlighting their sintering resistance. It should be noted that perovskites can be tuned in several different ways to increase the activity for methanol synthesis. We proved that perovskites are generally applicable for this reaction.

Supplementary Materials

The following supporting information can be downloaded at: https://www.mdpi.com/article/10.3390/compounds2040031/s1, Table S1: Masses of the catalysts used for each test; Figure S1: XRD measurement of NCF-Cu (before and after reaction); Figure S2: SEM images of NCF-Cu (before and after reaction), Figure S3: CH4 and CH3OH yields vs. temperature curves for STF-Cu, Figure S4: CH4 and CH3OH yields vs. temperature curves for CCM-Cu, Figure S5: XRD patterns of STF-Cu (before and after reaction); Figure S6: XRD patterns of CCM-Cu (before and after reaction), Figure S7: SEM images of STF-Cu (before and after reaction), Figure S8: SEM images of CCM-Cu (before and after reaction).

Author Contributions

Conceptualization, C.R. and K.F.; methodology, F.S., L.L., C.R. and G.P.; validation, F.S., L.L. and G.P.; formal analysis, F.S., L.L., T.R. and G.P.; investigation, F.S., L.L., G.P., T.N., T.M.B., H.D. and R.R.; resources, C.R. and K.F.; data curation, F.S.; writing—original draft preparation, F.S.; writing—review and editing, T.R., L.L. and C.R.; visualization, F.S., R.R., T.R. and L.L.; supervision, C.R. and K.F.; project administration, C.R. and K.F.; funding acquisition, C.R. and K.F. All authors have read and agreed to the published version of the manuscript.

Funding

This project has received funding from the European Research Council (ERC) under the European Union’s Horizon 2020 research and innovation programme (grant agreement n° 755744/ERC-Starting Grant TUCAS).

Data Availability Statement

The data presented in this study are available on request from the corresponding author.

Acknowledgments

The X-ray measurements were carried out within the X-Ray Center of TU Wien. The SEM images were taken at USTEM TU Wien.

Conflicts of Interest

The authors declare no conflict of interest.

References

  1. Pakhare, D.; Spivey, J. A review of dry (CO2) reforming of methane over noble metal catalysts. Chem. Soc. Rev. 2014, 43, 7813–7837. [Google Scholar] [CrossRef] [PubMed]
  2. Kuzhaeva, A.A.; Dzhevaga, N.V.; Berlinskii, I.V. The processes of hydrocarbon conversion using catalytic systems. In Proceedings of the International Scientific Conference on Applied Physics, Information Technologies and Engineering (APITECH) and 2nd International Scientific and Practical Conference on Borisov’s Readings, Krasnoyarsk, Russia, 25–27 September 2019. [Google Scholar]
  3. Lindenthal, L.; Popovic, J.; Rameshan, R.; Huber, J.; Schrenk, F.; Ruh, T.; Nenning, A.; Löffler, S.; Opitz, A.K.; Rameshan, C. Novel perovskite catalysts for CO2 utilization—Exsolution enhanced reverse water-gas shift activity. Appl. Catal. B 2021, 292, 120183. [Google Scholar] [CrossRef]
  4. Dang, S.S.; Yang, H.Y.; Gao, P.; Wang, H.; Li, X.P.; Wei, W.; Sun, Y.H. A review of research progress on heterogeneous catalysts for methanol synthesis from carbon dioxide hydrogenation. Catal. Today 2019, 330, 61–75. [Google Scholar] [CrossRef]
  5. Martin, O.; Martin, A.J.; Mondelli, C.; Mitchell, S.; Segawa, T.F.; Hauert, R.; Drouilly, C.; Curulla-Ferre, D.; Perez-Ramirez, J. Indium Oxide as a Superior Catalyst for Methanol Synthesis by CO2 Hydrogenation. Angew. Chem. Int. Ed. 2016, 55, 6261–6265. [Google Scholar] [CrossRef]
  6. Ye, J.Y.; Johnson, J.K. Screening Lewis Pair Moieties for Catalytic Hydrogenation of CO2 in Functionalized UiO-66. ACS Catal. 2015, 5, 6219–6229. [Google Scholar] [CrossRef]
  7. Bowker, M. Methanol Synthesis from CO2 Hydrogenation. ChemCatChem 2019, 11, 4238–4246. [Google Scholar] [CrossRef] [Green Version]
  8. Kattel, S.; Ramirez, P.J.; Chen, J.G.; Rodriguez, J.A.; Liu, P. Active sites for CO2 hydrogenation to methanol on Cu/ZnO catalysts. Science 2017, 355, 1296–1299. [Google Scholar] [CrossRef] [Green Version]
  9. Larmier, K.; Liao, W.C.; Tada, S.; Lam, E.; Verel, R.; Bansode, A.; Urakawa, A.; Comas-Vives, A.; Coperet, C. CO2-to-Methanol Hydrogenation on Zirconia-Supported Copper Nanoparticles: Reaction Intermediates and the Role of the Metal-Support Interface. Angewa. Chem. Int. Ed. 2017, 56, 2318–2323. [Google Scholar] [CrossRef]
  10. Tang, Q.L.; Hong, Q.J.; Liu, Z.P. CO2 fixation into methanol at Cu/ZrO2 interface from first principles kinetic Monte Carlo. J. Catal. 2009, 263, 114–122. [Google Scholar] [CrossRef]
  11. Bianchi, D.; Chafik, T.; Khalfallah, M.; Teichner, S.J. Intermediate species on zirconia supported methanol aerogel catalysts.V. Adsorption of methanol. Appl. Cat. A 1995, 123, 89–110. [Google Scholar] [CrossRef]
  12. Fisher, I.A.; Bell, A.T. In situ infrared study of methanol synthesis from H2/CO over Cu/SiO2 and Cu/ZrO2/SiO2. J. Catal. 1998, 178, 153–173. [Google Scholar] [CrossRef]
  13. Rhodes, M.D.; Bell, A.T. The effects of zirconia morphology on methanol synthesis from CO and H2 over Cu/ZrO2 catalysts Part, I. Steady-state studies. J. Catal. 2005, 233, 198–209. [Google Scholar] [CrossRef]
  14. Ye, J.Y.; Liu, C.J.; Mei, D.H.; Ge, Q.F. Active Oxygen Vacancy Site for Methanol Synthesis from CO2 Hydrogenation on In2O3(110): A DFT Study. ACS Catal. 2013, 3, 1296–1306. [Google Scholar] [CrossRef]
  15. Lindenthal, L.; Ruh, T.; Rameshan, R.; Summerer, H.; Nenning, A.; Herzig, C.; Loffler, S.; Limbeck, A.; Opitz, A.K.; Blaha, P. Ca-doped rare earth perovskite materials for tailored exsolution of metal nanoparticles. Acta Cryst. B 2020, 76, 1055–1070. [Google Scholar] [CrossRef]
  16. Neagu, D.; Oh, T.S.; Miller, D.N.; Menard, H.; Bukhari, S.M.; Gamble, S.R.; Gorte, R.J.; Vohs, J.M.; Irvine, J.T.S. Nano-socketed nickel particles with enhanced coking resistance grown in situ by redox exsolution. Nat. Commun. 2015, 6, 8120. [Google Scholar] [CrossRef] [Green Version]
  17. Schrenk, F.; Lindenthal, L.; Drexler, H.; Urban, G.; Rameshan, R.; Summerer, H.; Berger, T.; Ruh, T.; Opitz, A.K.; Rameshan, C. Impact of nanoparticle exsolution on dry reforming of methane: Improving catalytic activity by reductive pre-treatment of perovskite-type catalysts. Appl. Catal. B 2022, 318, 121886. [Google Scholar] [CrossRef]
  18. Popovic, J.; Lindenthal, L.; Rameshan, R.; Ruh, T.; Nenning, A.; Loffler, S.; Opitz, A.K.; Rameshan, C. High Temperature Water Gas Shift Reactivity of Novel Perovskite Catalysts. Catalysts 2020, 10, 582. [Google Scholar] [CrossRef]
  19. Pacholik, G.; Enzlberger, L.; Benzer, A.; Rameshan, R.; Latschka, M.; Rameshan, C.; Föttinger, K. In situ XPS studies of MoS2-based CO2 hydrogenation catalysts. J. Phys. D 2021, 54, 324002. [Google Scholar] [CrossRef]
  20. Lindenthal, L.; Rameshan, R.; Summerer, H.; Ruh, T.; Popovic, J.; Nenning, A.; Loffler, S.; Opitz, A.K.; Blaha, P.; Rameshan, C. Modifying the Surface Structure of Perovskite-Based Catalysts by Nanoparticle Exsolution. Catalysts 2020, 10, 268. [Google Scholar] [CrossRef] [Green Version]
  21. Gao, P.; Zhong, L.S.; Zhang, L.N.; Wang, H.; Zhao, N.; Wei, W.; Sun, Y.H. Yttrium oxide modified Cu/ZnO/Al2O3 catalysts via hydrotalcite-like precursors for CO2 hydrogenation to methanol. Catal. Sci. Technol. 2015, 5, 4365–4377. [Google Scholar] [CrossRef]
  22. Xiao, S.; Zhang, Y.F.; Gao, P.; Zhong, L.S.; Li, X.P.; Zhang, Z.Z.; Wang, H.; Wei, W.; Sun, Y.H. Highly efficient Cu-based catalysts via hydrotalcite-like precursors for CO2 hydrogenation to methanol. Catal. Today 2017, 281, 327–336. [Google Scholar] [CrossRef]
  23. An, B.; Zhang, J.Z.; Cheng, K.; Ji, P.F.; Wang, C.; Lin, W.B. Confinement of Ultrasmall Cu/ZnOx Nanoparticles in Metal-Organic Frameworks for Selective Methanol Synthesis from Catalytic Hydrogenation of CO2. J. Am. Chem. Soc. 2017, 139, 3834–3840. [Google Scholar] [CrossRef] [PubMed]
Figure 1. Temperature-dependent yields for CH4 and CH3OH in the temperature range from 100 °C to 400 °C using the NCF-Cu catalyst. The measurement was performed after oxidizing (600 °C, O2) and reducing (500 °C, H2/H2O) pretreatments at 21 bar. During the measurement, the temperature was raised stepwise in 50 °C steps. Each step was held until equilibrium was reached. The educt gas flow consisted of 1 mLN·min−1 He + 3 mLN·min−1 H2 + 1 mLN·min−1 CO2. Starting from 250 °C onwards, methanol could be detected. The yield increased with the temperature to the maximum of 0.17% at 300 °C. Afterwards, the yield of CH3OH dropped back to 0.05% at 400 °C. In contrast, the smaller molecule CH4 could be detected for the first time at 300 °C. Its yield grew steadily with the temperature, surpassing CH3OH at 350 °C and reaching its final value of 0.46% at 400 °C.
Compounds 02 00031 g001
Figure 2. Comparison of the selectivity of the catalysts between 250 °C and 400 °C. At every temperature step, the main product (by a large margin) of the reaction was CO. For better visibility, the selectivity axis starts at 80%, as the selectivity of CO never dropped below that value. The striped areas mark the CO selectivity, the coloured areas represent the methanol selectivity, and the dotted areas correspond to the CH4 selectivity. All investigated catalysts had their best CH3OH selectivity at the lower end of the temperature range. The methanol selectivity of the NCF-Cu catalyst had its maximum at 250 °C. At higher temperatures the production of CH4 began, subsequently decreasing the selectivity together with an increase in the CO selectivity above 300 °C. For the STF-Cu catalyst, the methanol selectivity stayed nearly constant between 250 °C and 300 °C. After that, the rise in selectivity of CO and the onset of CH4 production again led to a significant decrease in methanol selectivity. For the CCM-Cu, the methanol selectivity decreased only slightly, going from 250 °C to 300 °C but dropped immensely at 350 °C. The CH4 selectivity for this catalyst peaked at 300 °C. However, it decreased (as was the case with all catalysts), when the temperature was raised further.
Compounds 02 00031 g002
Figure 3. XRD patterns of NCF-Cu before (bottom track) and after (top track) the reaction. The perovskite structure (peaks marked with a triangle) was still intact after the reaction, highlighting the stability of the backbone throughout the reaction. During the reaction, Fe (marked with a diamond) and Cu (marked with a circle) emerged with their main reflexes being at 44.6° (Fe) and 43.6° (Cu), respectively. A possible deactivation phenomenon can be explained by the appearance of CaCO3 at 29.5° (marked with a double triangle). The additional perovskite reflex at 36° that appears after the reaction is due to the better signal-to-noise ratio in that experiment. Furthermore, a slight shift (0.2°) in the perovskite reflexes after the reaction was observed, indicating a change in the unit cell parameters.
Compounds 02 00031 g003
Figure 4. Comparison of SEM images of NCF-Cu before and after the reaction with a reducing pre-treatment. Before the reaction (left), the surface of the catalyst was smooth with a few bigger flakes visible (remnants of the grinding process). After the reaction (right), nanoparticles in the range of 40 nm to 60 nm were visible. These nanoparticles can be attributed to Fe and Cu particles in accordance with the XRD measurements. The right picture shows a very homogenous distribution of these particles across the surface.
Compounds 02 00031 g004
Table 1. Overview of the CO yields after preliminary methanol synthesis tests at atmospheric pressure. The CO yield was chosen to characterize the ability of the catalysts to activate CO2 and by extension, their potential for methanol synthesis at higher pressures.
Catalyst400 °C500 °C600 °C
NCF0.80%6.30%26.50%
NCF-Cu6.62%22.00%52.58%
STF0.00%3.73%23.42%
STF-Cu4.33%12.00%23.79%
CCM3.07%5.51%7.72%
CCM-Cu1.03%4.08%7.28%
Publisher’s Note: MDPI stays neutral with regard to jurisdictional claims in published maps and institutional affiliations.

