Article

Comparison between the Nature and Activity of Silver Nanoparticles Produced by Active and Inactive Fungal Biomass Forms on Cervical Cancer Cells

1
Institute of Microbiology, Czech Academy of Sciences, 142 20 Prague, Czech Republic
2
Department of Medical Sciences, Shahrood Branch, Islamic Azad University, Shahrood 3619943189, Iran
3
Biological Nanoparticles in Medicine Research Center, Department of Medical Sciences, Shahrood Branch, Islamic Azad University, Shahrood 3619943189, Iran
*
Author to whom correspondence should be addressed.
Nanomanufacturing 2023, 3(2), 248-262; https://doi.org/10.3390/nanomanufacturing3020016
Submission received: 24 November 2022 / Revised: 3 April 2023 / Accepted: 25 May 2023 / Published: 9 June 2023

Abstract

:
Silver nanoparticles (SNPs) can be produced by active and inactive forms of biomass, but their properties have not been compared. Recent research is attempting to reveal their differences in shape, size, amount, antibacterial activity, cytotoxicity, and apoptosis induction. The biomass of Fusarium oxysporum was divided into four groups and pretreated in the following devices: room temperature (RT) and refrigerator (for preparation of active biomass forms), autoclave, and hot air oven (for preparation of inactive biomass forms). Samples were floated in ddH2O, and SNPs were produced after the addition of 0.1699 g/L AgNO3 in the ddH2O solution. SNP production was confirmed by visible spectrophotometry, transmission electron microscopy (TEM) and X-ray diffraction (XRD). SNPs were washed, and their concentration was determined by measuring atomic emission spectroscopy with inductively coupled plasma (ICP-OES). For antibacterial activity, the plate-well diffusion method was used. MTT and Annexin V-FITC/propidium iodide assays were used for cytotoxicity and apoptosis induction, respectively. The maximum absorbance peaks for SNPs pretreated in RT, refrigerator, autoclave, and hot air oven were 404, 402, 412, and 412 nm, respectively. The SNPs produced were almost the same shape and size, and the XRD results confirmed the presence of SNPs in all samples. Due to the differences in the type of bacterial strains used, the SNPs produced showed some differences in their antibacterial activity. The MTT assay showed that the amounts of SNPs in their IC50 dose based on the results of ICP-OES were 0.40, 0.45, 0.66, and 0.44 ppm for the samples pretreated in the hot air oven, autoclave, and refrigerator, and RT, respectively. The apoptosis induction results showed that the biologically engineered SNPs induced more apoptosis (about 34.25%) and less necrosis (about 13.25%). In conclusion, the type and activity of SNPs produced by the active and inactive forms of fungal biomass did not change. Therefore, use of the inactive form of biomass in the future to avoid environmental contamination is reccommended.

1. Introduction

In recent years, there has been a great tendency to produce different types of nanoparticles with various applications. The nanoparticles have specific properties that are different from their bulk materials [1,2]. Unlike their bulk materials, they exhibit special physical, chemical, magnetic and optical properties [2,3]. Nanoparticles are produced by different techniques, which are classified into three main types: chemical, physical, and biological [4]. The first two types are widely used and have their own advantages and disadvantages. Unlike these two techniques, the biological method is known to be safer and more environmentally friendly. In this technique, the nanoparticles are produced using the reducing ability of the microorganisms without releasing any harmful by-products into the environment [5]. Unlike the chemical method of producing nanoparticles, in the biological technique, the produced nanoparticles are clean, and the toxic by-products do not settle on the surfaces of the nanoparticles [5]. It has been reported that biological nanoparticles are generated by active and passive mechanisms. In the active mechanism, the attached or secreted microbial enzymes such as NADH dehydrogenase and nitrate reductase reduce the toxic ions to the nanoparticles. In the passive mechanism, the nanoparticles are generated with the help of the functional groups of the microbial secreted proteins and polysaccharides such as amides, aldehydes, carboxyls, and ketones. Although the existence of both mechanisms has been confirmed, the nature and activity of the generated nanoparticles are not compared [5,6].
It has been reported that different types of microorganisms, such as some bacteria, fungi, and algae, can produce nanoparticles [5]. In order to avoid the risk of using pathogenic microorganisms, it is important to select the microbial strains that are generally recognized as safe for this objective (GRAS). The alternative method for the production of nanoparticles is the passive mechanism and the use of inactive microbial biomass [6]. One GRAS microbial strain commonly used for nanoparticle production is Fusarium oxysporum [7,8,9,10].
In the absence of sufficient knowledge about the differences between the nature and activity of nanoparticles produced by active and passive mechanisms, this study sought to analyze the ability of this fungal strain to produce silver nanoparticles (SNPs) through its active and inactive biomass forms and to compare the shapes, size, amount, antibacterial activity, cytotoxicity, and apoptosis induction of the nanoparticles produced. If the nanoparticles produced by both methods have the same biological activities, this is the first report on the possibility of using inactive microbial biomass with the same properties as the active biomass.

2. Materials and Methods

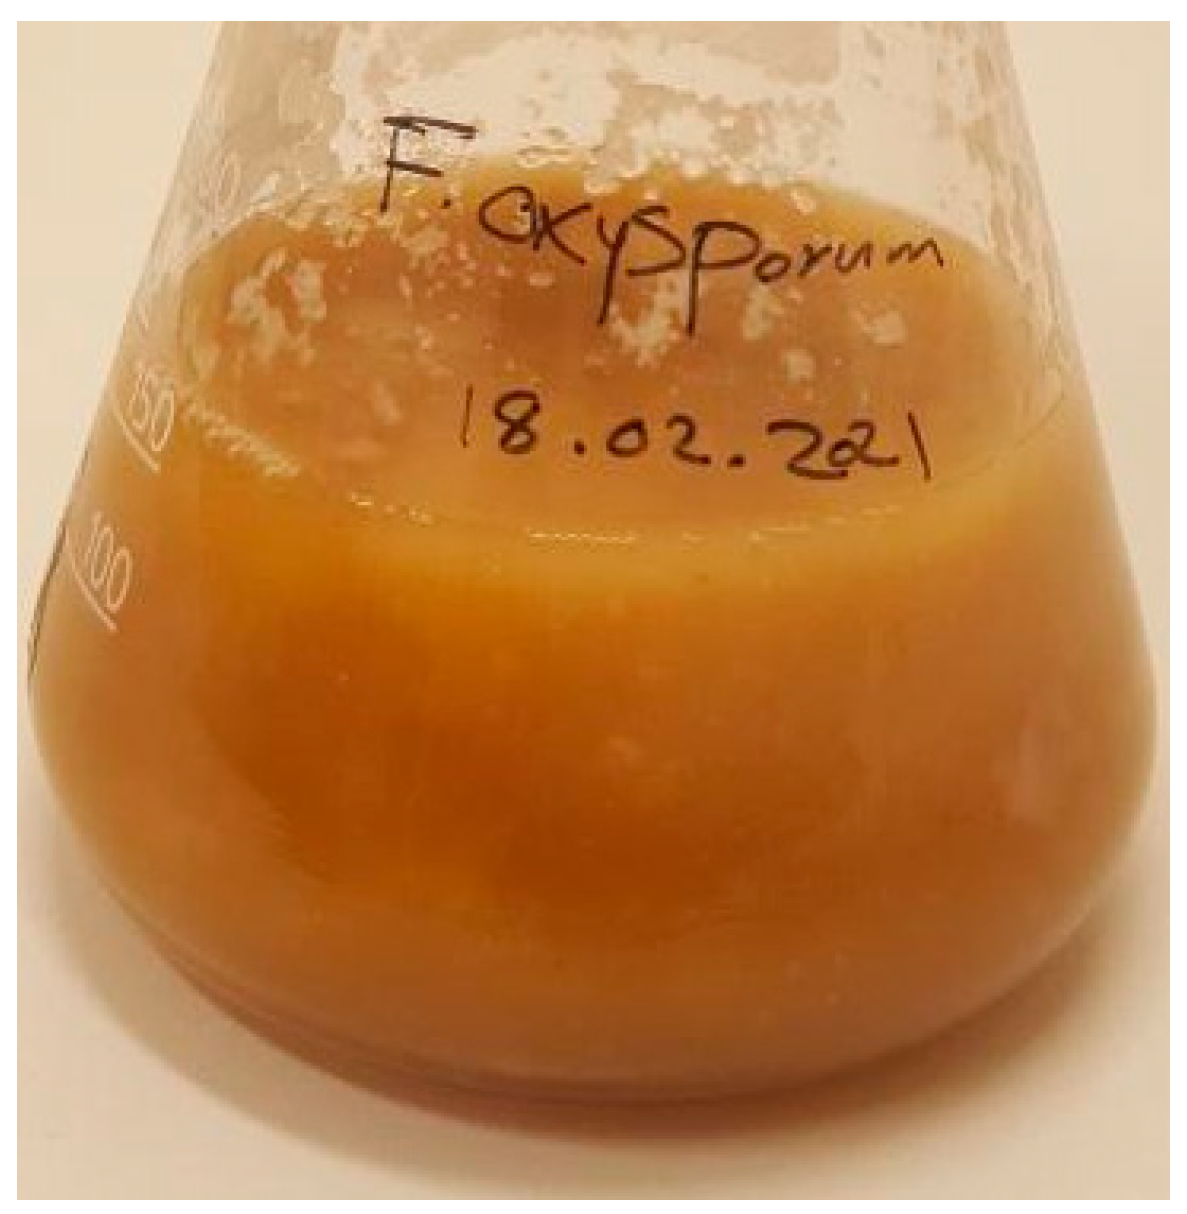
2.1. Fungal Cultivation

To produce SNPs, F. oxysporum (PFCC 238-21-3) was purchased from the Pasteur Institute of Iran and cultured in Sabouraud Dextrose Broth (SDB, Merck, Germany) medium at 30 °C for 3 days. The fungal biomass was collected by centrifugation at 6000 rcf for 10 min, and the obtained biomass was washed three times with ddH2O. The biomass was weighed and divided equally into four separate flasks and subjected to the pretreatments [11].

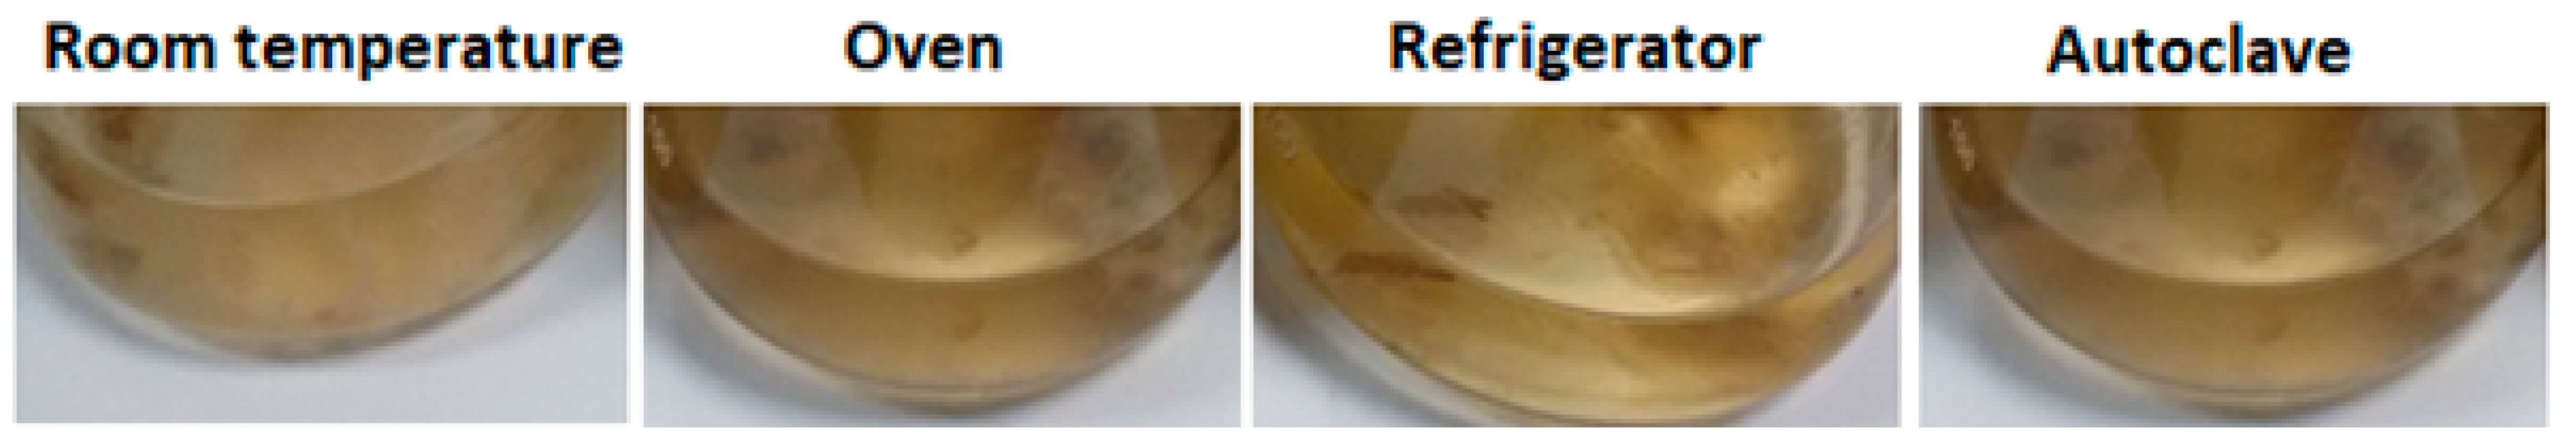
2.2. Biomass Pretreatments

Prior to SNP production by various active and passive mechanisms, each flask was pretreated separately in two different batches. For the preparation of active biomass, one flask was placed in the refrigerator at 4 °C for 12 h, and the other was placed at room temperature (RT) for 12 h. For the preparation of inactive biomass, one flask was placed in an autoclave and sterilized at 15 psi, at 121 °C for 15 min, and the other was placed in a hot air oven and heated at 180 °C for 15 min. Finally, the biomass in all flasks was suspended in 10 mL of ddH2O and used for further studies.

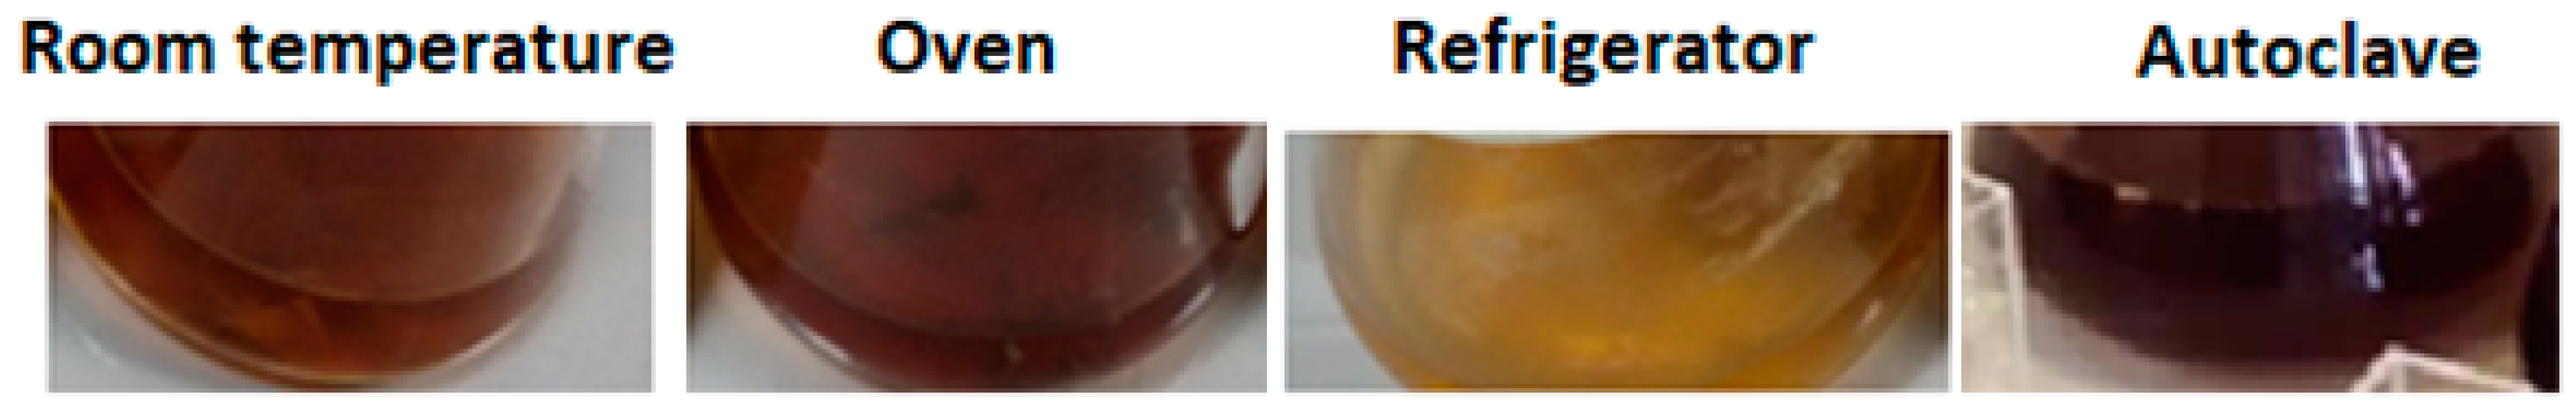
2.3. SNPs Production

To prepare SNPs, 10 μL of 1 M silver nitrate solution (Sigma Aldrich, Saint Louis, MO, USA) was added to 10 mL of fungal cell-free extract in each flask. The flasks were placed in a shaking incubator at 37 °C and 200 rpm for 24 h. The negative control flask containing 0.1699 g/L AgNO3 in ddH2O solution was incubated with the others [12,13].

2.4. Characterization of the Produced SNPs

To detect the formation of SNPs, the contents of each flask were analyzed separately using the following methods.

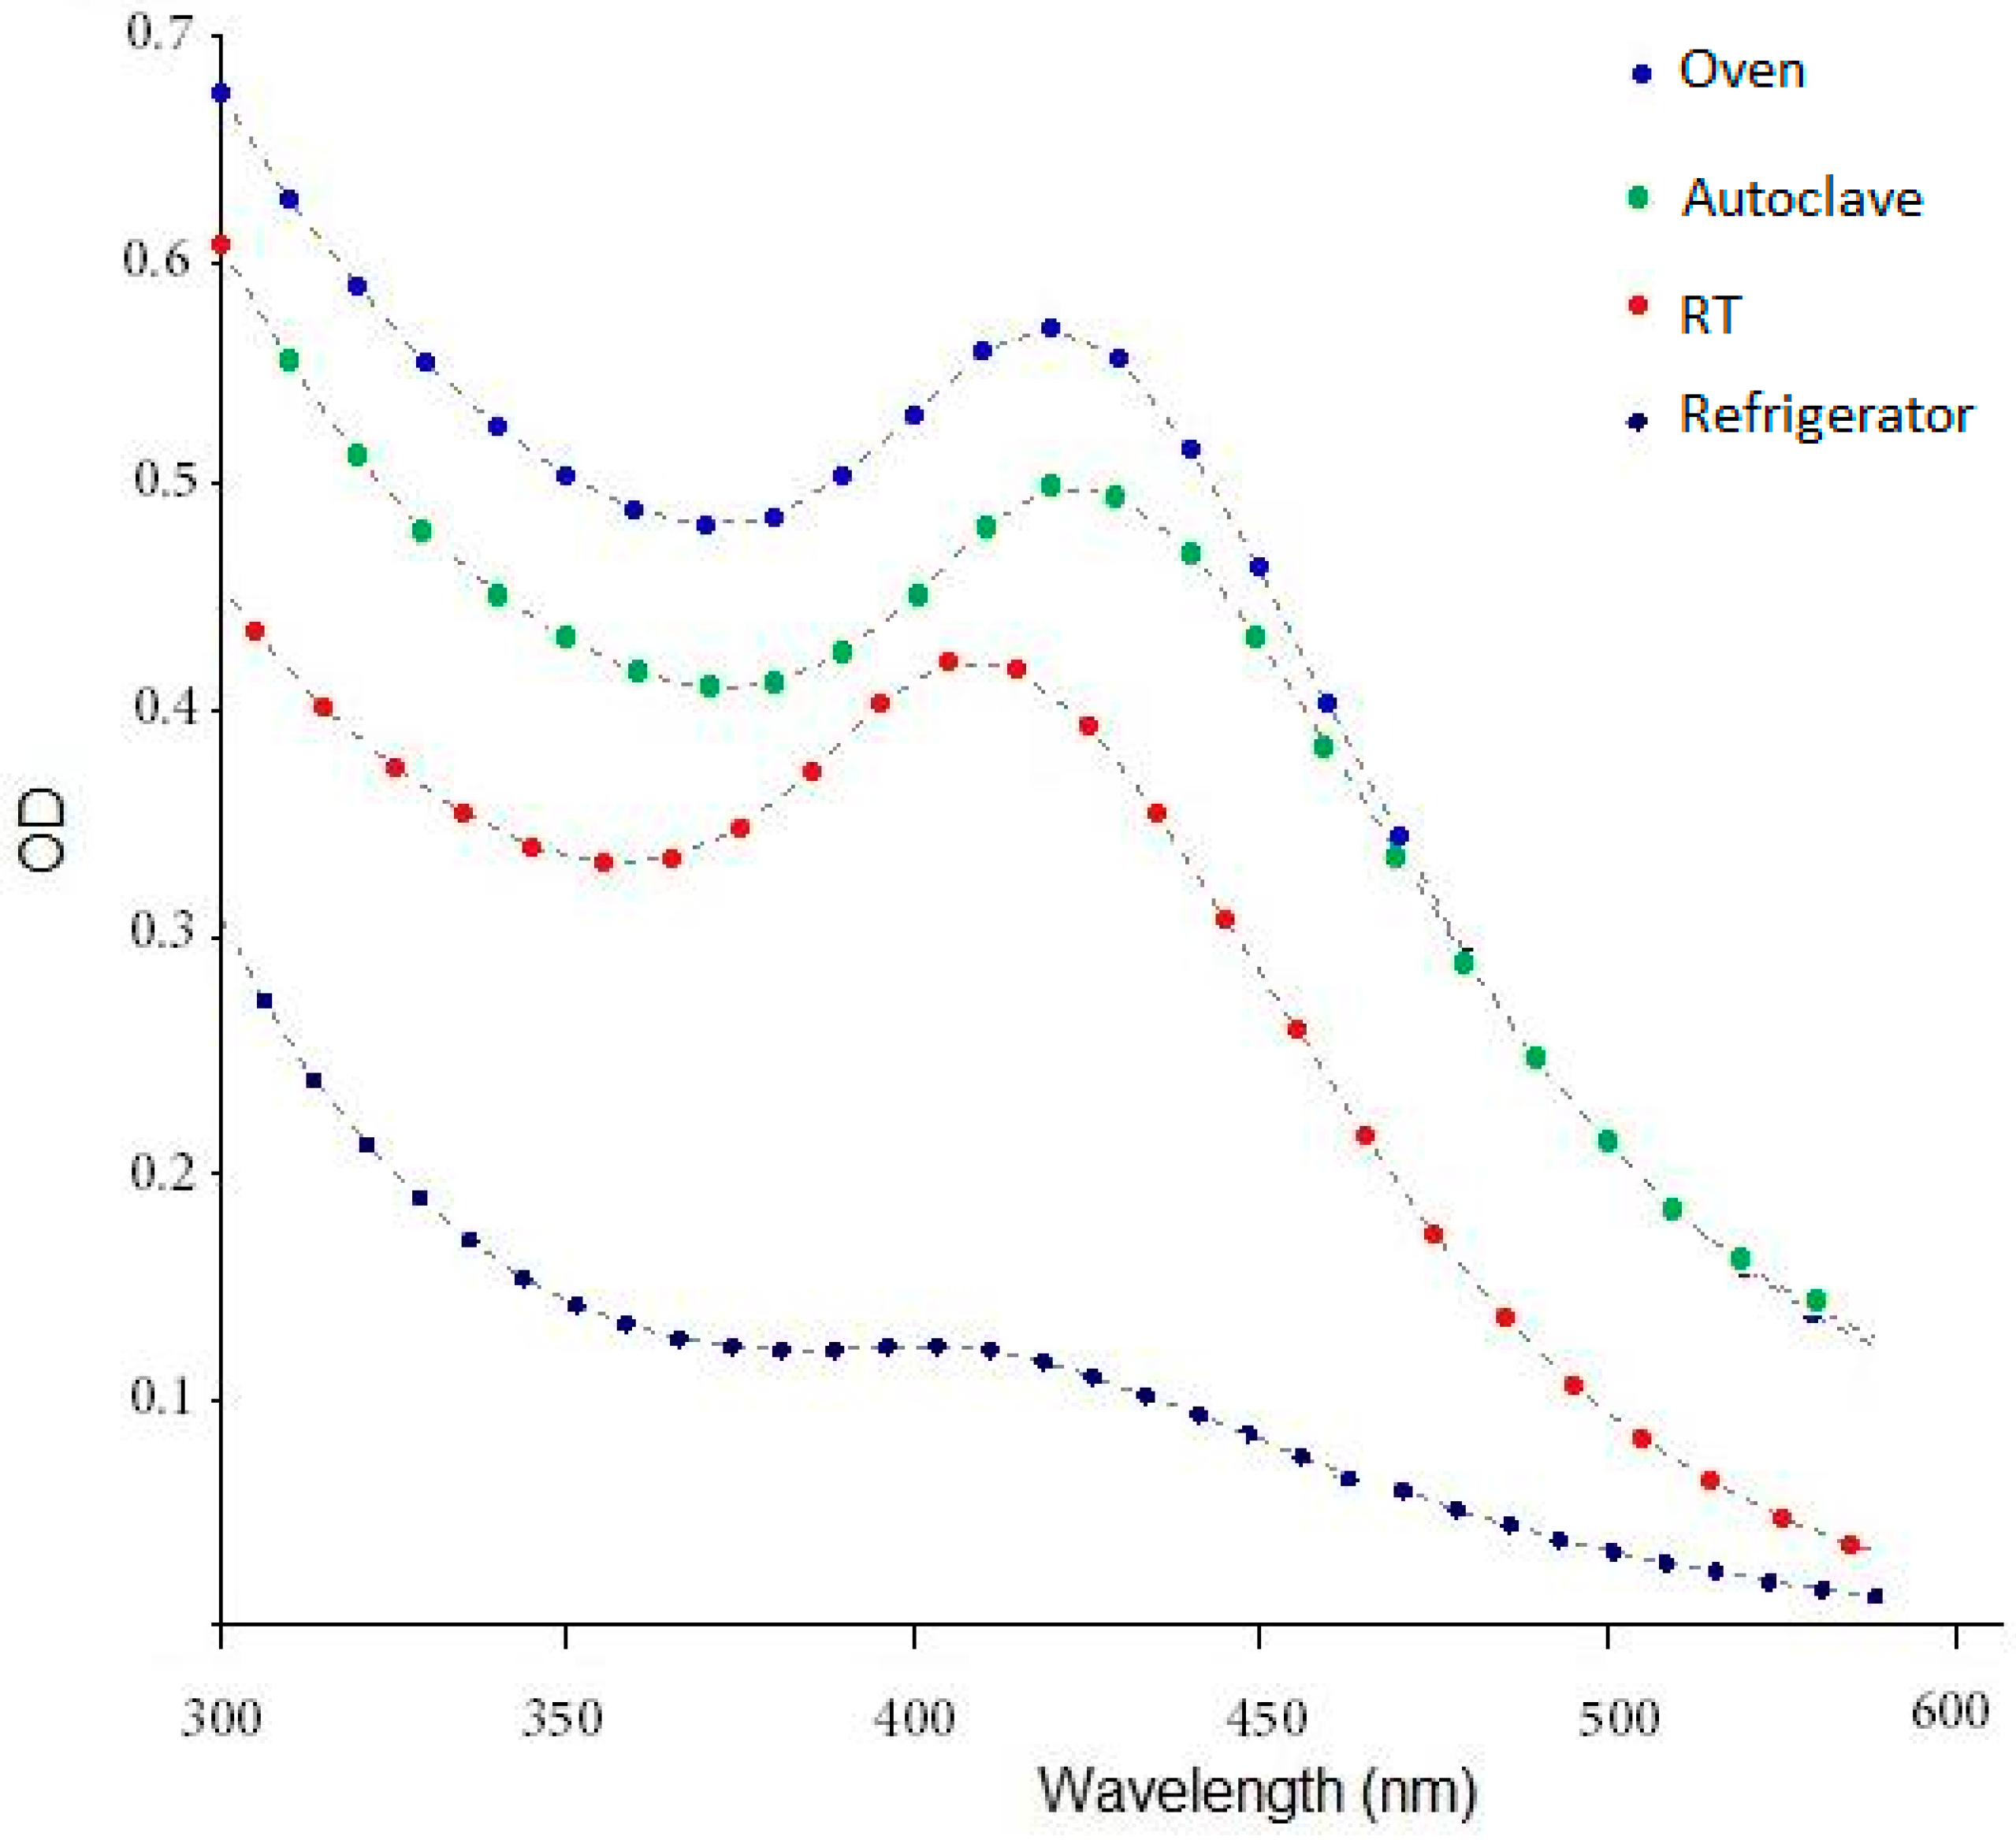
2.5. Spectrophotometry

When the SNPs are produced, the color of the reaction mixture changes from yellow to dark brown due to the Surface Plasmon Resonance (SPR) of the produced nanoparticles. Moreover, the color-changed reaction mixtures have a maximum absorption peak of around 400–450 nm. Therefore, each sample was analyzed using a spectrophotometry (Thermo Fisher Scientific, Waltham, MA, USA) in the presence of ddH2O as a blank. The wavelengths used ranged from 350–600 nm [14,15].

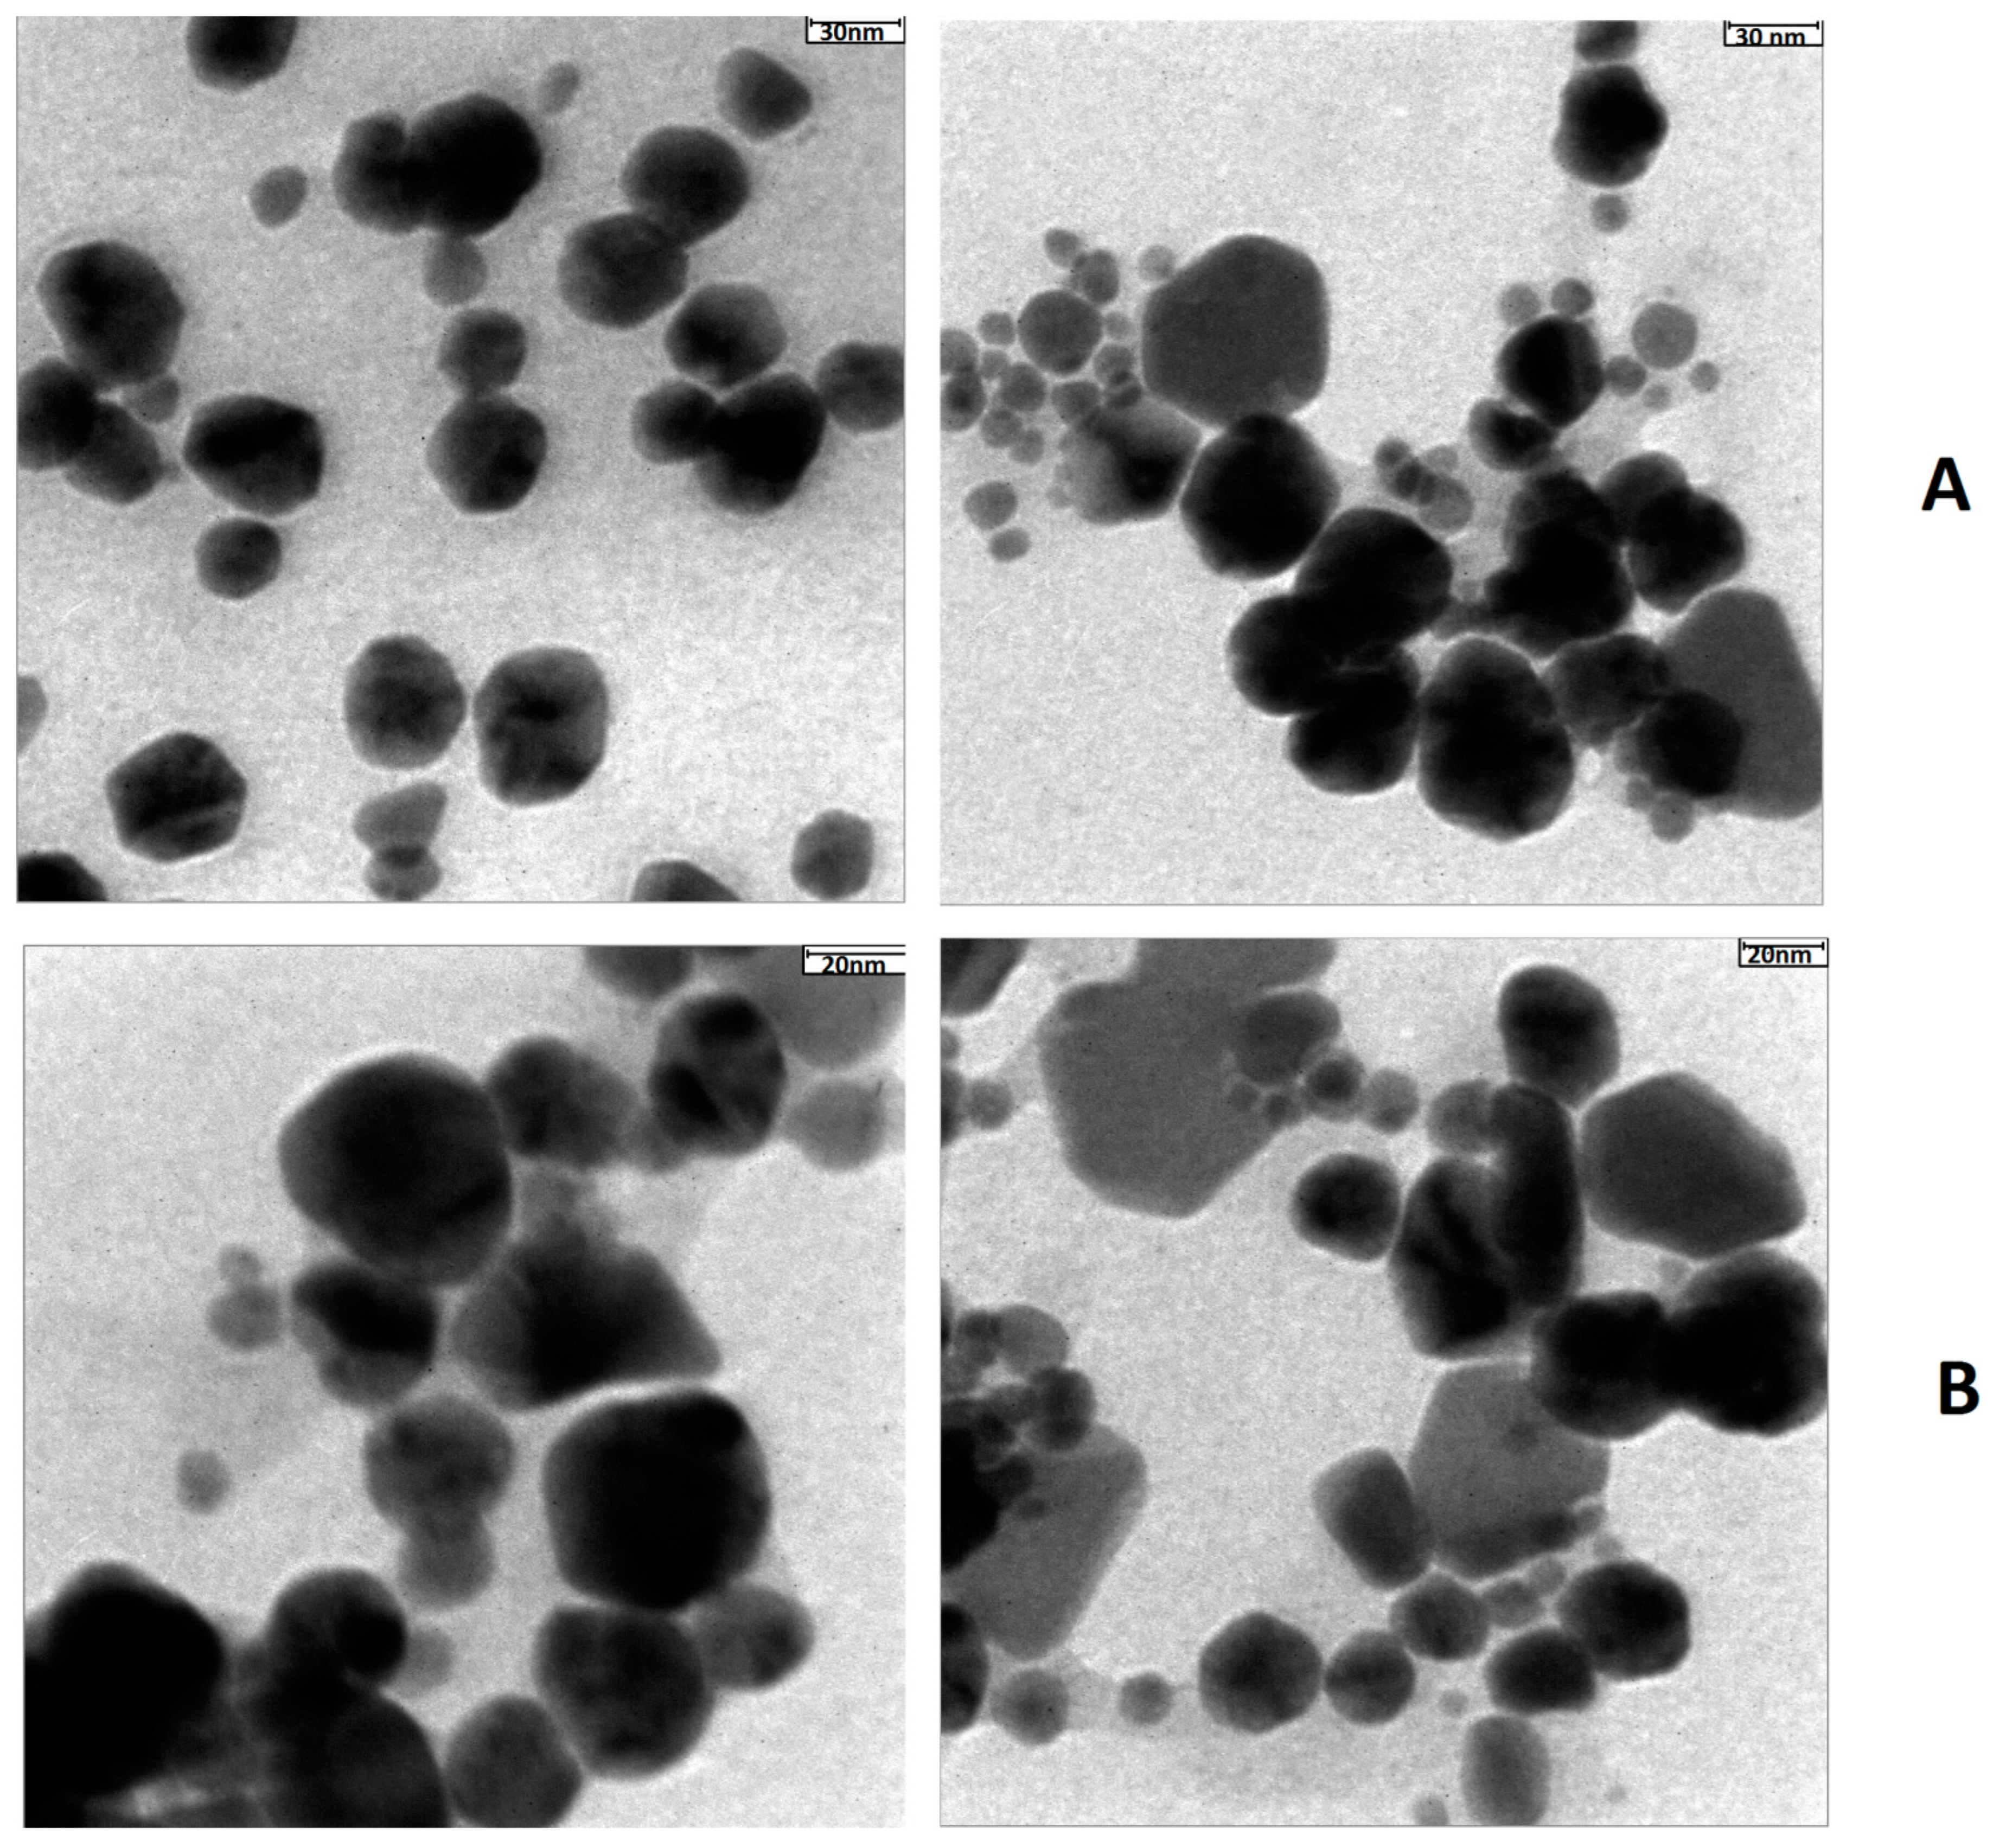
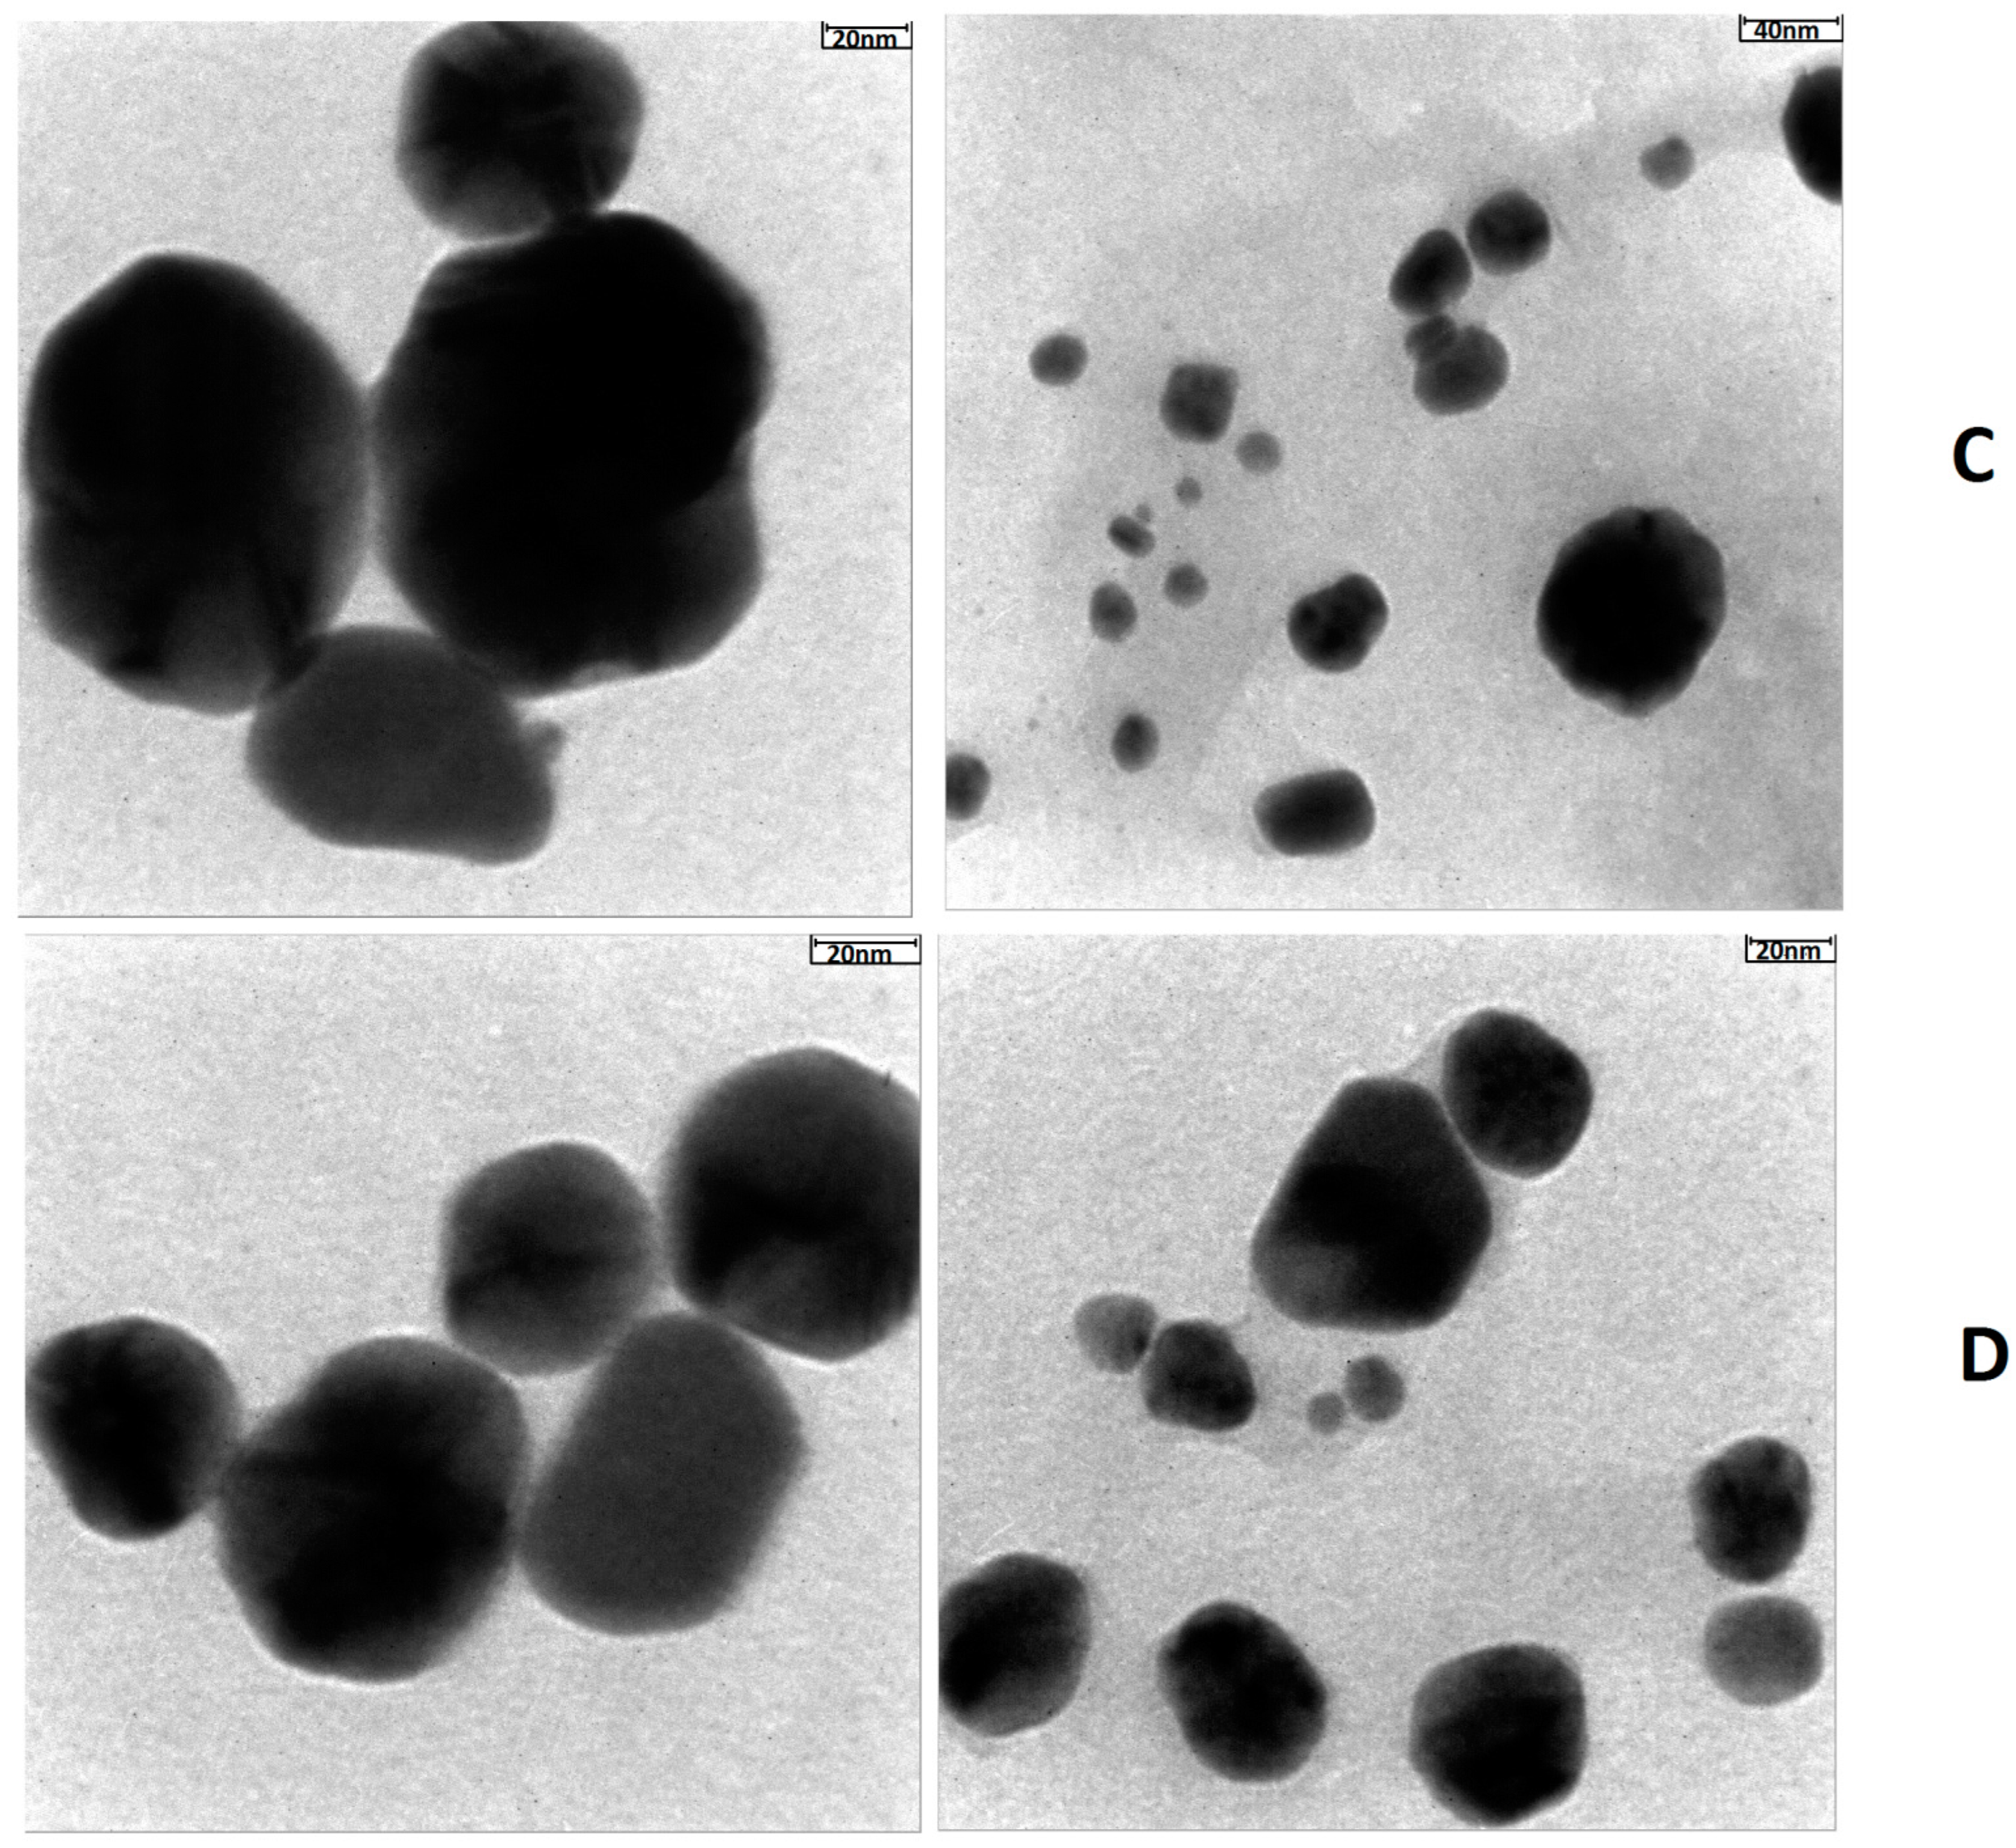
2.6. Transmission Electron Microscopy (TEM)

The size and shape of the generated SNPs for each sample were analyzed using TEM (Philips EO, Eindhoven, The Netherlands). This assay revealed the shape and size of the SNPs. Ten μL of each sample was placed on the carbon-coated copper grid, and after 20 s, the excess of the sample was removed, and all grids were placed to dry. Finally, digital images were taken [14,16].

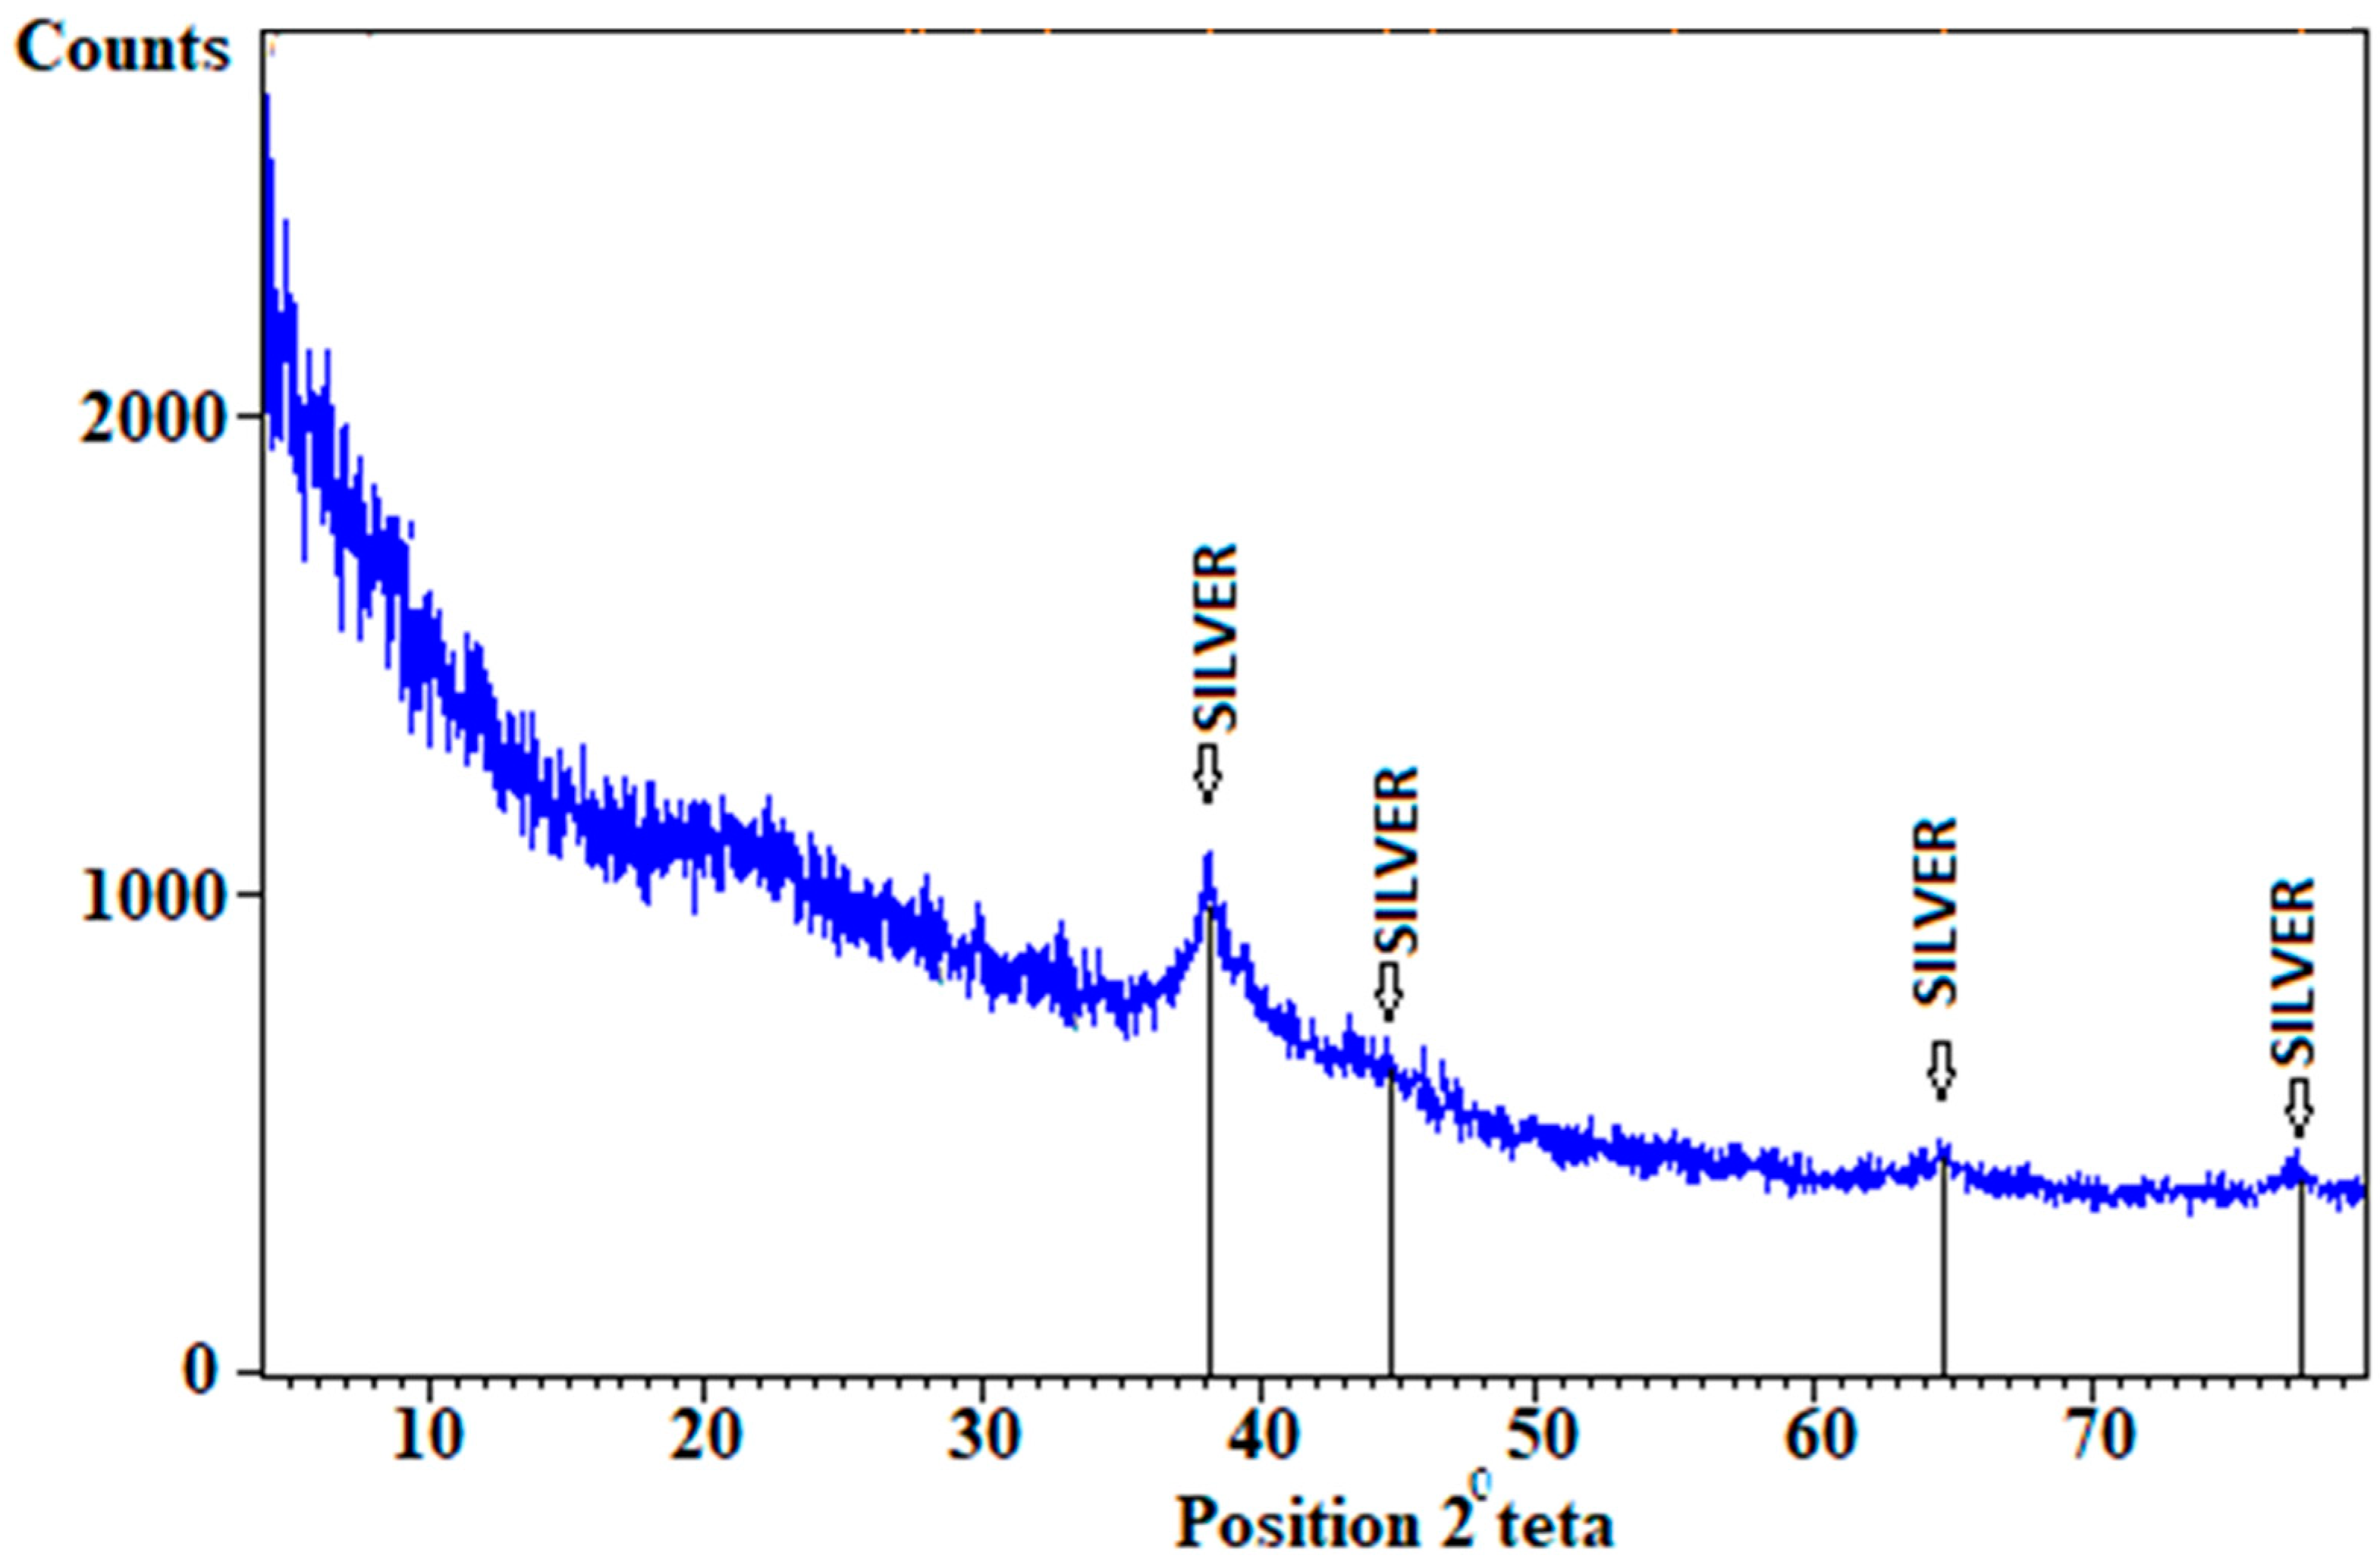
2.7. X-ray Diffraction Analysis (XRD)

In order to detect the presence of SNPs in each sample, XRD analysis was performed. The freeze-dried powder of one sample was obtained and analyzed using an XRD-6100 X-ray diffractometer. Measurements were made from 10–80 at 2° θ [17,18].

2.8. Zetasizer Analysis

The Zetasizer Nano ZS90 instrument (Malvern Panalytical, Malvern, UK), DLS (Dynamic Light Scattering) and ELS (Electrophoretic Light Scattering) were applied to analyze the size distribution and zeta potential of SNPs produced under four different conditions. Two different cuvettes were used: a Zeta cell with a folded capillary (1000 µL of each sample was used for Zeta potential analysis) and a ZEN2112 quartz cuvette with a very small volume (50 µL of each sample was used for size analysis and recording the signal in backscatter mode). The measurement parameters were: Dispersant was ddH2O, the temperature was 25 °C, backscattering mode was 174.7, the refractive index was 0.2, and absorbance was 3.32. The test was repeated three times [19].

2.9. SNPs Purification

The produced SNPs in all four flasks contained some microbial culture contaminants and were subjected to a washing process. For this purpose, the obtained colloidal SNPs were washed with ddH2O and centrifuged at 14,500 rcf for 30 min. Each pellet was suspended in ddH2O, and the process was performed three times. Finally, each sample was freeze-dried, and 1 mg of each was suspended in 1 ml of phosphate-buffered saline (PBS) and used for inductively coupled plasma atomic emission spectroscopy (ICP-OES) measurement [20].

2.10. Determination of the SNPs Concentration

Each colloidal SNPs sample (1 mg/mL) was digested with 0.5 mL of concentrated HNO3 and heated to 90 °C for 2 h. The samples were diluted with ddH2O to obtain 2% acid strength and analyzed using the ICP-OES instrument (PerkinElmer, Waltham, MA, USA) at a wavelength of λ = 328.068 in the presence of a reference silver sample in 2% HNO3 and the number of SNPs in each suspension was determined [20,21].

2.11. Antibacterial Activity Test
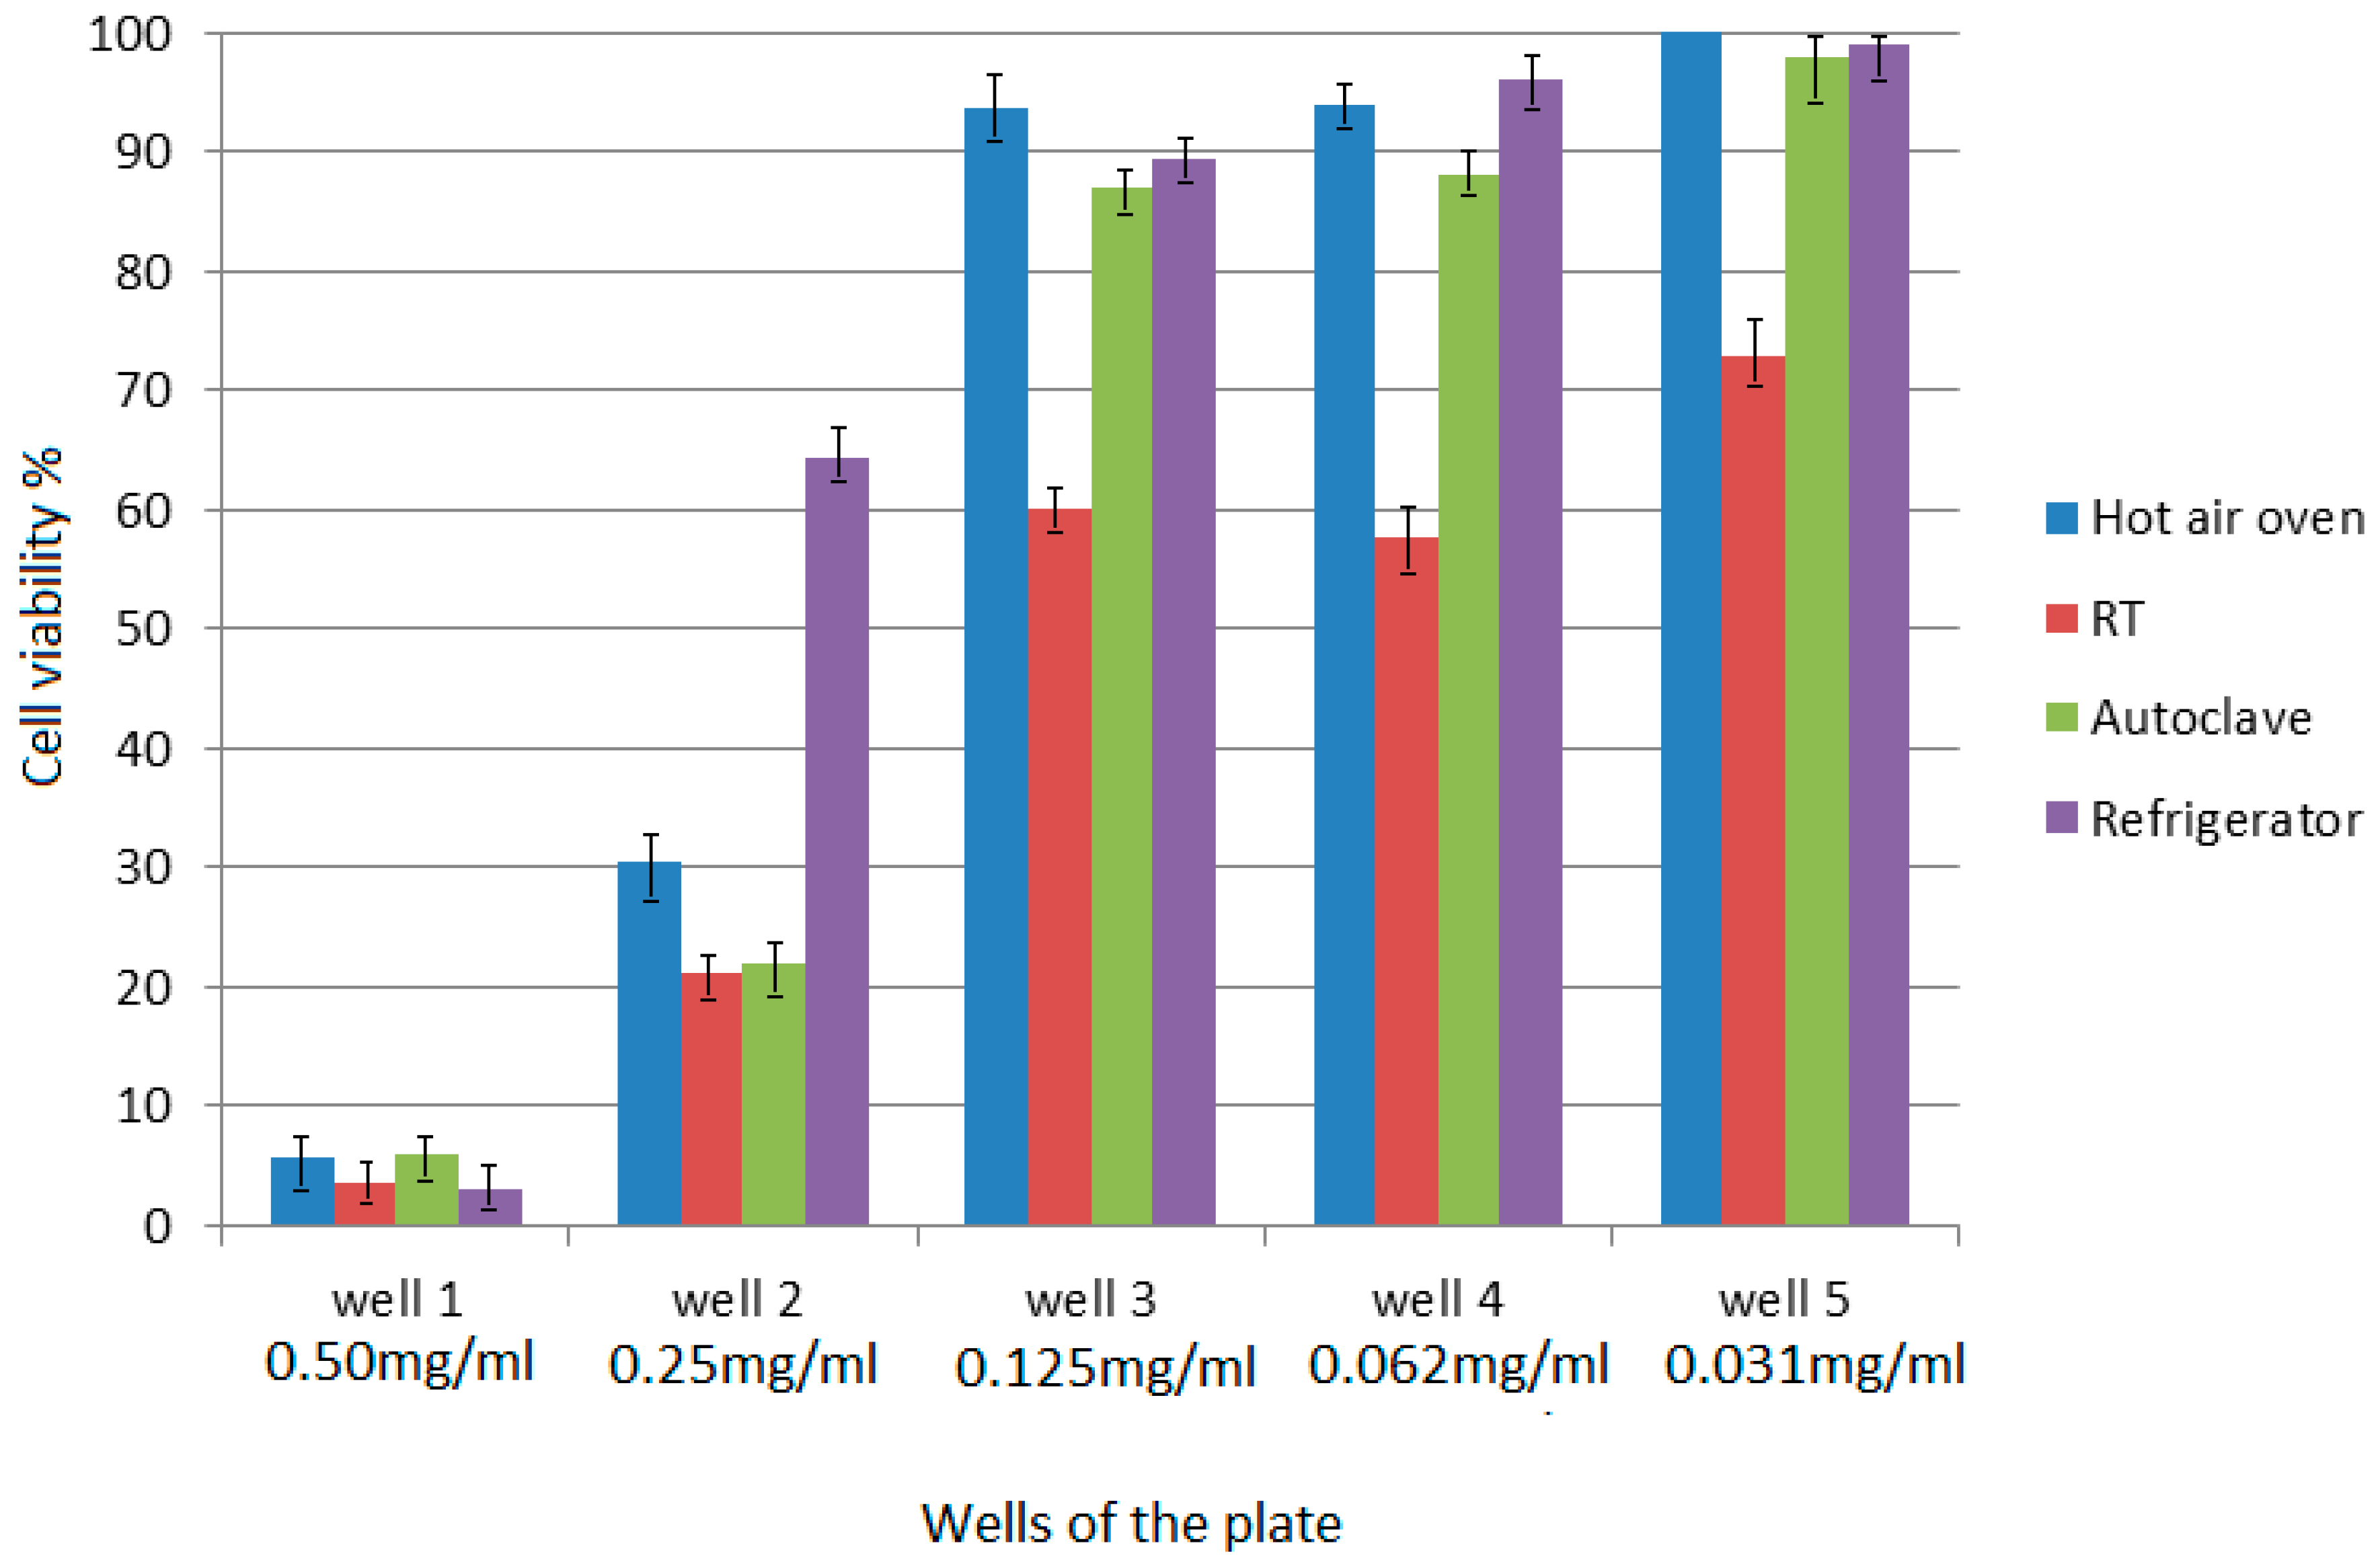
The plate well diffusion method was performed to analyze the differences in antibacterial properties of four different SNP samples (1 mg/mL) produced by the active and passive mechanisms. Three bacterial strains were obtained from Pasteur Institute in Iran and used for this analysis. The bacterial strains were Staphylococcus aureus (ATCC 29213) as a Gram-positive bacterium, Pseudomonas aeruginosa (ATCC 27853), and Escherichia coli (ATCC 25922) as a Gram-negative bacterium. A single colony of each bacterial strain was dissolved in 1 mL of normal saline, and turbidity was adjusted to 0.5 McFarland standards. By using a sterile swab, each bacterial strain was cultured completely on the surface of Mueller-Hinton Agar (Oxoid Limited, Hampshire, UK), and five wells (6 mm diameter) were made in each plate. Each well was loaded with 50 μL of the normalized amounts of produced SNPs pretreated under different conditions. The fifth well was loaded with 50 μL of 0.1699 g/L AgNO3 solution. The plates were incubated at 37 °C for 24 h, and the assays were performed three times. Finally, the diameters of the inhibition zones obtained were measured, and the data were analyzed using one-way analysis of variance (ANOVA) in SPSS software version 22 [22,23].

2.12. MTT Assay

The HeLa cell line (cervical cancer cell line) was purchased from the Pasteur Institute of Iran and used for the MTT assay. Dulbecco’s Modified Eagle’s medium (DMEM, Sigma Aldrich, USA) enriched with 10% fetal bovine serum (FBS, Gibco, Thermo Fisher Scientific, Waltham, MA, USA) and 1% penicillin-streptomycin (Thermo Fisher Scientific, MA, USA) was used to culture the cells in a 96 well microtiter plate. The cell layer was washed with PBS, and all wells were filled with 100 μL of the cell culture medium. The first well was filled with 100 μL of the sterilized SNPs (1 mg/mL), and after pipetting, 100 μL of it was transferred to the second well. This was continued until the 11th well. From this well, 100 μL was discarded after pipetting. The 12th well was a control and was loaded with 100 μL of the culture medium only. The plate was incubated at 37 °C for 24 h in the presence of 5% CO2. 10 μL 3-(4,5-dimethylthiazol-2-yr)2,2,5-diphenyltetrazolium bromide dye solution (MTT, 5 mg/mL, Sigma Aldrich, USA) was added to all wells and the plate was incubated for 4 h under cell culture conditions. The dye was then discarded, 200 μL of dimethyl sulfoxide (DMSO, Sigma Aldrich, USA) was added, and the plate was shaken for 20 min in the dark. The optical densities (ODs) of the wells were determined using an ELISA reader instrument (Promega, Madison, WI, USA) at a wavelength of 570 nm. The half-maximal inhibitory concentration (IC50) of SNPs was obtained, and the percentage of cell viability was determined [17].

2.13. Apoptosis Induction Assay

In order to analyze apoptosis induction, cells were cultured in the six-well plate (500,000 cells/well), and the Annexin V-FITC/propidium iodide assay kit (aatbioquest, Pleasanton, CA, USA) was used. The cells were treated with the determined IC50 doses of SNP solutions for 6 h. One of the wells remained as a control, and no SNPs were added. Cells were treated with the kit reagents according to the kit instructions and analyzed using the flow cytometry instrument (Thermo Fisher Scientific, Waltham, MA, USA) and FlowJo V10.6.1 software. The percentage of viable (Annexin V− PI −), necrotic (Annexin V− PI +) and apoptotic (Annexin V+ PI +) cells was determined [24].

3. Results

3.1. Fungal Cultivation

After incubation, the fungal biomass was extracted and collected. Figure 1 show the fungal biomass obtained in the culture medium.

3.2. Pretreatments of the Biomass

As indicated in the Materials and Methods, the biomass was divided into four separate flasks and each flask was pretreated separately. Two of them were used for active (i.e., one was placed at RT and the other in the refrigerator) and two for passive mechanisms (i.e., one was placed in the autoclave and the other in the hot air oven) of SNP production. Figure 2 shows the biomass in the four different flasks tested.

3.3. SNPs Production

After the addition of silver nitrate solution to each flask and after incubation, the color of all four tested flasks was changed from yellow to brown. Different intensities of color were obtained, indicating differences in the amounts, shapes, or other properties of the SNPs. All solutions were stable in the environment for at least six months. Figure 3 shows the four different vials tested after SNP preparation.

4. Characterization of the Produced SNPs

4.1. Spectrophotometry

All color-changed flasks were analyzed using visible spectrophotometry. Before analysis, all samples were diluted 1:10. The results showed that although all the flasks had maximum absorbance peaks at 400–450 nm, the optical density level (OD) and the position of the maximum absorbance peak were different. The maximum absorbance peaks for the SNPs pretreated at RT and for the refrigerator, autoclave and hot air oven devices were at 404 nm, 402 nm, 412 nm, and 412 nm, respectively, with different ODs. The maximum and minimum ODs were for the SNPs pretreated with hot air oven and refrigerator devices, respectively. The negative control flask remained unchanged. Figure 4 shows the spectra obtained for all four samples tested.
It has been reported that shifting the maximum absorbance peak position from 400 to 450 nm or even higher positions increases the size of spherical nanoparticles [25]. Since there is not much difference between peak positions, we assumed that all samples would have the same size. Therefore, we tried to determine the size of the samples using these two techniques: TEM and Zetasiser analyses.

4.2. TEM Analysis Results

The sizes and shapes of the produced SNPs for the samples were analyzed using TEM. The average sizes of the SNPs were different, indicating the differences in the production methods. The average sizes of SNPs pretreated at RT and refrigerator, autoclave, and hot air oven devices were 35 nm, 39 nm, 34 nm, and 36 nm, respectively. Overall, polygonal, round, oval, and triangular shapes of the produced SNPs were observed. Polygonal and triangular shapes of SNPs were observed in the flask incubated in the refrigerator before SNPs production, and round and oval shapes of SNPs were observed in the flask incubated at RT. Figure 5 shows the obtained TEM digital images in four tested samples.
Analysis by TEM confirmed that the size of SNPs generated after four different pretreatments were close and confirmed the previous claim about peak position in visible spectrophotometry.

4.3. XRD Result Data

The XRD results for all four flasks showed the presence of four distinct peaks corresponding to the cubic structure of the elemental silver. Figure 6 shows the XRD spectrum obtained for the sample pretreated at RT.
According to the JCPDS standard powder diffraction map (Silver File No. 04-0783), four silver peaks corresponding to levels (1 1 1), (2 0 0), (2 2 0), and (3 1 1) were recorded at approximately 38, 44, 64, and 77 at 2° θ, indicating the presence of elemental silver in the sample. Since the sample was washed several times, the silver nitrate was washed in such a way that the obtained XRD data belonged to SNPs and confirmed the presence of this type of nanoparticles in the sample [26].

4.4. Zetasizer Analysis

The zeta potential values and the average size of SNPs are shown in Table 1. As it is clear, all SNPs have negative zeta potential close to each other, which could prove their stability. Moreover, their average size was not larger than 65 nm. Again, the same sizes were determined, confirming the previous data from visible spectrophotometry and TEM analysis.

4.5. Determination of the SNPs’ Concentration

Before further experiments, the SNP concentration for each freeze-dried sample was determined using ICP-OES 730- ES instrument. Table 2 shows the obtained amounts of elemental silver for the samples. Briefly, the highest concentration of SNPs was calculated for the sample pretreated in a hot air oven and the lowest for the sample pretreated in a refrigerator.

4.6. Antibacterial Activity Test

To analyze the differences in antibacterial properties of the four different SNP samples produced by the active and inactive biomass samples, three bacterial strains, S. aureus, P. aeruginosa, and E. coli, were used. Since the numbers of SNPs produced by different treatments were not equal according to Table 1, the numbers of the used SNPs were normalized, and 50 µL of SNPs pretreated in the refrigerator, 41.01 µL of SNPs pretreated in the hot air oven + 8.99 µL ddH2O, 37.36 µL of SNPs pretreated in RT + 12.64 µL ddH2O, and 36.73 µL of SNPs pretreated in the autoclave + 13.27 µL ddH2O were added in the corresponding wells. The tests were performed thrice. The diameter of the inhibition zones obtained was measured, and the data were analyzed with the help of the program ANOVA using SPSS version 22 software. The p-value < 0.05 was considered significant. Table 3 shows the results that were obtained.
The results of ANOVA showed that in the tested samples used against E.coli, there was no significant difference between the SNPs that their flasks were placed in the refrigerator and autoclave before preparation (p-value > 0.05), but significant differences were found in the other tested samples (p-value < 0.05).
For the tested samples used against P. aeruginosa, there was no significant difference between the SNPs that their flasks were placed in the hot air oven, autoclave, and RT before production (p-value > 0.05), but a significant difference was found between these groups and the sample that was pretreated in the refrigerator (p-value < 0.05).
There were no significant differences between the samples tested against S. aureus (p-value > 0.05).

4.7. MTT Assay

In order to analyze the toxic effects of the SNPs samples, an MTT assay was performed, and the percentage of cell viability was determined. The IC50 for each sample was determined, and the results showed that all four tested samples induced dose-dependent toxic effects. The IC50 for the samples of flasks pretreated in a hot air oven, autoclave, and at RT before SNPs production were in the third well (0.125 mg/mL SNPs), and for the sample of flask pretreated in a refrigerator before SNPs production were in the second well (0.25 mg/mL SNPs). Thus, the amounts of SNPs in their IC50 dose based on the ICP-OES results were 0.40, 0.45, 0.66, and 0.44 ppm for the samples pretreated in a hot air oven, autoclave, refrigerator, and at RT, respectively. Figure 7 shows the cell viability percentage of the cells based on the results of the MTT assay.

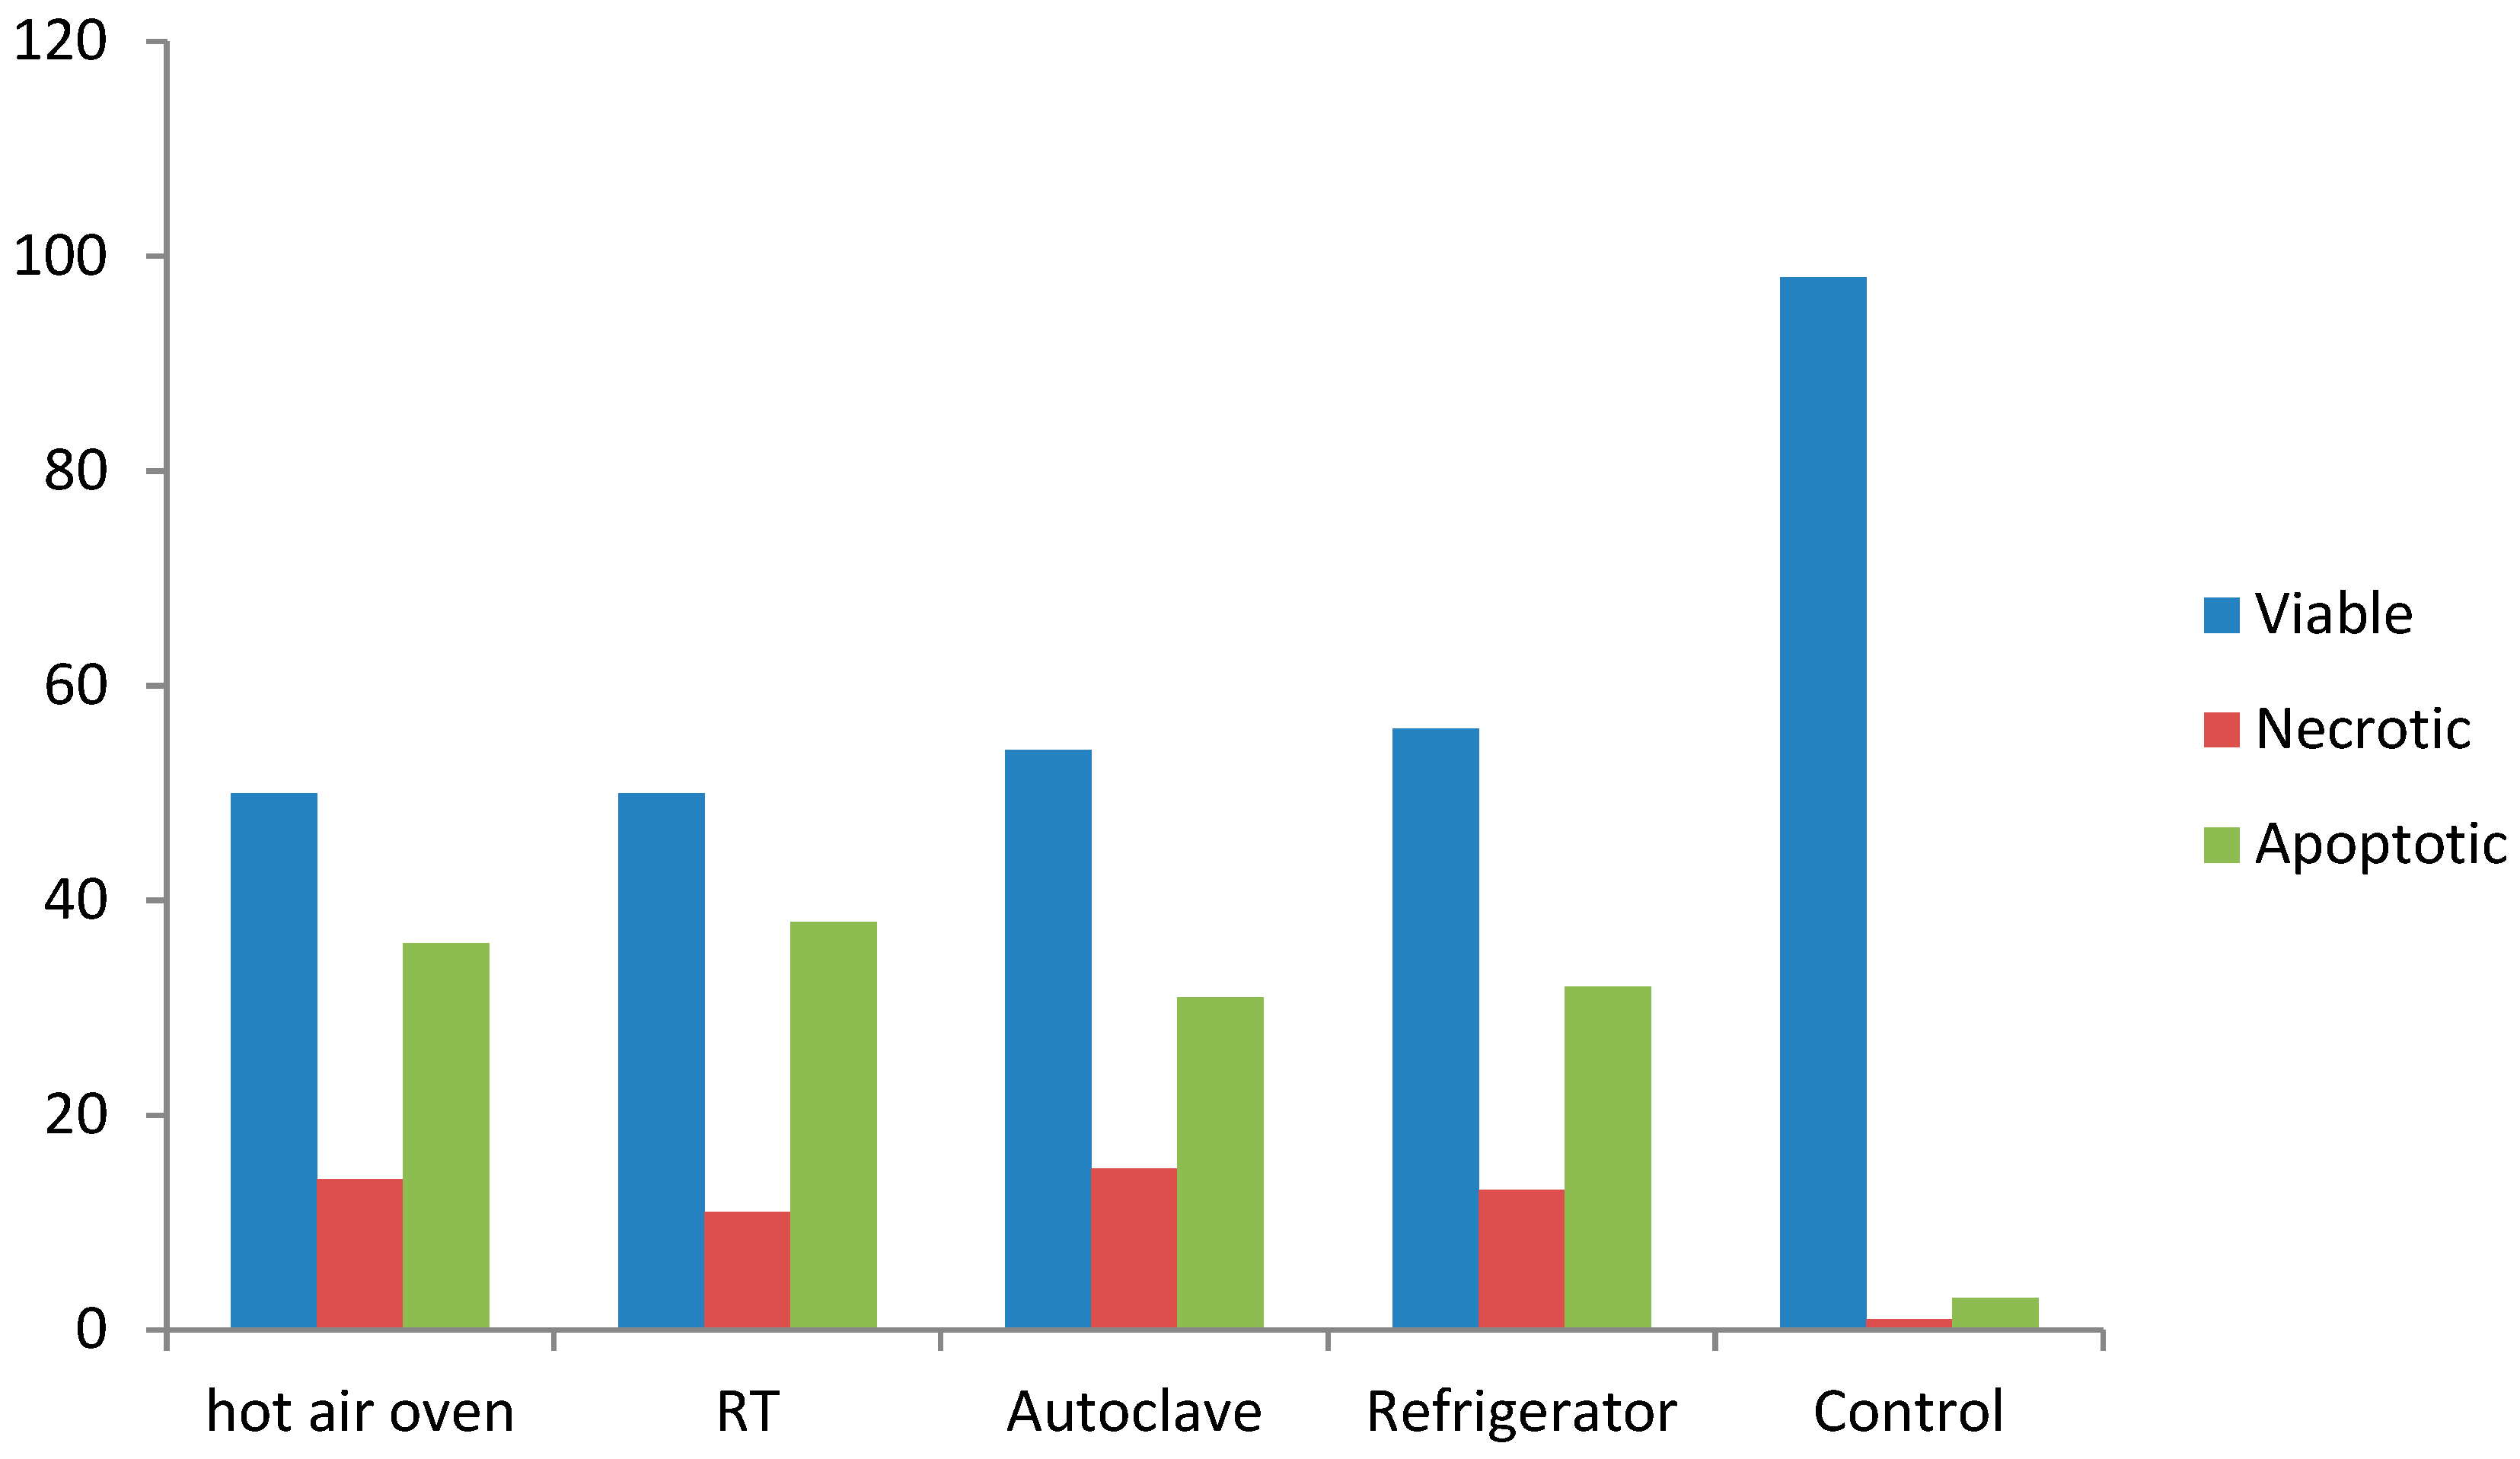
4.8. Apoptosis Induction Assay

Annexin V-FITC/propidium iodide assay kit was used for apoptosis induction assay, and the cells were incubated with four different SNP types in their IC50 doses for six hours. More than 96% of the cells in the control well were alive, and unlike the control, the obtained biologically engineered SNP with different pretreatment induced more apoptosis (about 34.25%) and less necrosis (about 13.25%) in the cells after six hours of incubation. Figure 8 shows the obtained results.

5. Discussion

There is currently substantial interest in using the non-toxic method of manufacturing nanoparticles that does not produce harmful by-products in the environment and on the surface of the manufactured nanoparticles [27]. As mentioned earlier, there are many different microorganisms that can produce different types of nanoparticles, such as gold, silver, titanium, iron, and others. The used microorganisms are usually selected from the non-pathogenic ones, but some studies reported that pathogenic microorganisms were used in the reduction process [5].
Some of the studies are concerned with the intracellular, but many are concerned with the extracellular production of nanoparticles. The extraction of nanoparticles produced by the second method is easier, so many of the researchers have used the extracellular production method [5]. In the extracellular production technique, there are two different active and passive mechanisms to produce nanoparticles. The first is carried out by the action of microbial-secreted enzymes, and the second is carried out by the action of functional groups of different types of proteins, polysaccharides, etc., present in the microbial culture [6].
Based on this introduction, recent research has analyzed the production of SNPs using the active and inactive biomass of the microbial strain F. oxysporum to answer these questions: can the inactive biomass be used instead of the active one in the production of nanoparticles? Furthermore, if the nanoparticles are produced, will their nature and activity be different from those produced from the active biomass form? If the inactive biomass can produce the nanoparticles like the active biomass, the use of the inactive biomass is preferred to reduce the risk of using live pathogenic microorganisms that may have an impact on human health. Moreover, the industrial application of this method is preferred because the inactive biomass can be used without the need for sterile conditions [4].
In the first phase of the current study, different pretreatment conditions were used, SNPs were produced, and their production was confirmed. For this purpose, F. oxysporum was purchased and used for nanoparticle production. This type of fungal strain is known to be safe, and due to its strong secretion systems responsible for the secretion of various types of enzymes, polysaccharides, proteins etc., to the external microbial environment, it was used for the aim of nanoparticle production [5]. Prior to the production of SNPs, the biomass was treated by various treatment procedures to obtain the active and inactive forms of the fungal biomass. Harsh conditions are used for sterilization processes, such as the application of high temperatures that inactivate the biomass (i.e., autoclave and hot air oven instruments). These methods were used to obtain the inactive biomass forms. Low temperatures, such as the use of refrigerators and RT, were used for active biomass pretreatment. The samples were subjected to SNP production, and after incubation with the silver nitrate ions, all had a capacity for SNP production. The obtained SNPs were analyzed by visible spectrophotometry, TEM and XRD. The results of the visible spectra of all four tested samples showed that the SNPs were produced. The peaks obtained were between 400–450 nm. It was 402 nm for the sample pretreated in a refrigerator and 412 nm for the one pretreated in an autoclave. The TEM results showed that the shapes and sizes of the SNPs produced were the same, and XRD analysis showed the presence of elemental silver in all four tested samples. TEM digital images showed that the SNPs were well separated due to the presence of capping proteins on the surfaces of the produced SNPs [4].
Thus, all the analyses used showed that the active and inactive forms of the fungal biomass had the ability to produce SNPs. In order to compare the concentrations of SNPs produced and obtained by these two mechanisms, ICP-OES measurement was performed. The results showed that although all samples contained SNPs, the sample that was pretreated in the refrigerator contained lower amounts of SNPs than the others, indicating that for nanoparticle production, the use of active biomass does not always show acceptable results.
In the second phase of the experiment, we tried to answer the question of whether all SNPs produced by both active and passive mechanisms of bioproduction have the same nature and activity.
Although there are some studies on the biological method of nanoparticle production, there is no study on the comparison between the properties, nature, activity, and effects of the produced nanoparticles by active and passive mechanisms of bioproduction. For example, in 2010, Binupriya et al. used inactive cell filtrate of Rhizopus solonifer for the production of silver and gold nanoparticles. They used an autoclave treatment to inactivate the biomass, and the obtained biomass produced both types of nanoparticles mentioned above [4]. They also used the inactive biomass of Aspergillus oryzae and successfully produced silver and gold nanoparticles [28].
Sneha et al. (2010) used both the active and inactive forms of Corynebacterium glutamicum biomass to produce SNPs, and they showed that the inactive biomass was able to produce many more SNPs in contrast to the active form. The inactive form of biomass was produced by autoclaving. The color intensities and the ODs of the SNPs produced with the inactive biomass were higher than those of the active biomass, which was due to a higher SNP content of the reaction mixture [3].
In 2013, Salvadori et al. discovered that the dead biomass of Hypocrealixii produced copper nanoparticles and was used to bio-remediate copper. They concluded that the dead biomass has a good capacity to produce nanoparticles [29]. Furthermore, in 2014, Salvadori et al. showed that the dead biomass of the fungus Aspergillus aculeatus could produce nickel oxide nanoparticles. They showed that the fungal-reducing agents were responsible for this bio-reduction process [30]. All these studies confirm that the passive mechanism of bio-production could produce acceptable amounts of nanoparticles, but what about the nature and activity of nanoparticles? This question has not been fully explored. Therefore, we analyzed the cytotoxicity, apoptosis induction and antibacterial assays of the SNPs produced by both active and passive mechanisms of bio-production.
The antibacterial assay results showed that the antibacterial activity of the SNPs differed depending on the microbial strain used. Therefore, the antibacterial activity does not depend on the method of bio-production of the nanoparticles. Moreover, in the antibacterial assays, we have to consider the amounts of SNPs produced by each sample. The results of the ICP-OES measurement showed that the amounts of SNPs produced by the active biomass in one situation (i.e., the sample that was pretreated in a refrigerator) were lower than those produced by the inactive biomass. This sample induced the least cytotoxicity and apoptosis induction. Incubation of the sample in the refrigerator prior to SNP production caused less release of enzymes and other reducing substances from the biomass, which may result in lower SNP production ability. In contrast to the pretreatment in the refrigerator, heating the biomass with sterilization equipment caused a better release of reducing agents from the fungal biomass, resulting in a higher SNP production ability. The spectrophotometry results showed that the SNPs produced by the inactive biomass forms had higher ODs than the active ones. These results confirm that the applications of the SNPs produced by the inactive biomass forms have the same capacity in their antibacterial activity as the SNPs produced by the active biomass forms. Since there were minor differences in the amounts of SNPs produced by the samples, they induced the same antibacterial activity. In this assay, the silver nitrate had the same and higher activity against all the bacterial strains tested, unlike the SNPs group. This means that the bio-reduction of the harmful silver nitrate ions to the SNPs leads to the production of less toxic SNPs, which is the main goal of this reduction in nature. We used 0.1699 g/L AgNO3 solution in a well, and we knew that since all ions were not converted to the SNPs, all samples contained less silver than the control.
These results were consistent with the results of the cytotoxicity assay, which showed that all four samples tested induced dose-dependent toxic effects, and with the exception of the sample that was pretreated in the refrigerator prior to SNP production, all samples had the same IC50 values. When the samples were analyzed for their IC50s for the apoptosis assay, all induced more apoptosis and less necrosis in the cells after six hours of incubation, which were largely the same for all samples. Previously, it was shown that the cytotoxicity effect of the non-biologically engineered SNPs was due to the induction of reactive oxygen species (ROS), which is associated with apoptosis and necrosis [31]. Foldbjerg et al. (2009) showed that incubation of the non-biologically engineered SNPs with the human lung carcinoma cell line (A549) induced the above responses and demonstrated that these effects depended on the exposure time and dose of the SNPs used. They showed that more necrosis occurred after the application of a longer incubation period and higher doses of SNPs [31]. Lee et al. (2014) showed that the non-biologically engineered SNPs induced ROS and apoptosis in the NIH 3T3 cell line. They showed that SNPs reduced cell viability in a dose-dependent manner, and more apoptosis than necrosis was observed in the first 12 hours. However, a similar result was observed after 24 hours of incubation of the cells with the SNPs [32]. Kumar et al. (2015) showed that not only the exposure time and dose of non-biologically produced SNPs but also the size of SNPs affected the balance between the amount of necrosis and apoptosis. They showed that for 10 nm non-biologically engineered SNPs with the dose of 50 μg/mL, more apoptosis and less necrosis were observed after four hours, and this balance was reversed after 24 hours of incubation. [33]. Overall, the biologically engineered SNPs with a size of approximately 35 nm induced more apoptosis and less necrosis after six hours of incubation with the HeLa cell line, which is similar to the behavior of the non-biologically engineered SNPs that confirmed the induction of ROS after their usage in vitro. It is recommended to use different doses (not only IC50), different sizes and different exposure times to analyze their exact behavior in the future. Our results showed that SNPs produced by both the inactive and active biomass forms induced the same apoptotic and necrotic effects in vitro. A recent study confirmed that the nanoparticles could be produced by both the active and inactive microbial biomass forms without changing their activity. Therefore, for SNPs production, if the pathogenic microbial strain is used, the inactive biomass form can be replaced and used for nanoparticle production without any doubt about the reduction of nanoparticle activity. The use of other microbial strains and other pretreatments is recommended to confirm the current results.

6. Conclusions

In conclusion, the active and inactive biomass forms of F. oxysporum were able to produce SNPs successfully, and the nature and activity of the nanoparticles produced were not altered. Therefore, the use of the inactive microbial biomass form is recommended to ensure its safety in the future.

Author Contributions

B.Y. and P.P. wrote the main manuscript text and designed the article. M.N., T.H. and N.K. help in writing—original draft preparation, writing—review and data curation. All authors have read and agreed to the published version of the manuscript.

Funding

This research received no external funding.

Data Availability Statement

Not applicable.

Conflicts of Interest

All of the authors declare that they have no conflict of interest.

References

  1. Alkilany, A.M.; Murphy, C.J. Toxicity and cellular uptake of gold nanoparticles: What we have learned so far? J. Nanopart. Res. 2010, 12, 2313–2333. [Google Scholar] [CrossRef] [PubMed] [Green Version]
  2. Chen, Y.-S.; Hung, Y.-C.; Liau, I.; Huang, G.S. Assessment of the in vivo toxicity of gold nanoparticles. Nanoscale Res. Lett. 2009, 4, 858. [Google Scholar] [CrossRef] [PubMed] [Green Version]
  3. Sneha, K.; Sathishkumar, M.; Mao, J.; Kwak, I.; Yun, Y.-S. Corynebacterium glutamicum-mediated crystallization of silver ions through sorption and reduction processes. Chem. Eng. J. 2010, 162, 989–996. [Google Scholar] [CrossRef]
  4. Binupriya, A.; Sathishkumar, M.; Yun, S.-I. Biocrystallization of silver and gold ions by inactive cell filtrate of Rhizopus stolonifer. Colloids Surf. B Biointerfaces 2010, 79, 531–534. [Google Scholar] [CrossRef] [PubMed]
  5. Narayanan, K.B.; Sakthivel, N. Biological synthesis of metal nanoparticles by microbes. Adv. Colloid Interface Sci. 2010, 156, 1–13. [Google Scholar] [CrossRef] [PubMed]
  6. Mata, Y.; Torres, E.; Blazquez, M.; Ballester, A.; González, F.; Munoz, J. Gold (III) biosorption and bioreduction with the brown alga Fucus vesiculosus. J. Hazard. Mater. 2009, 166, 612–618. [Google Scholar] [CrossRef]
  7. Fanti, J.R.; Tomiotto-Pellissier, F.; Miranda-Sapla, M.M.; Cataneo, A.H.D.; de Jesus Andrade, C.G.T.; Panis, C.; da Silva Rodrigues, J.H.; Wowk, P.F.; Kuczera, D.; Costa, I.N. Biogenic silver nanoparticles inducing Leishmania amazonensis promastigote and amastigote death in vitro. Acta Trop. 2018, 178, 46–54. [Google Scholar] [CrossRef]
  8. Almeida, É.S.; de Oliveira, D.; Hotza, D. Characterization of silver nanoparticles produced by biosynthesis mediated by Fusarium oxysporum under different processing conditions. Bioprocess Biosyst. Eng. 2017, 40, 1291–1303. [Google Scholar] [CrossRef]
  9. Ahmed, A.-A.; Hamzah, H.; Maaroof, M. Analyzing formation of silver nanoparticles from the filamentous fungus Fusarium oxysporum and their antimicrobial activity. Turk. J. Biol. 2018, 42, 54–62. [Google Scholar] [CrossRef]
  10. Asghari-Paskiabi, F.; Imani, M.; Razzaghi-Abyaneh, M.; Rafii-Tabar, H. Fusarium oxysporum, a bio-Factory for Nano Selenium Compounds: Synthesis and Characterization. Sci. Iran. 2018, 25, 1857–1863. [Google Scholar] [CrossRef] [Green Version]
  11. Pourali, P.; Badiee, S.H.; Manafi, S.; Noorani, T.; Rezaei, A.; Yahyaei, B. Biosynthesis of gold nanoparticles by two bacterial and fungal strains, Bacillus cereus and Fusarium oxysporum, and assessment and comparison of their nanotoxicity in vitro by direct and indirect assays. Electron. J. Biotechnol. 2017, 29, 86–93. [Google Scholar] [CrossRef]
  12. Pourali, P.; Yahyaei, B.; Afsharnezhad, S. Bio-Synthesis of Gold Nanoparticles by Fusarium oxysporum and Assessment of Their Conjugation Possibility with Two Types of β-Lactam Antibiotics without Any Additional Linkers. Microbiology 2018, 87, 229–237. [Google Scholar] [CrossRef]
  13. Yahyaei, B.; Peyvandi, N.; Akbari, H.; Arabzadeh, S.; Afsharnezhad, S.; Ajoudanifar, H.; Pourali, P. Production, assessment, and impregnation of hyaluronic acid with silver nanoparticles that were produced by Streptococcus pyogenes for tissue engineering applications. Appl. Biol. Chem. 2016, 59, 227–237. [Google Scholar] [CrossRef]
  14. Yahyaei, B.; Manafi, S.; Fahimi, B.; Arabzadeh, S.; Pourali, P. Production of electrospun polyvinyl alcohol/microbial synthesized silver nanoparticles scaffold for the treatment of fungating wounds. Appl. Nanosci. 2018, 8, 417–426. [Google Scholar] [CrossRef]
  15. Pourali, P.; Yahyaei, B.; Ajoudanifar, H.; Taheri, R.; Alavi, H.; Hoseini, A. Impregnation of the bacterial cellulose membrane with biologically produced silver nanoparticles. Curr. Microbiol. 2014, 69, 785–793. [Google Scholar] [CrossRef] [PubMed]
  16. Braydich-Stolle, L.K.; Lucas, B.; Schrand, A.; Murdock, R.C.; Lee, T.; Schlager, J.J.; Hussain, S.M.; Hofmann, M.-C. Silver nanoparticles disrupt GDNF/Fyn kinase signaling in spermatogonial stem cells. Toxicol. Sci. 2010, 116, 577–589. [Google Scholar] [CrossRef] [Green Version]
  17. Pourali, P.; Razavian Zadeh, N.; Yahyaei, B. Silver nanoparticles production by two soil isolated bacteria, Bacillus thuringiensis and Enterobacter cloacae, and assessment of their cytotoxicity and wound healing effect in rats. Wound Repair Regen. 2016, 24, 860–869. [Google Scholar] [CrossRef]
  18. Song, H.-P.; Li, X.-G.; Sun, J.-S.; Xu, S.-M.; Han, X. Application of a magnetotactic bacterium, Stenotrophomonas sp. to the removal of Au (III) from contaminated wastewater with a magnetic separator. Chemosphere 2008, 72, 616–621. [Google Scholar] [CrossRef]
  19. Park, S.; Lee, W.J.; Park, S.; Choi, D.; Kim, S.; Park, N. Reversibly pH-responsive gold nanoparticles and their applications for photothermal cancer therapy. Sci. Rep. 2019, 9, 20180. [Google Scholar] [CrossRef] [Green Version]
  20. Yahyaei, B.; Pourali, P. One step conjugation of some chemotherapeutic drugs to the biologically produced gold nanoparticles and assessment of their anticancer effects. Sci. Rep. 2019, 9, 10242. [Google Scholar] [CrossRef] [Green Version]
  21. Lomelí-Marroquín, D.; Cruz, D.M.; Nieto-Argüello, A.; Crua, A.V.; Chen, J.; Torres-Castro, A.; Webster, T.J.; Cholula-Díaz, J.L. Starch-mediated synthesis of mono-and bimetallic silver/gold nanoparticles as antimicrobial and anticancer agents. Int. J. Nanomed. 2019, 14, 2171. [Google Scholar] [CrossRef] [Green Version]
  22. Pourali, P.; Baserisalehi, M.; Afsharnezhad, S.; Behravan, J.; Ganjali, R.; Bahador, N.; Arabzadeh, S. The effect of temperature on antibacterial activity of biosynthesized silver nanoparticles. Biometals 2013, 26, 189–196. [Google Scholar] [CrossRef]
  23. Zhou, Y.; Kong, Y.; Kundu, S.; Cirillo, J.D.; Liang, H. Antibacterial activities of gold and silver nanoparticles against Escherichia coli and bacillus Calmette-Guérin. J. Nanobiotechnol. 2012, 10, 19. [Google Scholar] [CrossRef] [PubMed] [Green Version]
  24. Lu, X.; Qian, J.; Zhou, H.; Gan, Q.; Tang, W.; Lu, J.; Yuan, Y.; Liu, C. In vitro cytotoxicity and induction of apoptosis by silica nanoparticles in human HepG2 hepatoma cells. Int. J. Nanomed. 2011, 6, 1889. [Google Scholar]
  25. Altunbek, M.; Kuku, G.; Culha, M. Gold nanoparticles in single-cell analysis for surface enhanced Raman scattering. Molecules 2016, 21, 1617. [Google Scholar] [CrossRef] [PubMed] [Green Version]
  26. Mehta, B.; Chhajlani, M.; Shrivastava, B. Green synthesis of silver nanoparticles and their characterization by XRD. J. Phys. Conf. Ser. 2017, 836, 012050. [Google Scholar] [CrossRef] [Green Version]
  27. Shaligram, N.S.; Bule, M.; Bhambure, R.; Singhal, R.S.; Singh, S.K.; Szakacs, G.; Pandey, A. Biosynthesis of silver nanoparticles using aqueous extract from the compactin producing fungal strain. Process Biochem. 2009, 44, 939–943. [Google Scholar] [CrossRef]
  28. Binupriya, A.R.; Sathishkumar, M.; Yun, S.-I. Myco-crystallization of silver ions to nanosized particles by live and dead cell filtrates of Aspergillus oryzae var. viridis and its bactericidal activity toward Staphylococcus aureus KCCM 12256. Ind. Eng. Chem. Res. 2009, 49, 852–858. [Google Scholar] [CrossRef]
  29. Salvadori, M.R.; Lepre, L.F.; Ando, R.m.A.; do Nascimento, C.A.O.; Corrêa, B. Biosynthesis and uptake of copper nanoparticles by dead biomass of Hypocrea lixii isolated from the metal mine in the Brazilian Amazon region. PLoS ONE 2013, 8, e80519. [Google Scholar] [CrossRef]
  30. Salvadori, M.R.; Nascimento, C.A.O.; Corrêa, B. Nickel oxide nanoparticles film produced by dead biomass of filamentous fungus. Sci. Rep. 2014, 4, 6404. [Google Scholar] [CrossRef] [Green Version]
  31. Foldbjerg, R.; Dang, D.A.; Autrup, H. Cytotoxicity and genotoxicity of silver nanoparticles in the human lung cancer cell line, A549. Arch. Toxicol. 2011, 85, 743–750. [Google Scholar] [CrossRef] [PubMed]
  32. Lee, Y.-H.; Cheng, F.-Y.; Chiu, H.-W.; Tsai, J.-C.; Fang, C.-Y.; Chen, C.-W.; Wang, Y.-J. Cytotoxicity, oxidative stress, apoptosis and the autophagic effects of silver nanoparticles in mouse embryonic fibroblasts. Biomaterials 2014, 35, 4706–4715. [Google Scholar] [CrossRef] [PubMed]
  33. Kumar, G.; Degheidy, H.; Casey, B.J.; Goering, P.L. Flow cytometry evaluation of in vitro cellular necrosis and apoptosis induced by silver nanoparticles. Food Chem. Toxicol. 2015, 85, 45–51. [Google Scholar] [CrossRef] [PubMed]
Figure 1. F. oxysporum biomass in the culture medium.
Nanomanufacturing 03 00016 g001
Figure 2. Four tested flasks pretreated under different conditions: flasks placed in refrigerator, autoclave, hot air oven, and the flask placed at room temperature.
Nanomanufacturing 03 00016 g002
Figure 3. Four tested flasks after SNP production. Different intensities of color were observed in the flasks.
Nanomanufacturing 03 00016 g003
Figure 4. Visible spectra obtained from four different samples tested. The maximum absorbance peak was different for each sample and is shown in this figure. The maximum and minimum ODs were for the SNPs pretreated with a hot air oven and refrigerator, respectively. The samples were diluted 1:10.
Nanomanufacturing 03 00016 g004
Figure 5. The obtained TEM digital images of four tested samples. (A). sample of the flask incubated in the hot air oven before the SNPs were prepared. (B). Sample of flask incubated in the refrigerator before SNPs production. (C). Sample of flask incubated at RT prior to SNPs production; and (D). Sample of flask incubated in autoclave prior to SNPs production.
Nanomanufacturing 03 00016 g005aNanomanufacturing 03 00016 g005b
Figure 6. The XRD spectrum obtained from the RT pretreated sample.
Nanomanufacturing 03 00016 g006
Figure 7. The cell viability percent of the cells based on the results of the MTT assay.
Nanomanufacturing 03 00016 g007
Figure 8. Apoptosis induction assay of the cells and the obtained percentages of cell viability for the four SNPs and the control samples.
Nanomanufacturing 03 00016 g008
Table 1. The zeta potential values and average sizes of SNPs.
The Produced SNPs after Different PretreatmentsZ-Average (nm)Zeta Potential (mV)
Pretreated in a hot air oven60 ± 2−21.23 ± 1.10
Pretreated in a refrigerator62 ± 5−19.36 ± 0.54
Pretreated at RT55 ± 4−21.34 ± 0.97
Pretreated in an autoclave52 ± 4−21.35 ± 0.45
Table 2. The obtained SNP concentration for each sample using ICP-OES 730-ES instrument.
SampleWavelength (nm): 328.068, Element: Ag (1 mg/mL)
Concentration (ppm) (Mean ± sd)
Blank (ppm)0.00 ± 0.00
Pretreated in a hot air oven3.20 ± 0.02
Pretreated in a refrigerator2.63 ± 0.00
Pretreated at RT3.52 ± 0.02
Pretreated in an autoclave3.58 ± 0.05
Table 3. The results of antibacterial activity of the four test samples and silver nitrate solution as a control. The tests were carried out thrice.
The Produced SNPs after Different PretreatmentsInhibition Zones (mm) of the SNPs against the Tested Bacterial Strains (Mean ± sd)
E. coliP. aeruginosaS. aureus
Hot air oven08.0 ± 0.411.0 ± 1.010.5 ± 0.9
Refrigerator10.0 ± 0.707.0 ± 0.610.5 ± 0.2
RT11.0 ± 0.811.0 ± 0.211.0 ± 0.3
Autoclave10.0 ± 0.711.0 ± 0.611.0 ± 0.6
Silver nitrate12.5 ± 0.612.0 ± 0.611.0 ± 0.6
Disclaimer/Publisher’s Note: The statements, opinions and data contained in all publications are solely those of the individual author(s) and contributor(s) and not of MDPI and/or the editor(s). MDPI and/or the editor(s) disclaim responsibility for any injury to people or property resulting from any ideas, methods, instructions or products referred to in the content.

