
New Machine Learning Approach for the Optimization of Nano-Hybrid Formulations

 ,
,  ,
,  , ,
, ,  ,
,  ,
, 
Abstract
:
1. Introduction
2. Materials and Methods
2.1. Materials
2.2. Methods
2.2.1. Preparation of the Nanocarriers
2.2.2. Characterization of the Nanocarriers
Physical Behavior of Systems
Phase Behavior Experimental Design using Machine Learning
β-Lap Solubility in Nanosystems: Factorial and Machine Learning Analyses
Design of Experiments by Central Composite Design
Design of Experiments by Machine Learning (MLP and SVM)
3. Results and discussion
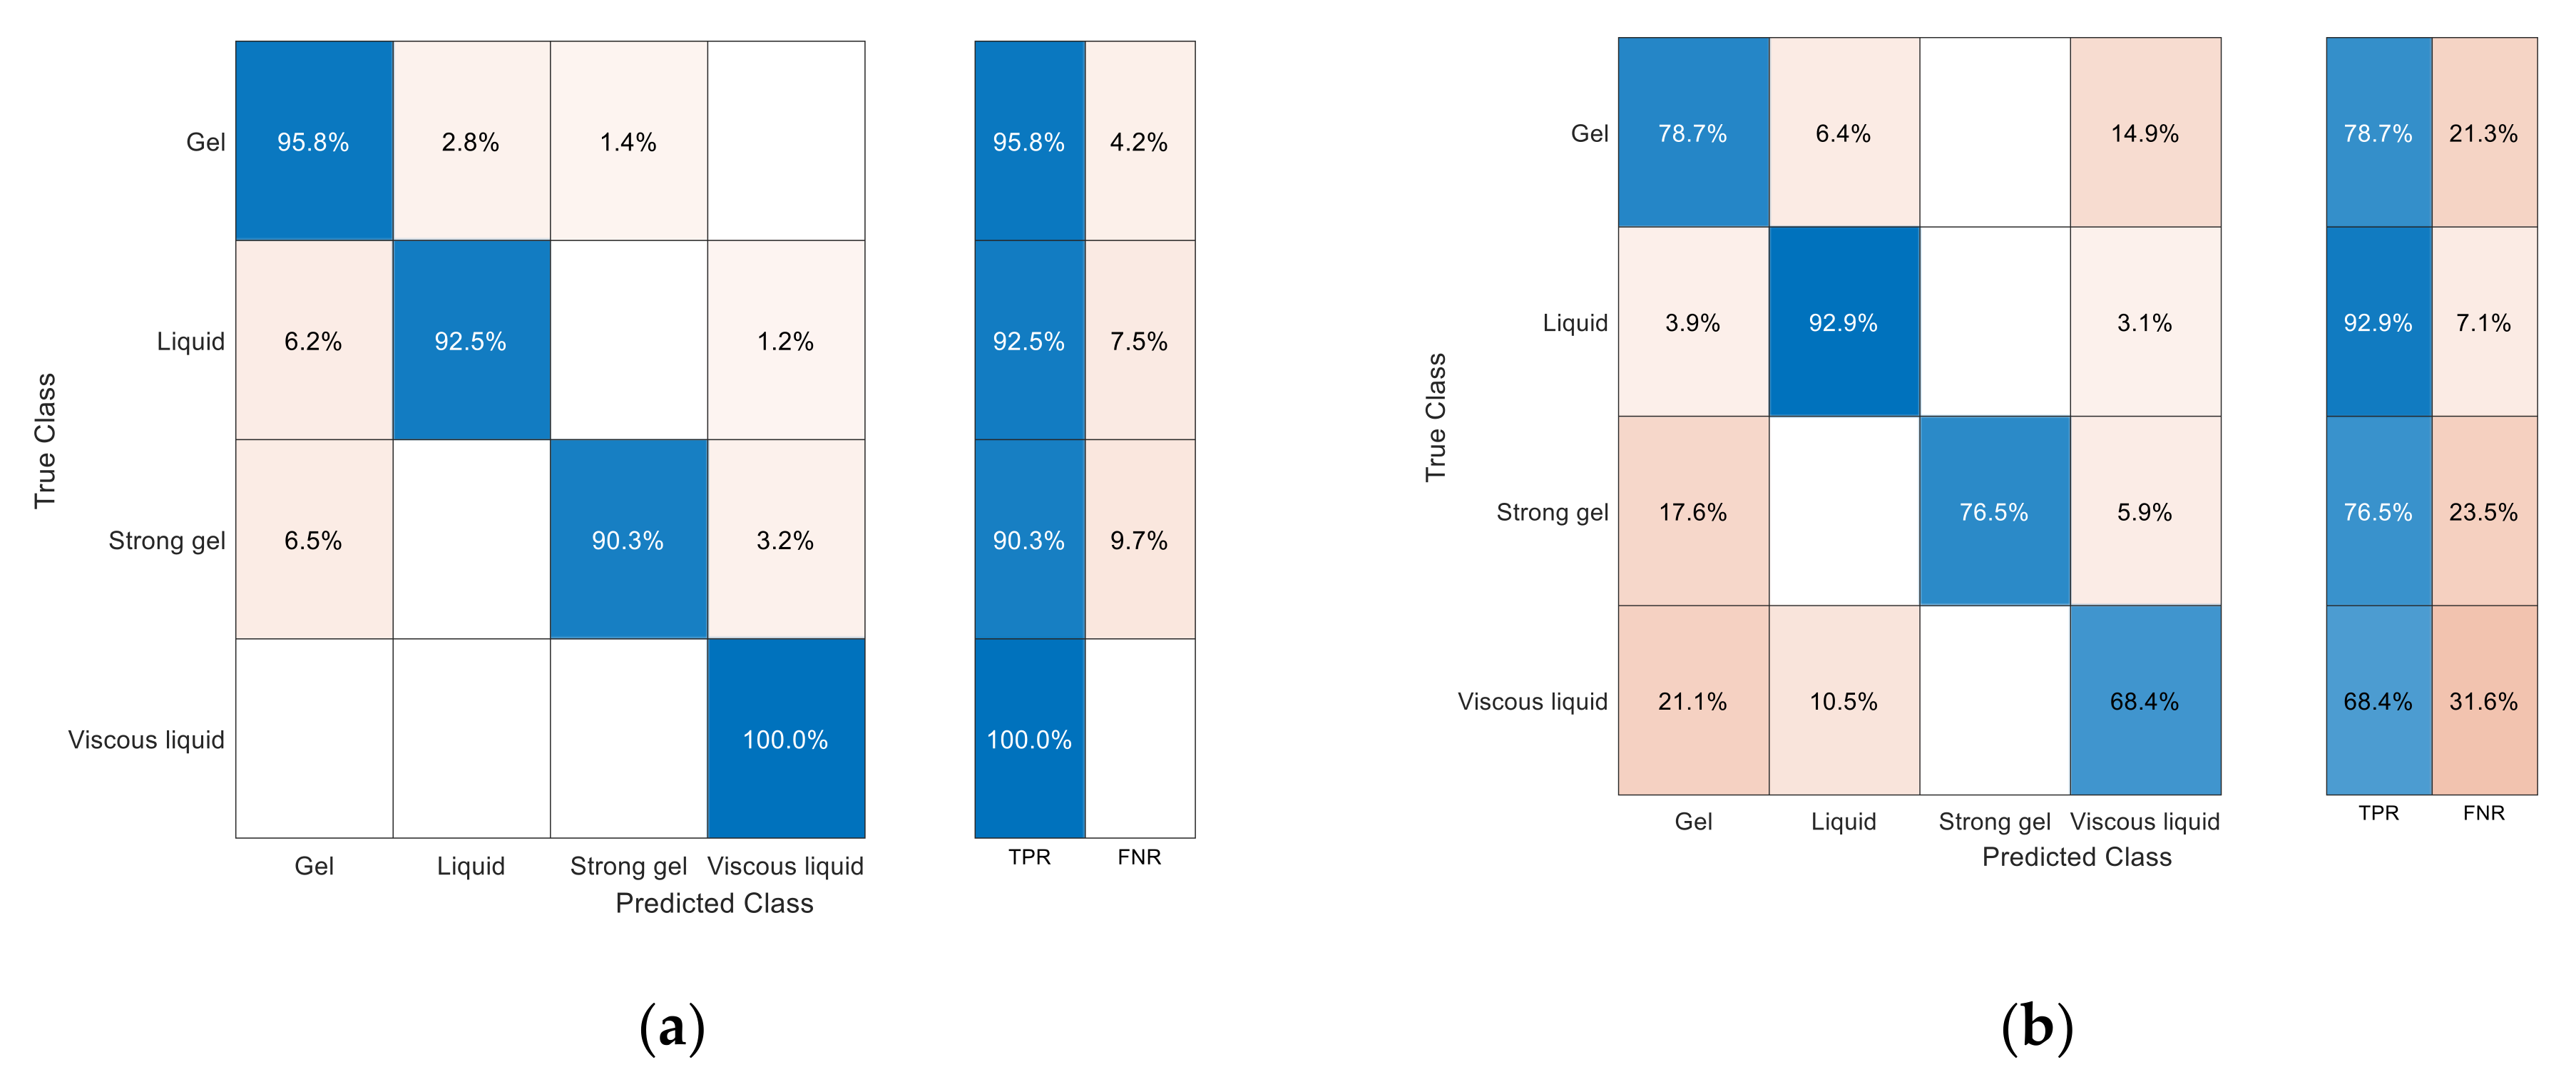
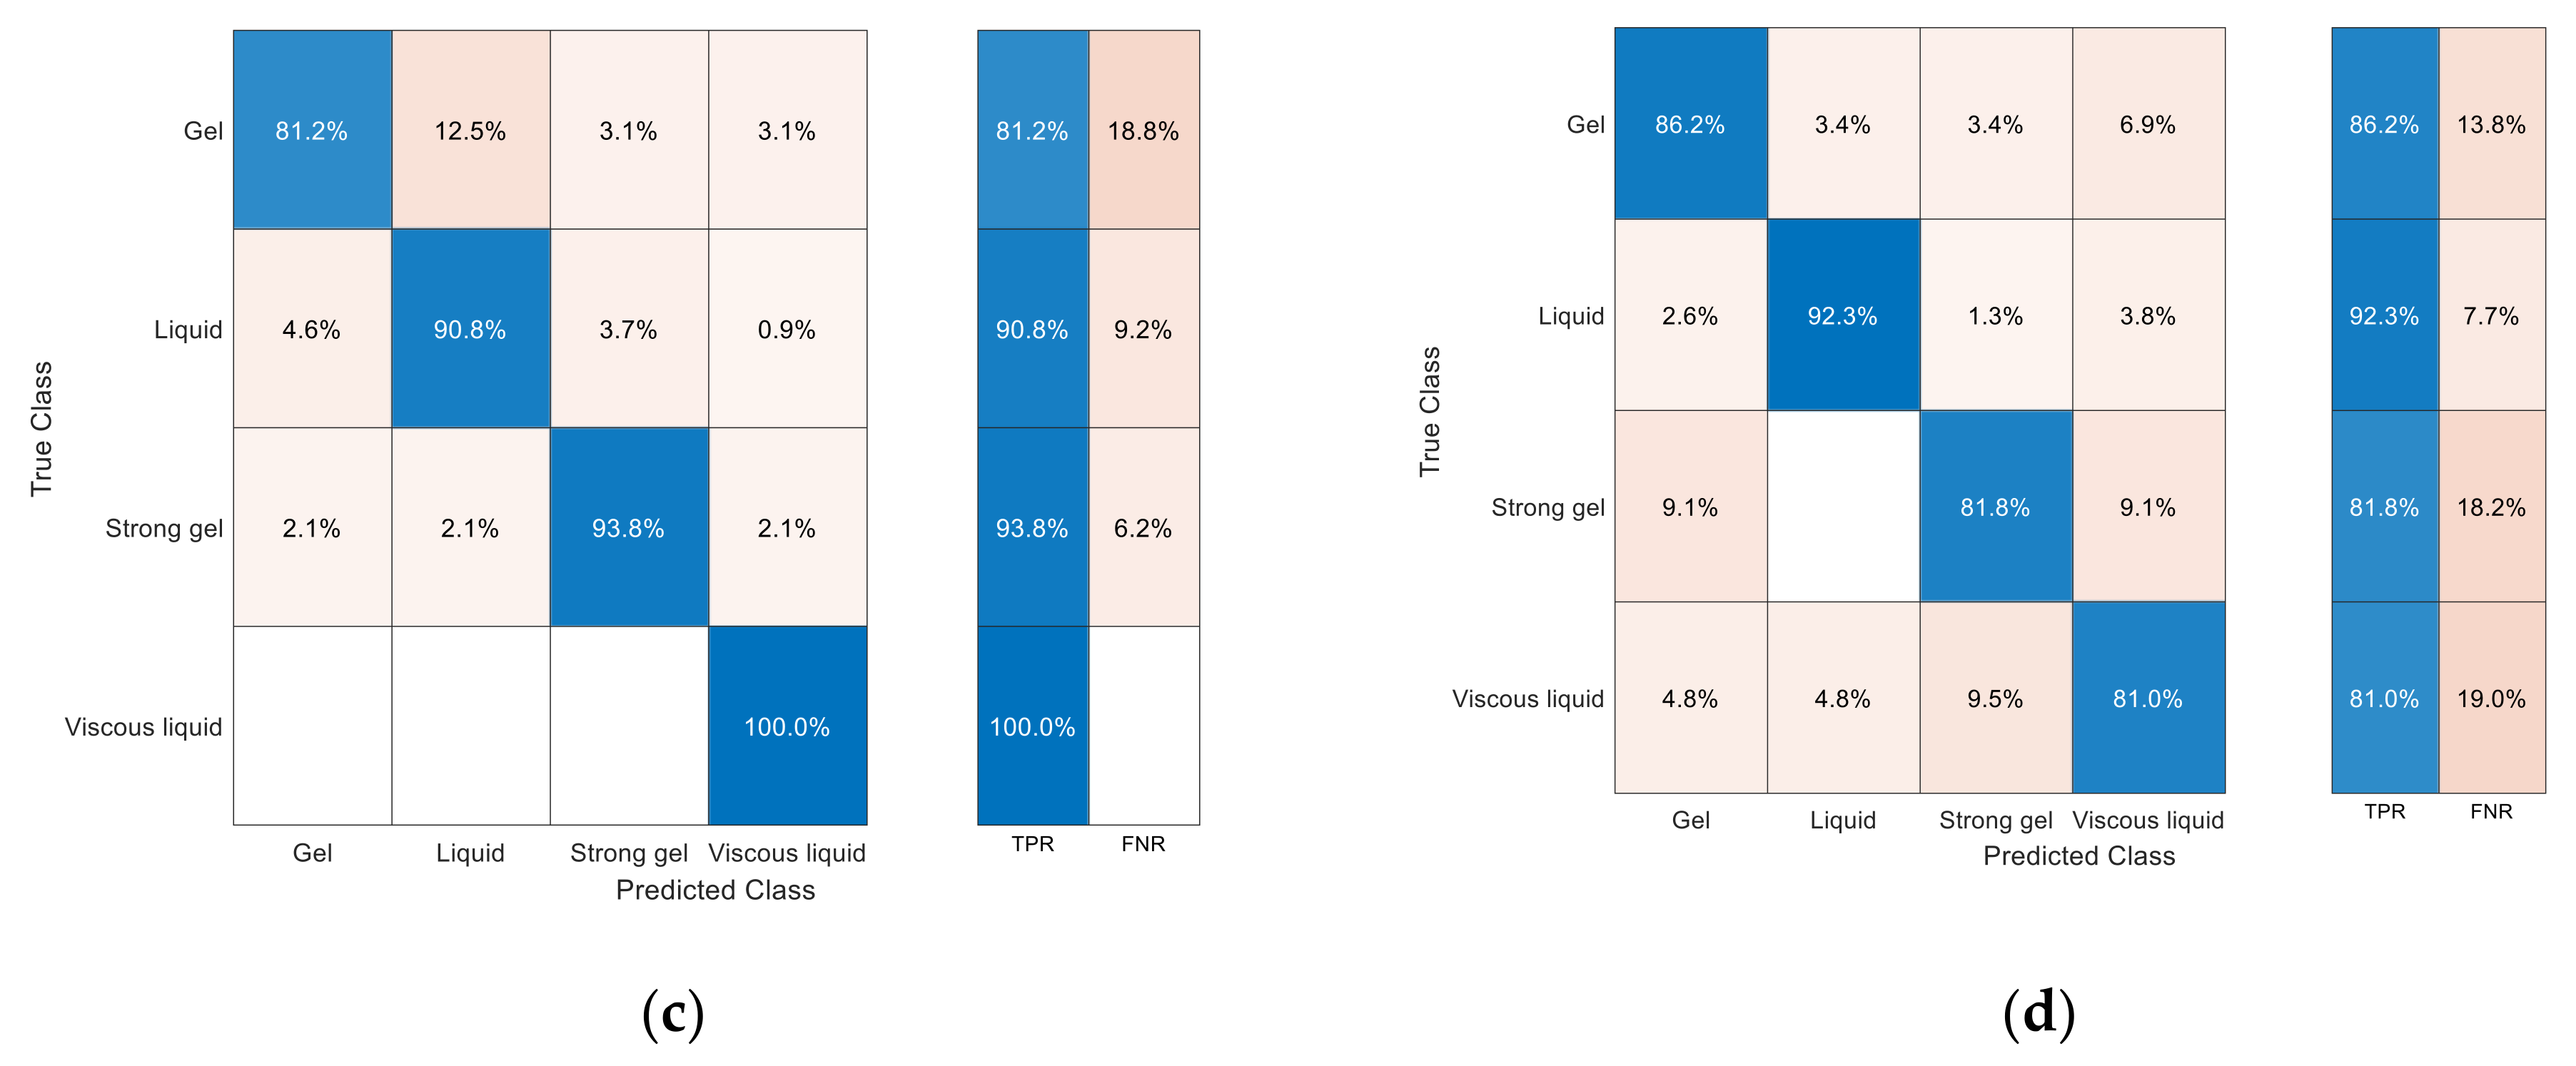
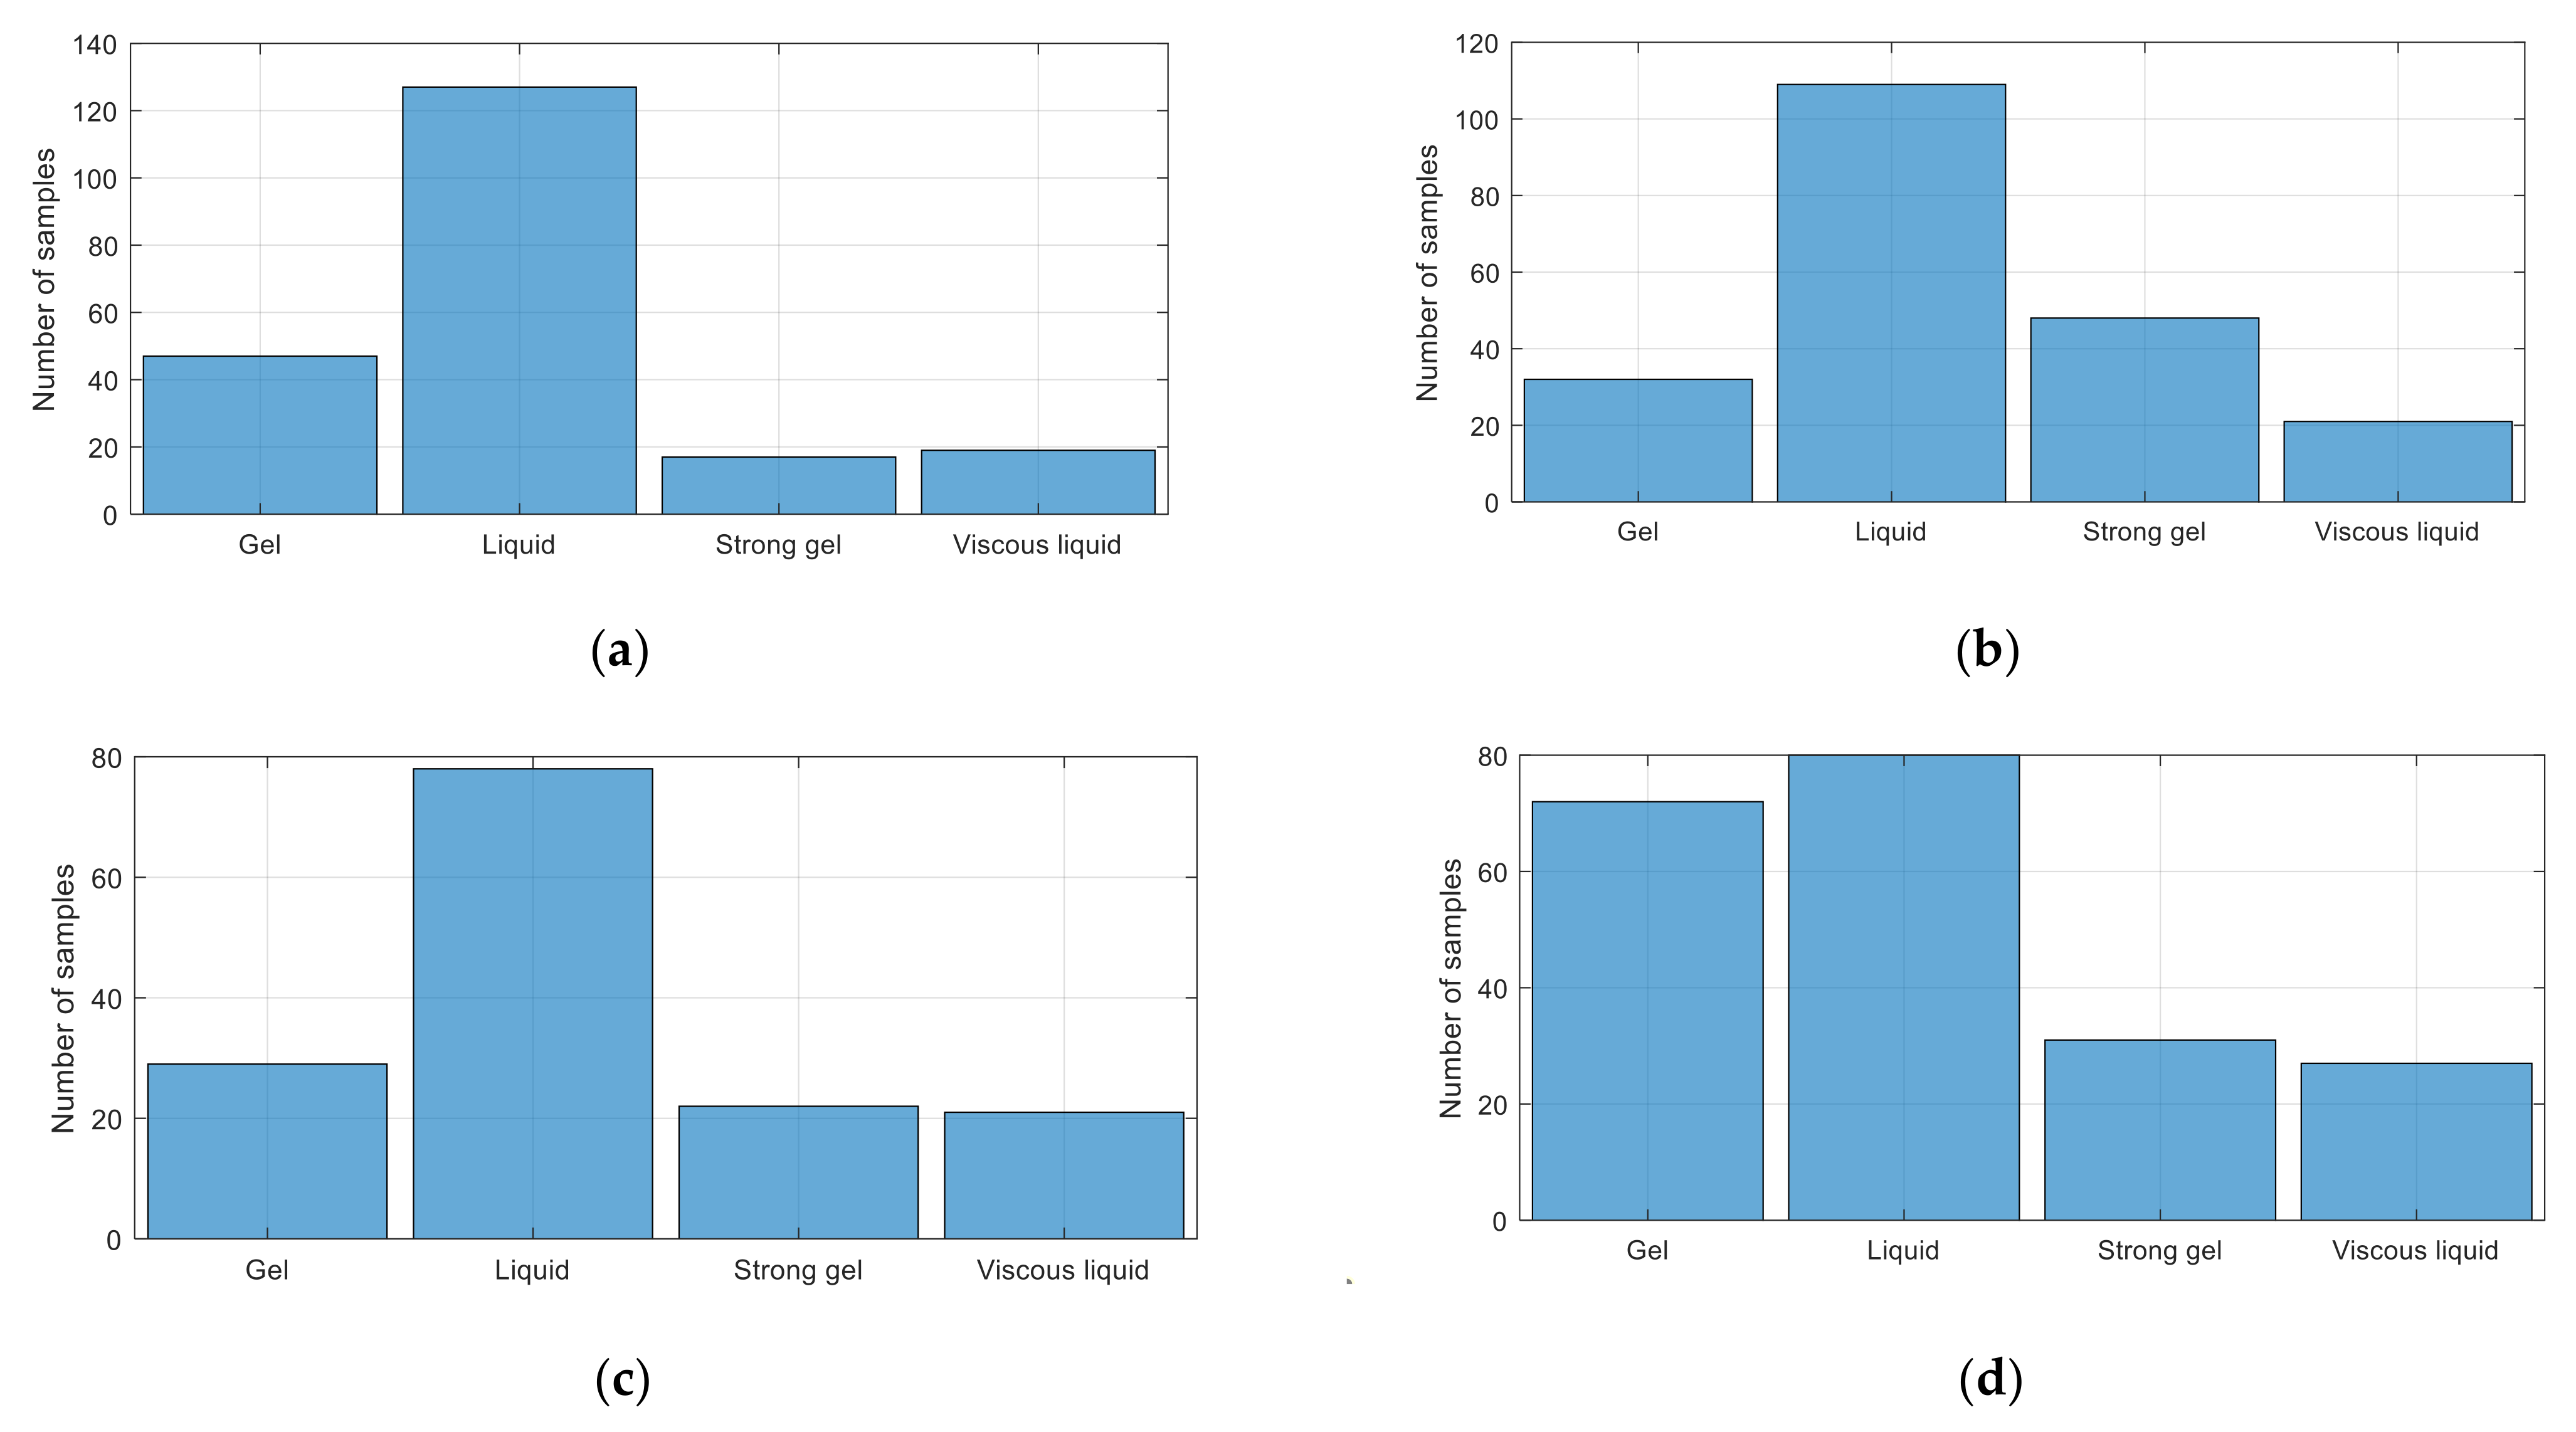
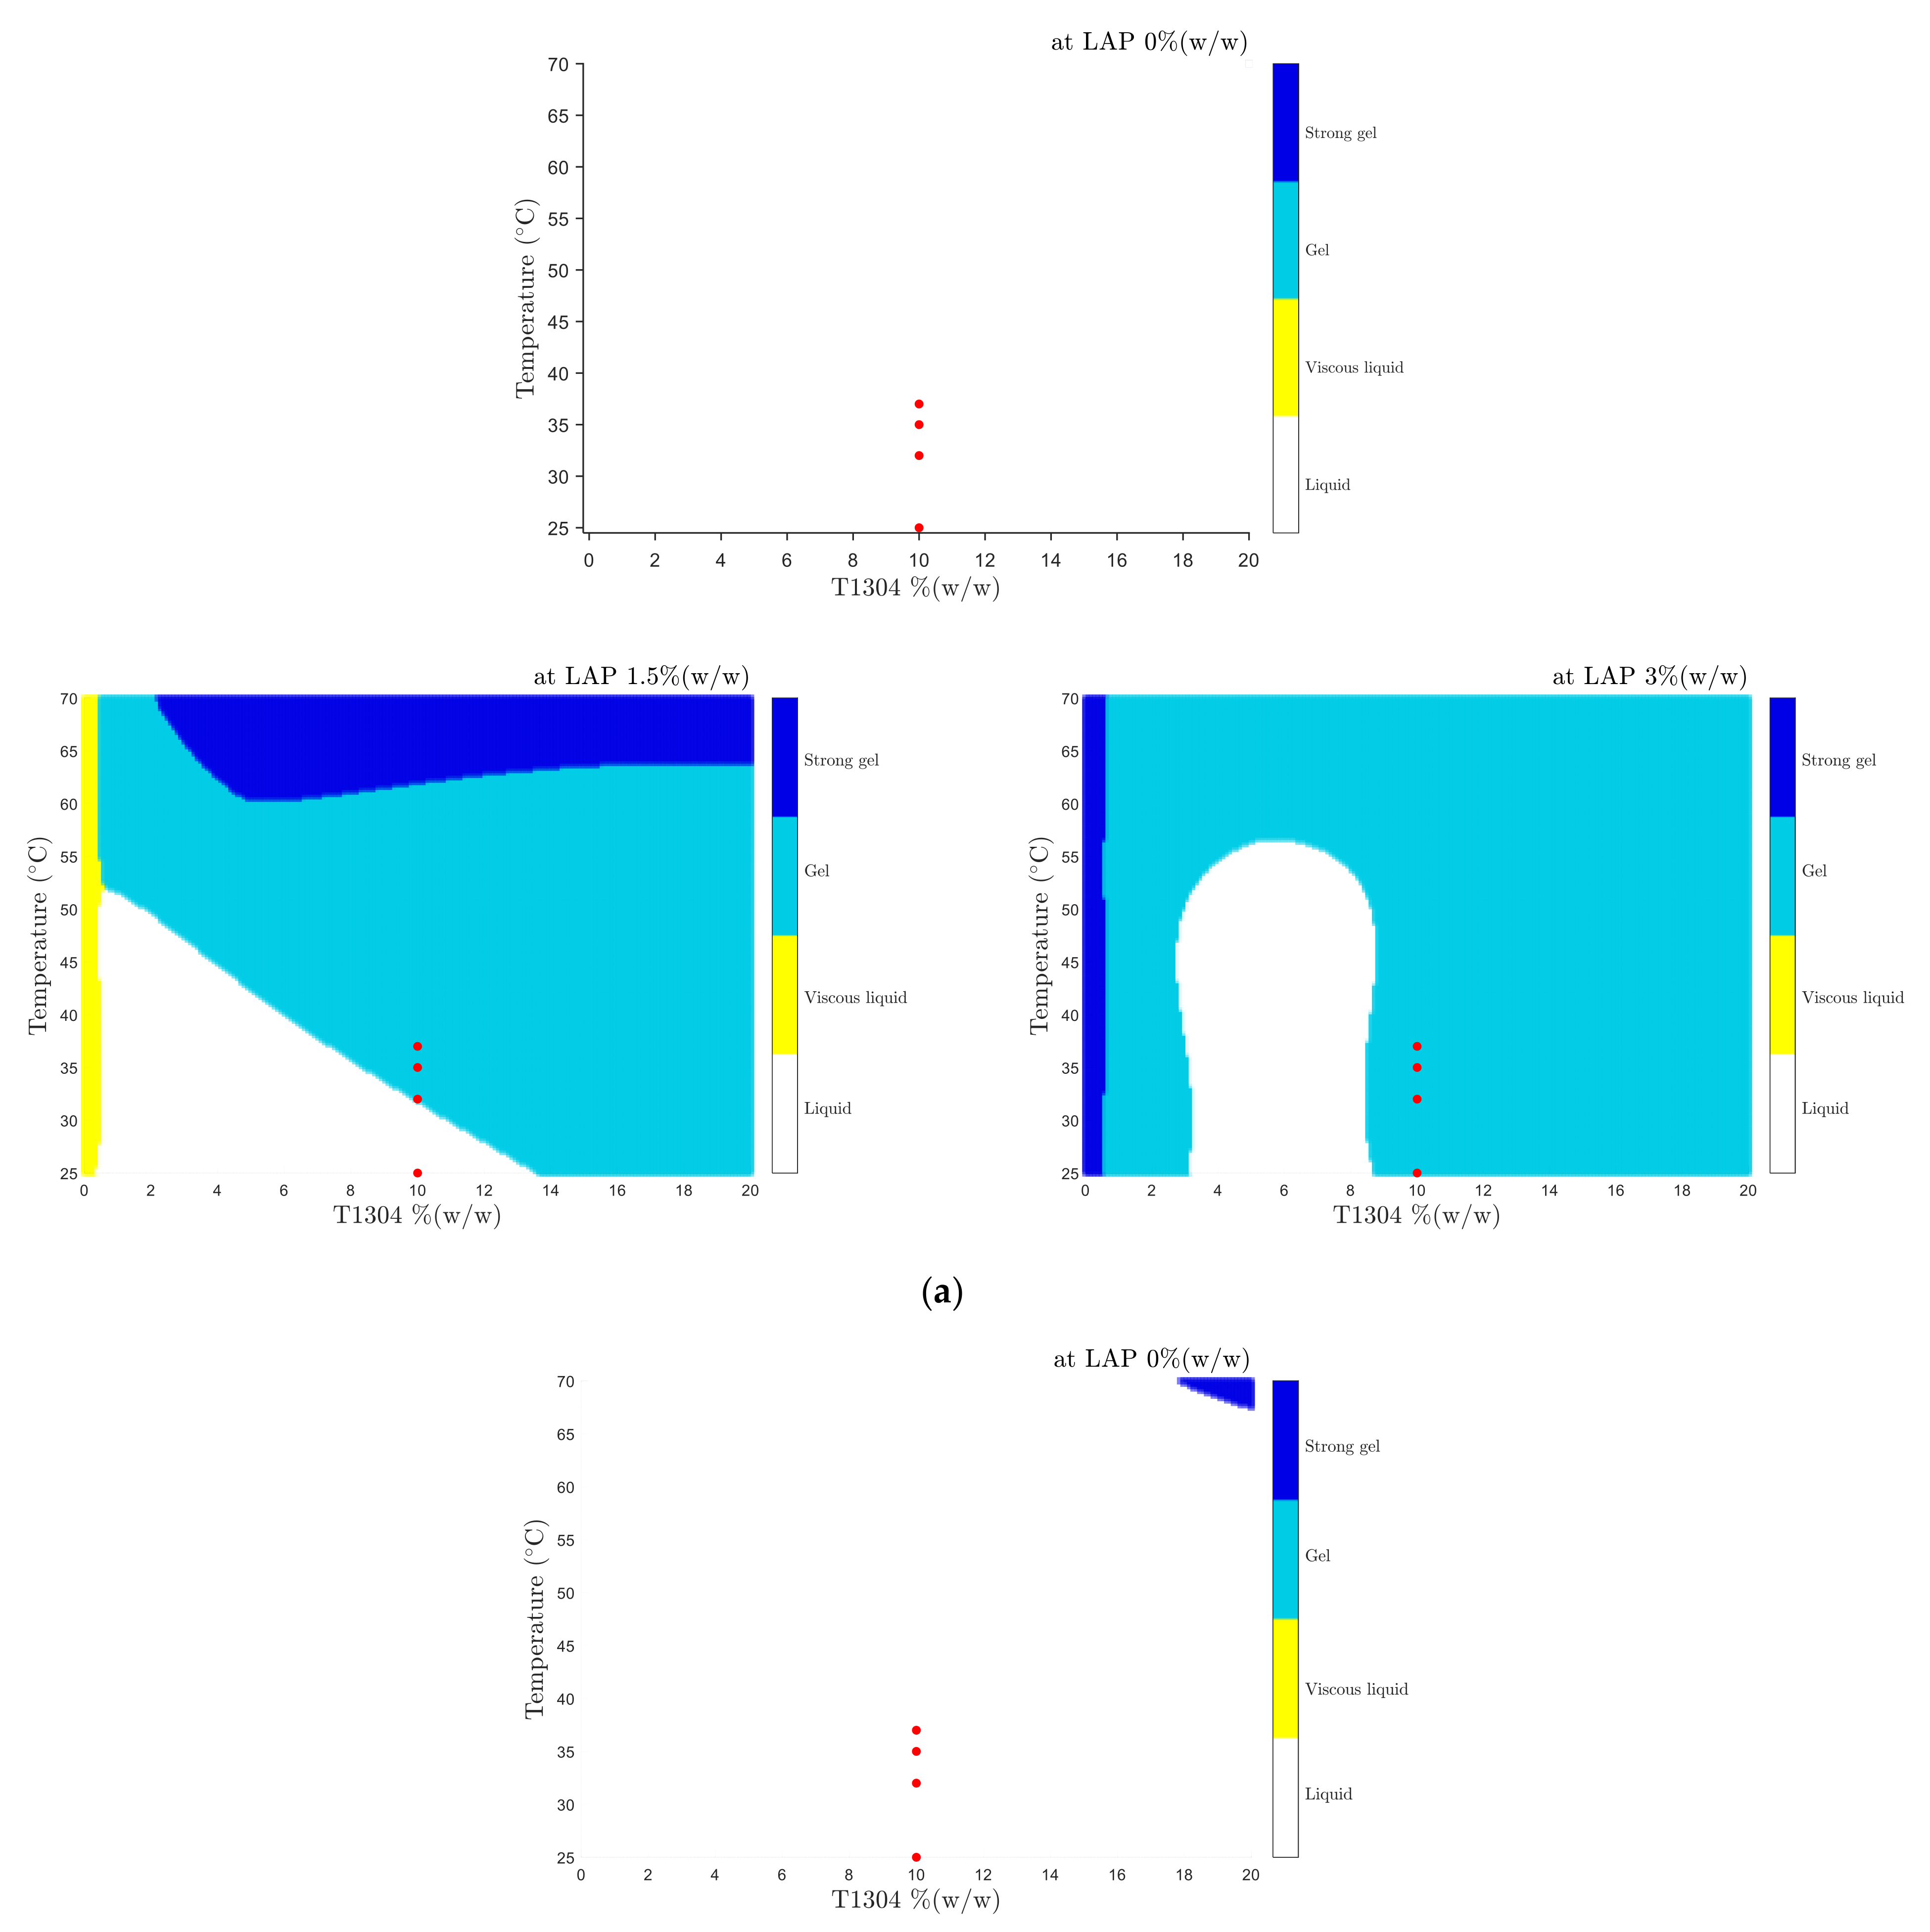
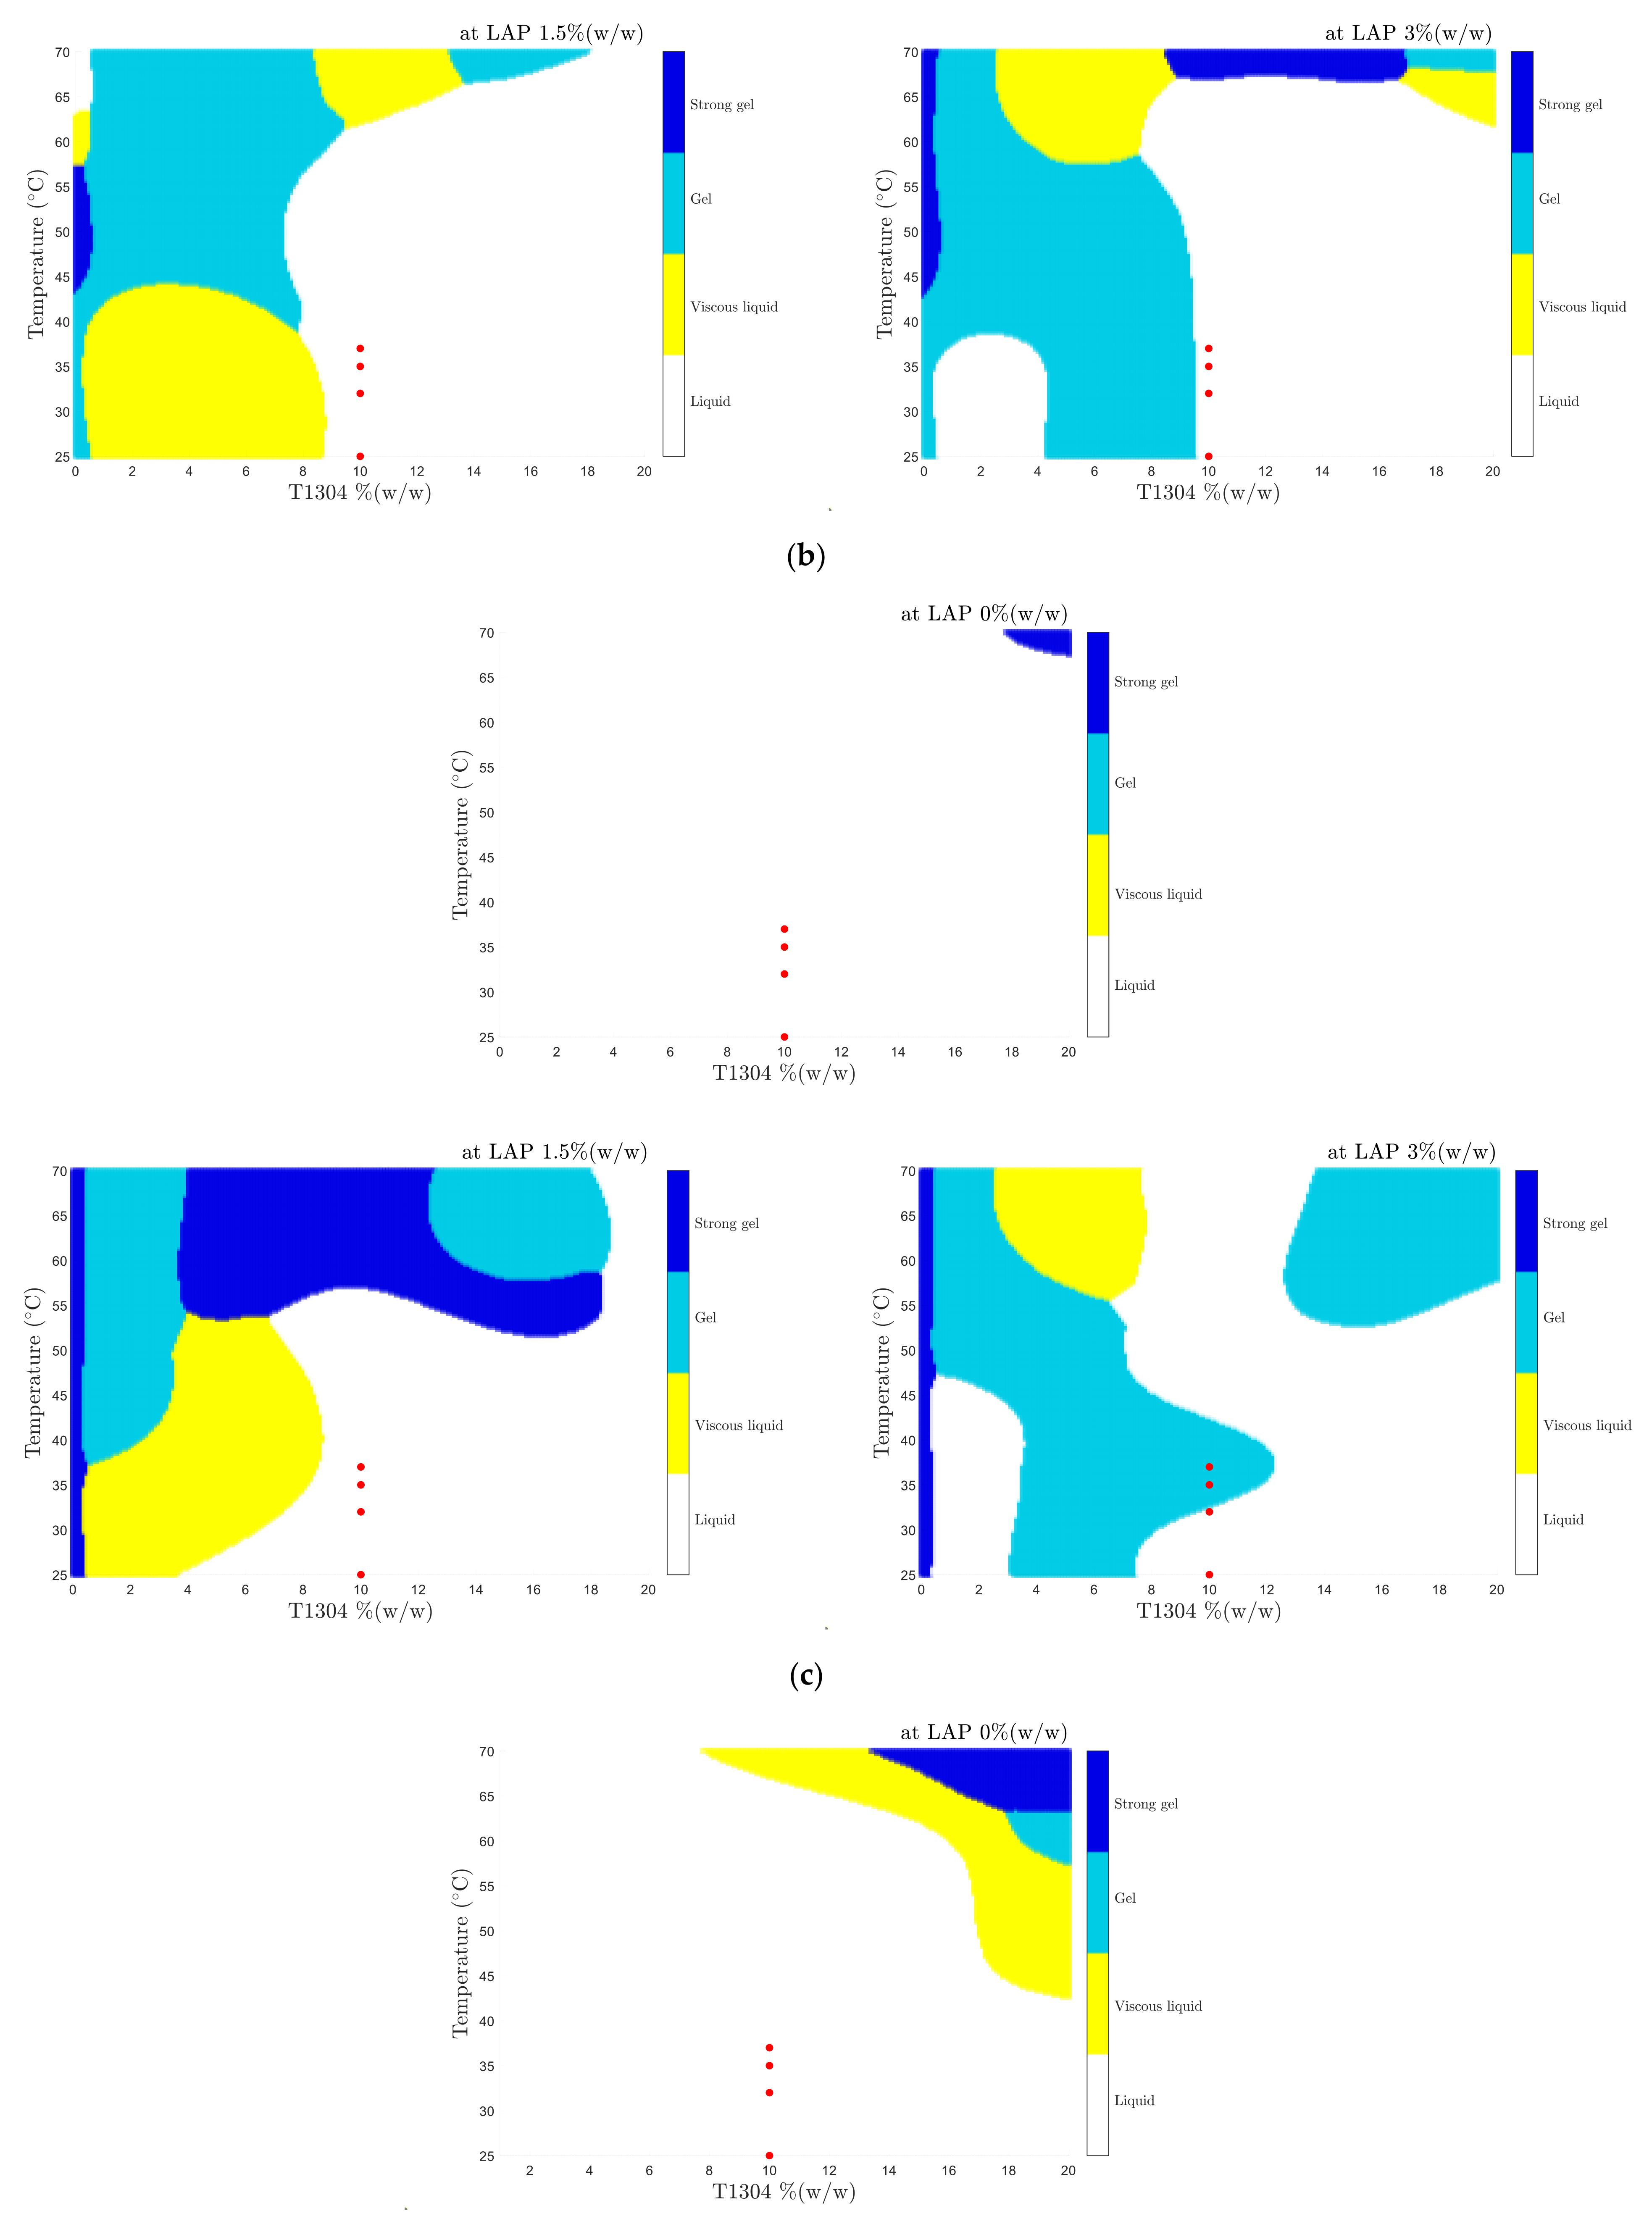
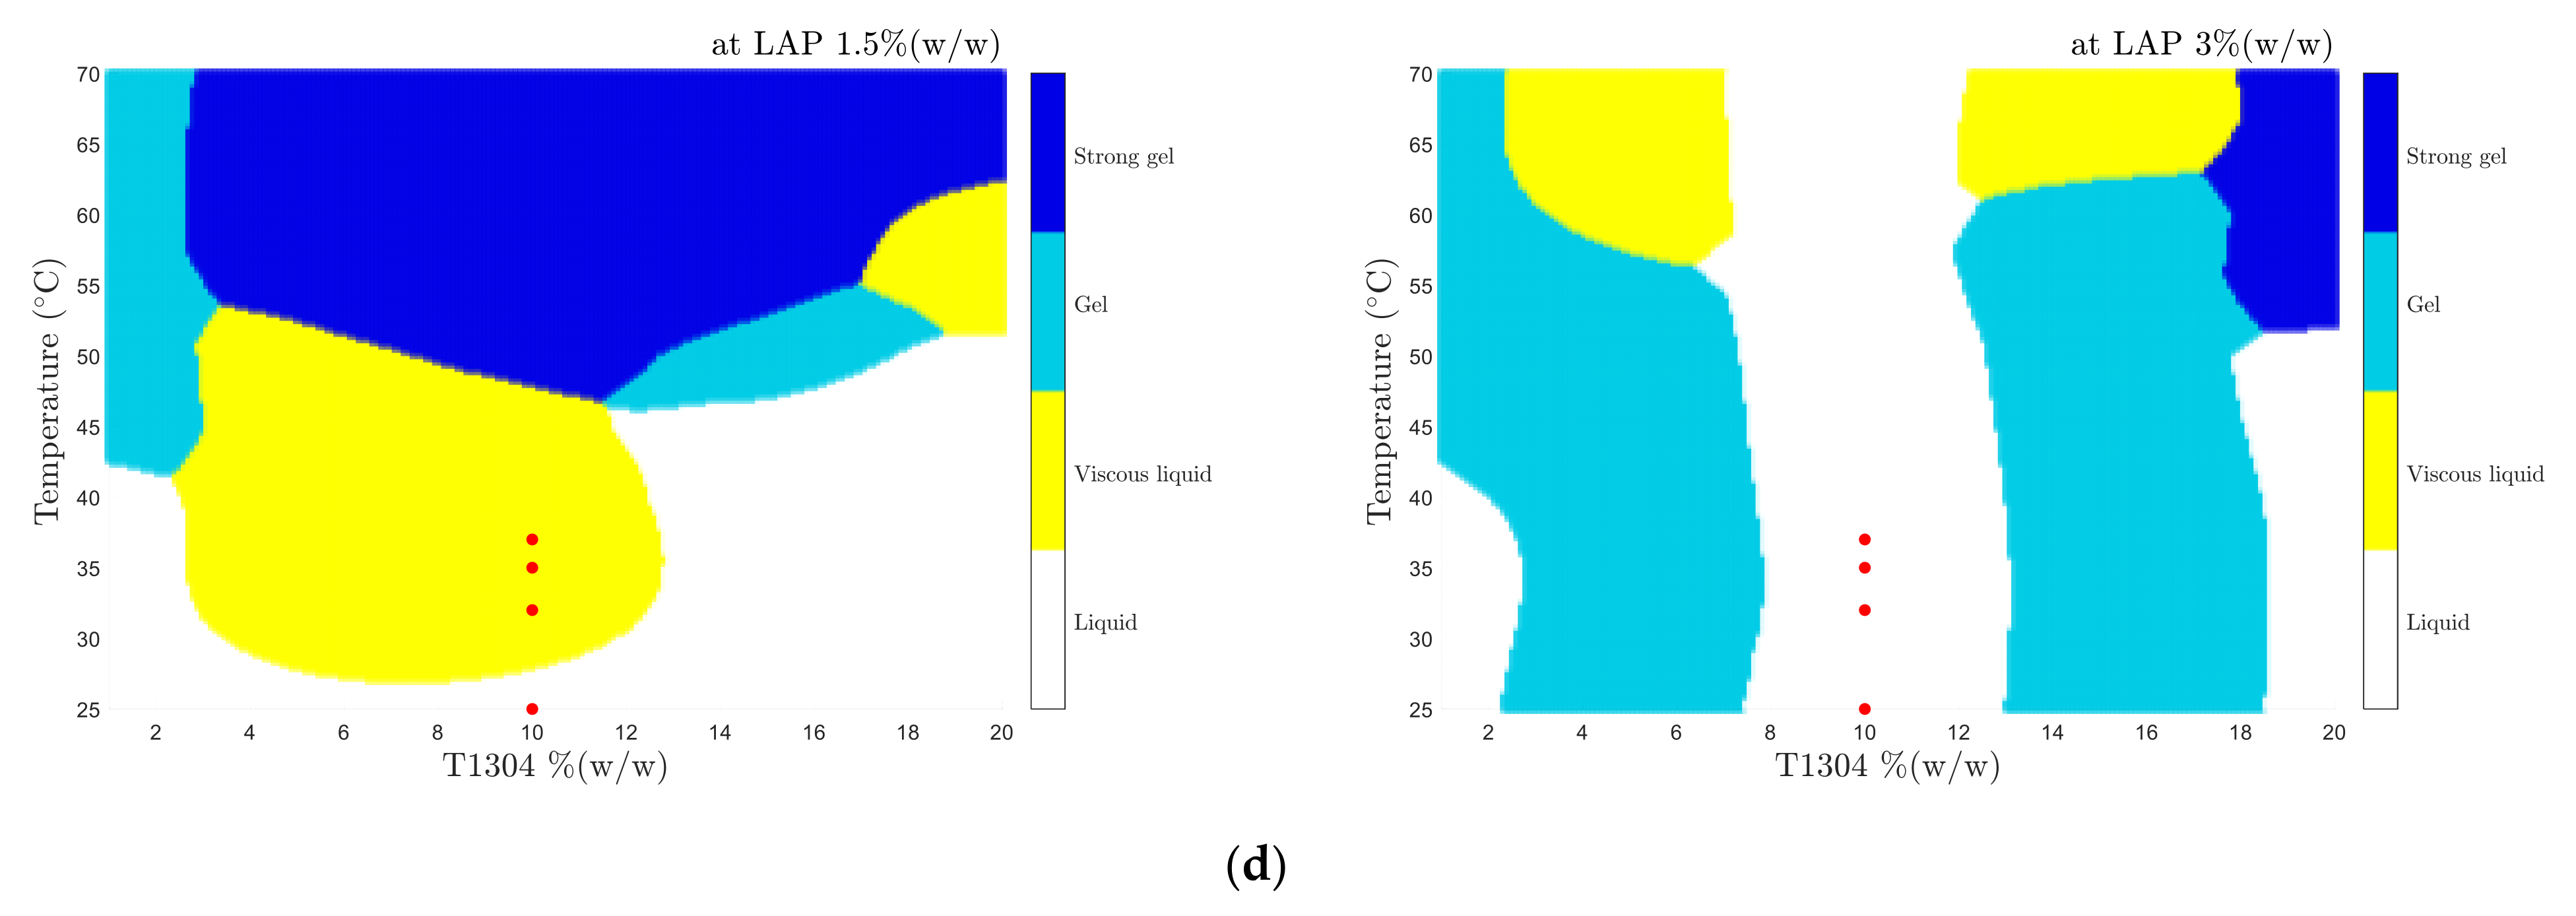
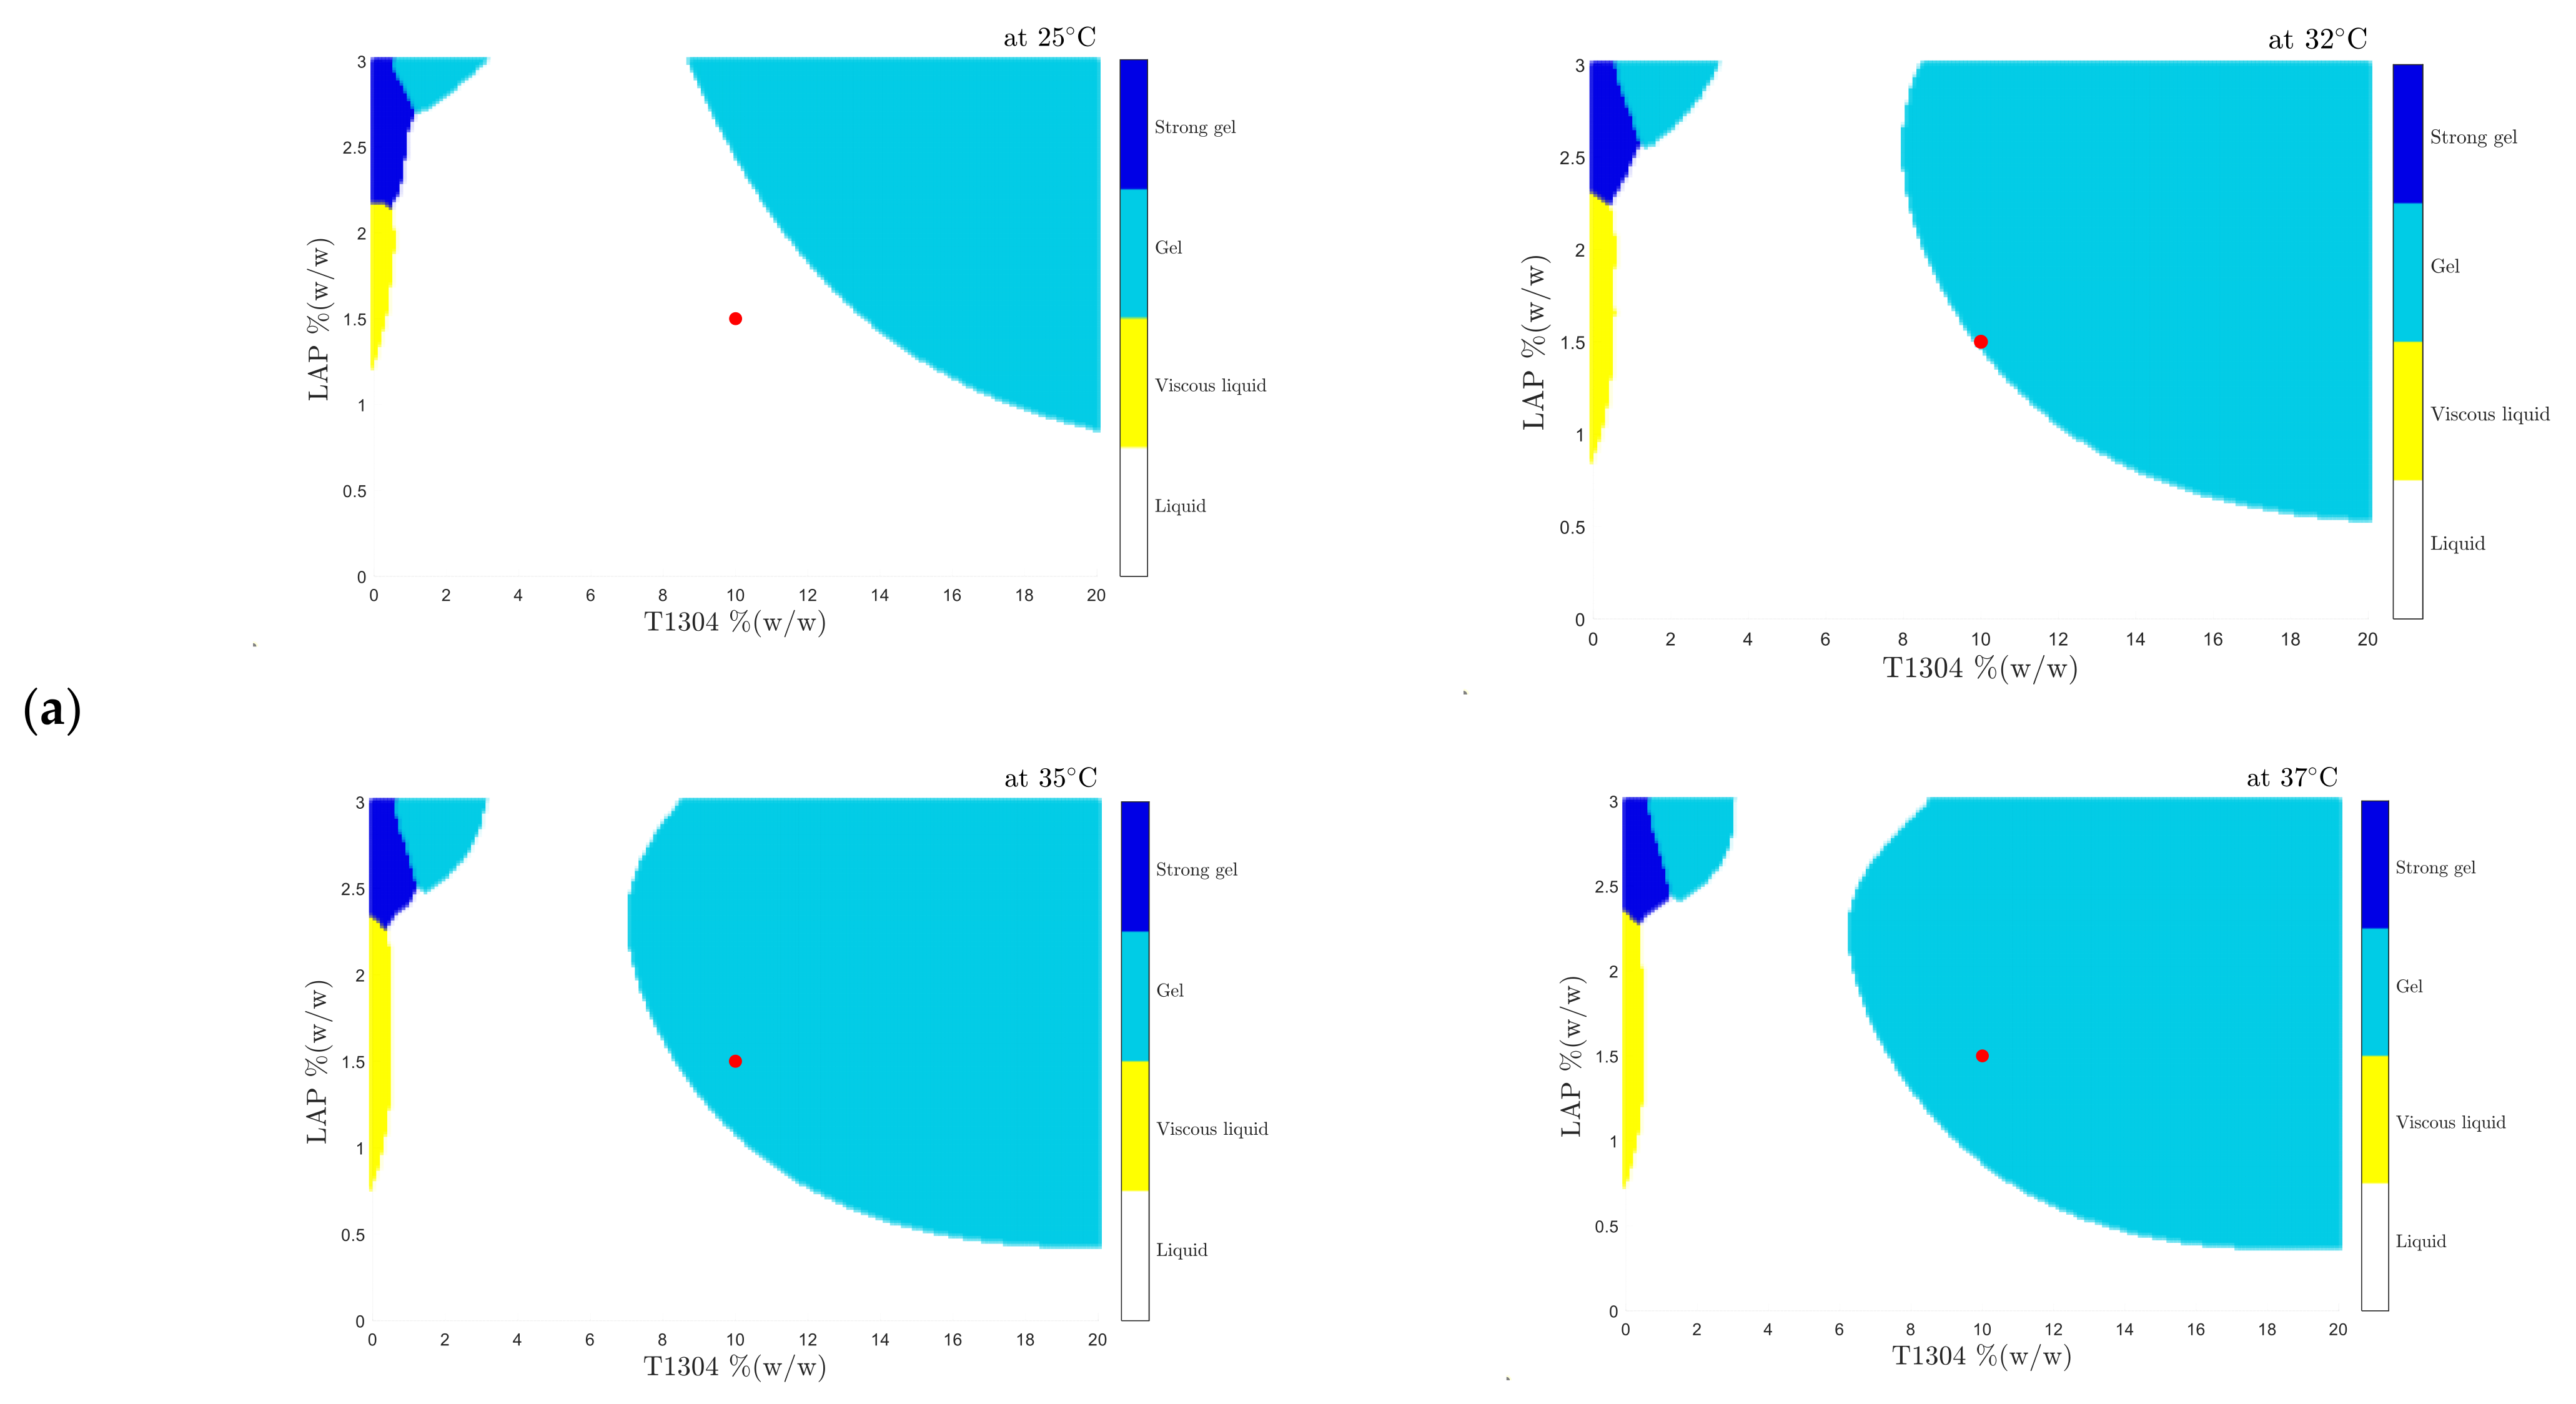
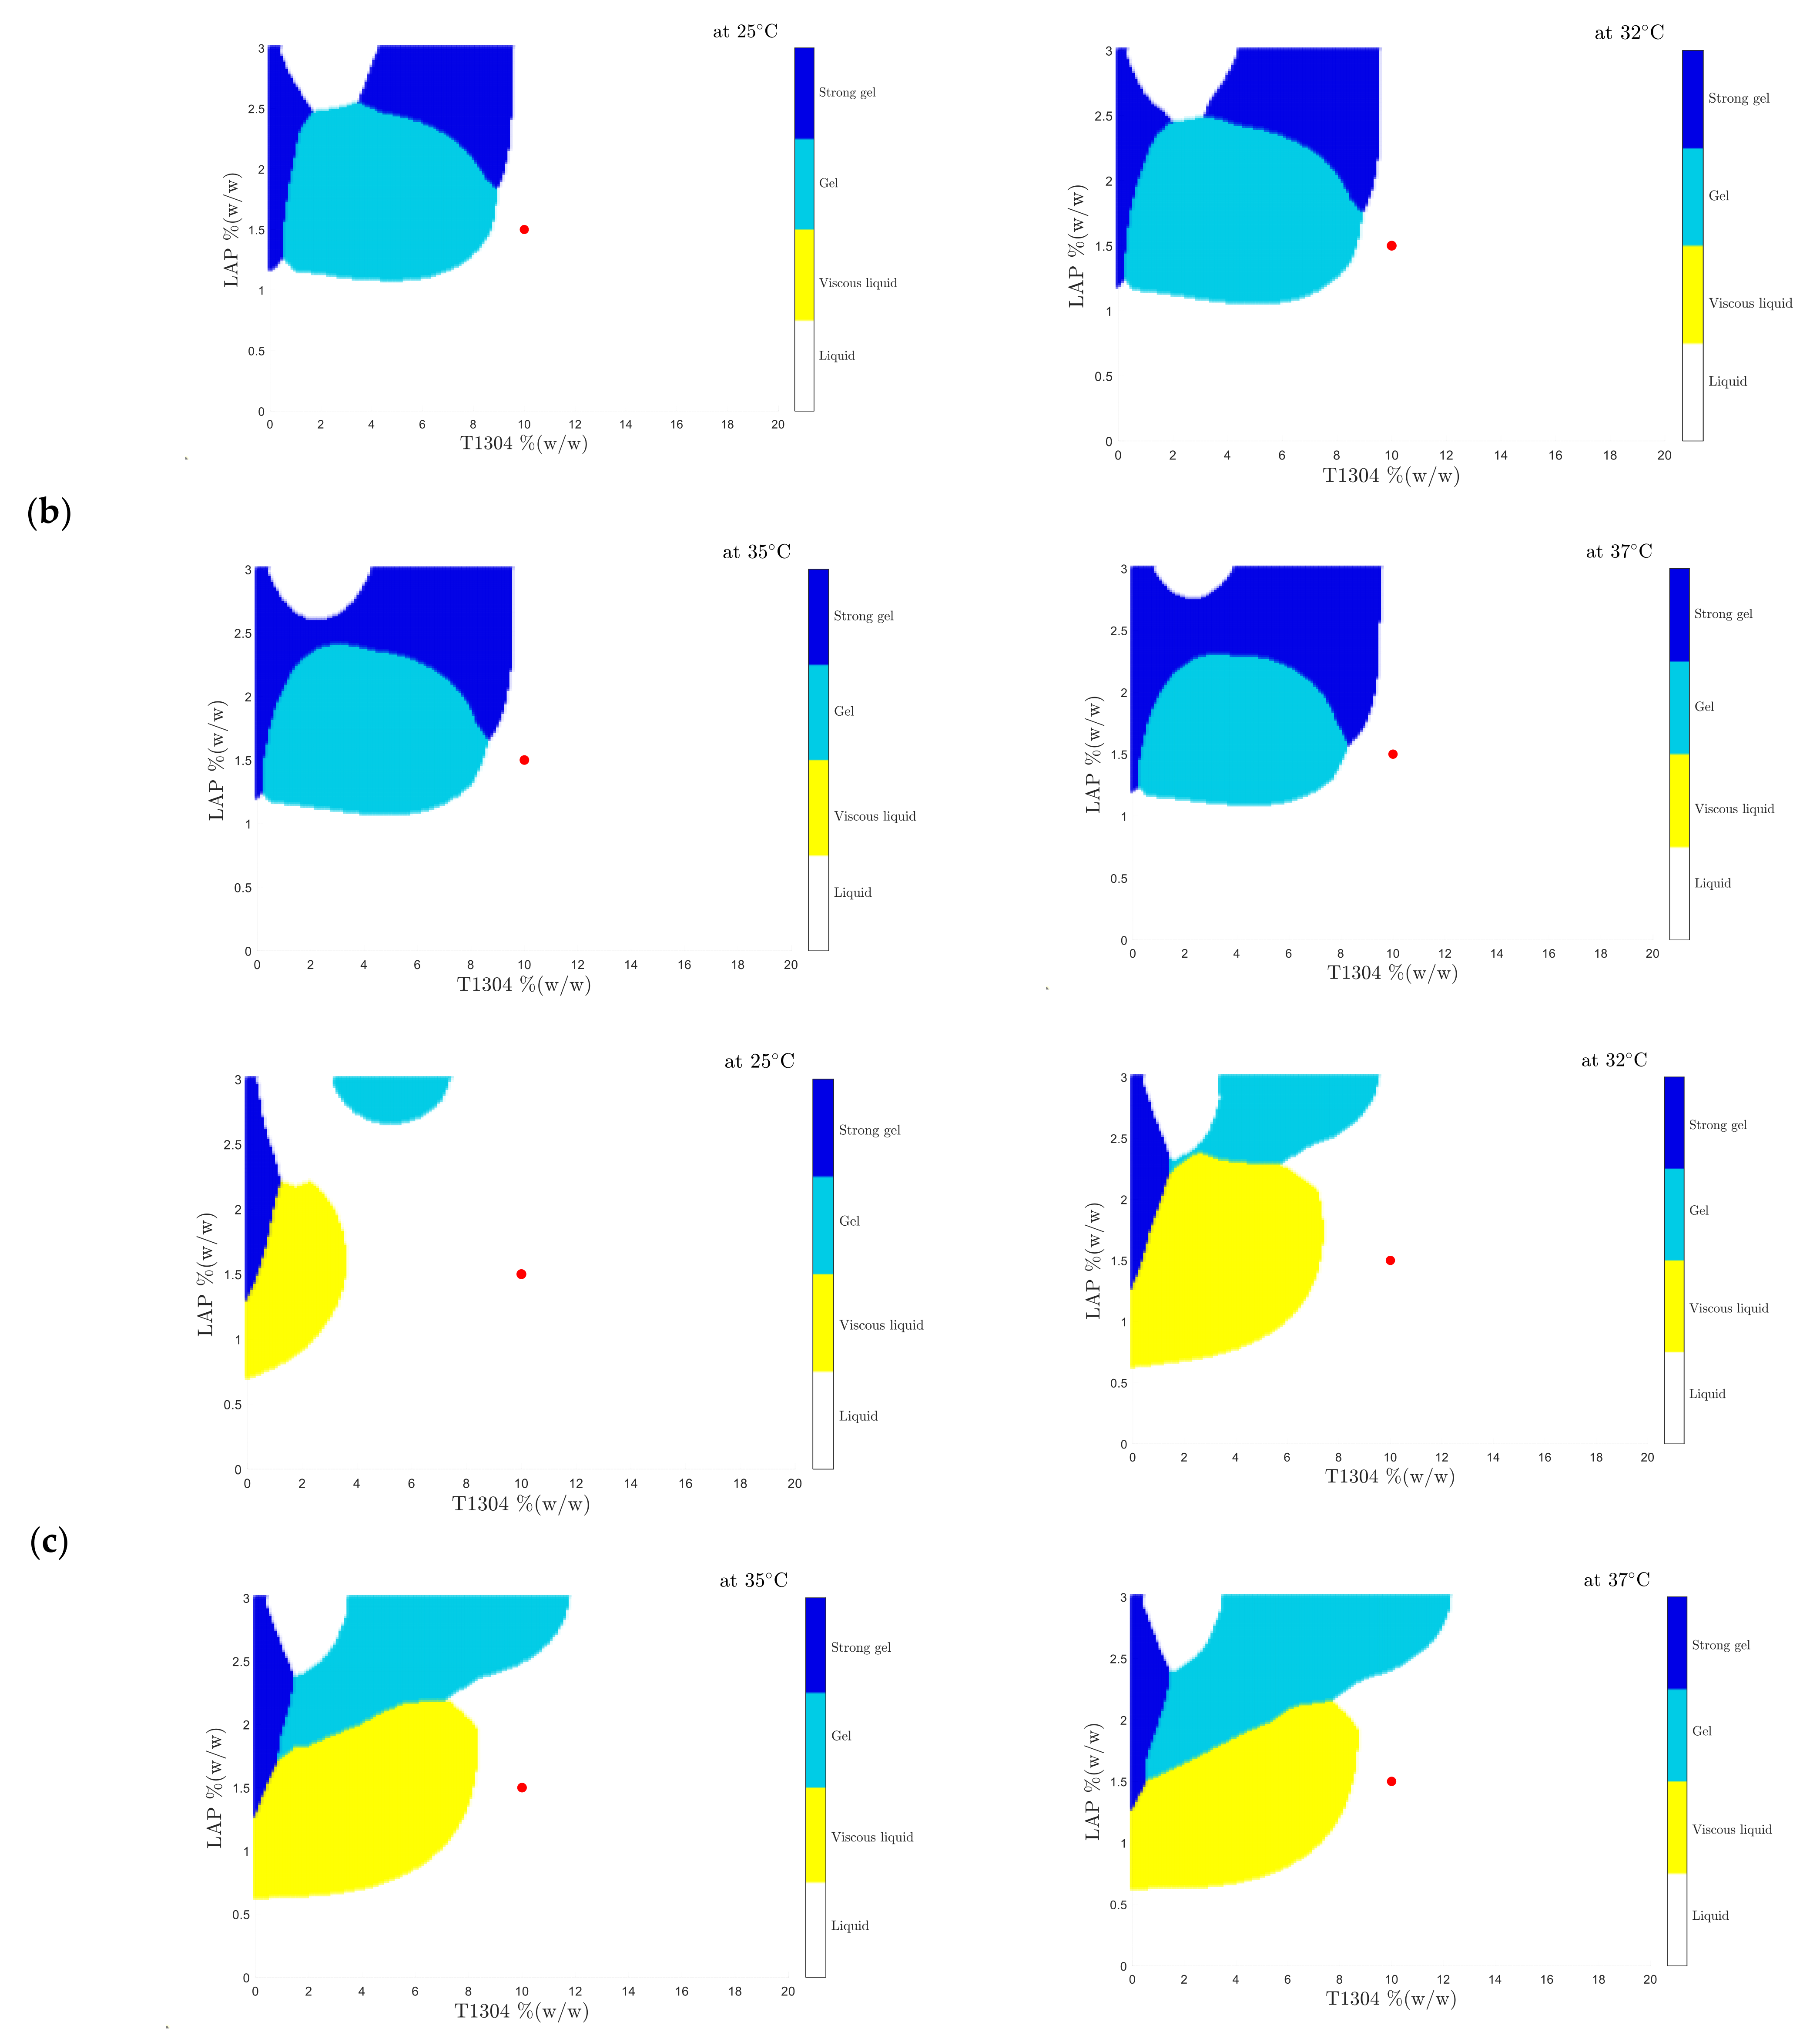
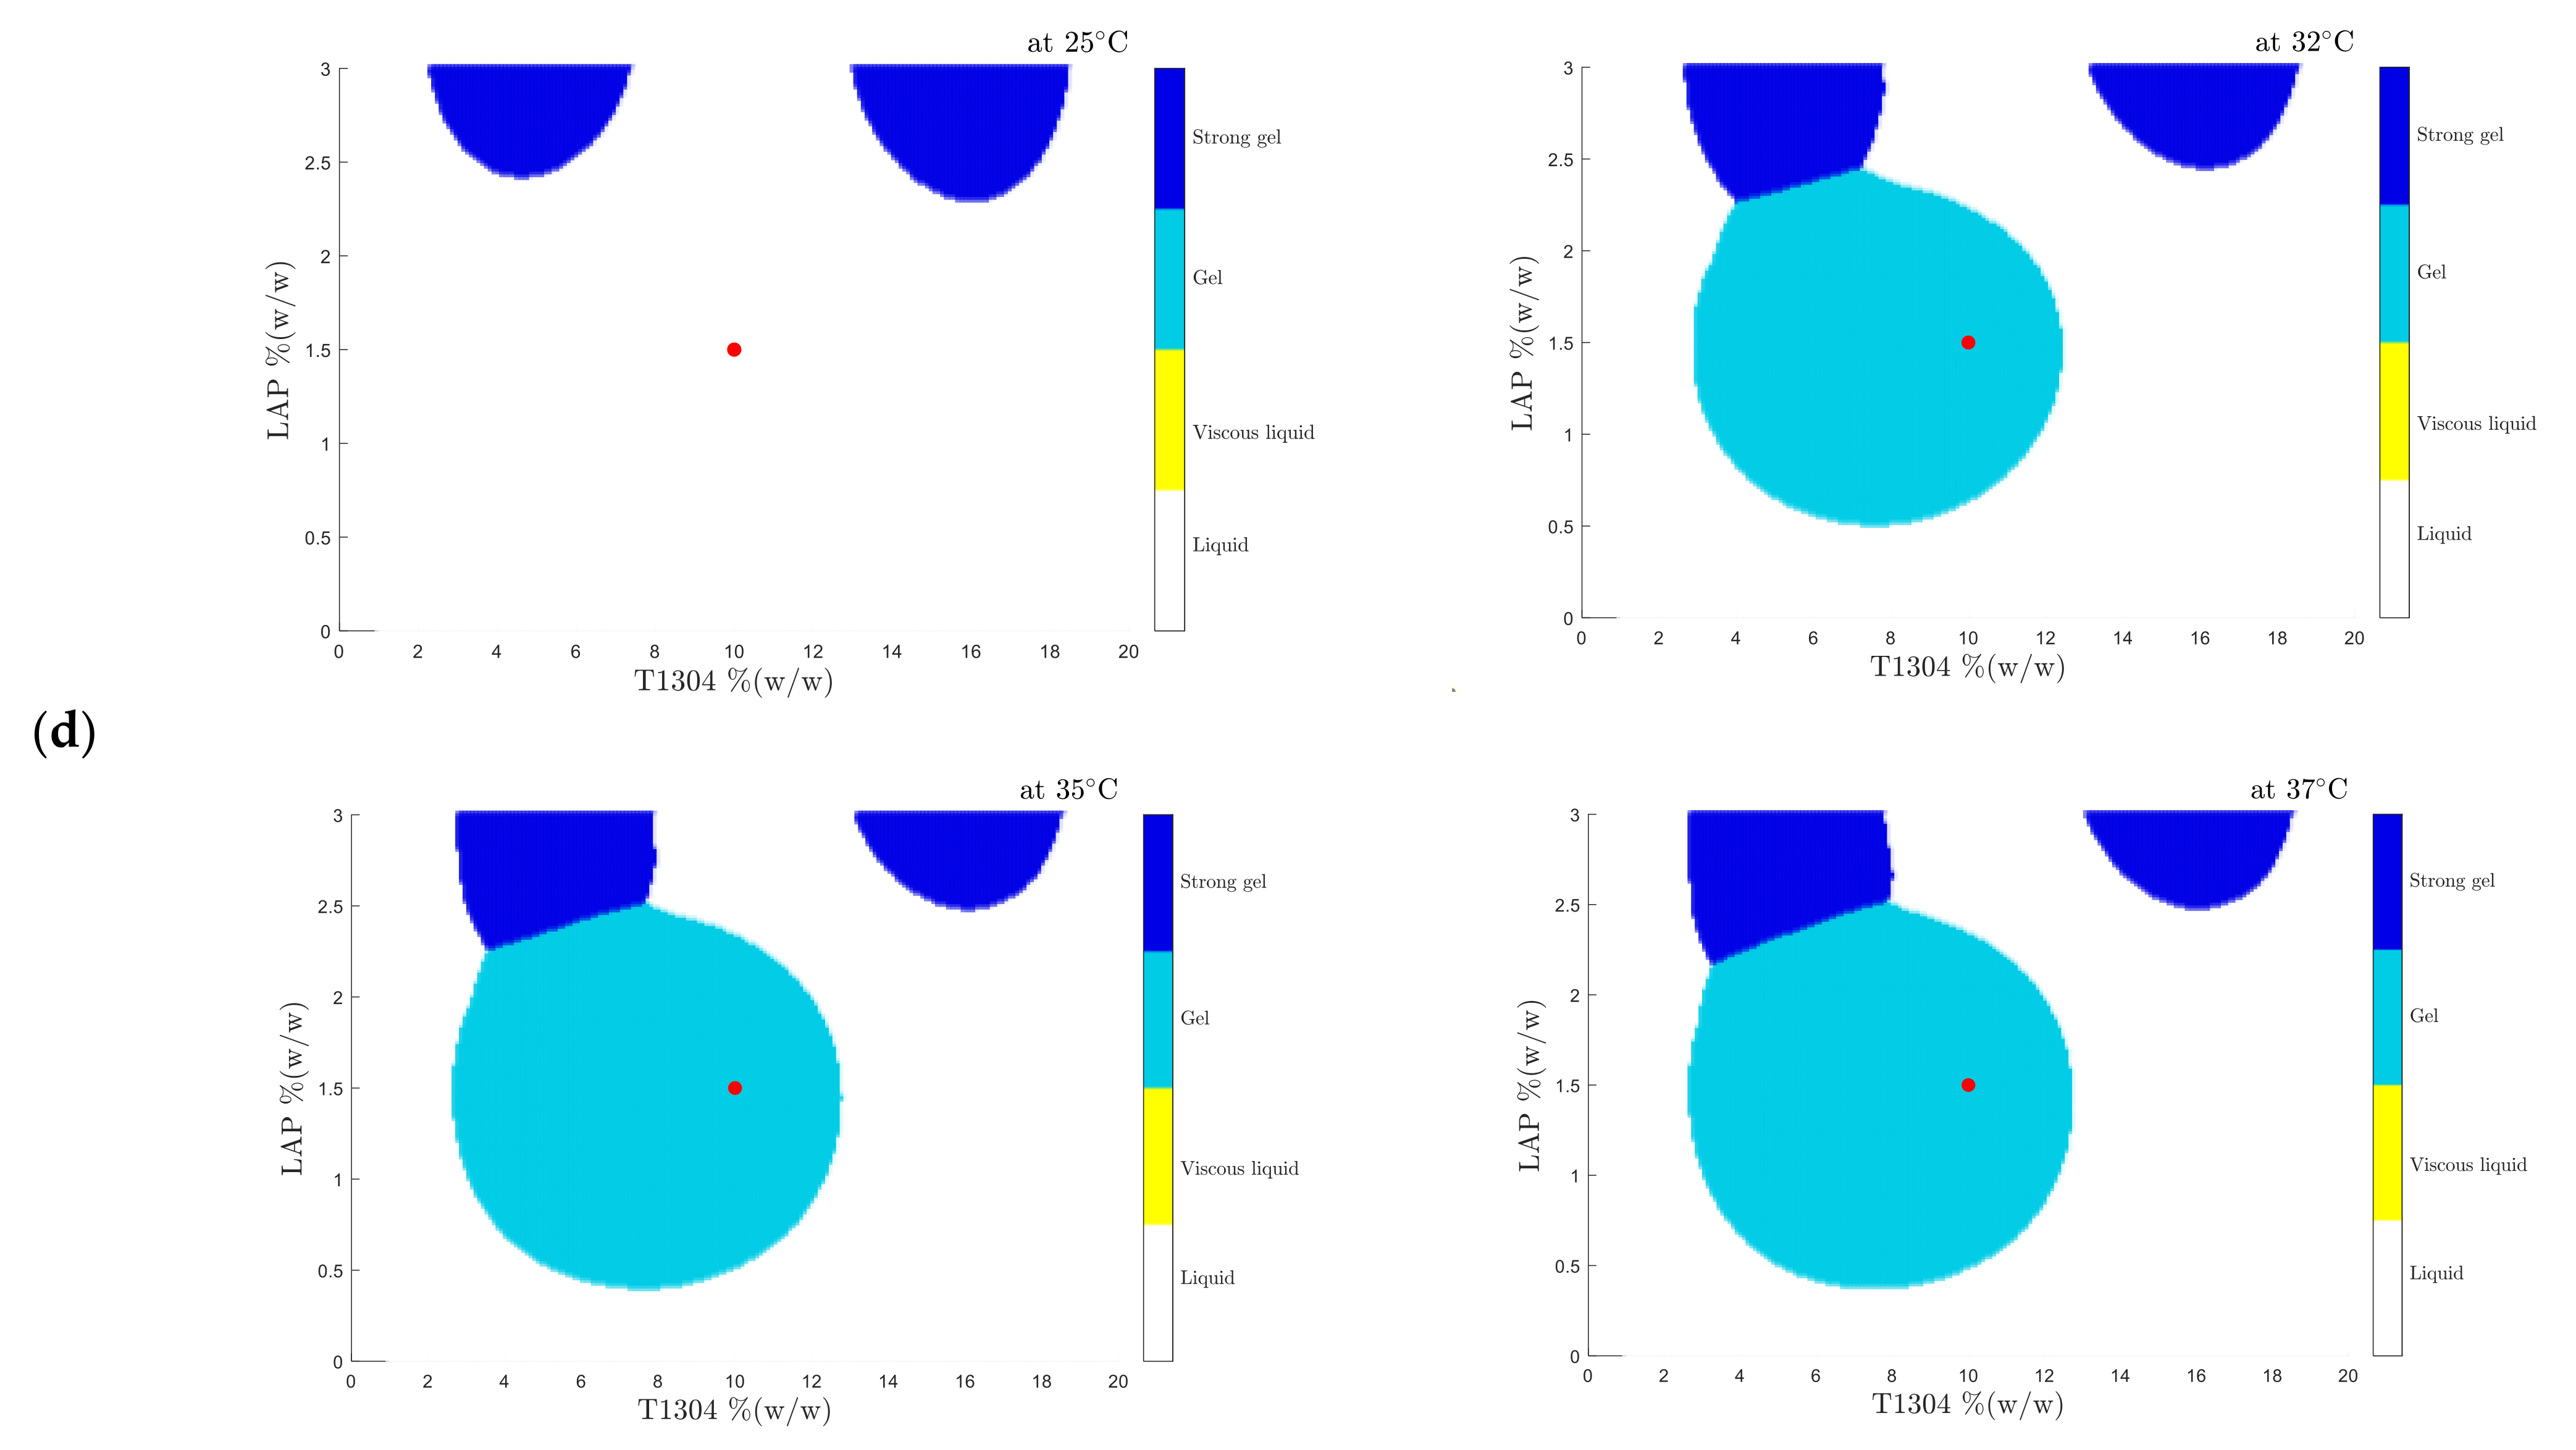
3.1. Physical Behavior Analysis
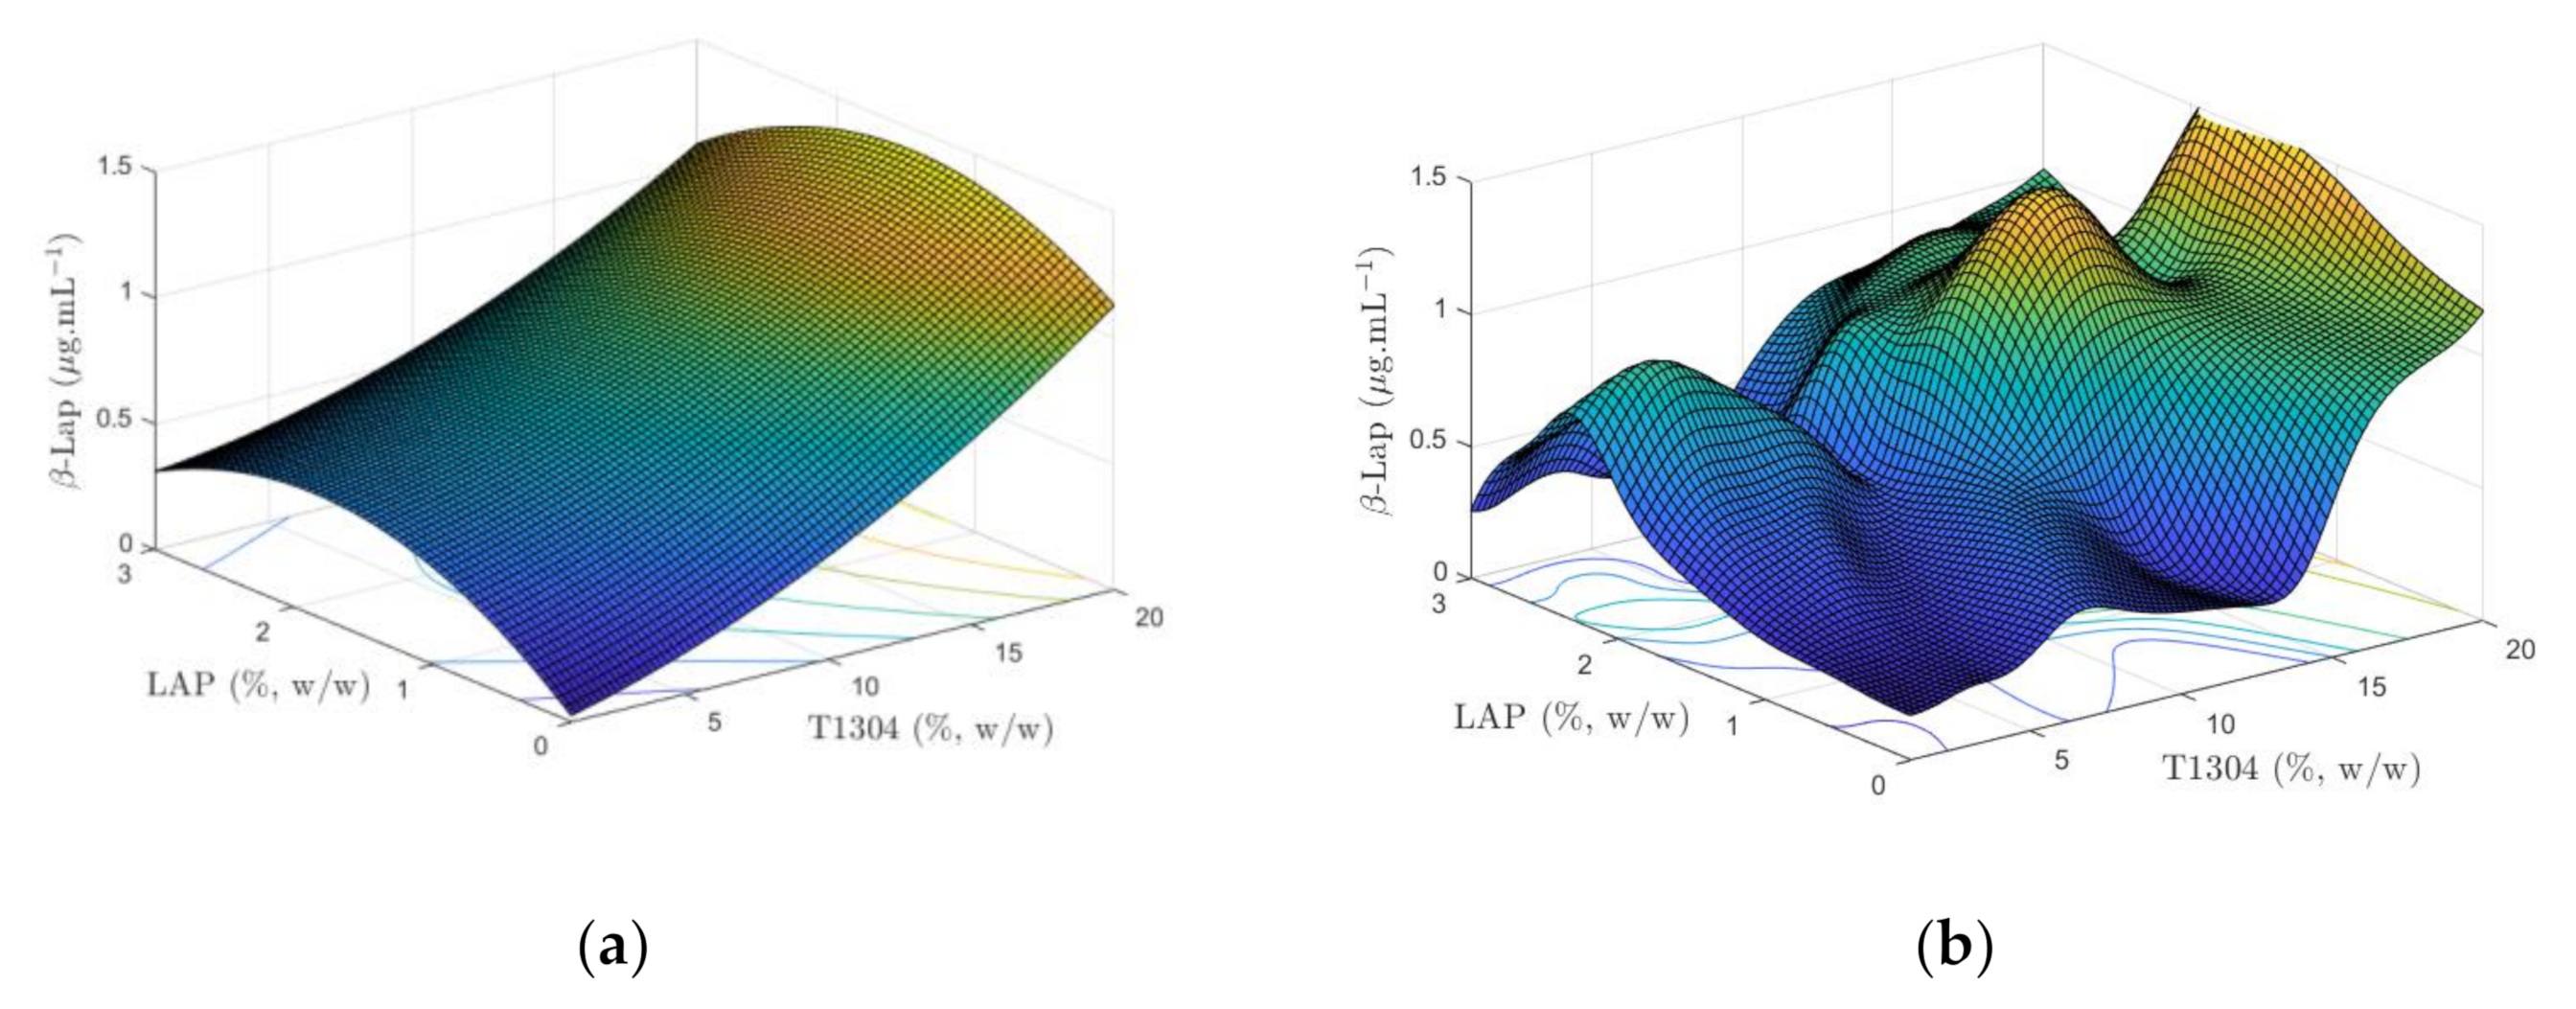
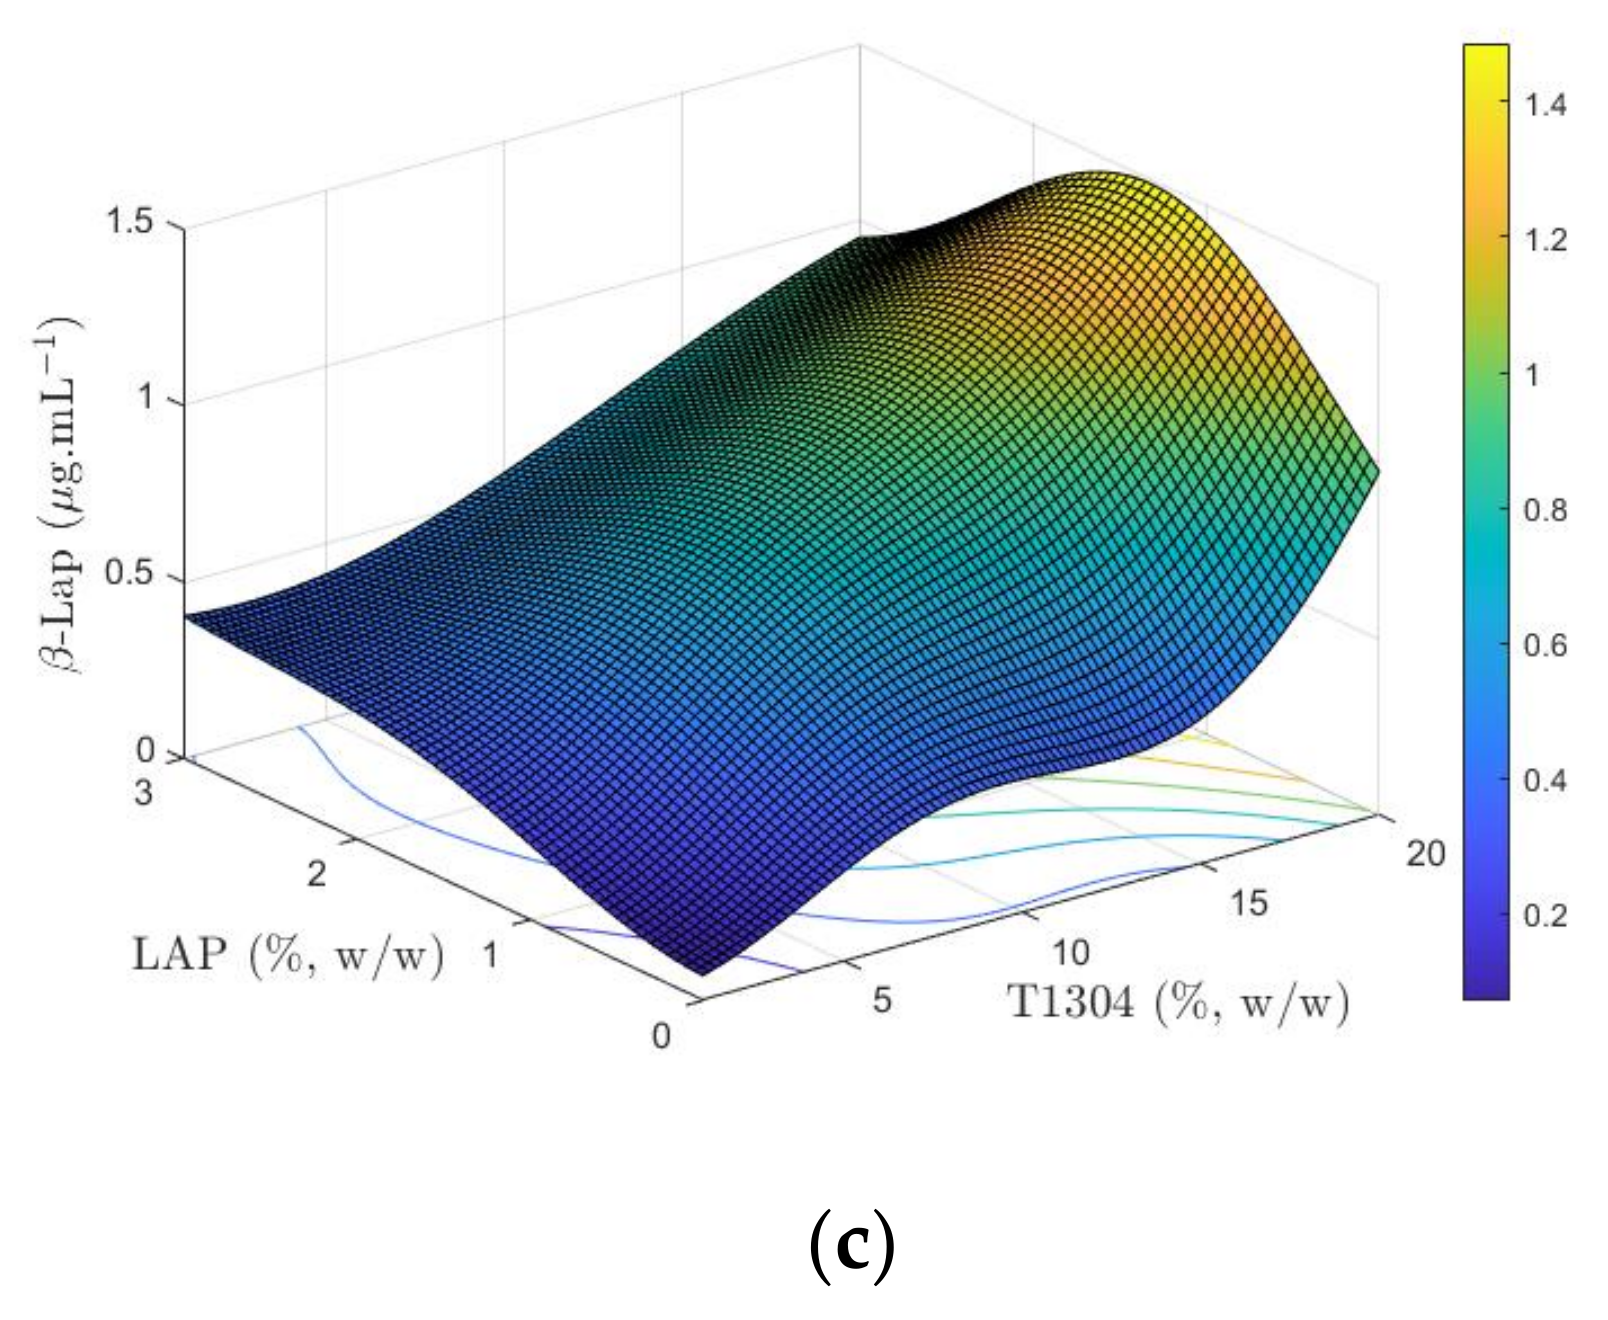
3.2. β-Lap Solubility Analysis
4. Conclusions
Author Contributions
Funding
Institutional Review Board Statement
Informed Consent Statement
Data Availability Statement
Acknowledgments
Conflicts of Interest
Abbreviations
| PEO | poly (ethylene oxide) |
| PPO | poly (propylene oxide) |
| T1304 | poloxamine with 21 and 27 PEO and PPO units respectively |
| LAP | Laponite |
| RMS | response surface methodology |
| ML | machine learning |
| MLP | multilayer perceptron |
| SVM | support vector machine |
| β-Lap | β-Lapachone |
| HBL | hydrophilic-lipophilic balance |
| SP1049C | doxorubicin |
| AI | artificial intelligence |
| ANN | artificial neural networks |
| SMO | sequential minimal optimization |
| CCD | central composite design |
| TPR | true positive rate |
| FNR | false negative rate |
| MSE | mean square error |
| kNN | k-nearest neighbors algorithm |
References
- Úriz, A.; Sanmartín, C.; Plano, D.; Dreiss, C.A.; González-Gaitano, G. Activity Enhancement of Selective Antitumoral Selenodiazoles Formulated with Poloxamine Micelles. Colloids Surf. B Biointerfaces 2018, 170, 463–469. [Google Scholar] [CrossRef] [PubMed] [Green Version]
- Nishiyama, N.; Kataoka, K. Current State, Achievements, and Future Prospects of Polymeric Micelles as Nanocarriers for Drug and Gene Delivery. Pharmacol. Ther. 2006, 112, 630–648. [Google Scholar] [CrossRef] [PubMed]
- Oerlemans, C.; Bult, W.; Bos, M.; Storm, G.; Nijsen, J.F.W.; Hennink, W.E. Polymeric Micelles in Anticancer Therapy: Targeting, Imaging and Triggered Release. Pharm. Res. 2010, 27, 2569–2589. [Google Scholar] [CrossRef] [PubMed] [Green Version]
- Tong, Y.C.; Chang, S.F.; Kao, W.W.Y.; Liu, C.Y.; Liaw, J. Polymeric Micelle Gene Delivery of Bcl-XLvia Eye Drop Reduced Corneal Apoptosis following Epithelial Debridement. J. Control. Release 2010, 147, 76–83. [Google Scholar] [CrossRef]
- Yokoyama, M. Clinical Applications of Polymeric Micelle Carrier Systems in Chemotherapy and Image Diagnosis of Solid Tumors. J. Exp. Clin. Med. 2011, 3, 151–158. [Google Scholar] [CrossRef]
- Gong, J.; Chen, M.; Zheng, Y.; Wang, S.; Wang, Y. Polymeric Micelles Drug Delivery System in Oncology. J. Control. Release 2012, 159, 312–323. [Google Scholar] [CrossRef]
- Zheng, C.; Zheng, M.; Gong, P.; Deng, J.; Yi, H.; Zhang, P.; Zhang, Y.; Liu, P.; Ma, Y.; Cai, L. Polypeptide Cationic Micelles Mediated Co-Delivery of Docetaxel and SiRNA for Synergistic Tumor Therapy. Biomaterials 2013, 34, 3431–3438. [Google Scholar] [CrossRef]
- Duncan, R.; Vicent, M.J. Polymer Therapeutics-Prospects for 21st Century: The End of the Beginning. Adv. Drug Deliv. Rev. 2013, 65, 60–70. [Google Scholar] [CrossRef]
- Moghimi, S.M. Nanomedicine: Current Status and Future Prospects. FASEB J. 2005, 19, 311–330. [Google Scholar] [CrossRef] [Green Version]
- Alvarez-Lorenzo, C.; Rey-Rico, A.; Sosnik, A.; Taboada, P.; Concheiro, A. Poloxamine-Based Nanomaterials for Drug Delivery. Front. Biosci. 2010, 3, 424–440. [Google Scholar] [CrossRef] [Green Version]
- Alvarez-Lorenzo, C.; Sosnik, A.; Concheiro, A. PEO-PPO Block Copolymers for Passive Micellar Targeting and Overcoming Multidrug Resistance in Cancer Therapy. Curr. Drug Targets 2011, 12, 1112–1130. [Google Scholar] [CrossRef]
- Schmolka, I.R. A Review of Block Polymer Surfactants. J. Am. Oil Chem. Soc. 1977, 54, 110–116. [Google Scholar] [CrossRef]
- Alexandridis, P. Poly (Ethylene Oxide)/Poly (Propylene Oxide) Block Copolymer. Curr. Opin. Colloid Interface Sci. 1997, 2, 478–489. [Google Scholar] [CrossRef]
- Inamdar, N.N.; Mourya, V. Applications of Polymers in Devivery of Biologics. In Applications of Polymers in Drug Delivery; Misra, A., Shahiwala, A., Eds.; Elsevier Inc.: Amsterdam, The Netherlands, 2021; pp. 449–534. [Google Scholar] [CrossRef]
- Chiappetta, D.A.; Sosnik, A. Poly(Ethylene Oxide)-Poly(Propylene Oxide) Block Copolymer Micelles as Drug Delivery Agents: Improved Hydrosolubility, Stability and Bioavailability of Drugs. Eur. J. Pharm. Biopharm. 2007, 66, 303–317. [Google Scholar] [CrossRef]
- Kuperkar, K.; Tiwari, S.; Bahadur, P. Self-Assembled Block Copolymer Nanoaggregates for Drug Delivery Applications. In Applications of Polymers in Drug Delivery; Misra, A., Shahiwala, A., Eds.; Elsevier Inc.: Amsterdam, The Netherlands, 2021; pp. 423–447. [Google Scholar] [CrossRef]
- Tiwari, S.; Kansara, V.; Bahadur, P. Targeting Anticancer Drugs with Pluronic Aggregates: Recent Updates. Int. J. Pharm. 2020, 586, 119544. [Google Scholar] [CrossRef]
- Rahdar, A.; Askari, F. Pluronic as Nano-Carier Platform for Drug Delivery Systems. Nanomed. Res. J. 2018, 3, 174–179. [Google Scholar] [CrossRef]
- Pillai, S.A.; Sharma, A.K.; Desai, S.M.; Sheth, U.; Bahadur, A.; Ray, D.; Aswal, V.K.; Kumar, S. Characterization and Application of Mixed Micellar Assemblies of PEO-PPO Star Block Copolymers for Solubilization of Hydrophobic Anticancer Drug and in Vitro Release. J. Mol. Liq. 2020, 313, 113543. [Google Scholar] [CrossRef]
- Wolf, A.; Agnihotri, S.; Micallef, J.; Mukherjee, J.; Sabha, N.; Cairns, R.; Hawkins, C.; Guha, A. Hexokinase 2 Is a Key Mediator of Aerobic Glycolysis and Promotes Tumor Growth in Human Glioblastoma Multiforme. J. Exp. Med. 2011, 208, 313–326. [Google Scholar] [CrossRef] [Green Version]
- Cuestas, M.L.; Sosnik, A.; Mathet, V.L. Poloxamines Display a Multiple Inhibitory Activity of ATP-Binding Cassette (ABC) Transporters in Cancer Cell Lines. Mol. Pharm. 2011, 8, 1152–1164. [Google Scholar] [CrossRef]
- Cavalloro, G.; Fakhrullin, R.; Pasbakhsh, P. Clay Nanoparticles: Properties and Applications, 1st ed.; Cavalloro, G., Fakhrullin, R., Pasbakhsh, P., Eds.; Elsevier Inc.: Amsterdam, The Netherlands, 2020. [Google Scholar]
- Tomás, H.; Alves, C.S.; Rodrigues, J. Laponite®: A Key Nanoplatform for Biomedical Applications? Nanomed. Nanotechnol. Biol. Med. 2018, 14, 2407–2420. [Google Scholar] [CrossRef]
- Ruzicka, B.; Zaccarelli, E. A Fresh Look at the Laponite Phase Diagram. Soft Matter 2011, 7, 1268–1286. [Google Scholar] [CrossRef]
- Faustini, M.; Nicole, L.; Ruiz-Hitzky, E.; Sanchez, C. History of Organic-Inorganic Hybrid Materials: Prehistory, Art, Science, and Advanced Applications. Adv. Funct. Mater. 2018, 28, 1704158. [Google Scholar] [CrossRef]
- Gaharwar, A.K.; Schexnailder, P.J.; Kline, B.P.; Schmidt, G. Assessment of Using Laponite? Cross-Linked Poly (Ethylene Oxide) for Controlled Cell Adhesion and Mineralization. Acta Biomater. 2011, 7, 568–577. [Google Scholar] [CrossRef]
- Gonçalves, M.; Figueira, P.; Maciel, D.; Rodrigues, J.; Qu, X.; Liu, C.; Tomás, H.; Li, Y. PH-Sensitive Laponite®/Doxorubicin/Alginate Nanohybrids with Improved Anticancer Efficacy. Acta Biomater. 2014, 10, 300–307. [Google Scholar] [CrossRef]
- Pelegrino, M.T.; de Araújo, D.R.; Seabra, A.B. S-Nitrosoglutathione-Containing Chitosan Nanoparticles Dispersed in Pluronic F-127 Hydrogel: Potential Uses in Topical Applications. J. Drug Deliv. Sci. Technol. 2018, 43, 211–220. [Google Scholar] [CrossRef]
- Dos Santos, A.C.M.; Akkari, A.C.S.; Ferreira, I.R.S.; Maruyama, C.R.; Pascoli, M.; Guilherme, V.A.; de Paula, E.; Fraceto, L.F.; de Lima, R.; da Melo, P.S.; et al. Poloxamer-Based Binary Hydrogels for Delivering Tramadol Hydrochloride: Sol-Gel Transition Studies, Dissolution-Release Kinetics, in Vitro Toxicity, and Pharmacological Evaluation. Int. J. Nanomed. 2015, 10, 2391–2401. [Google Scholar] [CrossRef] [Green Version]
- Barbosa, R.d.M.; Câmara, G.B.M.; García-Villén, F.; Viseras, C.; de Júnior, R.F.A.; Machado, P.R.L.; Câmara, C.A.; Farias, K.J.S.; de Moura, T.F.A.L.E.; Dreiss, C.A.; et al. Nanocomposite Gels of Poloxamine and Laponite for β -Lapachone Release in Anticancer Therapy. Eur. J. Pharm. Sci. 2021, 163, 105861. [Google Scholar] [CrossRef]
- Silva, M.N.D.; Ferreira, V.F.; de Souza, M.C.B.V. Um Panorama Atual da Química e da Farmacologia de Naftoquinonas, Com Ênfase na Beta-Lapachona e Derivados. Quim. Nova 2003, 26, 407–416. [Google Scholar] [CrossRef] [Green Version]
- Andrade-neto, V.F.D.; Goulart, O.F.; Silva, F.; Silva, J. Antimalarial Activity of Phenazines from Lapachol, β-Lapachone and Its Derivatives against Plasmodium falciparum in Vitro and Plasmodium berghei in Vivo. Bioorg. Med. Chem. Lett. 2004, 14, 1145–1149. [Google Scholar] [CrossRef] [PubMed]
- Dos Santos, K.M.; de Melo Barbosa, R.; Vargas, F.G.A.; de Azevedo, E.P.; da Silva Lins, A.C.; Camara, C.A.; Aragão, C.F.S.; de Lima e Moura, T.F.; Raffin, F.N. Development of Solid Dispersions of β-Lapachone in PEG and PVP by Solvent Evaporation Method. Drug Dev. Ind. Pharm. 2018, 44, 750–756. [Google Scholar] [CrossRef] [PubMed]
- Kim, I.; Kim, H.; Ro, J.; Jo, K.; Karki, S.; Khadka, P.; Yun, G.; Lee, J. Preclinical Pharmacokinetic Evaluation of β-Lapachone: Characteristics of Oral Bioavailability and First-Pass Metabolism in Rats. Biomol. Ther. 2015, 23, 296–300. [Google Scholar] [CrossRef] [Green Version]
- Box, G.E.P.; Wilson, K.B. On the Experimental Attainment of Optimum Conditions. J. R. Stat. Soc. 1951, 13, 1–45. [Google Scholar] [CrossRef]
- Singh, B.; Chakkal, S.K.; Ahuja, N. Formulation and Optimization of Controlled Release Mucoadhesive Tablets of Atenolol Using Response Surface Methodology. AAPS PharmaSciTech 2006, 7, E19–E28. [Google Scholar] [CrossRef]
- Narayanan, H.; Dingfelder, F.; Butté, A.; Lorenzen, N.; Sokolov, M.; Arosio, P. Machine Learning for Biologics: Opportunities for Protein Engineering, Developability, and Formulation. Trends Pharmacol. Sci. 2021, 42, 151–165. [Google Scholar] [CrossRef]
- McCoubrey, L.E.; Gaisford, S.; Orlu, M.; Basit, A.W. Predicting Drug-Microbiome Interactions with Machine Learning. Biotechnol. Adv. 2022, 54, 107797. [Google Scholar] [CrossRef]
- De Souza, J.G.; Fernandes, M.A.C. A Novel Deep Neural Network Technique for Drug—Target Interaction. Pharmaceutics 2022, 14, 625. [Google Scholar] [CrossRef]
- Bannigan, P.; Aldeghi, M.; Bao, Z.; Häse, F.; Aspuru-Guzik, A.; Allen, C. Machine Learning Directed Drug Formulation Development. Adv. Drug Deliv. Rev. 2021, 175, 113806. [Google Scholar] [CrossRef]
- Hathout, R.M. Machine Learning Methods in Drug Delivery. In Applications of Artificial Intelligence in Process Systems Engineering; Ren, J., Shen, W., Man, Y., Dong, L., Eds.; Elsevier Inc.: Amsterdam, The Netherlands, 2021; pp. 361–380. [Google Scholar] [CrossRef]
- Boulogeorgos, A.A.A.; Member, S.; Trevlakis, S.E.; Member, S.; Tegos, S.A.; Member, S.; Papanikolaou, V.K.; Member, S. Machine Learning in Nano-Scale Biomedical Engineering. IEEE Trans. Mol. Biol. MULTI-SCALE Commun. 2020, 7, 10–39. [Google Scholar] [CrossRef]
- Shastry, K.; Sanjay, H. Machine Learning for Bioinformatics. In Statistical Modelling and Machine Learning Principles for Bioinformatics Techniques; Srinivasa, K.G., Siddesh, G.M., Manisekhar, S.R., Eds.; Springer: Singapore, 2020; pp. 25–39. [Google Scholar]
- Naresh, E.; Kumar, B.; Shankar, S. Impact of Machine Learning in Bioinformatics Research. In Statistical Modelling and Machine Learning Principles for Bioinformatics Techniques; Srinivasa, K.G., Siddesh, G.M., Manisekhar, S.R., Eds.; Springer: Singapore, 2020; pp. 41–62. [Google Scholar]
- Mouchlis, V.D.; Afantitis, A.; Serra, A.; Fratello, M.; Papadiamantis, A.G.; Aidinis, V.; Lynch, I.; Greco, D.; Melagraki, G. Advances in De Novo Drug Design: From Conventional to Machine Learning Methods. Int. J. Mol. Sci. 2021, 22, 1676. [Google Scholar] [CrossRef]
- Boso, D.P.; Di Mascolo, D.; Santagiuliana, R.; Decuzzi, P.; Schrefler, B.A.; Morego, V. Drug Delivery: Experiments, Mathematical Modelling and Machine Learning. Comput. Biol. Med. 2021, 123, 103820. [Google Scholar] [CrossRef]
- Pereira, A.K.V.; de Melo Barbosa, M.; Fernandes, M.A.C.; Finkler, L.; Finkler, C.L.L. Comparative Analyses of Response Surface Methodology and Artificial Neural Networks on Incorporating Tetracaine into Liposomes. Braz. J. Pharm. Sci. 2020, 56, e17808. [Google Scholar] [CrossRef]
- Sun, Y.; Peng, Y.; Chen, Y.; Shukla, A.J. Application of Artificial Neural Networks in the Design of Controlled Release Drug Delivery Systems. Adv. Drug Deliv. Rev. 2003, 55, 1201–1215. [Google Scholar] [CrossRef]
- Ekins, S.; Puhl, A.C.; Zorn, K.M.; Lane, T.R.; Russo, D.P.; Klein, J.J.; Hickey, A.J.; Clark, A.M. Exploiting Machine Learning for End-to-End Drug Discovery and Development. Nat. Mater. 2019, 18, 435–441. [Google Scholar] [CrossRef]
- Bartolucci, R.; Magni, P. Application of Artificial Neural Networks to Predict the Intrinsic Solubility of Drug-Like Molecules. Pharmaceutics 2021, 13, 1101. [Google Scholar] [CrossRef]
- Medarevi, D. Tailoring Atomoxetine Release Rate from DLP 3D-Printed Tablets Using Artificial Neural Networks: Influence of Tablet. Molecules 2021, 26, 111. [Google Scholar] [CrossRef]


| Physical Behavior | Parameters Used |
|---|---|
| Liquid | Clear liquid and unable to maintain its weight if the bottle is inverted. |
| Viscous liquid | Thicker liquid with slower sample flow. Additionally, unable to maintain its weight if the bottle is inverted. |
| Gel | Classified as transparent dispersions in the form of a gel and capable of maintaining their weight if the vial is inverted; however, if subjected to vigorous agitation for 10 s, they come off. |
| Strong gel | Classified as clear dispersions in the form of a firm gel, capable of maintaining their weight against gravity in an inverted flask, and if subjected to vigorous shaking for 10 s, they do not come off. |
| Assays | |||||
|---|---|---|---|---|---|
| Coded Level | % (w/w) | Coded Level | % (w/w) | ||
| 1 | −1 | 1 | −1 | 0.0 | 0.1206 |
| 2 | −1 | 1 | 0 | 1.5 | 0.2600 |
| 3 | −1 | 1 | +1 | 3.0 | 0.4264 |
| 4 | 0 | 10 | −1 | 0.0 | 0.4281 |
| 5 | 0 | 10 | +1 | 3.0 | 0.5103 |
| 6 | +1 | 20 | −1 | 0.0 | 1.0211 |
| 7 | +1 | 20 | 0 | 1.5 | 1.6062 |
| 8 | +1 | 20 | +1 | 3.0 | 0.9988 |
| 9 | 0 | 10 | 0 | 1.5 | 0.7875 |
| 10 | 0 | 10 | 0 | 1.5 | 0.8010 |
| 11 | 0 | 10 | 0 | 1.5 | 0.7780 |
| 12 | 0 | 10 | 0 | 1.5 | 0.7650 |
| Assays | |||
|---|---|---|---|
| Coded Level | % (w/w) | Coded Level | |
| 13 | 5 | 0.0 | 0.2092 |
| 14 | 5 | 1.5 | 0.4792 |
| 15 | 5 | 3.0 | 0.3617 |
| 16 | 15 | 0.0 | 0.3639 |
| 17 | 15 | 1.5 | 1.1375 |
| 18 | 15 | 3.0 | 0.8039 |
| 19 | 8 | 0.0 | 0.4618 |
| 20 | 20 | 1.0 | 0.1397 |
| 21 | 20 | 2.0 | 1.2785 |
| Parameters | Values | Parameters | Values |
|---|---|---|---|
| −0.0005 | 0.0015 | ||
| 0.0262 | −0.1345 | ||
| 0.5031 | −0.0057 |
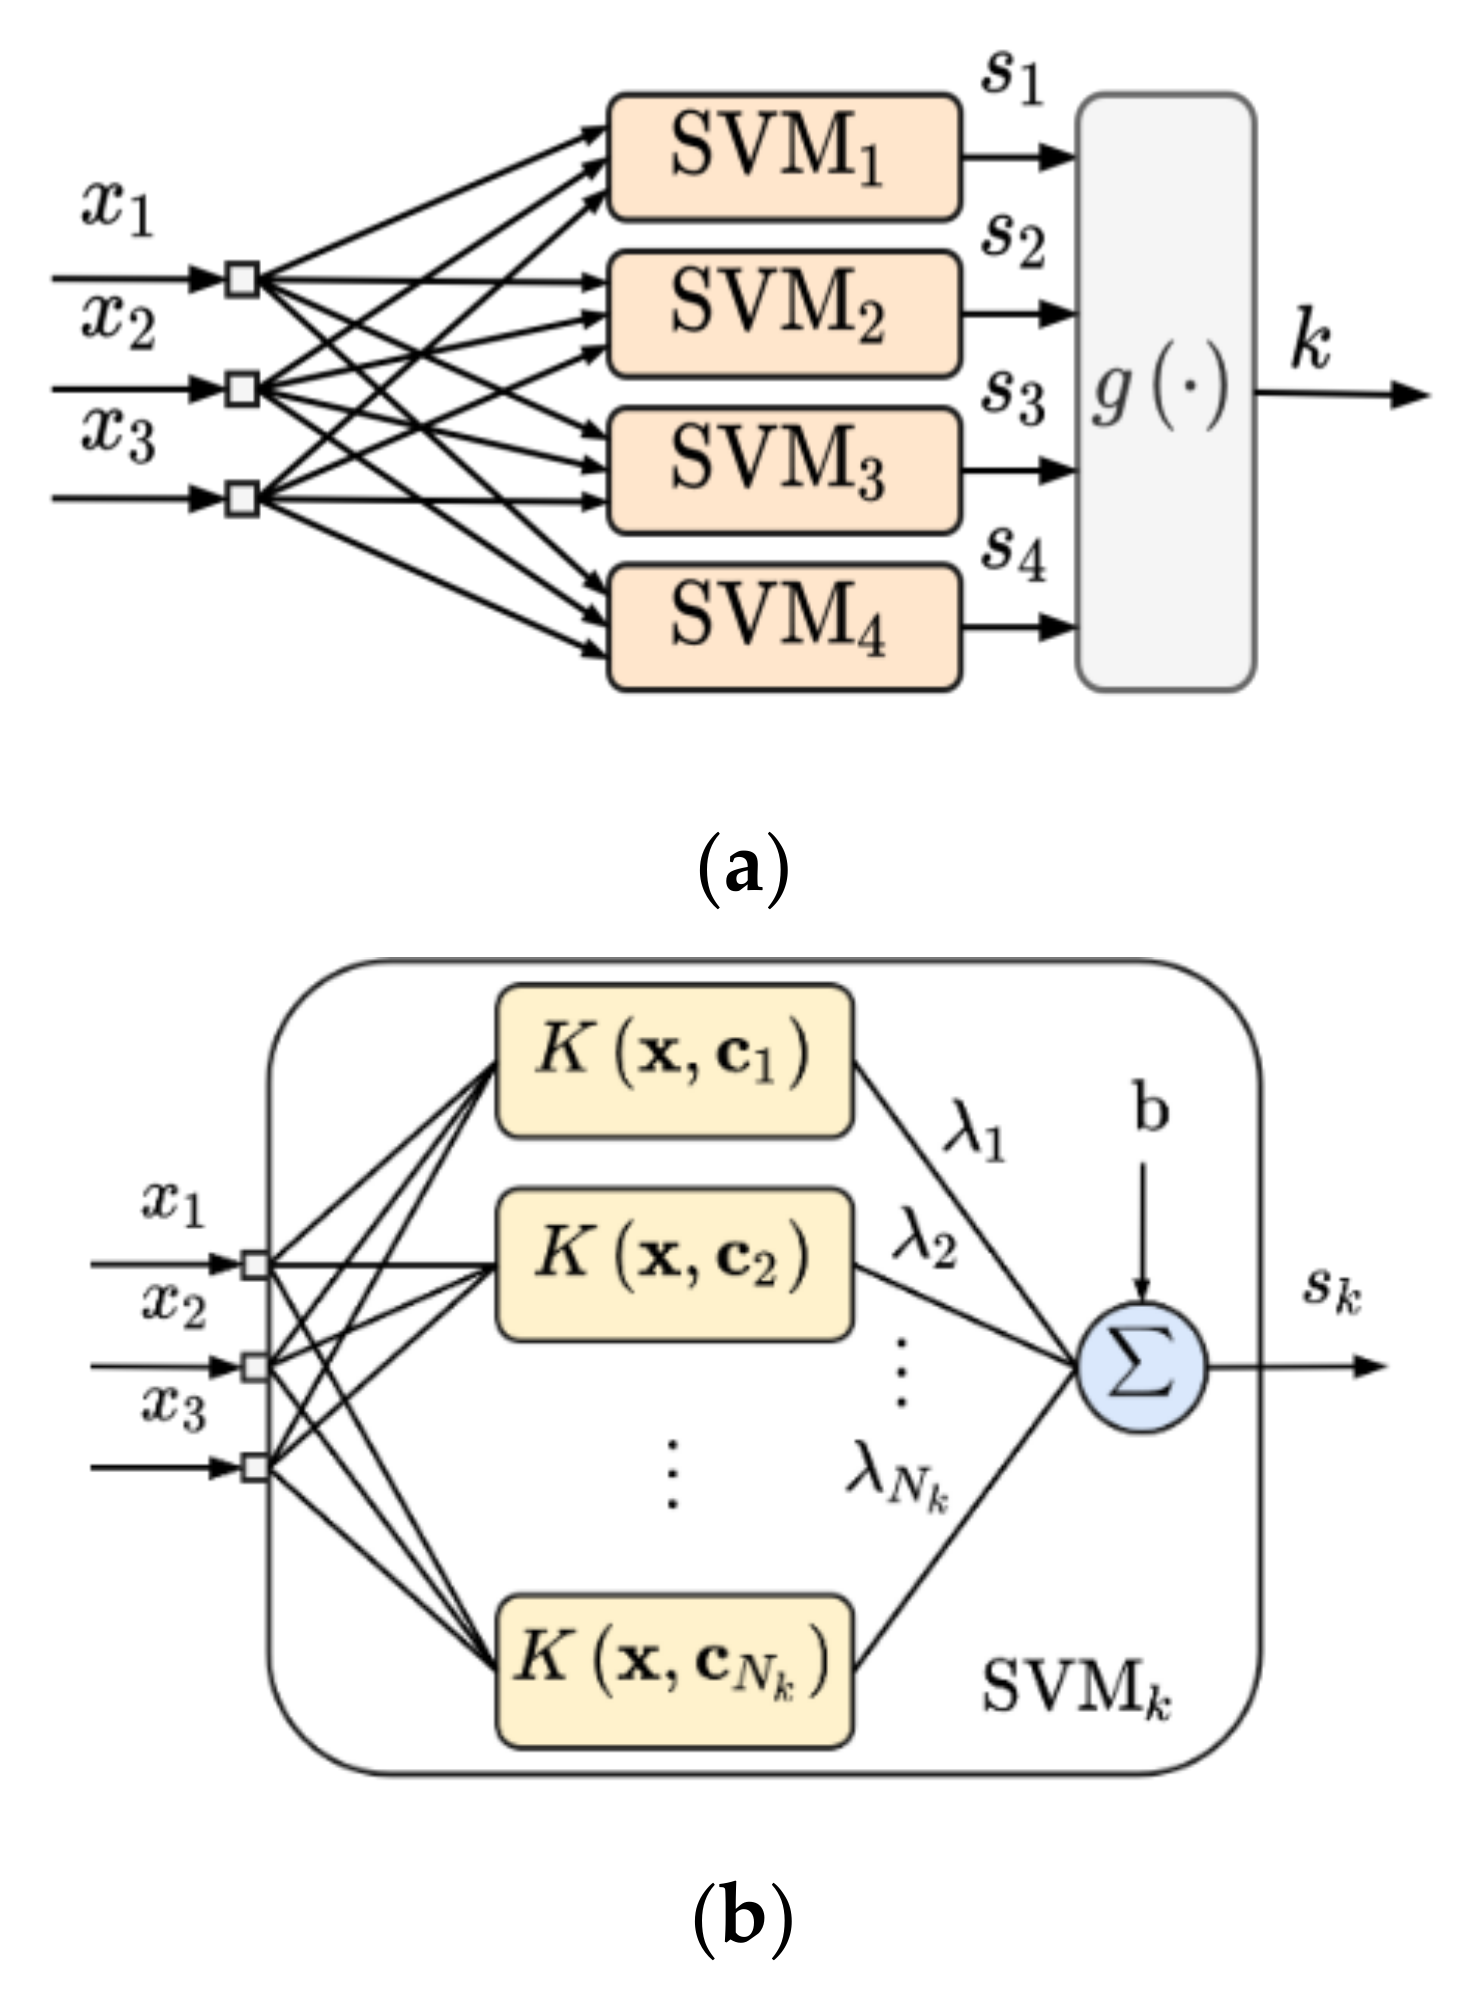
| Kernel Centers (or Support Vectors) | SVM Gains (See Figure 1b) |
|---|---|
| Surface Method | MSE | R2 | ||
|---|---|---|---|---|
| RSM | Fitting | Val. | Fitting | Val. |
| 0.0105 | 0.0109 | 0.9279 | 0.9368 | |
| Training | Val. | Training | Val. | |
| MLP | 0.0106 | 0.0098 | 0.9332 | 0.9433 |
| SVM | 0.0030 | 0.0045 | 0.9814 | 0.9737 |
Publisher’s Note: MDPI stays neutral with regard to jurisdictional claims in published maps and institutional affiliations. |
© 2022 by the authors. Licensee MDPI, Basel, Switzerland. This article is an open access article distributed under the terms and conditions of the Creative Commons Attribution (CC BY) license (https://creativecommons.org/licenses/by/4.0/).
Share and Cite
Barbosa, R.d.M.; Lima, C.C.; Oliveira, F.F.d.; Câmara, G.B.M.; Viseras, C.; Moura, T.F.A.d.L.e.; Souto, E.B.; Severino, P.; Raffin, F.N.; Fernandes, M.A.C. New Machine Learning Approach for the Optimization of Nano-Hybrid Formulations. Nanomanufacturing 2022, 2, 82-97. https://doi.org/10.3390/nanomanufacturing2030007
Barbosa RdM, Lima CC, Oliveira FFd, Câmara GBM, Viseras C, Moura TFAdLe, Souto EB, Severino P, Raffin FN, Fernandes MAC. New Machine Learning Approach for the Optimization of Nano-Hybrid Formulations. Nanomanufacturing. 2022; 2(3):82-97. https://doi.org/10.3390/nanomanufacturing2030007
Chicago/Turabian StyleBarbosa, Raquel de M., Cleanne C. Lima, Fabio F. de Oliveira, Gabriel B. M. Câmara, César Viseras, Tulio F. A. de Lima e Moura, Eliana B. Souto, Patricia Severino, Fernanda N. Raffin, and Marcelo A. C. Fernandes. 2022. "New Machine Learning Approach for the Optimization of Nano-Hybrid Formulations" Nanomanufacturing 2, no. 3: 82-97. https://doi.org/10.3390/nanomanufacturing2030007