Article

Sexual Dimorphism of the Human Scapula: A Geometric Morphometrics Study in Two Portuguese Reference Skeletal Samples

by
Rúben Maranho
1,
Maria Teresa Ferreira
1,2 and
Francisco Curate
1,3,*
1
Laboratory of Forensic Anthropology, Department of Life Sciences, University of Coimbra, Calçada Martim de Freitas, 3000-456 Coimbra, Portugal
2
Centre for Functional Ecology, Department of Life Sciences, University of Coimbra, Calçada Martim de Freitas, 3000-456 Coimbra, Portugal
3
Research Centre for Anthropology and Health (CIAS), Department of Life Sciences, Faculty of Sciences and Technology, University of Coimbra, Rua Arco da Traição 7, 3000-056 Coimbra, Portugal
*
Author to whom correspondence should be addressed.
Forensic Sci. 2022, 2(4), 780-794; https://doi.org/10.3390/forensicsci2040056
Submission received: 7 November 2022 / Revised: 15 November 2022 / Accepted: 19 November 2022 / Published: 23 November 2022

Abstract

:
The estimation of biological sex is of paramount relevance in the analysis of skeletal remains recovered in forensic contexts. This study aims to assess sexual dimorphism for identification purposes, from two reference samples of the Portuguese population, and a depiction of the size- and shape-related sexual dimorphism of the human scapula using geometric morphometrics approaches. The sample comprised 211 individuals (100 males and 111 females). A generalized Procrustes analysis (GPA) was performed for shape analyses, a principal component analysis (PCA) and a Procrustes ANOVA were implemented on the GPA transformed variables, and a discriminant analysis was used to assess the cross-validated accuracy of sex estimates. The data showed that male scapulae were larger, with medial and lateral curves more pronounced and an inferior angle more acute than females. The males and females were classified with low accuracy (66.82% and 65.88% for landmarks and semi-landmarks data) based on shape. Combining size and shape variables improved the accuracy of the prediction using landmarks data (80.09%). A combination of both variables might improve the chances of the geometric morphometrics methodology in correctly estimating the sex of unidentified individuals, especially if the skeletal elements show low sexual shape dimorphism.

1. Introduction

Sex estimation of unidentified human skeletal remains is fundamental to establish a biological profile, being a critical step on the identification process [1,2]. Traditionally, the evaluation of a biological profile (sex, population affinity, age at death, and stature) begins with sex assessment, as age at death and stature are sex-dependent [3,4]. The evaluation of biological sex on skeletal remains assumes the existence of phenotypic differences between female and male individuals [1,5]. These differences can be observed for both size and shape and are affected by chromosomic structure and the expression of sexual hormones [5,6,7]. The degree of sexual dimorphism is influenced by the biomechanical functions of certain skeletal elements, environmental factors, nutrition, and sexual selection, among others [1,8,9,10].
The pelvis is considered the most dimorphic skeletal component, as its dimorphism is related with selective pressures of reproduction and bipedalism [11,12,13]. Often it is not possible to recover a complete pelvis in forensic and bioarcheological contexts, so other dimorphic skeletal elements need to be used to perform sexual diagnosis [13,14]. Usually, the cranium is considered the best alternative when the pelvis is fragmented or absent, but extensive research has been showing that long bones can provide better results [2]. Other than the long bones [13,15,16,17] and the cranium [18,19,20], there are several methods for sex estimation, including those that are based on hands and feet bones [21,22,23], the clavicle and scapula [14,24,25,26], the sternum [27], the teeth [28], and the vertebrae [29], among others.
Sex estimation methodologies usually fall into two categories: morphological (visual) and metric [30,31]. Morphological methods consist of a visual assessment on dry bones and they are observer-dependent, which produces subjective results [7,26,30,32]. Metric methods evaluate size differences between males and females, assuming that males are larger than females [1,2,33]. They are less observer-dependent and easier to assess and interpret [13,26,30]. Both approaches tend to be influenced by geographic-specific constraints [13,34]. Molecular methods, particularly proteomic and genomic analyses, are highly accurate but generally not easily available [4].
Geometric morphometrics (GM), a compilation of techniques that provide a mathematical description of biological forms according to geometric definitions of size and shape, enables the analysis of structures with curves and protuberances that were largely disregarded by traditional morphometric methods [35]. GM quantitatively describes, analyses, and interprets shape and its variation, allowing the evaluation of anatomical differences between groups with minimal subjectivity [36,37,38]. This suite of techniques uses Cartesian coordinates, or landmarks, that retain shape information [26]. Landmark-based approaches are the most common in GM. Landmarks are discrete homologous points of correspondence among specimens [39]. Unfortunately, traditional landmark-based analyses cannot quantify all morphological structures, such as curves and surfaces. As such, semi-landmarks allow to quantify two- or three-dimensional homologous curves and surfaces and analyze them concurrently with traditional landmarks [36,40,41].
Identified skeletal collections are a cornerstone for the creation and improvement of sex estimation techniques [4,42] and the identified skeletal collections curated in Portugal are ideal to test and develop several hypotheses and methods [43]. Even though some studies assessed scapular sexual dimorphism based in Portuguese reference skeletal samples, e.g., Mendes Correia [44,45], Xavier de Morais [46], and Wasterlain [47], they were mostly based in traditional morphometrics, the exception being the work by Xavier de Morais [48], which focused on morphological traits of the scapula.
This paper presents a study based on two Portuguese reference skeletal collections: the 21st Century Identified Skeletal Collection (CEI/XXI) and the Coimbra Identified Skeletal Collection (CISC). The main objectives of this research include a depiction of the size- and shape-related sexual dimorphism in the human scapula and the estimation of sex for identification purposes using geometric morphometrics approaches, including the use of landmarks and semi-landmarks, in two-dimensional photographic images of this bone.

2. Materials and Methods

All scapulae used in this study stem from two reference skeletal collections, the 21st Century Identified Skeletal Collection (CEI/XXI) and the Coimbra Identified Skeletal Collection (CISC), both curated at the Department of Life Sciences of the University of Coimbra [49,50,51]. All CISC individuals were born between 1817 and 1924 and died between 1904 and 1938 [49]. The individuals from the CEI/XXI died between 1982 and 2012 [4,50]. The left scapulae of 211 individuals were analyzed, 111 from the CEI/XXI (71 females and 60 males), and 80 from the CISC (40 females and 40 males). The individual ages at death ranged from 17 to 98 years old in females and from 19 to 96 years old in males. Table 1 describes the number of individuals by age group. Only complete scapulae were co-opted into the study sample, while others presenting pathologies or gross taphonomic alterations were excluded. The use of two identified collections aimed to obtain a broader chronological sample, as all the individuals perished between the late 19th and the early 21st centuries. The sex assigned at birth, or biological sex, and age at death for each individual were retrieved from the available documentation [49,50,51].

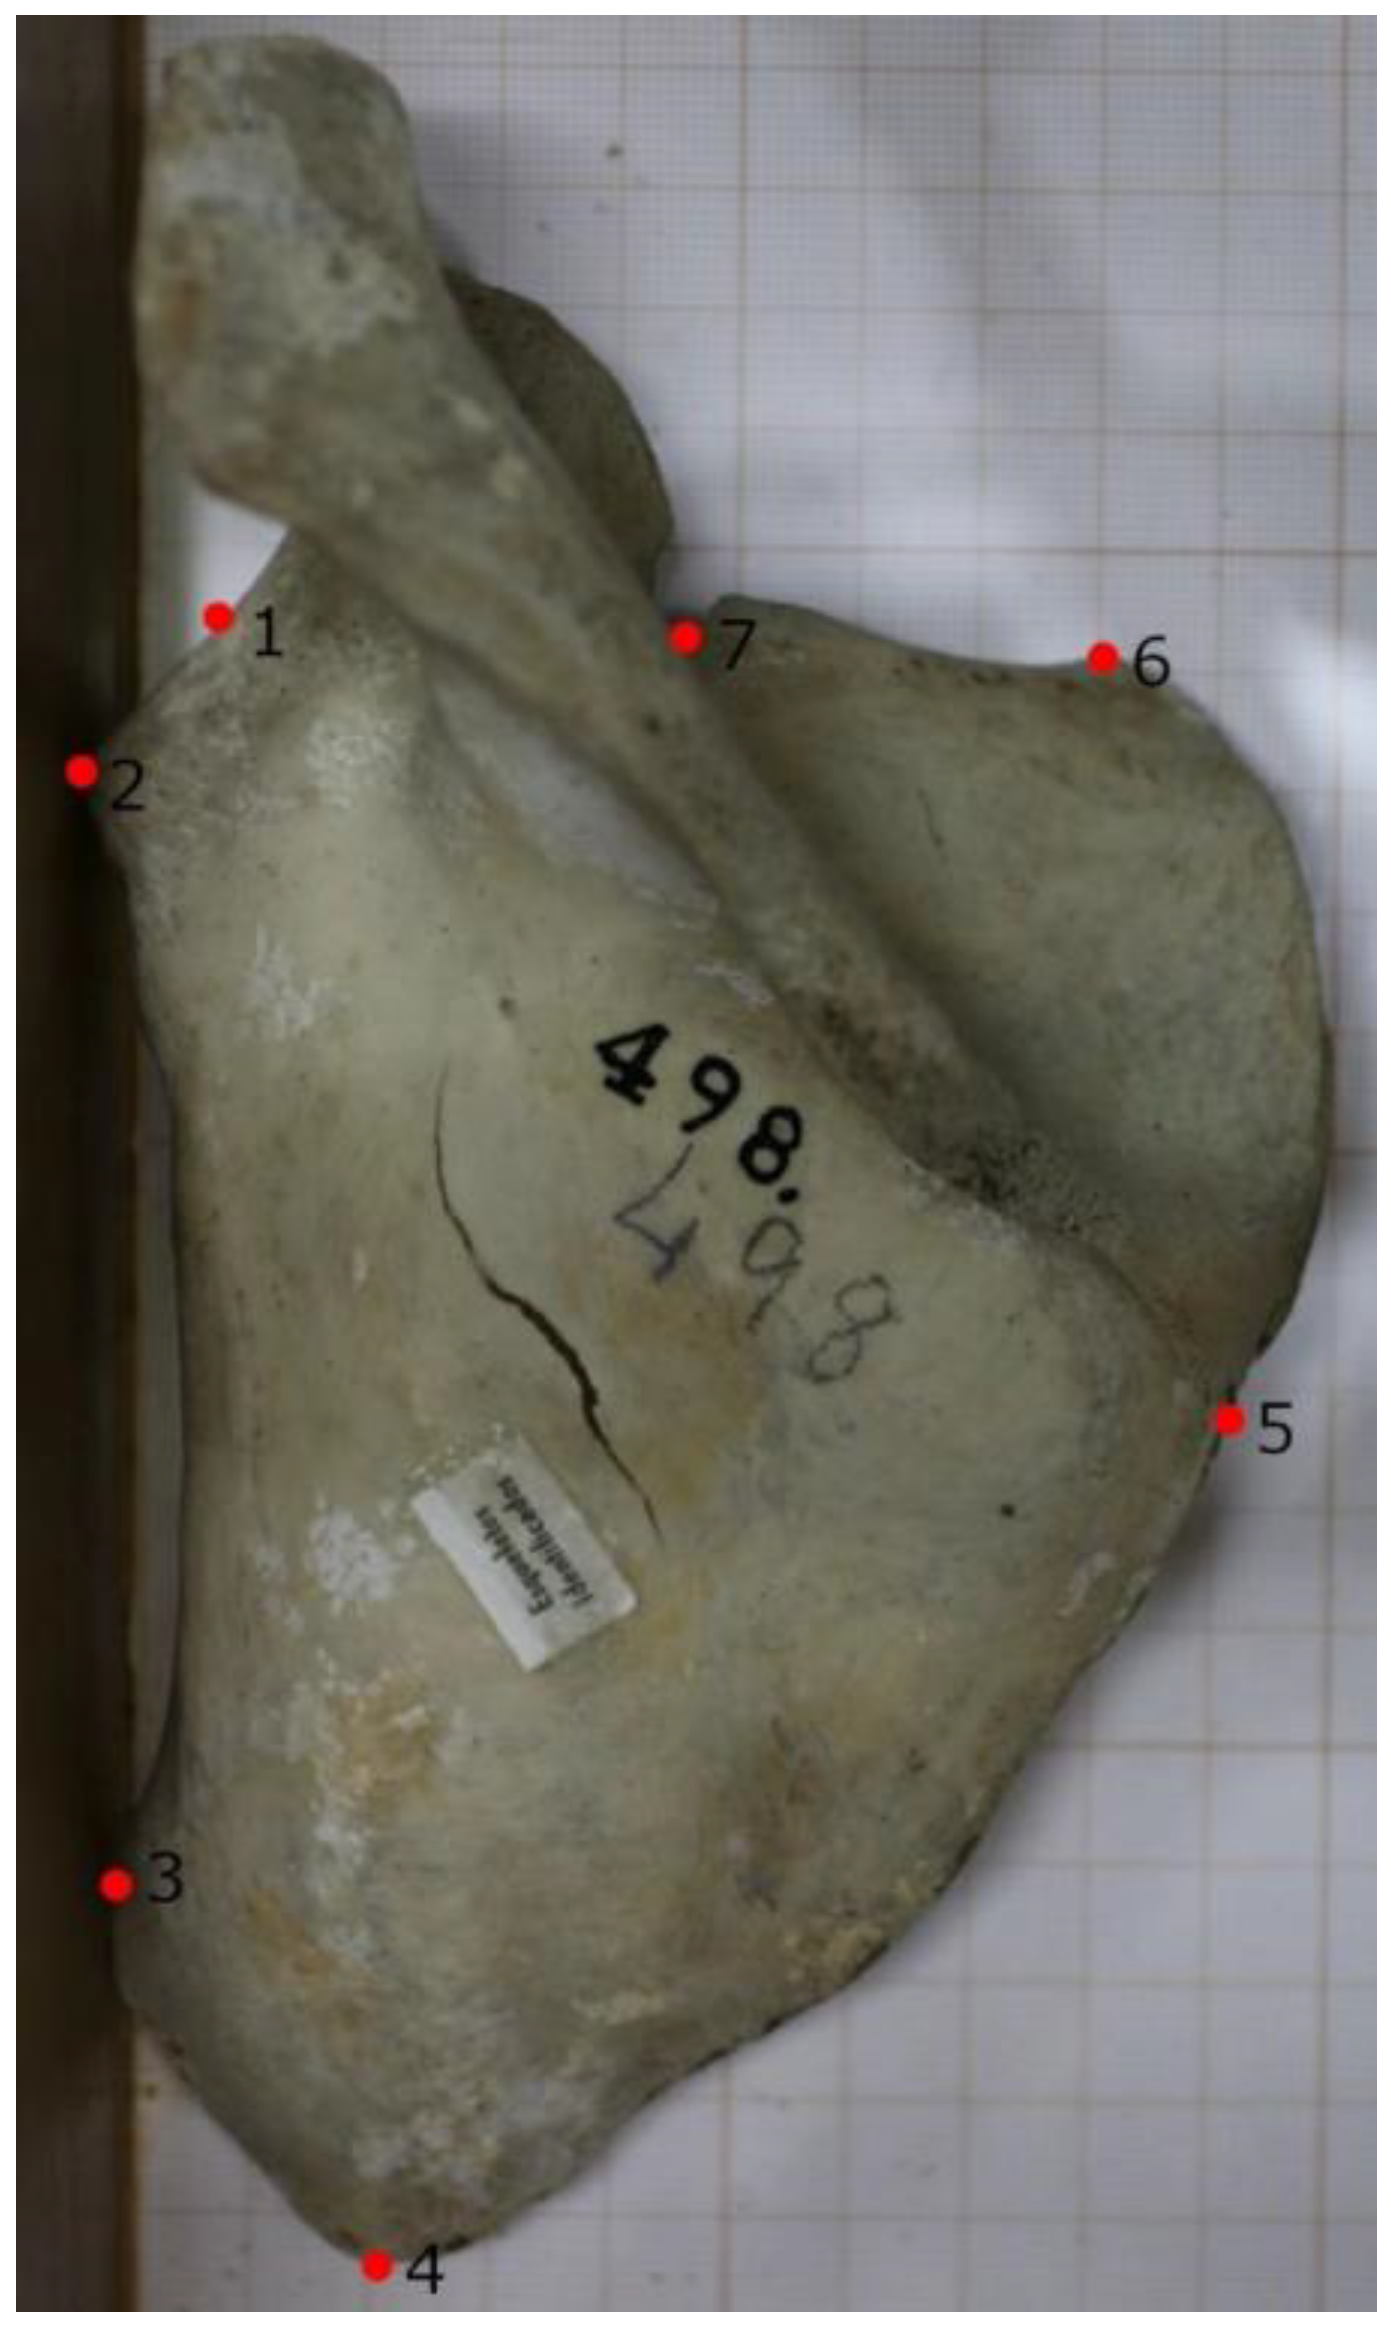
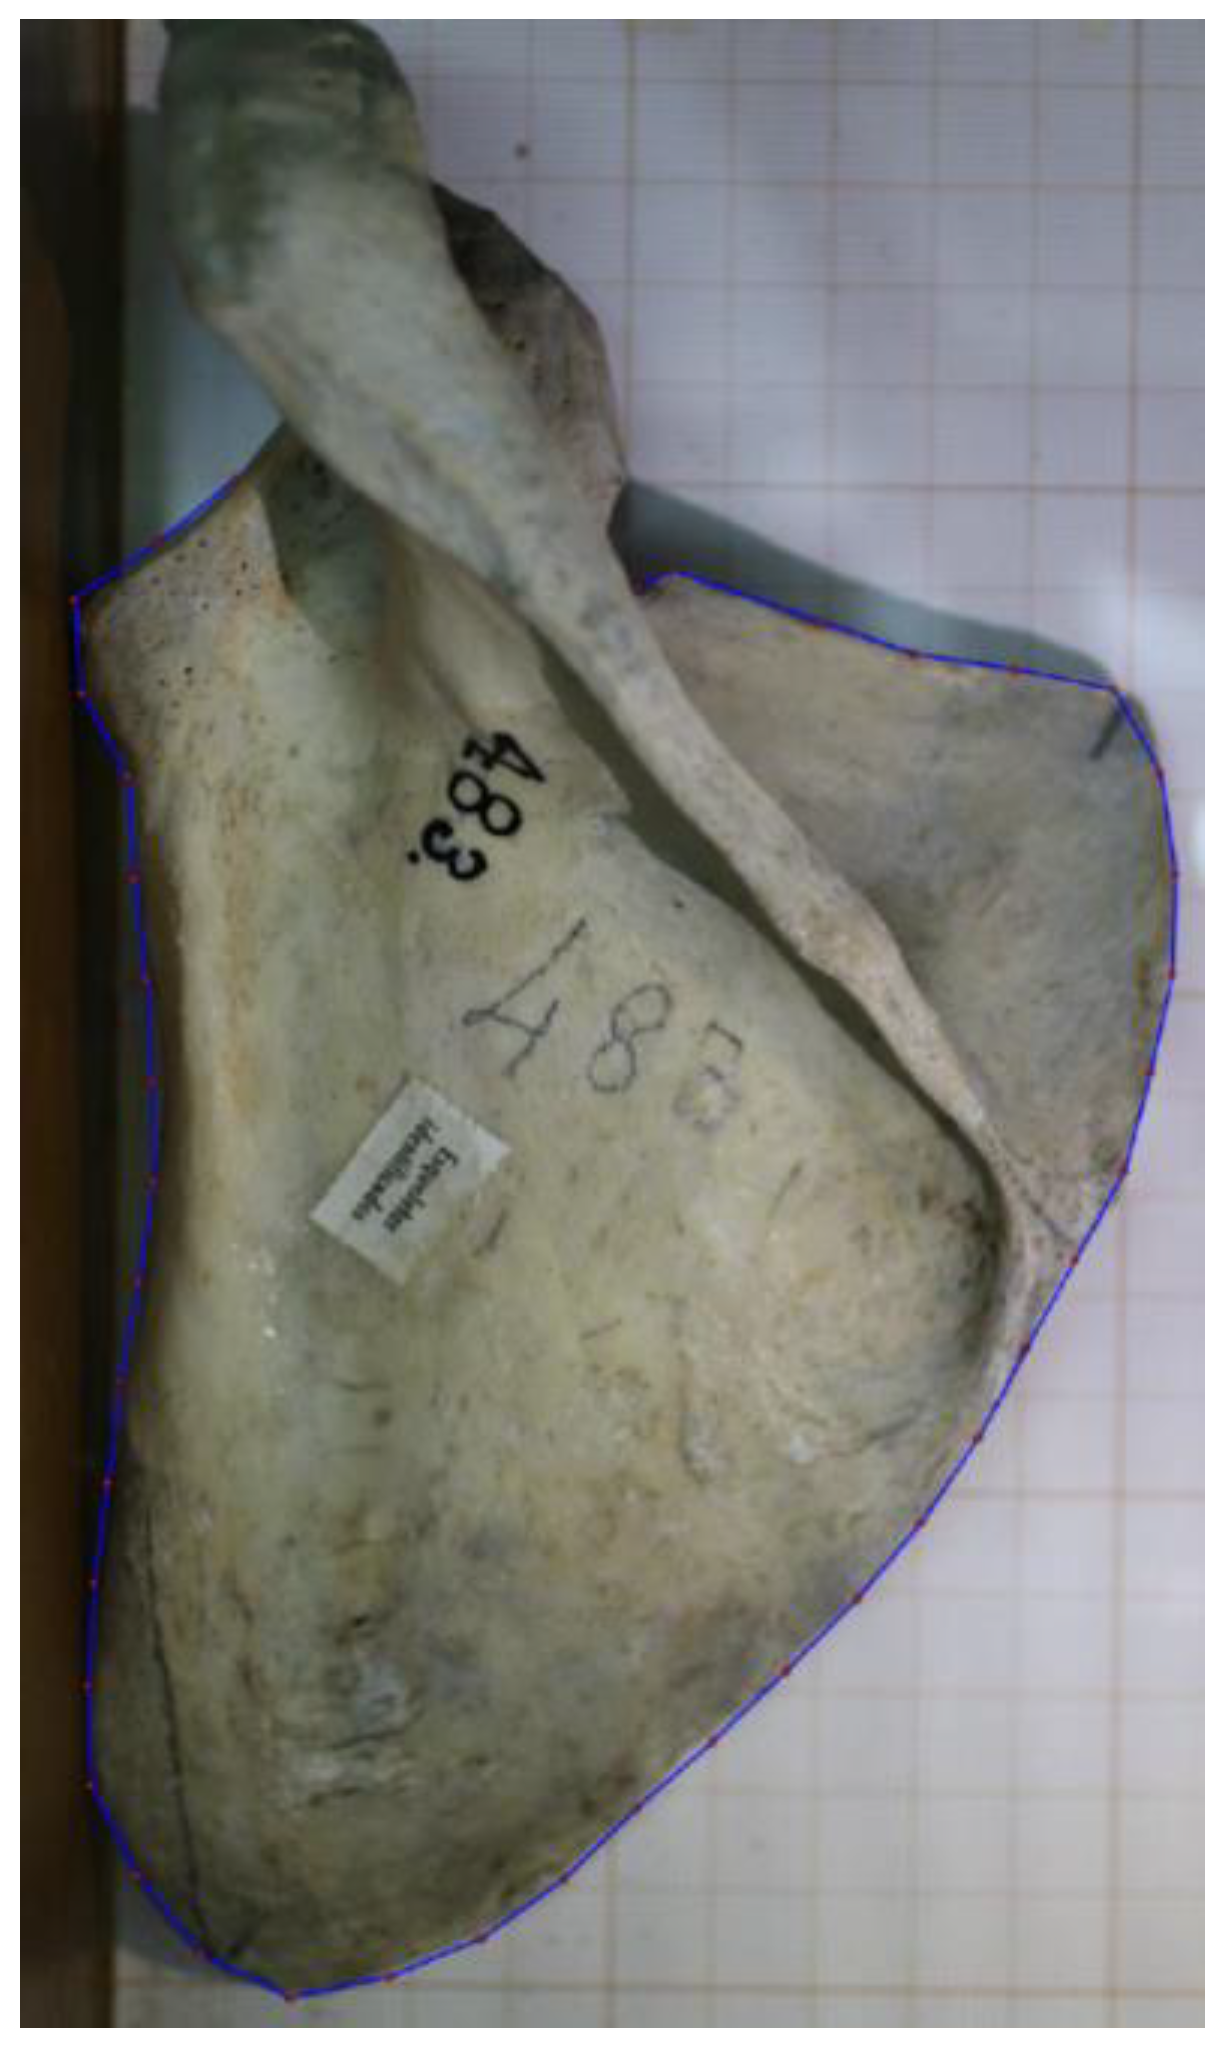
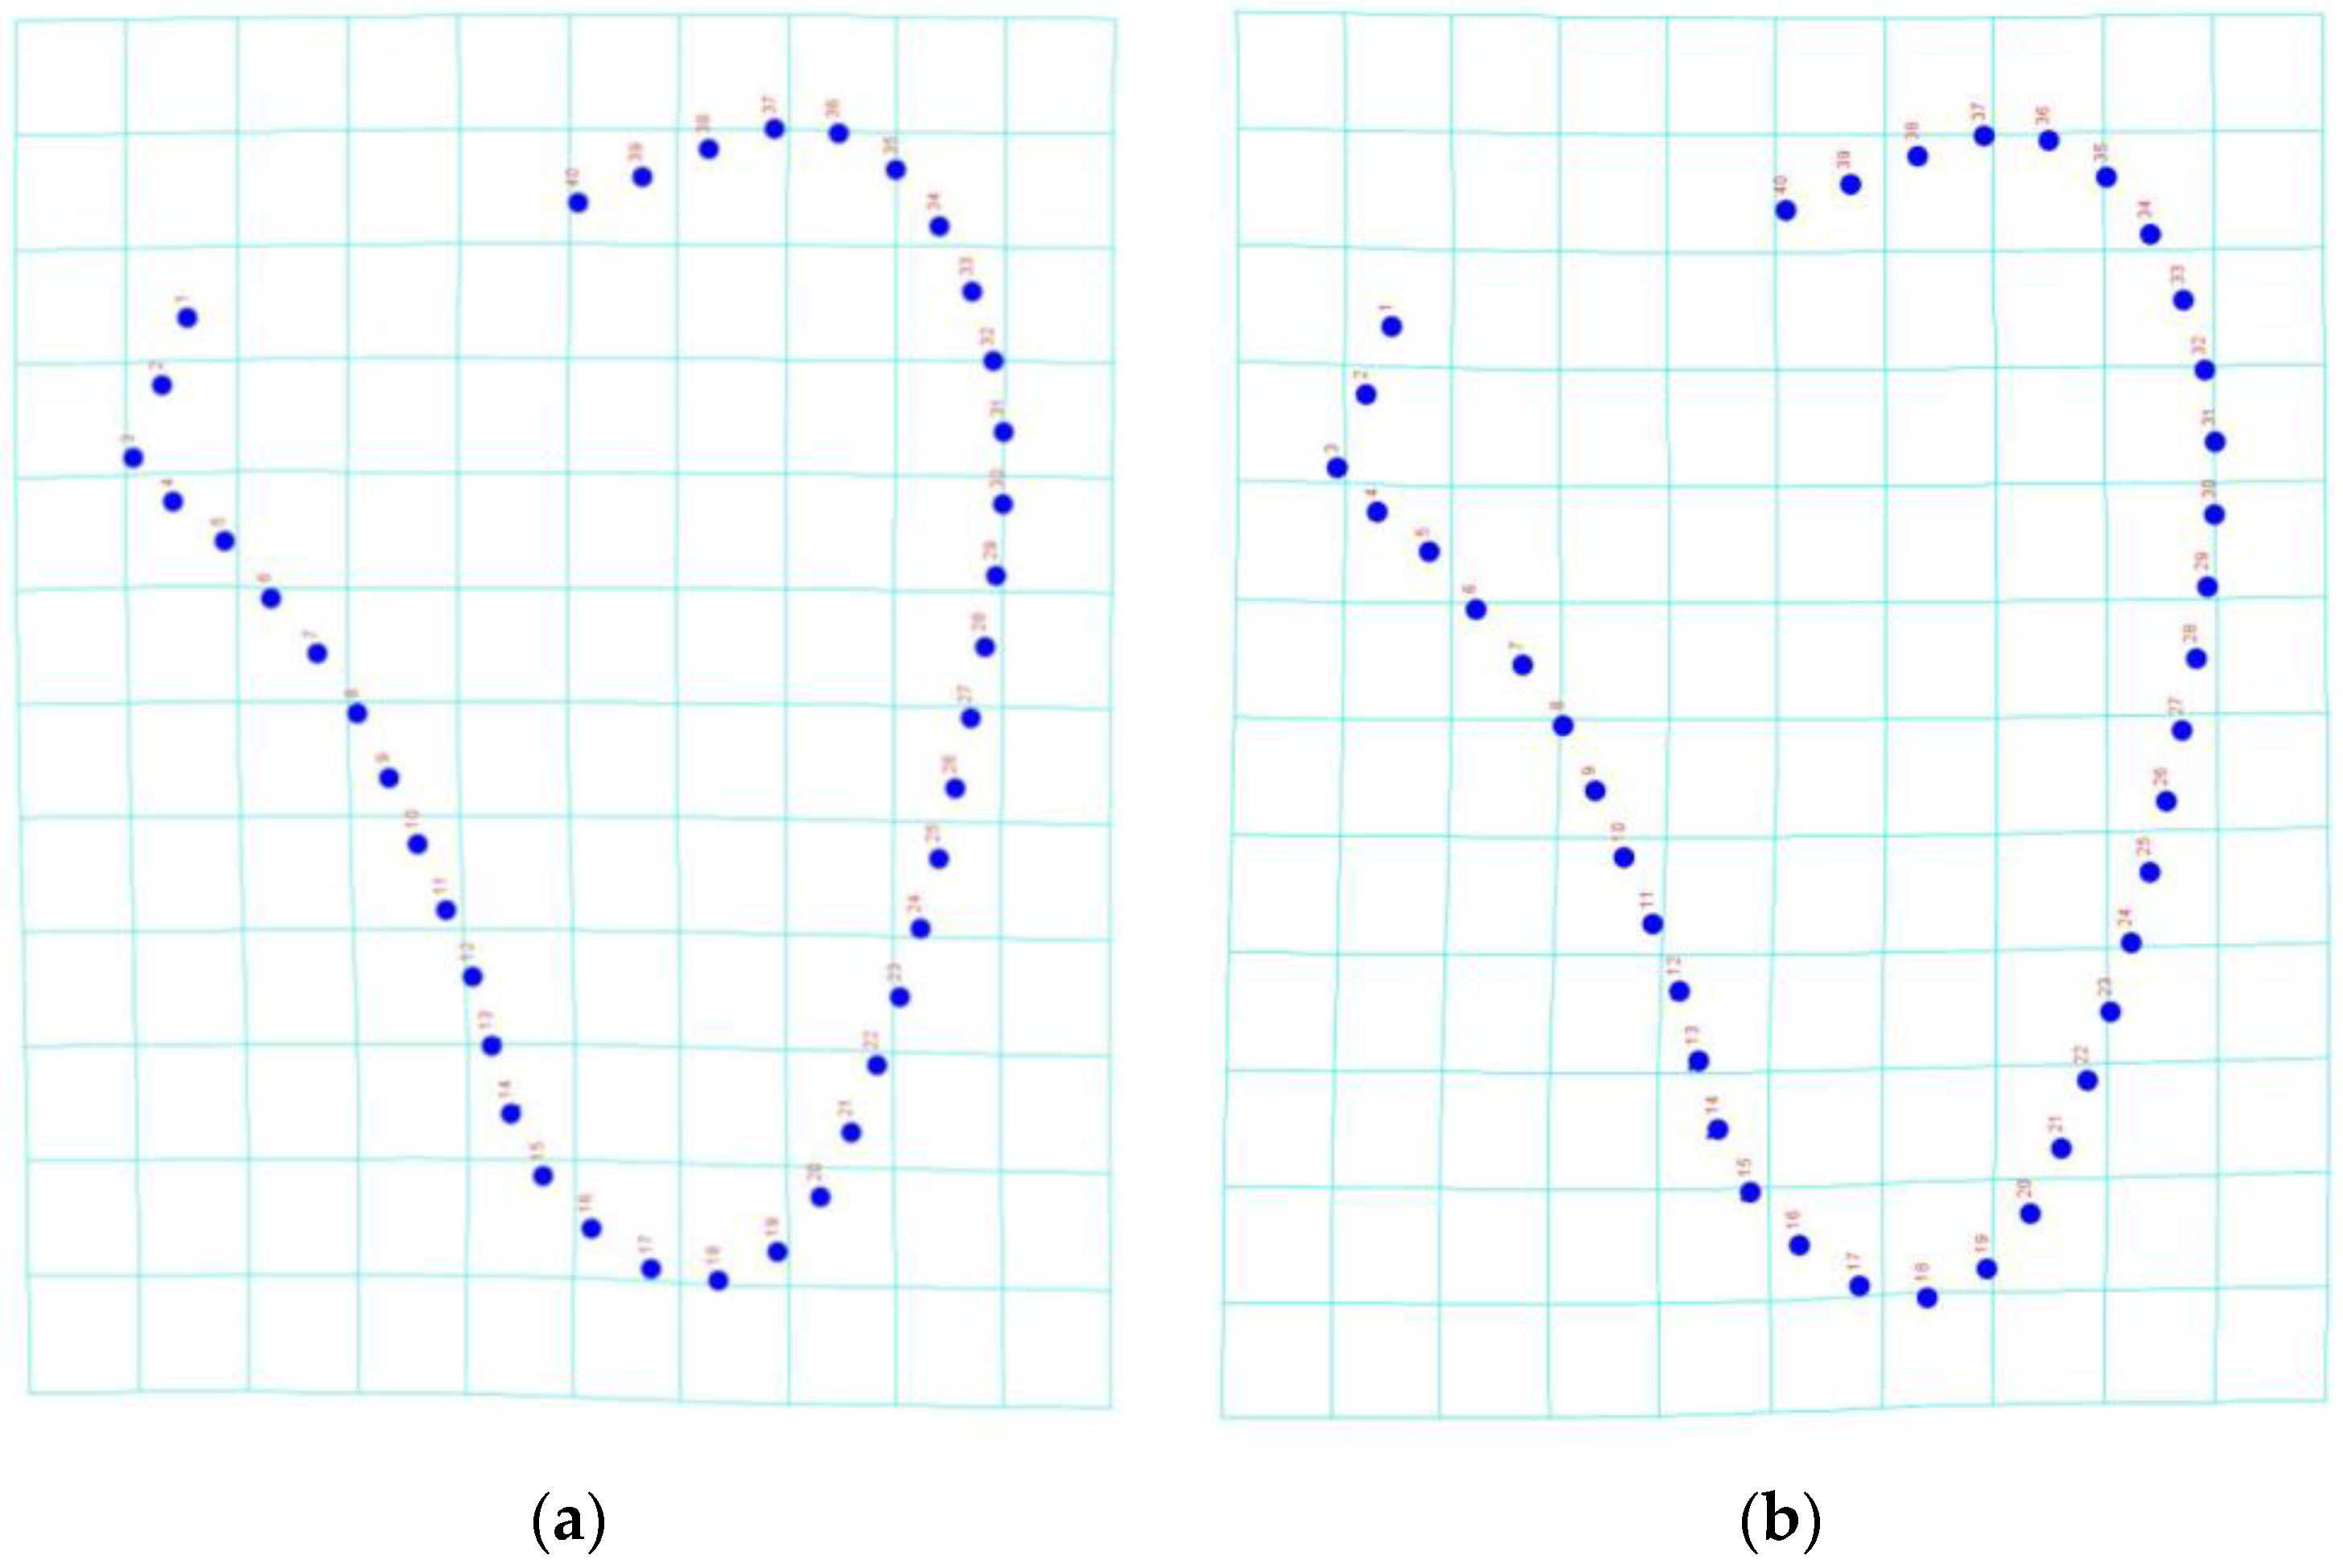
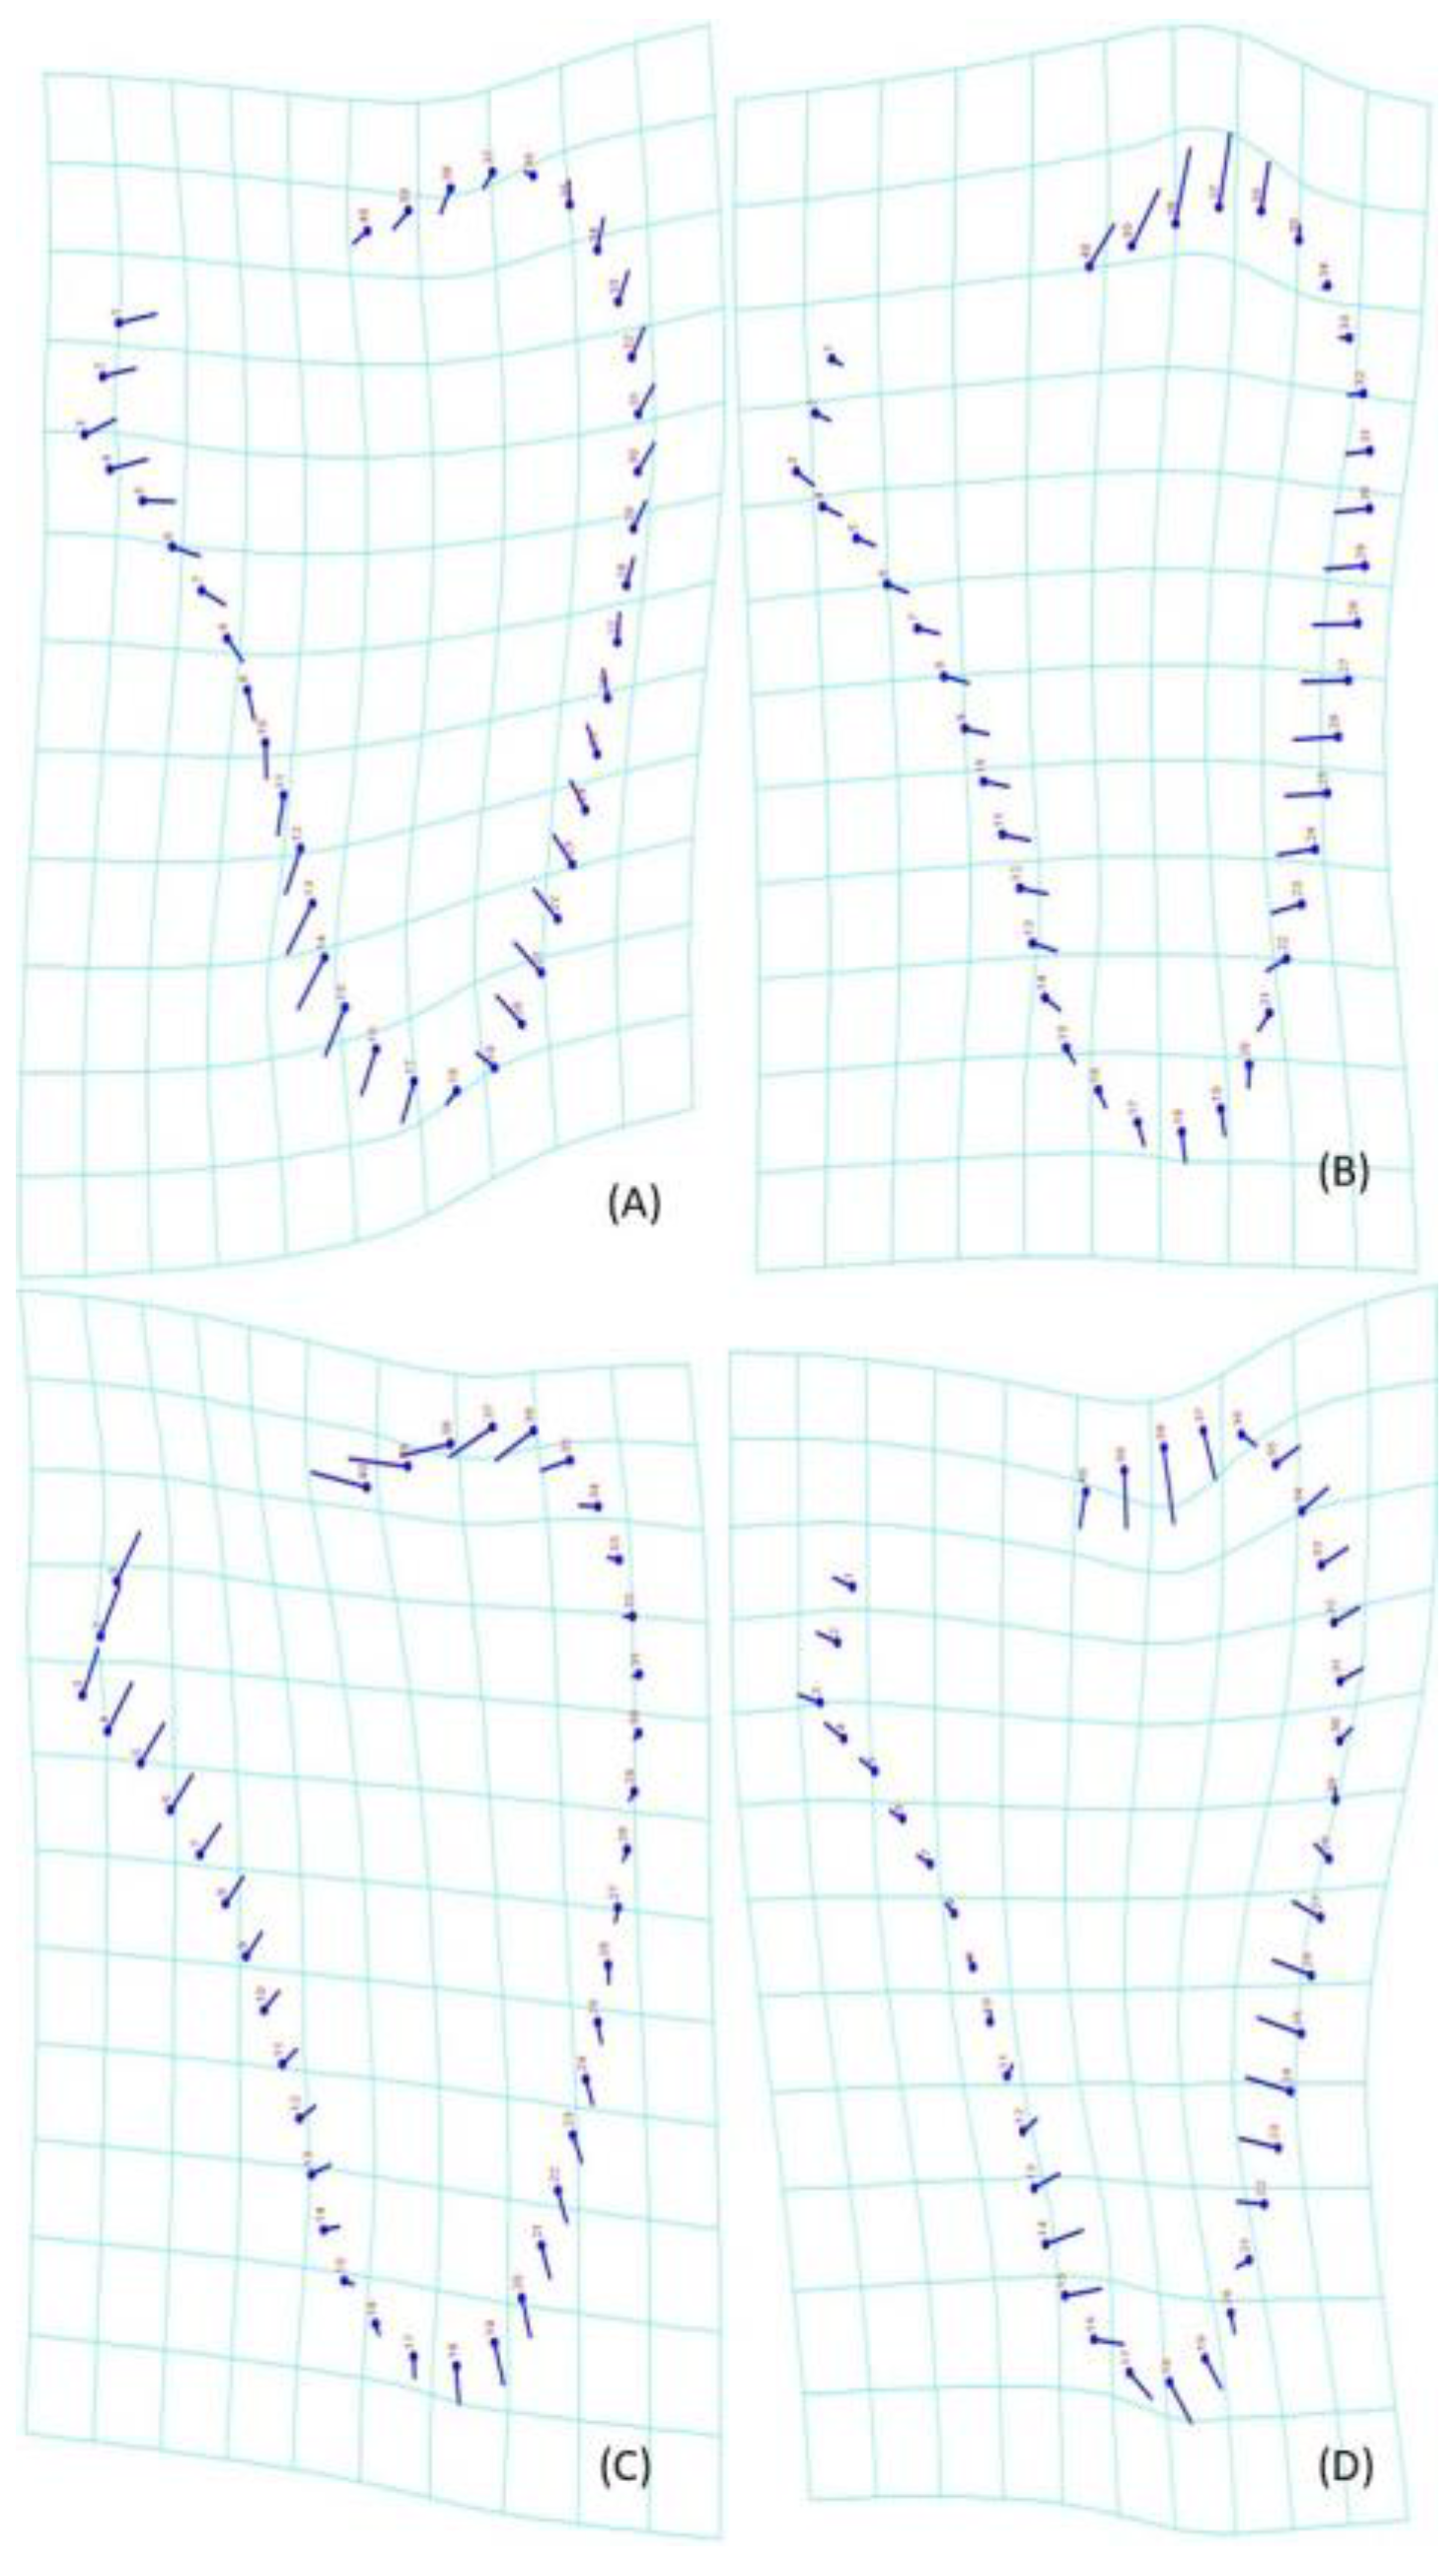
Data Collection: Landmarks and Semi-Landmarks

The scapulae were placed with the dorsal surface upwards and photographed with a Canon EOS 70D, set on a tripod, and mounted on a fixed position. The distance between the scapulae and the Macro lens (50 mm f/2.5) was 50 cm. To standardize the position of the bones, they were positioned on an osteometric board with graph paper, so that the glenoid fossa rested against the vertical surface. The camera was focused on a marked spot on the graph paper.
The captured images were transferred to a computer to assign seven homologous landmarks to each scapula. The choice of the landmarks was based on the works of Taylor and Slice [52] and Scholtz et al. [26]. These landmarks are easily identifiable, reflect the shape of the body of the scapula (Figure 1), and disregard both the spine and the acromion:
Landmark 1: The medium point of the glenoid fossa, on the posterior point of the cavity.
Landmark 2: The point where the glenoid fossa touches the vertical surface of the osteometric board.
Landmark 3: At the position where the lateral border touches the vertical surface of the osteometric board.
Landmark 4: On the most inferior point of the inferior angle.
Landmark 5: Point of intersection of the scapular spine and the medial surface. The spine was followed until the point at which it would reach the medial border, considering that sometimes it splits and forms a triangular area.
Landmark 6: On the most superior point of the superior angle.
Landmark 7: Point of intersection of the scapular spine and the superior border. The point of intersection is found by following the superior border until it encounters the scapular spine. Due to individual variation, the scapular spine sometimes does not intersect with the superior border, in those cases the point was recorded at the basis of the scapular notch.
Figure 1. Landmarks used in this study recorded on a scapula of a male individual from the CISC, scapula positioned on posterior view.
Forensicsci 02 00056 g001
The series of tps software (by F. James Rohlf) was used for data collection. The homologous landmarks were digitized with the tpsDig program, using the “Digitize landmarks” function. The scale was set to 1 cm and was measured on the graph paper, the points were digitized in the same order for all specimens, from landmark 1 to landmark 7. The scale guarantees that the landmarks have the same configuration for all specimens [53].
The tpsDig software was also used for the semi-landmarks, with the “Draw background curve”. This consisted of drawing the scapulae contour, starting on landmark 1 and ending on landmark 7. After the contour was complete, the function “Resample curve” was used and the number of points was set to 40. This quantity was considered sufficient for obtaining all the geometric information contained on the specimens. The scale was also set at 1 cm (Figure 2).
All statistical analyses were performed with MorphoJ [54] and PAST [55]. The first step in all GM analyses is the Procrustes Superimposition, or General Procrustes Analysis (GPA). This procedure is of most importance and consists of minimizing the sum of squared distances between homologous landmarks by removing size, location, and orientation data [56,57,58]. After this step, Procrustes shape coordinates, which only contains shape information, were obtained [41,59,60]. A Principal Component Analysis (PCA) can be used to explore the key features of shape variation in a given sample and as an ordination assessment of the individuals in morphospace [54]. The PCA extracts and evaluates the main patterns of the shape variation [58], simplifying and reducing the data complexity but preserving all data variation by forming new variables called PCs (Principal Components) [41,57,61]. A Procrustes ANOVA was also performed, using the Procrustes coordinates obtained after the GPA, in order to compare variation within groups with variation between groups [53]. The Procrustes ANOVA, a permutation-based MANOVA, was employed to quantify observational errors (intra- and interobserver errors) and also differences between the biological sex groups. Discriminant analysis (DA) maximizes group separation through linear combinations of the original variables and was implemented in order to test group (biological sex) differences and to assess group prediction. The DA is executed with a cross-validation function that guarantees that the accuracy of the method is not inflated [41,53]. Lastly, to evaluate the effects of size on shape (allometry) a linear regression of shape on centroid size (a proxy for size) was performed.
The identification and positioning of homologous landmarks in the scapula is difficult as there are few well-defined homologous landmarks along the borders of the scapula [26]. As such, in order to ensure the replicability of the landmark digitizing process, the intra- and interobserver errors were analyzed. The analysis of the intra-observer error consisted of the digitation of our landmarks on fifteen selected scapulae of the CISC in two different occasions. The digitations were performed five days apart. For the interobserver error the same fifteen scapulae were digitized by two observers (RM and FC).

3. Results

3.1. Landmarks Data

The intra-observer and interobserver errors were both evaluated through a Procrustes ANOVA. The results indicate that the mean squares for individual variation exceeded the measurement error, as the values of F (the ratio between the variances of Individuals and Error) are highly significant, thus suggesting that the error is inconsequential (Table 2 and Table 3).
A Procrustes ANOVA was also used to evaluate the sexual differences between groups (males and females), displaying significant differences for both shape and size (p < 0.001) (Table 4). The male individuals tend to have larger scapulae than females. Regarding shape, the differences are more accentuated on the medial and lateral curves, which are more curved in males (Figure 3a,b). The pattern of variation can be explained by the first four PCs (Figure 4), which accounted for 79.89% of the total shape variation (PC1—32.41%; PC2—23.23%; PC3—13.92%; PC4—10.33%). PC1 is responsible for an enlargement of the scapular body and a slight reduction in body length. PC2 showed a length increase, a minor narrowing at the superior side of the lateral border, a minor enlargement at the superior side of the medial border and a more projected inferior angle in males. For PC3 a narrowing of the width of the scapula was observed, except for a small section from the inferior angle to the intersection of medial border and the scapular spine. Lastly, PC4 showed a slight increase in length at the inferior angle and a body enlargement from the inferior part of the lateral border until the half of the medial border. The DA results revealed a shape overlap between the male and female individuals and group prediction was achieved with an accuracy of 66.82%, with 67 from 100 male individuals correctly assigned and 74 from 111 female individuals (Table 5). A discriminant analysis with shape and size variables combined was also performed, with 91 females correctly assigned from 111 individuals, as well as 78 of the 100 males, which corresponds to an accuracy of 80.09% (an increase of 13.27%; Table 6). The effect of size on shape was evaluated through linear regression, indicating that size only accounts for 0.97% of the shape variation (Table 7).

3.2. Semi-Landmarks Data

The Procrustes ANOVA showed that the differences between male and female individuals were statistically significant (p < 0.001) for both shape and centroid size (Table 8). The scapulae of male individuals were larger than females. Regarding shape observations, males showed more accentuated medial and lateral curves and presented an inferior angle more acute than females (Figure 5a,b). The pattern of variation showed by the PCA could be explained by the first four PCs (Figure 6), which accounted for 87.01% of the total shape variation. PC1 showed a narrowing on the glenoid fossa area and the inferior area of the medial surface. On the beginning of the lateral face was observed an increase in length associated with an enlargement on its inferior area, the same was observed for the medial surface from the middle to the superior angle. The PC2 also showed a narrowing on the glenoid fossa and on the medial and lateral surfaces; only on the superior and inferior surfaces was observed an increase in length. The PC3 is responsible for an increase in length in the glenoid fossa, associated with the narrowing of the scapular body in all lateral face and on the superior face was also observed a narrowing. From the inferior face to the middle of the medial face was an increase in length. The PC4 showed a slight enlargement on the glenoid fossa and the superior side of the medial surface. On the inferior side of the lateral and medial surface, the body of the scapulae starts narrowing. The inferior surface shows an increase in length and the superior surface a decrease. The discriminant analysis showed a small overlap between individuals of the different sexes, with an accuracy of estimation of 65.88%, with 63 of the 100 male individuals and 76 of 111 female individuals correctly assigned (Table 9). These values slightly increased to 69.19% after size was included in the model (Table 10). The size only accounts for 0.72% of shape variation (Table 11).

4. Discussion

The human skeletal sexual dimorphism is expressed as differences in size and shape, with males presenting, in general, larger bones [23,24]. Sex differences observed on human bones, including the scapula, are influenced by genetic factors, hormonal stimuli during different stages of puberty, and socioeconomic and environmental factors, among others [24,34,62,63]. These factors vary significantly between geographic populations, leading to different degrees of sexual dimorphism in distinct populations.
The scapular sexual differences can be expressed in both size and shape and these are significantly different between males and females in the studied sample. As observed in other bones, e.g., [2,10,13,64,65], the scapula from male individuals is usually larger. Traditional morphometric studies of the scapula also show that the human scapula displays sexual dimorphism in relation to size, e.g., [66,67,68,69]. Previously, Mendes Correia [44] and Xavier de Morais [46] studied Portuguese samples, substantiating the sexual dimorphism of several linear dimensions of the scapula. Sexual dimorphism in bone size is due to genetic factors that become apparent during puberty [70,71,72]. On average, females enter puberty earlier than males as estrogen levels are higher, leading to an early growth spurt and epiphyseal closure [9,70,73]. On the other hand, males have higher testosterone levels, which stimulates bone growth and increases mineral density and the formation of muscle tissue [71]. The growth velocity of the appendicular skeleton is greater than in the axial skeleton, thereby the average male has longer arms and legs [70,74,75].
Males and females also vary in shape, in addition to size dimorphism, but the systematic evaluation of the patterns of sexual shape dimorphism is less frequent than the analysis of sexual size differences [76]. Thus, it is important to specifically analyze skeletal shape differences between sexes. Regarding scapular shape, there is an enlargement of the scapula in males, the curvature of both medial and lateral surfaces is more pronounced in males. The inferior angle is more projected in males. The results broadly mimic those by Scholtz et al. [26], who observed an enlargement of the scapula, a lateral border more curved, and a projection of the inferior angle in males. The results also show a large amount of individual variation and superposition between individuals of both sexes. This was somewhat expected since the scapula is not constrained by specific biomechanical forces of sexual selection, unlike the pelvis, for example, whose size and shape are to some extent an outcome of the complexity of delivering a large-brained baby [77].
Still, shape differences might originate from males being generally more physically active stimulating the development of the muscles. Hrdlička [78] stated that scapular growth is affected by activity and muscular development, reflecting the adaptability in size, shape, and strength. Kuhns [79] and Wolffson [80] also acknowledged that surrounding muscles influence scapular shape, specifically on the medial border. Poor muscle development causes a concave medial border, while a convex medial border is influenced by maximum muscle development [79]. Scott [81] concluded that a larger muscle surrounding a particular bone reduces ossification and bone growth processes. Charisi et al. [82] reported a high degree of sexual dimorphism in the scapula in a Greek sample. The authors suggested that this was related to a high-protein diet in combination with a marked sexual division of labor.
The discriminant analysis maximizes group differences and inflates the accuracy of GM methods by including shape differences that are negligible [53]; as such, a jackknife cross-validation was used to assess the performance of both methods presented here. The results suggest that the estimation of sex through the scapula, based on landmarks and semi-landmarks analyses, does not perform well, with at least a 35% of the error range. To our knowledge, Scholtz et al. [26] is the only GM work focusing on the sexual dimorphism of the human scapula. The reported accuracy of their method based on landmarks ranges from 91.1% in females to 95.6% in males, while for the semi-landmarks the accuracy declined to 64.4% in both sexes. However, these performance metrics were not obtained with cross-validation and only re-substitution classification errors, widely understood as optimistically biased, were conveyed [4]. Other GM-based works analyzed the sexual shape dimorphism in different bones with seemingly excellent results in the prediction of biological sex, e.g., [83,84,85,86,87].
Interestingly, some GM studies focusing on the humerus indicate that the estimation of sex entirely based on shape variables is not accurate, with accuracy significantly increasing when size is incorporated in the models [88,89]. Similarly, the combination of shape and size variables of the scapula in the landmark-based approach of this study increased the accuracy of the model. This is especially relevant since scapular sexual dimorphism using traditional metric measurements—related with size—has been shown to predict sex with allocation accuracies under cross-validation above 80.0% (Papaioannou et al. [24]; Koukiasa et al. [14]; Ali et al. [90]; Vassalo et al. [68]). The concomitant quantification of size and shape traits represents sexual dimorphism in a more complete and accurate manner, as the two elements are closely entwined in the morphology of any individual [76,91].

5. Conclusions

Geometric morphometrics techniques feature promising results in the evaluation of skeletal sexual dimorphism, including in the size and shape of the scapula. This study benefited from the wide-ranging biological and social variation embodied by two Portuguese skeletal reference collections to evaluate and interpret sexual dimorphism in the scapula.
As expected, the scapular size is larger in males, while the major scapular shape variations are observed on the curvature of medial and lateral surfaces (more accentuated in males) and the projection of the inferior angle (more acute/projected in males). However, even though sex-related shape differences were observed, the GM failed to accurately predict the sex of unidentified individuals based on shape only. Instead, a combination of size and shape in the landmark-based analysis improved the cross-validated accuracy to 80.09%—although the same was not observed for semi-landmarks. These results support previous works, thus suggesting that convening shape and size variables together might improve the chances of correctly sexing unidentified individuals with GM, especially in skeletal elements that show low sexual shape dimorphism.

Author Contributions

Conceptualization, R.M., F.C. and M.T.F.; methodology, R.M. and F.C.; formal analysis, R.M.; data curation, R.M.; writing—original draft preparation, R.M. and F.C.; writing—review and editing, M.T.F.; supervision, F.C. and M.T.F.; All authors have read and agreed to the published version of the manuscript.

Funding

FCT—Fundação para a Ciência e Tecnologia, under the projects with the references UIDB/00283/2020 and UIDB/04004/2020.

Institutional Review Board Statement

Not applicable.

Informed Consent Statement

Not applicable.

Data Availability Statement

Data is available upon request.

Acknowledgments

The co-author F.C. research was financed by national funds by FCT—Fundação para a Ciência e Tecnologia, under the project with the reference UIDB/00283/2020. The co-author M.T.F. research was financed by the R & D Unit Centre for Functional Ecology—Science for People and the Planet (CFE), with reference UIDB/04004/2020, financed by FCT/MCTES through national funds (PIDDAC).

Conflicts of Interest

The authors declare no conflict of interest.

References

  1. Christensen, A.M.; Passalacqua, N.V.; Bartelink, E.J. (Eds.) Sex Estimation. In Forensic Anthropology, 2nd ed.; Academic Press: Warsaw, Poland, 2019; pp. 243–270. ISBN 978-0-12-815734-3. [Google Scholar]
  2. Spradley, M.K.; Jantz, R.L. Sex Estimation in Forensic Anthropology: Skull Versus Postcranial Elements. J. Forensic Sci. 2011, 56, 289–296. [Google Scholar] [CrossRef] [PubMed]
  3. Bethard, J.D.; VanSickle, C. Applications of Sex Estimation in Paleoanthropology, Bioarchaeology, and Forensic Anthropology. In Sex Estimation of the Human Skeleton: History, Methods, and Emerging Techniques; Klales, A.R., Ed.; Academic Press: London, UK, 2020; pp. 25–34. ISBN 978-0-12-815767-1. [Google Scholar]
  4. Curate, F. The Estimation of Sex of Human Skeletal Remains in the Portuguese Identified Collections: History and Prospects. Forensic Sci. 2022, 2, 272–286. [Google Scholar] [CrossRef]
  5. Berg, G.E. Sex Estimation of Unknown Human Skeletal Remains. In Forensic Anthropology a Comprehensive Introduction; Langley, N.R., Tersigni-Tarrant, M.A., Eds.; CRC Press: Boca Raton, FL, USA, 2017; pp. 143–162. ISBN 978-1-315-30003-0. [Google Scholar]
  6. Best, K.C.; Garvin, H.M.; Cabo, L.L. An Investigation into the Relationship between Human Cranial and Pelvic Sexual Dimorphism. J. Forensic Sci. 2018, 63, 990–1000. [Google Scholar] [CrossRef] [PubMed]
  7. Rowbotham, S.K. Anthropological Estimation of Sex. In Handbook of Forensic Anthropology and Archaeology; Blau, S., Ubelaker, D.K., Eds.; Routledge: New York, NY, USA, 2016; p. 738. [Google Scholar]
  8. Bigoni, L.; Velemínská, J.; Brůzek, J. Three-Dimensional Geometric Morphometric Analysis of Cranio-Facial Sexual Dimorphism in a Central European Sample of Known Sex. Homo 2010, 61, 16–32. [Google Scholar] [CrossRef]
  9. Dunsworth, H.M. Expanding the Evolutionary Explanations for Sex Differences in the Human Skeleton. Evol. Anthropol. Issues News Rev. 2020, 29, 108–116. [Google Scholar] [CrossRef]
  10. Steyn, M.; Işcan, M.Y. Sexual Dimorphism in the Crania and Mandibles of South African Whites. Forensic Sci. Int. 1998, 98, 9–16. [Google Scholar] [CrossRef]
  11. Brůžek, J.; Santos, F.; Dutailly, B.; Murail, P.; Cunha, E. Validation and Reliability of the Sex Estimation of the Human Os Coxae Using Freely Available DSP2 Software for Bioarchaeology and Forensic Anthropology. Am. J. Phys. Anthropol. 2017, 164, 440–449. [Google Scholar] [CrossRef]
  12. Curate, F.; Coelho, J.; Gonçalves, D.; Coelho, C.; Ferreira, M.T.; Navega, D.; Cunha, E. A Method for Sex Estimation Using the Proximal Femur. Forensic Sci. Int. 2016, 266, 579.e1–579.e7. [Google Scholar] [CrossRef] [Green Version]
  13. Curate, F.; Mestre, F.; Garcia, S.J. Sex Assessment with the Radius in Portuguese Skeletal Populations (Late 19th–Early to Mid 20th Centuries). Leg. Med. 2021, 48, 101790. [Google Scholar] [CrossRef]
  14. Koukiasa, A.E.; Eliopoulos, C.; Manolis, S.K. Biometric Sex Estimation Using the Scapula and Clavicle in a Modern Greek Population. Anthropol. Anz. 2017, 74, 241–246. [Google Scholar] [CrossRef]
  15. Attia, M.H.; Aboulnoor, B.A.E.-S. Tailored Logistic Regression Models for Sex Estimation of Unknown Individuals Using the Published Population Data of the Humeral Epiphyses. Leg. Med. 2020, 45, 101708. [Google Scholar] [CrossRef] [PubMed]
  16. Cuzzullin, M.C.; Curate, F.; Freire, A.R.; Costa, S.T.; Prado, F.B.; Daruge Junior, E.; Cunha, E.; Rossi, A.C. Validation of Anthropological Measures of the Human Femur for Sex Estimation in Brazilians. Aust. J. Forensic Sci. 2020, 54, 61–74. [Google Scholar] [CrossRef]
  17. Kranioti, E.F.; Apostol, M.A. Sexual Dimorphism of the Tibia in Contemporary Greeks, Italians, and Spanish: Forensic Implications. Int. J. Leg. Med. 2015, 129, 357–363. [Google Scholar] [CrossRef] [PubMed]
  18. Čechová, M.; Dupej, J.; Brůžek, J.; Bejdová, Š.; Horák, M.; Velemínská, J. Sex Estimation Using External Morphology of the Frontal Bone and Frontal Sinuses in a Contemporary Czech Population. Int. J. Leg. Med. 2019, 133, 1285–1294. [Google Scholar] [CrossRef]
  19. Cunha, E. Cálculo de Funções Discriminantes Para a Diagnose Sexual Do Crânio. Antropol. Port. 1990, 8, 17–37. [Google Scholar]
  20. Gillet, C.; Costa-Mendes, L.; Rérolle, C.; Telmon, N.; Maret, D.; Savall, F. Sex Estimation in the Cranium and Mandible: A Multislice Computed Tomography (MSCT) Study Using Anthropometric and Geometric Morphometry Methods. Int. J. Leg. Med. 2020, 134, 823–832. [Google Scholar] [CrossRef]
  21. Curate, F.; d’Oliveira Coelho, J.; Silva, A.M. CalcTalus: An Online Decision Support System for the Estimation of Sex with the Calcaneus and Talus. Archaeol. Anthropol. Sci. 2021, 13, 74. [Google Scholar] [CrossRef]
  22. Gualdi-Russo, E. Sex Determination from the Talus and Calcaneus Measurements. Forensic Sci. Int. 2007, 171, 151–156. [Google Scholar] [CrossRef]
  23. Sorrentino, R.; Belcastro, M.G.; Figus, C.; Stephens, N.B.; Turley, K.; Harcourt-Smith, W.; Ryan, T.M.; Benazzi, S. Exploring Sexual Dimorphism of the Modern Human Talus through Geometric Morphometric Methods. PLoS ONE 2020, 15, e0229255. [Google Scholar] [CrossRef] [Green Version]
  24. Papaioannou, V.A.; Kranioti, E.F.; Joveneaux, P.; Nathena, D.; Michalodimitrakis, M. Sexual Dimorphism of the Scapula and the Clavicle in a Contemporary Greek Population: Applications in Forensic Identification. Forensic Sci. Int. 2012, 217, 231.e1–231.e7. [Google Scholar] [CrossRef]
  25. Paulis, M.G.; Abu Samra, M.F. Estimation of Sex from Scapular Measurements Using Chest CT in Egyptian Population Sample. J. Forensic Radiol. Imaging 2015, 3, 153–157. [Google Scholar] [CrossRef]
  26. Scholtz, Y.; Steyn, M.; Pretorius, E. A Geometric Morphometric Study into the Sexual Dimorphism of the Human Scapula. Homo 2010, 61, 253–270. [Google Scholar] [CrossRef] [PubMed] [Green Version]
  27. Macaluso, P.J.; Lucena, J. Estimation of Sex from Sternal Dimensions Derived from Chest Plate Radiographs in Contemporary Spaniards. Int. J. Leg. Med. 2014, 128, 389–395. [Google Scholar] [CrossRef] [PubMed]
  28. Kazzazi, S.M.; Kranioti, E.F. Sex Estimation Using Cervical Dental Measurements in an Archaeological Population from Iran. Archaeol. Anthropol. Sci. 2018, 10, 439–448. [Google Scholar] [CrossRef] [Green Version]
  29. Gama, I.; Navega, D.; Cunha, E. Sex Estimation Using the Second Cervical Vertebra: A Morphometric Analysis in a Documented Portuguese Skeletal Sample. Int. J. Leg. Med. 2015, 129, 365–372. [Google Scholar] [CrossRef]
  30. Krishan, K.; Chatterjee, P.M.; Kanchan, T.; Kaur, S.; Baryah, N.; Singh, R.K. A Review of Sex Estimation Techniques during Examination of Skeletal Remains in Forensic Anthropology Casework. Forensic Sci. Int. 2016, 261, 165.e1–165.e8. [Google Scholar] [CrossRef]
  31. Omar, N.; Ali, S.H.M.; Shafie, M.S.; Ismail, N.A.N.; Hadi, H.; Nor, F.M. A preliminary study of sexual dimorphism of scapula by computed tomography in the Malaysian population. Asian J. Pharm. Clin. Res. 2019, 12, 391–395. [Google Scholar] [CrossRef] [Green Version]
  32. Petaros, A.; Garvin, H.M.; Sholts, S.B.; Schlager, S.; Wärmländer, S.K.T.S. Sexual Dimorphism and Regional Variation in Human Frontal Bone Inclination Measured via Digital 3D Models. Leg. Med. 2017, 29, 53–61. [Google Scholar] [CrossRef] [PubMed]
  33. Galeta, P.; Brůžek, J. Sex Estimation Using Continuous Variables: Problems and Principles of Sex Classification in the Zone of Uncertainty. In Statistics and Probability in Forensic Anthropology; Obertova, Z., Stewart, A., Cattaneo, C., Eds.; Academic Press: London, UK, 2020; pp. 155–182. ISBN 978-0-12-815765-7. [Google Scholar]
  34. Ubelaker, D.H.; DeGaglia, C.M. Population Variation in Skeletal Sexual Dimorphism. Forensic Sci. Int. 2017, 278, 407.e1–407.e7. [Google Scholar] [CrossRef]
  35. Kimmerle, E.H.; Ross, A.; Slice, D. Sexual Dimorphism in America: Geometric Morphometric Analysis of the Craniofacial Region. J. Forensic Sci. 2008, 53, 54–57. [Google Scholar] [CrossRef]
  36. Bookstein, F.L. Morphometric Tools for Landmark Data: Geometry and Biology; Cambridge University Press: Cambridge, UK, 1991; ISBN 978-0-521-58598-9. [Google Scholar]
  37. Mitteroecker, P.; Gunz, P.; Windhager, S.; Schaefer, K. A Brief Review of Shape, Form, and Allometry in Geometric Morphometrics, with Applications to Human Facial Morphology. Hystrix Ital. J. Mammal. 2013, 24, 59–66. [Google Scholar] [CrossRef]
  38. Rohlf, F.J. Morphometrics. Annu. Rev. Ecol. Syst. 1990, 21, 299–316. [Google Scholar] [CrossRef]
  39. Wärmländer, S.K.T.S.; Garvin, H.; Guyomarc’h, P.; Petaros, A.; Sholts, S.B. Landmark Typology in Applied Morphometrics Studies: What’s the Point? Anat. Rec. 2019, 302, 1144–1153. [Google Scholar] [CrossRef] [PubMed]
  40. Gunz, P.; Mitteroecker, P. Semilandmarks: A Method for Quantifying Curves and Surfaces. Hystrix Ital. J. Mammal. 2013, 24, 103–109. [Google Scholar] [CrossRef]
  41. Zelditch, M.L.; Swiderski, D.L.; Sheets, H.D. Geometric Morphometrics for Biologists: A Primer, 2nd ed.; Academic Press: Oxford, UK, 2012. [Google Scholar]
  42. Cardoso, H. An Ethical, Cultural and Historical Background for Cemetery-Based Human Skeletal Reference Collections. J. Contemp. Archaeol. 2021, 8, 21–52. [Google Scholar] [CrossRef]
  43. Henderson, C.Y.; Alves Cardoso, F. Identified Skeletal Collections: The Testing Ground of Anthropology? In Identified Skeletal Collections: The Testing Ground of Anthropology? Archaeopress Publishing Ltd.: Oxford, UK, 2018; pp. 1–190. [Google Scholar] [CrossRef]
  44. Mendes Correia, A. Osteometria Portuguesa: II Cintura Escapular. Ann. Sci. Da Acad. Polytech. Do Porto 1918, XIII, 102–123. [Google Scholar]
  45. Mendes Correia, A. Osteometria Portuguesa: II Cintura Escapular (Continuação). Ann. Sci. Da Acad. Polytech. Do Porto 1918, XIII, 172–195. [Google Scholar]
  46. Xavier de Morais, M.H. Estudo Antropológico Da Omoplata Nos Portugueses: I. Caracteres Métricos. Contrib. Para O Estud. Da Antropol. Port. 1966, VIII, 21–97. [Google Scholar]
  47. Wasterlain, R.S.N. Morphé: Análise das Proporções Entre os Membros, Dimorfismo Sexual E Estatura de uma Amostra da Colecção de Esqueletos Identificados do Museu Antropológico da Universidade de Coimbra. Ph.D. Thesis, Universidade de Coimbra, Coimbra, Portugal, 2000. [Google Scholar]
  48. Xavier de Morais, M.H. Estudo Antropológico Da Omoplata Nos Portugueses: II Caracteres Morfológicos. Contrib. Para O Estud. Da Antropol. Port. 1968, 8, 103–151. [Google Scholar]
  49. Cunha, E.; Wasterlain, S. The Coimbra Identified Osteological Collections. In Skeletal Series and Their Socio-Economic Context; Grupe, G., Peters, J., Eds.; M. Leidorf: Rahden/Westf, Germany, 2007; pp. 23–33. ISBN 978-3-89646-620-4. [Google Scholar]
  50. Ferreira, M.T.; Coelho, C.; Makhoul, C.; Navega, D.; Gonçalves, D.; Cunha, E.; Curate, F. New Data about the 21st Century Identified Skeletal Collection (University of Coimbra, Portugal). Int. J. Leg. Med. 2021, 135, 1087–1094. [Google Scholar] [CrossRef] [PubMed]
  51. Ferreira, M.T.; Vicente, R.; Navega, D.; Gonçalves, D.; Curate, F.; Cunha, E. A New Forensic Collection Housed at the University of Coimbra, Portugal: The 21st Century Identified Skeletal Collection. Forensic Sci. Int. 2014, 245, 202.e1–202.e5. [Google Scholar] [CrossRef] [PubMed] [Green Version]
  52. Taylor, A.B.; Slice, D.E. A Geometric Morphometric Assessment of the Relationship between Scapular Variation and Locomotion in African Apes. In Modern Morphometrics in Physical Anthropology; Slice, D.E., Ed.; Springer: Boston, MA, USA, 2005; pp. 299–318. [Google Scholar]
  53. Viscosi, V.; Cardini, A. Leaf Morphology, Taxonomy and Geometric Morphometrics: A Simplified Protocol for Beginners. PLoS ONE 2011, 6, e0025630. [Google Scholar] [CrossRef] [PubMed] [Green Version]
  54. Klingenberg, C.P. MorphoJ: An Integrated Software Package for Geometric Morphometrics. Mol. Ecol. Resour. 2011, 11, 353–357. [Google Scholar] [CrossRef] [PubMed]
  55. Hammer, Ø.; Harper, D.A.T.; Ryan, P.D. Past: Paleontological Statistics Software Package for Education and Data Analysis. Palaeontol. Electron. 2001, 4, 9. [Google Scholar]
  56. Klingenberg, C.P. Walking on Kendall’s Shape Space: Understanding Shape Spaces and Their Coordinate Systems. Evol. Biol. 2020, 47, 334–352. [Google Scholar] [CrossRef]
  57. Mitteroecker, P.; Gunz, P. Advances in Geometric Morphometrics. Evol. Biol. 2009, 36, 235–247. [Google Scholar] [CrossRef] [Green Version]
  58. Savriama, Y. A Step-by-Step Guide for Geometric Morphometrics of Floral Symmetry. Front. Plant Sci. 2018, 9, 1433. [Google Scholar] [CrossRef] [PubMed] [Green Version]
  59. Dryden, I.L.; Mardia, K.V. Statistical Shape Analysis with Applications in R, 2nd ed.; John Wiley and Sons Ltd.: Chichester, UK, 2016; ISBN 978-1-119-07250-8. [Google Scholar]
  60. Tatsuta, H.; Takahashi, K.H.; Sakamaki, Y. Geometric Morphometrics in Entomology: Basics and Applications. Entomol. Sci. 2018, 21, 164–184. [Google Scholar] [CrossRef] [Green Version]
  61. Jolliffe, I.T.; Cadima, J. Principal Component Analysis: A Review and Recent Developments. Philos. Trans. R. Soc. A Math. Phys. Eng. Sci. 2016, 374, 20150202. [Google Scholar] [CrossRef] [Green Version]
  62. Laurent, M.; Antonio, L.; Sinnesael, M.; Dubois, V.; Gielen, E.; Classens, F.; Vanderschueren, D. Androgens and Estrogens in Skeletal Sexual Dimorphism. Asian J. 2014, 16, 213–222. [Google Scholar] [CrossRef] [Green Version]
  63. Torimitsu, S.; Makino, Y.; Saitoh, H.; Sakuma, A.; Ishii, N.; Yajima, D.; Inokuchi, G.; Motomura, A.; Chiba, F.; Yamaguchi, R.; et al. Sex Estimation Based on Scapula Analysis in a Japanese Population Using Multidetector Computed Tomography. Forensic Sci. Int. 2016, 262, 285.e1–285.e5. [Google Scholar] [CrossRef] [PubMed]
  64. Curate, F.; Umbelino, C.; Perinha, A.; Nogueira, C.; Silva, A.M.; Cunha, E. Sex Determination from the Femur in Portuguese Populations with Classical and Machine-Learning Classifiers. J. Forensic Leg. Med. 2017, 52, 75–81. [Google Scholar] [CrossRef] [PubMed]
  65. Lescure, J.; Ardevines, C.; Becerra, P.; Marrodán, M.D. New Random Generalized Linear Model for Sex Determination Based on Cranial Measurements. Archaeol. Anthropol. Sci. 2020, 12, 168. [Google Scholar] [CrossRef]
  66. Dabbs, G.R.; Moore-Jansen, P.H. A Method for Estimating Sex Using Metric Analysis of the Scapula. J. Forensic Sci. 2010, 55, 149–152. [Google Scholar] [CrossRef] [PubMed]
  67. Peckmann, T.R.; Scott, S.; Meek, S.; Mahakkanukrauh, P. Sex Estimation from the Scapula in a Contemporary Thai Population: Applications for Forensic Anthropology. Sci. Justice 2017, 57, 270–275. [Google Scholar] [CrossRef]
  68. Vassallo, S.; Davies, C.; Biehler-Gomez, L. Sex Estimation Using Scapular Measurements: Discriminant Function Analysis in a Modern Italian Population. Aust. J. Forensic Sci. 2022, 54, 785–798. [Google Scholar] [CrossRef]
  69. Prescher, A.; Klumpen, T.H. Does the Area of the Glenoid Cavity of the Scapula Show Sexual Dimorphism? J. Anat. 1995, 186, 223. [Google Scholar]
  70. Almeida, M.; Laurent, M.R.; Dubois, V.; Claessens, F.; O’Brien, C.A.; Bouillon, R.; Vanderschueren, D.; Manolagas, S.C. Estrogens and Androgens in Skeletal Physiology and Pathophysiology. Physiol. Rev. 2017, 97, 135–187. [Google Scholar] [CrossRef] [Green Version]
  71. Callewaert, F.; Sinnesael, M.; Gielen, E.; Boonen, S.; Vanderschueren, D. Skeletal Sexual Dimorphism: Relative Contribution of Sex Steroids, GH-IGF1, and Mechanical Loading. J. Endocrinol. 2010, 207, 127–134. [Google Scholar] [CrossRef] [Green Version]
  72. Seeman, E. Clinical Review 137: Sexual Dimorphism in Skeletal Size, Density, and Strength. J. Clin. Endocrinol. Metab. 2001, 86, 4576–4584. [Google Scholar] [CrossRef]
  73. Cutler, G.B. The Role of Estrogen in Bone Growth and Maturation during Childhood and Adolescence. J. Steroid Biochem. Mol. Biol. 1997, 61, 141–144. [Google Scholar] [CrossRef] [PubMed]
  74. Bass, S.; Delmas, P.D.; Pearce, G.; Hendrich, E.; Tabensky, A.; Seeman, E. The Differing Tempo of Growth in Bone Size, Mass, and Density in Girls Is Region-Specific. J. Clin. Investig. 1999, 104, 795–804. [Google Scholar] [CrossRef]
  75. Seeman, E. Pathogenesis of Bone Fragility in Women and Men. Lancet 2002, 359, 1841–1850. [Google Scholar] [CrossRef] [PubMed]
  76. Berns, C.M. The Evolution of Sexual Dimorphism: Understanding Mechanisms of Sexual Shape Differences. In Sexual Dimorphism; Moriyama, H., Ed.; IntechOpen: London, UK, 2013; pp. 1–16. ISBN 978-953-51-1075-0. [Google Scholar]
  77. Lassek, W.D.; Gaulin, S.J.C. Substantial but Misunderstood Human Sexual Dimorphism Results Mainly from Sexual Selection on Males and Natural Selection on Females. Front. Psychol. 2022, 13, 859931. [Google Scholar] [CrossRef] [PubMed]
  78. Hrdlička, A. The Adult Scapula. Additional Observations and Measurements. Am. J. Phys. Anthropol. 1942, 29, 363–415. [Google Scholar] [CrossRef]
  79. Kuhns, J.G. Variations in the Vertebral Border of the Scapula: Their Relation to Muscular Function. Phys. Ther. 1945, 25, 207–210. [Google Scholar] [CrossRef]
  80. Wolffson, D.M. Scapula Shape and Muscle Function, with Special Reference to the Vertebral Border. Am. J. Phys. Anthropol. 1950, 8, 331–341. [Google Scholar] [CrossRef]
  81. Scott, J.H. Muscle Growth and Function in Relation to Skeletal Morphology. Am. J. Phys. Anthropol. 1957, 15, 197–234. [Google Scholar] [CrossRef]
  82. Charisi, D.; Eliopoulos, C.; Vanna, V.; Koilias, C.G.; Manolis, S.K. Sexual Dimorphism of the Arm Bones in a Modern Greek Population. J. Forensic Sci. 2011, 56, 10–18. [Google Scholar] [CrossRef]
  83. Gonzalez, P.N.; Bernal, V.; Perez, S.I. Geometric Morphometric Approach to Sex Estimation of Human Pelvis. Forensic Sci. Int. 2009, 189, 68–74. [Google Scholar] [CrossRef]
  84. Baca, K.; Bridge, B.; Snow, M. Three-Dimensional Geometric Morphometric Sex Determination of the Whole and Modeled Fragmentary Human Pubic Bone. PLoS ONE 2022, 17, e0265754. [Google Scholar] [CrossRef] [PubMed]
  85. Ammer, S.; d’Oliveira Coelho, J.; Cunha, E.M. Outline Shape Analysis on the Trochlear Constriction and Olecranon Fossa of the Humerus: Insights for Sex Estimation and a New Computational Tool. J. Forensic Sci. 2019, 64, 1788–1795. [Google Scholar] [CrossRef] [PubMed]
  86. Garcovich, D.; Albert Gasco, L.; Alvarado Lorenzo, A.; Aiuto, R.; Adobes Martin, M. Sex Estimation through Geometric Morphometric Analysis of the Frontal Bone: An Assessment in Pre-Pubertal and Post-Pubertal Modern Spanish Population. Int. J. Leg. Med. 2022, 136, 319–328. [Google Scholar] [CrossRef] [PubMed]
  87. Kranioti, E.F.; Nathena, D.; Michalodimitrakis, M. Sex Estimation of the Cretan Humerus: A Digital Radiometric Study. Int. J. Leg. Med. 2011, 125, 659–667. [Google Scholar] [CrossRef]
  88. Kranioti, E.F.; Bastir, M.; Sánchez-Meseguer, A.; Rosas, A. A Geometric-Morphometric Study of the Cretan Humerus for Sex Identification. Forensic Sci. Int. 2009, 189, 111.e1–111.e8. [Google Scholar] [CrossRef]
  89. López-Lázaro, S.; Pérez-Fernández, A.; Alemán, I.; Viciano, J. Sex Estimation of the Humerus: A Geometric Morphometric Analysis in an Adult Sample. Leg. Med. 2020, 47, 101773. [Google Scholar] [CrossRef]
  90. Ali, Z.; Cox, C.; Stock, M.K.; Zandee van Rilland, E.E.; Rubio, A.; Fowler, D.R. Estimating Sex Using Metric Analysis of the Scapula by Postmortem Computed Tomography. J. Forensic Sci. 2018, 63, 1346–1349. [Google Scholar] [CrossRef]
  91. Benítez, H.A. Sexual Dimorphism Using Geometric Morphometric Approach. In Sexual Dimorphism; Moriyama, H., Ed.; IntechOpen: London, UK, 2013; pp. 35–50. ISBN 978-953-51-1075-0. [Google Scholar]
Figure 2. Semi-landmarks used in this study recorded on a scapula of a male individual from the CISC, scapula positioned on posterior view.
Forensicsci 02 00056 g002
Figure 3. (a) Transformation grid with the average shape extracted from landmarks of female individuals. (b) Transformation grid with the average shape extracted from landmarks of male individuals.
Forensicsci 02 00056 g003
Figure 4. Graphic representation of shape variation presented by PC1 (A), PC2 (B), PC3 (C), PC4 (D), in red, when compared with a defined outline, in blue. PC1 relates with an enlargement of the scapula except on the area between landmarks 3 and 4. PC2 shows a straightening from the glenoid fossa until it reaches the middle of the lateral border, the opposite can be observed for the medial surface. The length of the scapula is also augmented on both inferior and superior angles. PC3 indicates another straightening for all lateral borders and for the superior half of the medial surface, as the lower half slightly enlarges. The inferior angle shows a slight length change. PC4 demonstrates an enlargement for almost all the medial border and a slight length increase near the inferior angle.
Forensicsci 02 00056 g004
Figure 5. (a) Transformation grid with the average shape from the scapulae of female individuals caught by semi-landmarks. (b) Transformation grid with the average shape from the scapulae of male individuals caught by semi-landmarks.
Forensicsci 02 00056 g005
Figure 6. Graphic representation of shape variation presented by PC1 (A), PC2 (B), PC3 (C), and PC4 (D). PC1 shows a straightening on the superior area of the lateral border and on the lower area of the medial surface. An enlargement can be observed for the inferior and superior areas of the lateral and medial surfaces. PC2 indicates straightening on both medial and lateral borders, but on the superior and inferior surfaces it shows a slight length increase. PC3 implies a straightening on both superior and lateral borders and the inferior side indicates another increase in length. PC4 denotes a length decrease on the superior border but also an increase in the inferior surface. Both lateral and medial surfaces demonstrate an enlargement on the upper half and a straightening on the lower half.
Forensicsci 02 00056 g006
Table 1. Distribution of individuals from both collections (CISC and CEI/21) grouped by sex and age.
Age Group (Years)FemalesMalesTotal Number of IndividualsPercentage
17–2965115.21%
30–3967136.16%
40–49109199.00%
50–59611178.06%
60–6912162813.27%
70–7918193717.54%
80+53338640.76%
Total111100211100%
Table 2. Intra-observer measurement error evaluated with a Procrustes ANOVA for both centroid size and shape of the scapula. In both cases individual variation exceeds measurement error.
Centroid Size
EffectSSMSdfFP (param.)
Individual33.7983572.414168141979.15<0.001
Error 10.0182970.00122015
Shape
EffectSSMSdfFP (param.)
Individual0.1668980.001192140251.16<0.001
Error 10.0007120.000005150
SS—sum of squares; MS—mean squares.
Table 3. Interobserver measurement error evaluated with a Procrustes ANOVA for both centroid size and shape of the scapula. In both cases, the individual variation exceeds measurement error.
Centroid Size
EffectSSMSdfFP (param.)
Individual35.1288952.50920714650.49<0.001
Error 10.0578610.00385715
Shape
EffectSSMSdfFP (param.)
Individual0.1693080.001209140138.41<0.001
Error 10.0013110.000009150
SS—sum of squares; MS—mean squares.
Table 4. Procrustes ANOVA results based on landmark data showing significant differences between males and females in both size and shape.
Centroid Size
EffectSSMSdfFP (param.)
Individual190.960227190.9602271101.02<0.001
Residual395.0625581.890251209
Shape
EffectSSMSdfFP (param.)
Individual0.0307450.003075105.19<0.001
Residual1.2381280.0005922090
SS—sum of squares; MS—mean squares; Individual—sex.
Table 5. Cross-validated accuracy of the discriminant analysis performed with landmarks data for shape.
Jackknife Resampling
MalesFemalesTotalAccuracy
Males673310067.00%
Females377411166.67%
Total10410721166.82%
Table 6. Cross-validated accuracy of the discriminant analysis performed with landmarks data for size and shape.
Jackknife Resampling
MalesFemalesTotalAccuracy
Males782210078.00%
Females209111181.98%
Total9811321180.09
Table 7. Allometric shape variation performed with a linear regression, showing that size yields an inconsequential influence in shape.
Sum of squares
Total SS:1.238128
Predicted SS:0.012018
Residual SS:1.226110
Size-shape influence
% predicted:0.97%
SS—sum of squares.
Table 8. Procrustes ANOVA results for both centroid size and shape of semi-landmarks data, showing significant differences for both parameters.
Centroid Size
EffectSSMSdfFP (param.)
Individual779.947691779.947691195.51<0.001
Residual1633.1091117.889416207
Shape
EffectSSMSdfFP (param.)
Individual0.0253230.000333764.54<0.001
Residual1.1649650.00007315,732
SS—sum of squares; MS—mean squares; Individual—sex.
Table 9. Cross-validated accuracy of the discriminant analysis performed with semi-landmarks data for shape.
Jackknife Resampling
MalesFemalesTotalAccuracy
Males633710063.00%
Females357611168.47%
Total9811321165.88%
Table 10. Cross-validated accuracy of the discriminant analysis performed with semi-landmarks data for size and shape.
Jackknife Resampling
MFTotalAccuracy
M712910071.00%
F367511167.57%
Total10710421169.19%
Table 11. Allometric shape variation performed with a linear regression, showing that size yields an inconsequential influence in shape.
Sum of Squares
Total SS:1.164965
Predicted SS:0.008401
Residual SS:1.156564
Size-shape influence
% predicted:0.72%
SS—sum of squares.
Publisher’s Note: MDPI stays neutral with regard to jurisdictional claims in published maps and institutional affiliations.

