Article

Population-Inclusive Assigned-Sex-at-Birth Estimation from Skull Computed Tomography Scans

by
Samantha R. Kelley
1 and
Sean D. Tallman
2,*
1
Department of Anthropology, Boston University, Boston, MA 02215, USA
2
Department of Anatomy & Neurobiology, Boston University School of Medicine, Boston, MA 02118, USA
*
Author to whom correspondence should be addressed.
Forensic Sci. 2022, 2(2), 321-348; https://doi.org/10.3390/forensicsci2020024
Submission received: 1 March 2022 / Revised: 22 March 2022 / Accepted: 24 March 2022 / Published: 26 March 2022

Abstract

:
Methods for estimating assigned, binary sex at birth from skeletonized remains have primarily been developed for specific population groups in the U.S. (e.g., African American, European American, Hispanic) and, thus, inherently rely on ancestry estimation as a foundational component for constructing the biological profile. However, ongoing discussions in forensic anthropology highlight pressing issues with ancestry estimation practices. Therefore, this research provides population-inclusive assigned-sex estimation models for cases where ancestry is not estimated or is truly unknown. The study sample (n = 431) includes 3D volume-rendered skull computed tomography scans from the novel New Mexico Decedent Image Database of African, Asian, European, Latin, and Native Americans. Five standard nonmetric traits were scored, and eighteen standard measurements were obtained. Binary logistic regressions and discriminant function analyses were employed to produce models and classification accuracies, and intraobserver reliability was assessed. The population-inclusive nonmetric and metric models produced cross-validated classification accuracies of 81.0–87.0% and 86.7–87.0%, respectively, which did not differ significantly from the accuracy of most population-specific models. Moreover, combined nonmetric and metric models increased accuracy to 88.8–91.6%. This study indicates that population-inclusive assigned-sex estimation models can be used instead of population-specific models in cases where ancestry is intentionally not estimated, given current concerns with ancestry estimation.

1. Introduction

1.1. The Role of Ancestry in the Biological Profile and Study Rationale

The prevailing theory that population variation affects levels of skeletal sexual dimorphism [1,2,3] continues to influence researchers in the development of population-specific metric and nonmetric methods of sex estimation using the cranial [1,4,5,6,7,8,9,10,11,12,13,14,15,16,17,18] and postcranial skeleton [1,6,15,19,20,21,22,23,24,25,26,27,28]. Although sexual dimorphism differs between certain populations, this variation does not fall along ancestral (i.e., “racial”) lines; however, the estimation of ancestry (i.e., “population affinity”, “race”, “bioaffinity”) becomes compulsory for human identification, because components of the biological profile—such as sex, age, and stature estimation—often depend on population-specific models [29].
Until relatively recently, the majority of U.S.-based practicing forensic anthropologists operated under the explicit assumption that ancestry is an essential and critical piece of the biological profile; however, the accompanying methods—especially morphoscopic approaches—are problematic and poorly understood [29,30]. In particular, ancestry estimation may unwittingly propagate the long-debunked biological race concept and stymie identification efforts—especially for people of color. Additionally, at present, we do not understand the heritability or ecogeographical causes of many of the nonmetric (i.e., macromorphoscopic) traits frequently used in forensic ancestry estimations [30]. Although some research has quantified population differences with regard to sex estimation (e.g., [2,3,16,31,32,33,34]), there is a lack of research on large-scale patterns of sexual dimorphism, their proximate mechanisms, and their probable causes [2,17]. Given the deficiency in understanding the primary mechanisms behind the manifestation of the traits used in current ancestry estimation, as well as a lack of critical inquiry into their role as tools for reinforcing the debunked biological race concept and white supremacy [29], the role of ancestry estimation has questionable value as an ongoing component of the biological profile [29,30,35,36,37,38,39,40,41,42,43,44,45,46]. Consequently, many forensic anthropologists are removing ancestry estimation from their analyses.
The present study seeks to engage with the ongoing conversation regarding the role of ancestry in the biological profile by proposing a method of assigned-sex estimation from computed tomography (CT) scans that does not rely on an estimation of population affinity. A population-inclusive model is applicable in cases where population affinity is unknown or intentionally not estimated in order to mitigate the potential for racial biases such as the “missing white woman syndrome” [42,44], and in light of the debate surrounding the removal of certain ancestry estimation methods from the construction of the biological profile. While limited postcranial research indicates that highly accurate population-inclusive sex estimation and other identification methods can be developed [36,38,47], population-specific methods continue to be used in most cases, even if the appropriate population-specific method does not exist [2]. Thus, the aims of this study are twofold: (1) to provide population-inclusive models for assigned sex estimation when population affinity is not estimated or is unknown; and (2) to demonstrate the utility of CT scans in metric and nonmetric assigned-sex estimation. Through analyzing the sexual dimorphism of a demographically diverse sample, we hypothesize that population-inclusive models for estimating assigned sex will produce classification accuracies that are not statistically different and, ultimately, perform better than population-specific models.

1.2. The Study Collection: New Mexico Decedent Image Database

The study sample was derived from the New Mexico Decedent Image Database (NMDID) [48], which was created through a 2010 initiative by the National Institute of Justice (NIJ) that awarded the New Mexico Office of the Medical Investigator (OMI) a research grant to explore the value of CT scans and their potential in supplanting traditional autopsies [49,50]. The OMI is a centralized medical examiner’s office that serves the state of New Mexico, and from mid-2010 to mid-2017 any decedent who was routed to the OMI and underwent subsequent autopsy also received a high-resolution, full-body CT scan. This included any individual who died in a sudden, untimely, or unexpected manner, as well as any person found dead for whom the cause of death was unknown.
The database contains CT scans on approximately 15,242 decedents with full-body scout images equivalent to whole-body radiographs, and potentially as many as 69 metadata fields. Each decedent is associated with two sets of CT scans, augmented for both soft tissue and bone analysis, comprising 4000 axial image slices, with a 512 × 512 matrix and a slice thickness of 1 mm, with a 0.5 mm overlap [51]. In 2016, the NIJ awarded a grant specifically to develop the CT database with the corresponding metadata [51]. As such, the NMDID serves as a unique documented virtual skeletal and soft tissue “collection”.
Of the NMDID sample, 4475 are female, 10,750 are male, and 17 are unknown. More than two-thirds of the CT scans have no discernable decomposition [51]. There are also metadata fields for race, tribe, and ethnicity, and these fields can be further divided depending on paternal and maternal attribution (ancestry). The metadata field for race includes 17 identification options, the field for ethnicity includes 4, and there are 24 tribal affiliation options. These metadata categories are either self-identified or determined by next of kin (NOK). Thus, the NMDID captures an impressive range of very modern, “real-world” human biological variation that traditional U.S.-based skeletal collections—primarily composed of African-American (i.e., Black) and European-American (i.e., white) individuals [45,52]—cannot approximate.

1.3. Assigned Skeletal Sex Estimation

Assigned sex or “sex at birth” refers to an individual’s assigned classification at birth by medical professionals—usually female or male—which is largely based on the visual assessment and interpretation of external anatomy, and specifically determined and influenced by a combination of characteristics, including chromosomes, hormones, internal and external reproductive organs, and secondary sex characteristics [53]. Estimating the assigned sex of modern skeletonized remains is possible because the skeleton, as a secondary sex characteristic, is dimorphic, and is aligned with and reflective of the primary sex characteristics (i.e., soft tissue) used in assigning sex at birth. We contend that, similar to medical professionals, forensic anthropologists bioculturally interpret skeletal morphometrics (i.e., shape and size) to assign skeletal sex and predict assigned sex. To more accurately reflect this process, we use “assigned female at birth (AFAB)” and “assigned male at birth (AMAB)” over the traditionally used “female” and “male.” Such inclusive terminology (i.e., AFAB/AMAB) importantly reflects that sex is mutable, that there may be a discordance between assigned and self-identified sex, and that, ultimately, we do not know how decedents self-identified. However, sex is not binary, and numerous chromosomal combinations exist beyond the female/male typology, resulting in an estimated 2% of individuals being intersex [54]. While not the subject of the present study, the term “intersex” is used to describe persons with innate sex characteristics that emerge during embryological development and fall outside conventional conceptions of AFAB or AMAB bodies [53].
The onset of skeletal sexually dimorphic trait expressions occurs during adolescence and coincides with increased levels of circulating sex steroids such as androgens and estrogens [55,56]. The steroids that drive sexual maturation play an essential role in skeletal growth and development [55,57,58,59,60]. Factors including thermoregulation, biomechanical processes involved in obstetrics, sexual selection, mating preferences, and allometric considerations result in an increase in bone growth [61,62,63,64], but the size, shape, robustness, and gracility of the skull in particular are influenced by hormone-controlled allometric differences that promote sex-specific patterns of growth and development [1,63,64].
Assigned skeletal sex estimation is an integral component in the development of the biological profile [1,2,14,15,65,66,67], as it can winnow the list of missing persons, and often serves as an important variable for methods used to estimate age and stature [1,2]. The pelvis is generally accepted as the best indicator of assigned sex at birth, due to the reproductive differences between AFABs and AMABs [6,11,20,22,27,66], followed by the long bones [15,21,23,24,26,68]. In cases where the pelvis or long bones are not available, the skull (cranium and mandible) is recognized as the next best indicator of assigned sex [11,67,69]. Generally, AMAB skulls tend to be more robust, larger in size, and have heavier muscle attachments when compared to AFAB skulls, but the extent to which discrete sexually dimorphic cranial traits vary across populations is still the subject of many studies [2,3,31,32,33,34,70]. While sex is not binary, forensic anthropological methods to estimate an individual’s assigned sex at birth have been built on simplistic models that position “female” and “male” on a spectrum of “gracile” to “robust” [71]. Moreover, these sex estimation models are overwhelmingly developed for specific “populations” or continental/racialized groups, and rely on the estimation of population affinity or, more commonly, ancestry. Therefore, this research advocates for a move away from ancestrally/continentally/racially-based methods, and proposes population-inclusive assigned-sex estimation models.

1.4. Methods for Estimating Assigned Sex

The sex of unidentified skeletal remains can be estimated in a variety of ways, including visual and metric, as well as with the application of statistical software such as Fordisc that customizes metrically based discriminant functions [1,3,4,6,14,15,72]. The visual and metric methods are usually complementary, and tend to result in similar levels of accuracy [4,11,23].
The visual assessment of morphology, which typically ranges from gracile to robust, is most easily employed when estimating sex [2,6,63]. Early methods of sex assessment were based on gestalt analyses and female/male-associated ordinal scores, which were compiled for a decision table or majority-rule approach [73,74,75,76,77,78,79] without the use of statistical probabilities that current visual methods and Fordisc employ [17,27,66,72,80]. Worldwide studies show that the glabella, supraorbital margin, mastoid process, nuchal crest, and mental eminence are variably sexually dimorphic [2,4,6,12,16,17,70]; however, overlap between trait expression—scored from 1 (gracile) to 5 (robust)—occurs due to ambiguous expression, age effects, population variation, reduced sexual dimorphism, biomechanical differences, secular change, and idiosyncratic variation [1]. Furthermore, because there will always be AFABs and AMABs who fall variably on the gradient of human variation and sexual dimorphism, the goal of the ordinal scale is to provide a simple and less subjective method of scoring that relies on assessments of the robustness/gracility or size/shape of a specific trait without any presumption of sex or femininity/masculinity [1].
Metric methods have likewise undergone a transformation since their advent [20,28,81], into modern studies that employ statistical probabilities that were developed on expanded reference groups [7,15,72]. Metric techniques typically involve the univariate or multivariate analysis of skeletal measurements, as well as multivariate shape analyses [12]. While Fordisc [72] is regularly used for metric sex estimation, its discriminant functions classify individuals along eight problematic and conflated ancestral and/or racial lines (i.e., American Black, American Indian, American white, Chinese, Guatemalan, Hispanic, Japanese, and Vietnamese), and are therefore inherently population-specific. Moreover, several population groups in Fordisc lack females (i.e., Chinese, Guatemalan, and Vietnamese), and sample sizes for all groups aside from the Black, Hispanic, and white samples are low—especially for females [72].
Regardless of the type of analysis employed, many of the current methods used in U.S.-based forensic anthropological casework and research are centered on groups of African-American and European-American individuals, many of whom come from the Hamann–Todd, Terry, and Bass skeletal collections [15,52]. These methods often perform poorly when applied to genetically, temporally, or biogeographically unrelated groups [2,21,52,82]. Additionally, the Forensic Anthropology Data Bank (FDB) has a dearth of data on positively identified Hispanic individuals—and other underrepresented groups—meaning that many population-specific sex estimation discriminant function models are fundamentally fraught with problems [52]. Moreover, U.S.-based skeletal collections and databases used to develop methods largely lack demographic diversity [83], thereby necessitating the use of more representative alternatives, such as large-scale CT databases—such as the NMDID used in the present study—for advancing forensic-related research.

2. Materials and Methods
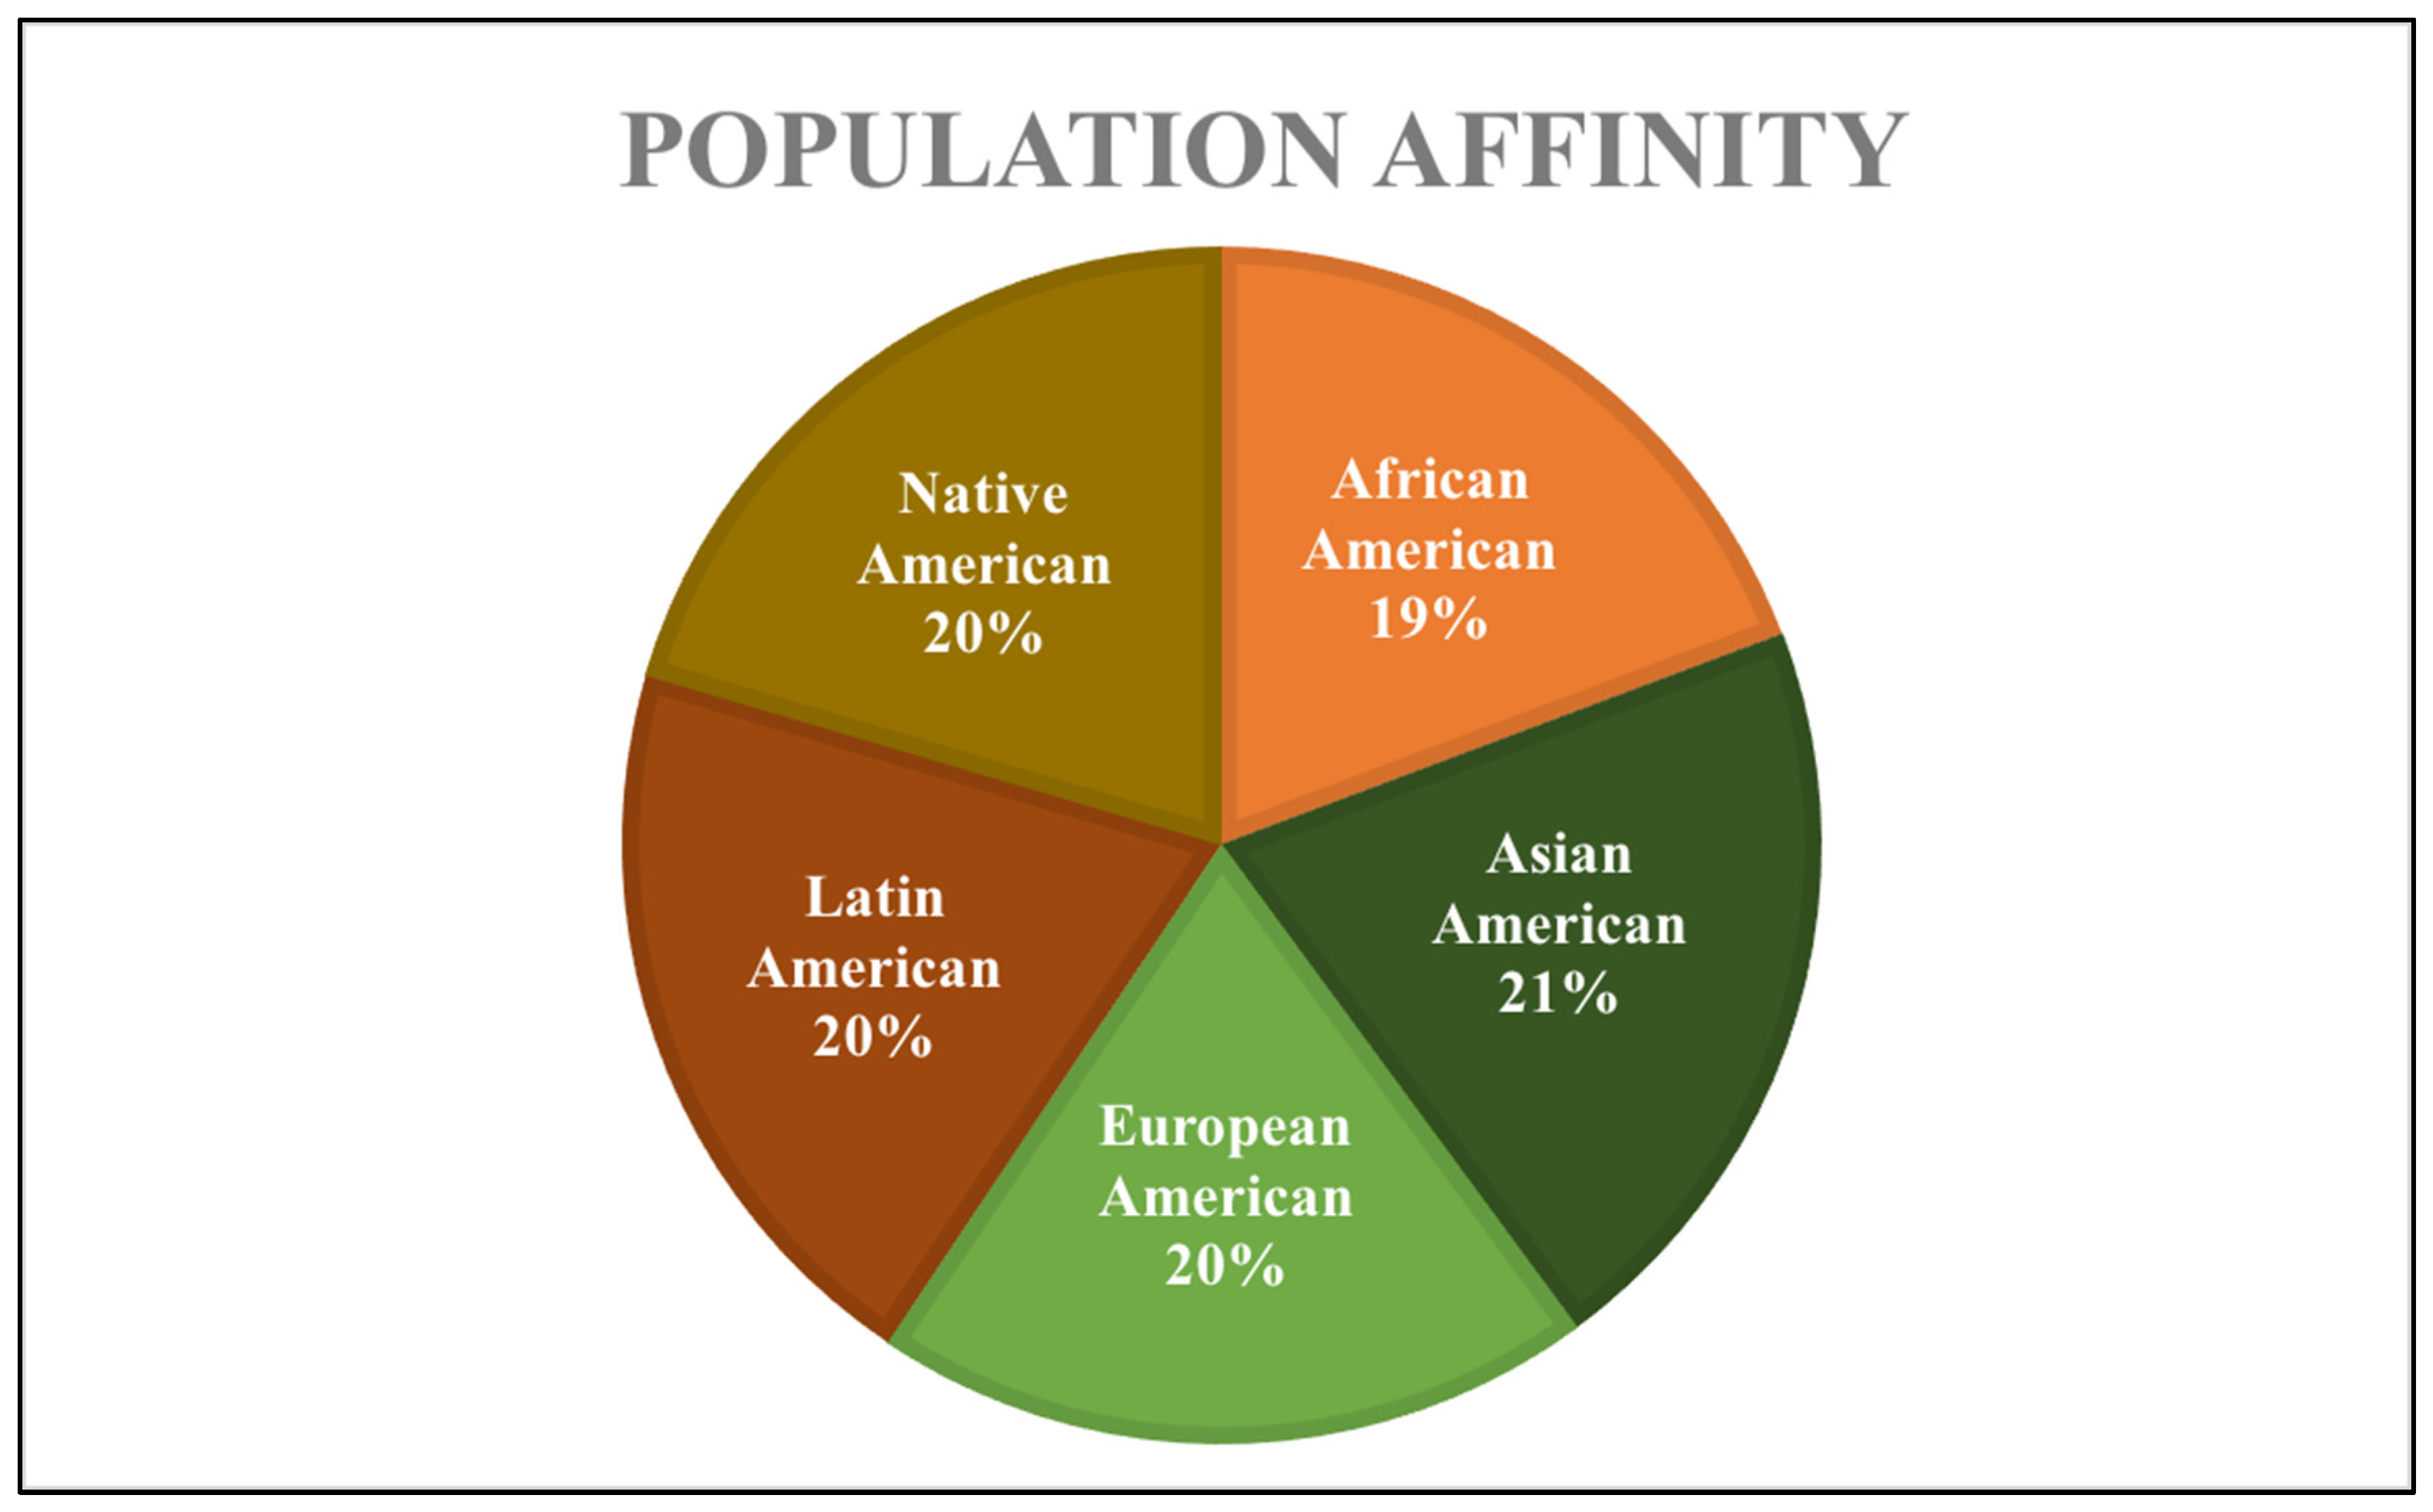
2.1. Study Sample

The study sample comprised 431 individual 3D volume-rendered (VR) CT images of the skull—originally 494, and later reduced due to downloading errors and incompatible volume rendering that affected approximately 13% of the original sample. The use of CT scans has been shown to be an acceptable alternative method of data collection to traditional analysis of dry bone [84,85,86,87,88,89]. Such technology has allowed researchers to attempt identification methods with CT scans of skeletons without the removal of soft tissue [89], and provides researchers with examination capabilities beyond in-person observation [84].
Decedents were selected based on sex, age, and population affinity, and scout images were used to briefly assess the condition of the remains. Population affinity for the sample was based on the self-identified or NOK-identified “race”, “ancestry”, and/or “ethnicity” recorded in the NMDID. The exclusion criteria included (1) causes of death that would impede data collection from the skull (e.g., blunt force trauma and gunshot wounds to the head and neck; thermal injuries), (2) ages not contained within the range of 18–90 years; and (3) individuals who did not identify with the female or male sex assignment at birth. These exclusion criteria were applied when possible, but were limited by the set study cohorts as well as the overall diversity of the NMDID, which is disproportionately composed of white AMABs. The criteria for inclusion encompassed AFAB and AMAB individuals between 18 and 90 years from one of the five predetermined population affinities, resulting in 189 AFABs and 242 AMABs. Four age cohorts were established to ensure a similar distribution across both sex categories as well as across population affinities. The age cohorts were 18–30 years (n = 109), 31–50 years (n = 114), 51–70 years (n = 168), and 71–90 years (n = 40) (Table 1).
The five groups used in this research were constructed from broad social race categories of the U.S. census as a rough proxy for population affinity, as well as the “Physical Characteristics” subcategories of “race” and “ethnicity” of the NMDID, which are relatively equally distributed across all five groups (Figure 1). The analyzed groups in no way capture the entire range of human skeletal variation, but represent the five major bureaucratic demographics listed on U.S. government data collection forms. The final groups created for this study include African American (original NMDID variable: Black or African American (race); AFAB = 43, AMAB = 40), Asian American (original NMDID variable: Chinese, Filipino, Japanese, Korean, Vietnamese, and other Asian (race); AFAB = 20, AMAB = 69), European American (original NMDID variable: white (race); AFAB = 41, AMAB = 43), Latin American (original NMDID variable: Hispanic or Latino (ethnicity); AFAB = 43, AMAB = 44), and Native American (original NMDID variable (race): not broken down by tribe, AFAB = 42, AMAB = 46). The Asian-American group was constructed from the separate NMDID “race” categories of Chinese, Filipino, Japanese, Korean, Vietnamese, and “other Asian” because these groups individually did not have a large enough representation within the database compared to the other population affinities. When selecting individuals for all population groups excluding Latin American, ethnicity was additionally selected to be “Not Hispanic, Latino, or Middle Eastern” to ensure no cross-listing between the categories. When the Latin-American group was constructed, the Hispanic and Latino ethnicity was selected.

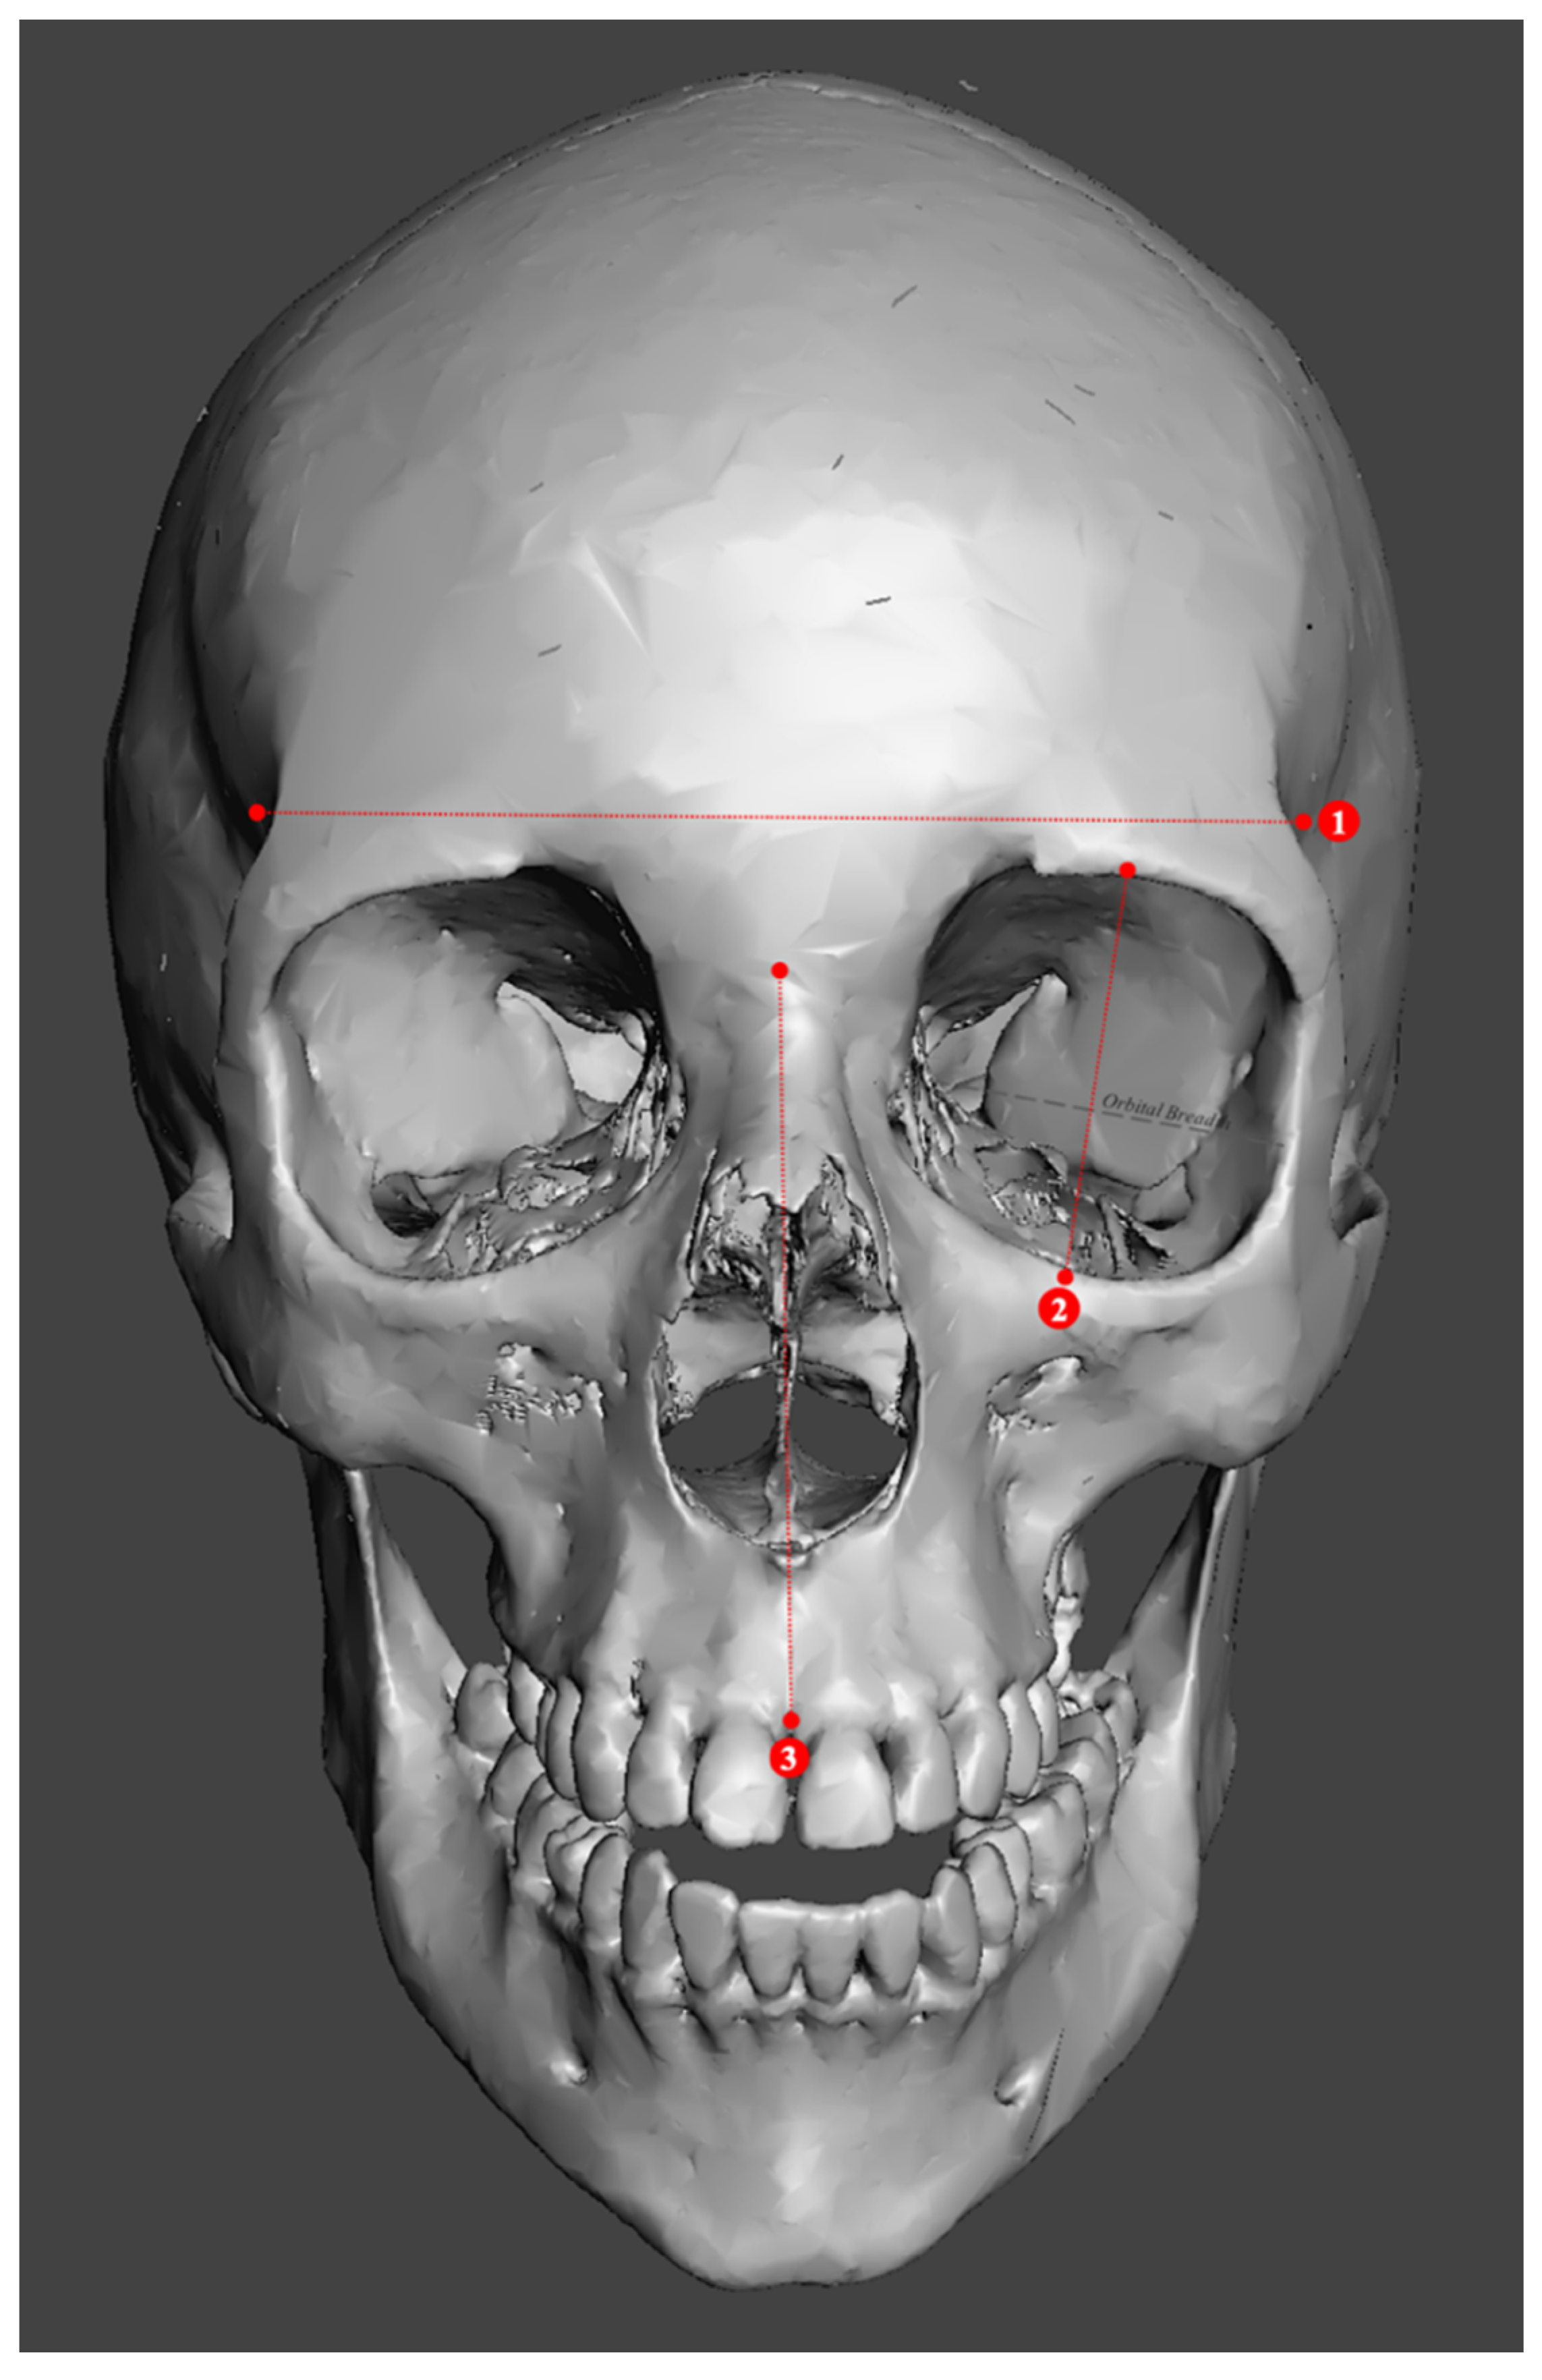
2.2. Study Sample Preparation and Data Collection

The preparation of the samples consisted of a multistep process. The CT image files for each individual were downloaded and visualized using the 64-bit version of OsiriX MD imaging software (v.11.0.4) on an iMac™ computer. Using this software, 3D images of the osseous structures were rendered using the 3D-VR function, with a focus on bone. This image was then converted to a Meshmix file using Meshmixer™ (https://www.meshmixer.com, accessed on 16 September 2021), a free online software for creating and manipulating 3D files, in order to process the original image. The editing process consisted of removing life-saving equipment (e.g., defibrillator pads, tubes, wiring, clamps) as well as personal artifacts (e.g., eyeglasses, jewelry, hairpins, buttons) and other artifacts. The aim of this editing process was to create a sample of 3D-VR images that consisted solely of an isolated skull, as well as to maximize accessibility to the features that were scored and surfaces where points were placed for measurement (e.g., removal of the first cervical vertebrae for access to the foramen magnum as well as the basion), and to remove any potential for biases (e.g., removal of jewelry, hairpins) (Figure 2).
Nonmetric traits were scored according to the diagrams and descriptions in the works of Buikstra and Ubelaker [6] and Walker [17], and included the supraorbital ridge/glabella, supraorbital margin, mastoid process, nuchal crest, and mental eminence. The 3D-VR CT skulls were visually examined from the same angle each time (Figure 3), and the traits were each assigned an ordinal score on a scale from 1 to 5 (i.e., gracile to robust). Traits were scored only if they were complete or mostly complete, and if the surrounding structures were sufficiently intact to provide relative comparison. The mental eminence was not scored if there was significant alveolar resorption.
Metric measurements of the skull incorporated 18 standard points of measurement of the cranium and the mandible (Table 2 and Figure 4, Figure 5, Figure 6, Figure 7 and Figure 8), as described by Spradley and Jantz [15]. Using the Meshmixer ™ software, metric measurements were collected using a 3D measuring tool (“Units/Dimensions” function), where the points were placed on the appropriate cranial landmarks [6] and the real length in millimeters (mm) was recorded and rounded to the nearest thousandth. For maximum and minimum measurements, the points were dragged to capture the highest or lowest number produced.

2.3. Statistical Analyses

All statistical analyses were run with IBM SPSS (version 27). Binary logistic regression (BLR) and discriminant function analysis (DFA) were employed in order to develop population-specific and population-inclusive models. Population-specific models were produced to provide classification accuracies for comparison to the population-inclusive models, so as to assess whether there was a reduction in resolution with an increase in inclusivity. Two-way cross-tabulation tables were created in SPSS using Fisher’s exact test based on the chi-squared statistic, in order to evaluate whether significant differences existed between the population-inclusive and population-specific models.
BLR was used to analyze the nonmetric traits, because BLR analysis does not require normal distributions, avoids assumptions of linearity, and is well suited to ordinal scoring methods [17,90,91]. The forward Wald stepwise selection method was employed so that variables would be removed or tested based on significance. The sectioning point was set at 0.5, so individuals with probabilities less than 0.5 were estimated to be AFAB, while those with probabilities greater than 0.5 were estimated to be AMAB. There was one population-inclusive regression equation that was cross-validated by generating a hold-out sample (HOS), where 30% of the study sample was removed from the BLR and a population-inclusive BLR equation was produced on the remaining 70%. In addition to the population-inclusive BLR equations, five population-specific BLR equations and accompanying accuracies were produced for each population affinity group. These SPSS models were then tested on the study sample to generate applied accuracies.
A BLR was additionally run that combined both the metric and nonmetric data to produce a mixed model. BLR was chosen in this instance because it avoided the problem of assuming linearity [90]. This BLR produced a population-inclusive regression equation with statistically significant coefficient variables. This equation was cross-validated on a 30% HOS. BLR was run for each of the five population affinity groups, but results were not reported due to a lack of statistical significance for the coefficient variables.
The metric data were statistically analyzed using DFA in SPSS as described by Spradley and Jantz [15], and because of the linear relationship between cranial dimensions and measurements [90] (p. 599). The Mahalanobis distance stepwise method was used to control for outlying variables. The sectioning points were obtained by adding the female and male means and dividing by two. Values that fell above the sectioning point were considered AMAB, and values that fell below the sectioning point were considered AFAB. The DFA was cross-validated using the leave-one-out cross-validation (LOOCV) method. The measurements for nasion–prosthion height, parietal chord, and occipital chord were excluded from the DFA due to small sample sizes. There was one population-inclusive DFA equation developed with SPSS. This SPSS model was then tested on the study sample, and new applied model accuracies were produced. In addition to the population-inclusive DFA equation, five population-specific DFA equations were produced for each population affinity group. The SPSS models were then tested on the study sample in the same manner as with the population-inclusive DFA model.
Intrarater reliability was calculated for a random selection of 52 individuals—approximately 12% of the total study sample—who were scored and measured on a second occasion by the first author. Cohen’s kappa analysis [92,93] was employed to assess the degree of agreement or disagreement in both observations for the nonmetric traits of the cranium and mandible. The kappa value evaluates the “proportion of agreement between observers corrected for chance and the standard measure of (intraobserver) reliability with nominal data (e.g., male vs. female)” [18] (p. 135). Kappa values are on a scale between 0 to 1, with 0 representing a level of agreement that would be expected if ordinal scores were assigned at random (i.e., low agreement), and 1.0 representing perfect agreement [27]. The significance of the Kappa values was determined following Landis and Koch [94], with a Kappa statistic of less than 0.00 indicating poor agreement, 0.00–0.20 as slight agreement, 0.21–0.40 as fair agreement, 0.41–0.60 as moderate agreement, 0.61–0.80 as substantial agreement, and 0.81–1.00 as almost perfect agreement.
The intraclass correlation coefficient (ICC) was calculated for the metric measurements in order to assess their reliability and the relationships between variables. ICC measures the relationship between variables in the same class that measure the same thing [90] (p. 678)—in this case, variables that estimate sex.

3. Results

Overall, the hypothesis was supported by the results of the present study, which showed that nearly all of the population-inclusive models performed statistically similarly to the population-specific models and, in fact, performed statistically better than some of the population-specific models. The results of this research indicate that a population-inclusive model can be applied in place of population-specific methods without hindering the estimation of assigned sex, as it resulted in both statistically similar and generally statistically better classification accuracy.

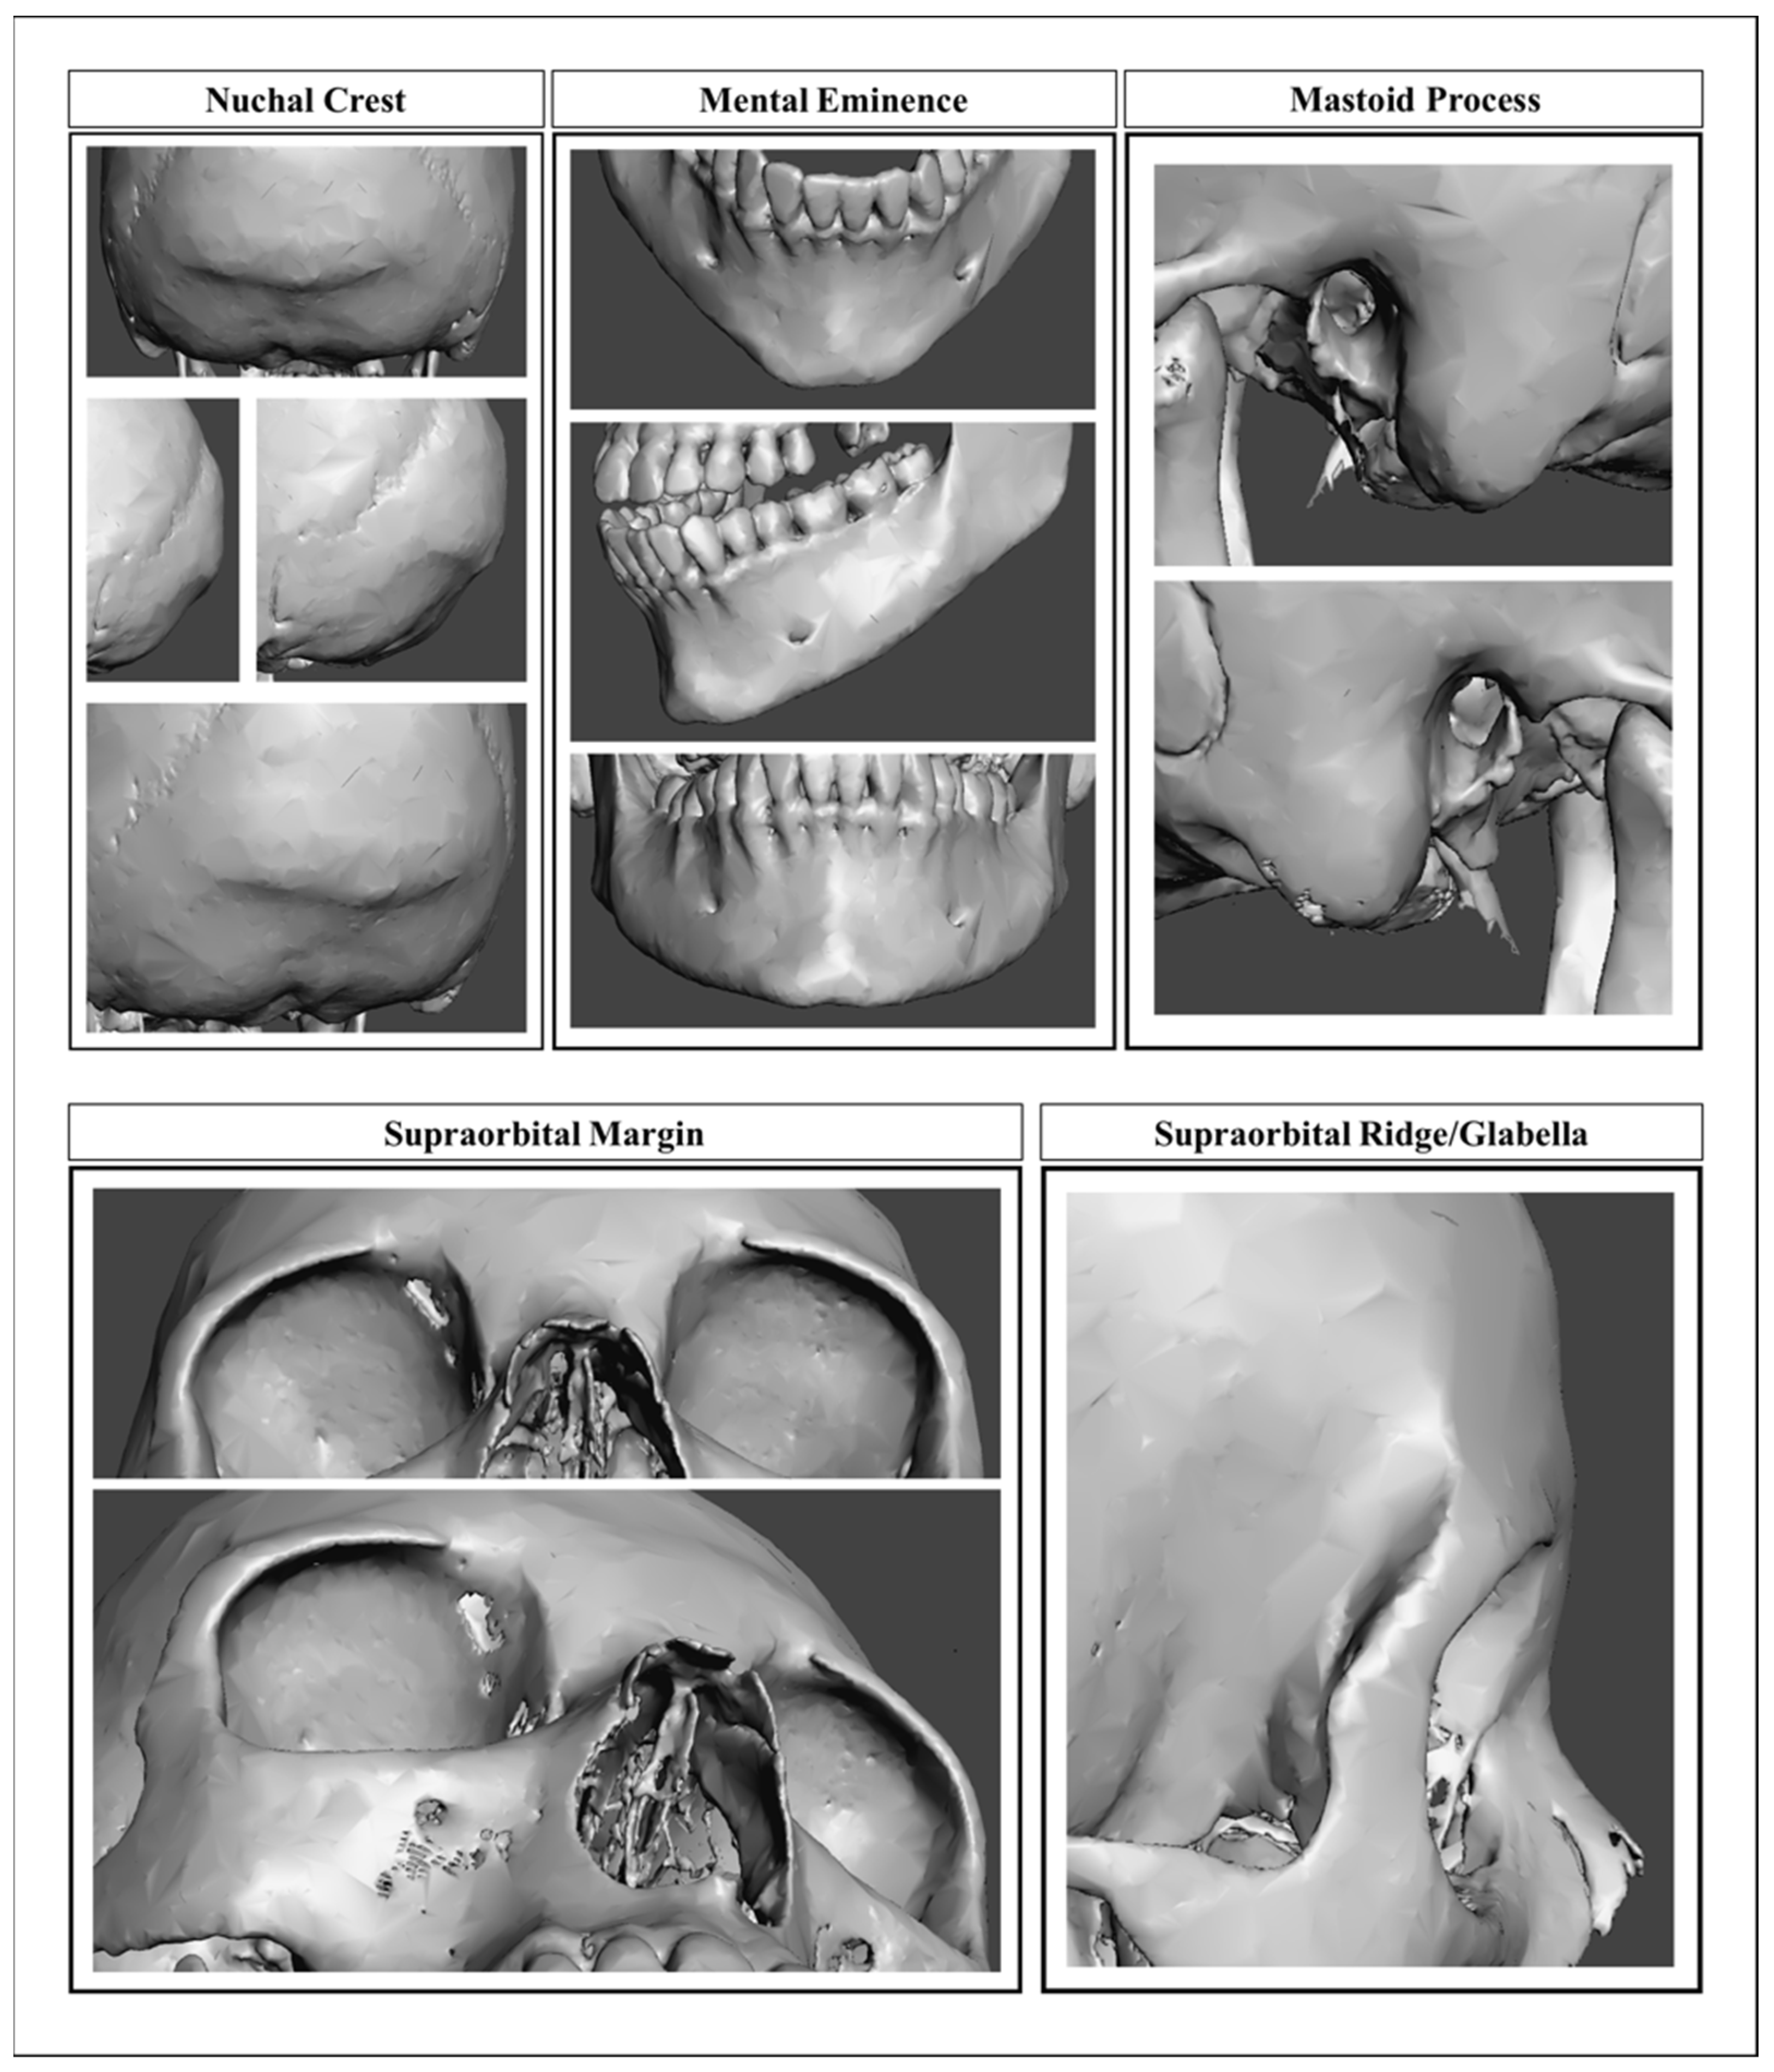
3.1. Nonmetric Models

A BLR analysis was run with SPSS to produce population-inclusive and population-specific classification accuracies, including an HOS to cross-validate the population-inclusive models. The stepwise-selected classification functions and cross-validated SPSS accuracies are presented in Table 3. The population-inclusive overall SPSS accuracy was 87.0%, and the population-specific overall accuracies ranged from 82.0% to 91.0%. The model was then applied to the study’s sample groups, producing applied accuracies ranging from 78.8% to 91.7% (Table 4).
Using Pearson’s chi-squared statistic with a p-value of 0.05, the statistical significance of both the SPSS and applied classification accuracies were tested against the population-inclusive SPSS and applied classification accuracies. All SPSS classification accuracies had p-values greater than 0.05, and were not significantly different than the population-inclusive models for the SPSS classification accuracies. The African-American, European-American, Latin-American, and Native-American applied accuracies were not significantly different from the population-inclusive applied accuracy (81.0%); however, the Asian-American overall applied accuracy (91.7%) was significantly different.

3.2. Metric Models

DFA was run with SPSS to produce one population-inclusive and five separate population-specific models (Table 5). The population-inclusive and population-specific LOOCV SPSS classification accuracies for this model are presented in Table 5. The population-inclusive model had a total classification accuracy of 86.7% (AFABs: 88.0%; AMABs: 85.7%). The population-specific models produced SPSS overall classification accuracies that ranged from 77.1% to 88.2%. The DFA equations were then applied to the study sample’s groups, producing applied classification accuracies (Table 6). The population-inclusive model produced an overall applied accuracy of 87.0% (AFABs: 90.4%; AMABs: 84.3%). The population-specific models produced an overall applied accuracies that ranged from 78.0% to 95.0%.
Using Pearson’s chi-squared statistics, the differences between the population-specific and population-inclusive SPSS and applied classification accuracies were evaluated. The African-American, Asian-American, European-American, and Native-American SPSS and applied accuracies were not significantly different than the population-inclusive model classification accuracy; however, the Latin-American SPSS (77.1%) and applied (78.0%) classification accuracies were significantly different from the population-inclusive SPSS (86.7%) and applied (87.0%) models.

3.3. Mixed Model

A BLR was run with SPSS that combined the metric and nonmetric data to produce a population-inclusive mixed model (Table 7), and a BLR built on 70% was run on the 30% HOS to cross-validate the population-inclusive model. The coefficients and constants for the mixed models are presented in Table 7. The population-inclusive mixed model had a total classification rate of 91.6% (AFABs: 88.8%; AMABs: 93.3%) (Table 7) and an overall applied accuracy of 88.8% (AFABs: 88.1%; AMABs: 89.3%) (Table 8). The population-specific coefficients in each population group all consistently produced p-values greater than 0.05, and were therefore not statistically significant. Overall, the mixed model produced better classification accuracy relative to the individual metric and nonmetric trait models.

3.4. Intrarater Reliability

A random sample of approximately 12% (n = 52) of the study sample was revisited for nonmetric and metric data collection to assess intraobserver agreement. Intraobserver error for nonmetric scoring was assessed using Cohen’s kappa statistic [93] in order to evaluate the magnitude of potential error and level of consistency, and agreement was established as described by Landis and Koch [94]. All kappa values were between 0.365 and 0.563, and all traits were statistically significant. The nuchal crest performed with a fair level of agreement, while the mastoid process, supraorbital margin, glabella, and mental eminence performed with a moderate level of agreement (Table 9). All metric measurements except one had ICC values above 0.8 and were statistically significant, indicating high intrarater reliability (Table 10). The ICC ranged from 0.777 to 0.989, with the glabella occipital length performing the best and the parietal chord performing the worst. All class means were statistically significant, with p-values below 0.001.

4. Discussion

The results of this study indicate that population-inclusive nonmetric and metric methods can be employed to accurately estimate assigned sex without producing significantly different or, more importantly, statistically lower classification rates. In particular, population-inclusive methods resulted in classification accuracies of 81.0% to 87.0% for nonmetric and 86.7% to 87.0% for metric models. Moreover, population-inclusive mixed models outperformed the nonmetric and metric models alone, producing overall classification accuracies of 88.8% to 91.6%. Population-inclusive methods of estimating sex based on the skull have the potential to supplement currently used ancestry-dependent models of sex estimation [14,17] that generally employ data from either African-American or European-American groups [52]. Furthermore, estimation of assigned sex from 3D-VR CT images of the skull can augment forensic analyses and studies of human skeletal variation—especially in cases where soft tissue cannot be removed, and where access to skeletal collections is limited. Following the findings that CT scans are highly representative of dry bones [84,85,86,87,88,89], the 3D-VR CT scan-derived models presented here can be applied and validated on both additional CT scans and skeletonized remains. Additionally, future data collection and testing should focus on heterogeneous samples, with particular attention paid to Asian-American and Latin-American groups who, as documented here, exhibit considerable cranial variation.
Emphasis has recently focused on the need for forensic anthropological researchers to suspend their dependence on antiquated methods of ancestry estimation that are rooted in typology, and instead focus on understanding the evolutionary mechanisms behind biogeographic differences and the effects that secular change, intersectionality, and biocultural processes have on creating variation across diverse populations [29,30,37,39,40]. Current ancestry estimation practices utilized in forensic anthropology are based on assumptions about population differences that are inconsistent with observable patterns of biological variation in myriad human groups [37,40]. Concurrently, critical race theory, broadly—and critical race empiricism, specifically—are helping the field to question the groups that we operationalize in research—along with the negative and essentializing effects of those groupings—and to analyze how racial/ancestral categories undergird, guide, and inform our research, methods, assumptions, and perceptions of human biological variation [95,96,97]. Such criticality has highlighted how our research reifies biological race, reinforces colonialist power structures, is coopted for racial and nationalistic agendas, and maintains white supremacy [30,35,46,98]. While there is considerable work to be done to fully understand the hold that structural racism has on forensic anthropology, it is essential that we divorce ourselves from approaches that unwittingly validate biological race categories.
A population-inclusive method of sex estimation will be an important tool for combatting outdated ancestry-based estimation methods. Research indicates that some level of population variation exists across skeletal morphology, and has the potential to affect the expression of sexually dimorphic traits [1,15,16,17,22], but the majority of the methods available to researchers are exclusionary in nature, having been developed on African-American and European-American populations [1,2]. Until the mechanisms behind population variation in skeletal morphology are better understood beyond ancestral/racial lines, population-inclusive models for estimating sex, age, and stature should be developed, validated, and made part of standard practices.

4.1. Nonmetric Models

The population-inclusive BLR model, which included the glabella, mastoid process, and mental eminence, incorporated more nonmetric traits than the population-specific models (three instead of two). This was likely due to the variation in sample size, which is often one of the greatest limitations in stepwise procedures [90], as the population-inclusive model was developed on 389 individuals and the population-specific models were all developed on group sizes between 73 and 81 individuals.
Each nonmetric BLR model—both population-inclusive and population-specific—included the glabella; however, the African-American, Asian-American, and Native-American models also included the mastoid process. Research indicates that the glabella and mastoid process are the best discriminators of binary sex, due to their highly sexually dimorphic nature [2,17]. Tallman [2] likewise found that the glabella and mastoid process are the best at estimating sex in East and Southeast Asian groups. Garvin et al. [8] similarly found that when estimating sex in Arikara Native American, Nubian, U.S. Black, and U.S. white groups, the mastoid process and glabella performed the best.
Interestingly, both the population-inclusive and the European-American models incorporated the mental eminence. Despite previous research demonstrating that a difficulty exists with scoring the mental eminence [8,12,99], this trait performed with moderate intraobserver agreement and with statistically significant class means for the population-inclusive BLR model, as well as for the population-specific European-American model. The Latin-American model was the only population-specific model that incorporated the nuchal crest into the regression equation; however, the nuchal crest performed with only a fair level of intraobserver agreement.
Overall, the population-inclusive BLR models did not produce significantly lower classification accuracy rates than the population-specific models. The Asian-American model produced the highest classification accuracy compared to the other population-specific models. The SPSS classification accuracy saw a 4% increase relative to the population-inclusive model, but this was not significantly higher; however, the applied classification accuracy was significantly higher by 10.7%. This increase in accuracy is potentially skewed due to the disproportionately small AFAB sample sizes. Research indicates that sexual dimorphism in some East and Southeast Asian groups is reduced compared to U.S. groups [2,21,82], so the Asian-American population-specific models should theoretically demonstrate lower accuracies and higher sex biases [2]. Instead, the Asian-American BLR model produced a higher classification accuracy for AMABs, suggesting that the statistical significance is likely related to sample size [90]. Alternatively, the Asian-American individuals likely had access to relatively high caloric food common to the U.S.A. Groups with high levels of overnutrition (e.g., Americans) tend to exhibit more sexual dimorphism overall, regardless of continental ancestry [2], whereas populations that are nutrient-limited or -deficient exhibit slower maturation rates and reduced sexual dimorphism [100,101].
The Latin-American model exhibited the lowest overall applied classification accuracy; however, this was not significantly lower than that of the population-inclusive model. This is potentially due to higher variability in skull morphology for Latin-American-derived skulls—and especially AMABs. Klales and Cole [102] found that Latin-American male skulls were more variable than corresponding females in score frequency for all traits except the mental eminence. Males received variable scores for the nuchal crest in particular, with the majority being given a score of 2 (on a scale of 1 to 5) [102]. The majority of males were also given scores of 2 for the glabella [102]. The African-American model produced reduced SPSS and applied classification accuracies compared to the population-inclusive model, while the European-American model produced reduced SPSS and increased applied classification accuracy; however, no classification accuracy was significantly different from the population-inclusive model. The Native-American model produced increased SPSS and applied classification accuracies, but neither were significantly different. Walker’s study [17] found that the population-specific BLR equations for African-American and European-American individuals correctly classified individuals 84% to 88% of the time. Similarly, Garvin et al. [8] found that population-specific BLR equations for Arikara Native American, medieval Nubian, U.S. Black, and U.S. white individuals were correctly classified 74% to 99% of the time, which is consistent with the results of the present study.
The applied accuracies for both the population-inclusive and population-specific nonmetric models all show higher applied classification rates for AFABs than AMABs, except for the Asian-American model. Overall, this pattern with lower applied male accuracy indicates that the BLR models are biased toward AFABs. Other research has found a similar female sex bias—especially in more modern samples—due either to population variation or secular change [16,102].

4.2. Metric Models

The population-inclusive model incorporated the most variables in the final DFA, which was attributed to the overall sample size [90]. No DFA model used the same combination of variables, but glabella occipital length, bizygomatic breadth, biauricular breadth, mandibular length, maximum ramus height, orbital height, minimum frontal breadth, bigonial breadth, and mastoid height were included in more than one equation. Richard et al. [87] found that glabella occipital length, bizygomatic breadth, and biauricular breadth, in particular, were reliable landmarks for discriminating sex in a sample of skulls from the Bass skeletal collection.
The population-inclusive DFA model did not produce significantly lower classification accuracy rates than any of the population-specific models. Furthermore, the applied classification accuracies for the population-inclusive and population-specific metric models were higher than those of their SPSS counterparts, which was likely due to an increase in sample size [90].
The DFA model with the highest classification accuracy was the population-specific African-American model, but this was not significantly higher than the population-inclusive model. The Asian-American model had the highest AFAB classification accuracy, which was potentially due to sample size [90]. The Latin-American model had the overall lowest SPSS and applied classification accuracies compared to the other population-specific models, and had a significantly lower classification accuracy than the population-inclusive model. Specifically, the Latin-American AMABs had the lowest SPSS and applied classification accuracies. Research indicates that this could be due to a high level of skeletal variation in male skulls specifically [102]. A metric study on the estimation of sex from the FDB using Hispanic skeletons by Spradley et al. [103] found that females were nearly always classified correctly, whereas males were often classified as female. Thus, future population-inclusive research should prioritize the incorporation of Latin-American individuals in order to better capture this range of variation.

4.3. Mixed Model

Overall, the population-inclusive mixed model had higher SPSS and applied accuracies than both the nonmetric and metric population-inclusive models. The mixed model did not have a significantly different classification accuracy than the metric SPSS and applied accuracies or the nonmetric SPSS accuracy; however, it was significantly higher than the nonmetric applied accuracy (increase of 10.7%). A BLR was attempted through SPSS in order to produce population-specific models, but none of the population-specific models yielded class means with p-values greater than 0.05; therefore, they were not statistically significant. The lack of statistical significance found here was likely due to the small sample sizes in the mixed models, resulting from the incorporation of more variables.
Most sex estimations conventionally used in forensic casework apply nonmetric and metric models in a complementary fashion [1], and there do not appear to be any methods currently employed that combine both the nonmetric and metric traits into one regression equation as seen in this study. Since most practitioners prefer to separately use both nonmetric and metric methods estimating sex based on the skull, this regression that combines both could be a valuable addition to the forensic anthropologists’ toolkit. Moreover, since the classification accuracies for this mixed model equation are higher than those of the nonmetric and metric models alone, it is recommended that more studies be conducted in order to explore the validity of mixed nonmetric and metric models.

4.4. Intrarater Reliability

Intraobserver agreement was highly significant for all nonmetric trait scores (p-values ≤ 0.001). As described by Landis and Koch [94], the nuchal crest and supraorbital margin had the lowest kappa values (0.365 and 0.432, respectively), suggesting that both traits were difficult to score consistently between observations. These results are dissimilar to the intraobserver reliability test from Tallman’s [2] cranial nonmetric analysis on East and Southeast Asian individuals, where the nuchal crest had a substantial level of agreement between observations; however, the mastoid process, supraorbital margin, glabella, and mental eminence all had a moderate level of agreement between observations [2]. Garvin et al. [8] found that the nuchal crest and mental eminence had the lowest levels of agreement. Garvin et al. [8] postulated that the nuchal crest was more difficult to score consistently because it involves a larger area compared to other morphological traits, and the range of shape variation is relatively smaller and, thus, more difficult to visualize. Although the 3D-VR CT image was manipulated and rotated in order to examine the nuchal crest from all angles, the visual extent of rugosity could have been inhibited due to the quality of the CT image or partial volume effects (PVEs). Stull et al. [89] found that the ability to assess VR CT images was notably impacted by PVEs during the volume-rendering process. This occurs when the CT scanner has difficulty in distinguishing between materials with different Hounsfield units, such as air and bone, and results in the appearance of artifacts that can obscure an area, or the softening of the object’s surface [89]. In the case of the nuchal crest, the PVE phenomenon could have reduced the appearance of rugosity, making it more difficult to consistently score. In the case of the supraorbital margin, the difficulty lay in the inability to estimate the relative width and roundness or sharpness of the margin through palpation, which would be done with dry bone. In the future, caution should be applied when analyzing the nuchal crest and supraorbital margin via VR images. The mastoid process and glabella performed with moderate levels of agreement, but had the highest kappa values (0.563 and 0.531, respectively). Walker [17] similarly found that the glabella and mastoid process had the highest levels of agreement relative to the nuchal crest, supraorbital margin, and mental eminence.
The ICC values indicate a high level of intrarater reliability for the metric measurements. This confirms that measurements can be successfully taken on CT scans and perform better than the more subjective nonmetric traits. The glabella occipital length had the highest ICC (0.989), and the parietal chord had the lowest ICC (0.777). The parietal chord, occipital chord, and nasion–prosthion height all had the most cases excluded from the ICC analysis due to small samples sizes, and were removed from the DFA in order to maximize the sample sizes. One of the occasional artifacts of PVEs is a softening of overall images that can cause cranial sutures to appear faded or obliterated [89], making some cranial chords difficult to measure. The nasion–prosthion height was often unable to be measured due to alveolar resorption, damage to the craniometric landmark, or PVEs—potentially from dental fillings or soft tissue. A study by Menéndez [104] looked at intraobserver measurement error of 3D-VR craniofacial landmarks, and found that the nasion had the highest intraobserver error rates, and was difficult to establish consistently across multiple observational sessions. The occipital chord and parietal chord are also craniometric landmarks that have demonstrably variable intraobserver reliability [85,87]. The cranial chords rely on landmarks demarcated by suture lines, which could also be affected by the quality of the 3D-VR image [87]. In the future, it would be best to remove measurements that include cranial sutures, because of the difficulty in scoring them consistently when they are faded or obliterated due to PVEs or CT quality. Removing these measurements may help to maximize sample sizes; however, such measurements are sexually dimorphic.

4.5. Data Collection from 3D-VR CT Images

The majority of nonmetric traits had a moderate level of intraobserver agreement, while the metric traits, as aforementioned, all had statistically significant ICC values and overall higher accuracy rates. The data collection for the nonmetric scores from VR CT images of the skull from multiple angles was impacted by the nature of viewing an image on a computer rather than physical palpation, as well as by the obstructive nature of PVEs. While research shows that data collection from VR CT images of the skeleton can be accomplished with statistically significant accuracy [84,89,105], certain traits—such as the supraorbital margin—are more difficult to examine than others, and further critical study into the value and assessment of these traits is warranted. Buikstra and Ubelaker’s [6] definition for scoring the supraorbital margin as well as the nuchal crest recommends palpating the feature/trait, which does not translate to digital observation. However, a study that explores the isolated shape and topography of the supraorbital margin (sensu [9,106]) would be helpful in assessing whether the levels of sharpness, roundness, and rugosity can be reliably quantified with VR CT images and correlated with ordinal scores. The additional challenge of depth perception, as seen with the nuchal crest and mental eminence, could be addressed in the future via manipulation of the opacity ramp. Stull et al. [89] noted that lowering the opacity ramp helped with visualizing certain sutures as well as overall bone morphology. When a VR image is constructed, the opacity curve determines the various tissues’ transparency and opacity [89].
Additional limitations, mainly including the accessible demographics of the NMDID and cause of death, affected sample size. The challenge of establishing an equally distributed sample across all demographics was due, in part, to the availability of the NMDID, which is disproportionately composed of white AMABs, despite its large size. Furthermore, the study sample’s VR CT scans were derived from the OCME of New Mexico; therefore, the completeness or usability of each VR skull was variably affected by the cause of death, and was not readily apparent until after the CT image had been volume rendered and PVEs had been removed; however, this type of sample is both directly representative of the type of remains found in forensic contexts (i.e., incomplete) and contains more human variation than the skeletal collections traditionally used in the development of estimation methods. As previously discussed, PVEs in some cases could not be removed without affecting the surface of the skull, limiting the ability to view and measure the skull and, therefore, collect data. Despite the limitations, the benefits of VR CT analysis help to advance forensic research analysis and the development of biological profile methods, because large CT databases such as the NMDID provide researchers with relatively easy access to a plethora of osteological data that reflects extensive human skeletal variation.

4.6. Sex and Gender

Because sex and gender identities intersect variably and are rooted in biocultural, performative processes that move beyond biological or anatomical processes, it is important for forensic anthropologists to avoid restricting identity to biological or anatomical definitions in isolation [71]. Most importantly, forensic anthropologists should endeavor to avoid assuming that all individuals are cisgender, avoid preconceived notions of heteronormativity, and bear in mind that not all individuals share the same perspective on sex, gender, and related expressions [71]. Presently, there is no existing standardized method of reporting if a decedent is trans, intersex, or gender diverse [71]. Moreover, current sex estimation methods for analysis and reporting have generally not evolved to be aligned with modern social perceptions of sex, gender, and intersectional identity [71]. While this research applies novel technology and methodological approaches to understand sexual dimorphism with more inclusive terminology, we acknowledge that it does not address the need to expand binary sex estimation.

5. Conclusions

As demonstrated here, population-inclusive methods will not produce significantly different accuracy rates compared to population-specific methods of assigned-sex estimation, suggesting that population-inclusive models could be used to estimate the assigned sex of unidentified remains without knowing or estimating ancestry. Overall, the population-inclusive nonmetric model produced classification accuracies that ranged from 81.0% to 87.0%, while the metric model produced classification accuracies that ranged from 86.7% to 87.0%. Additionally, the population-inclusive mixed model produced classification accuracies that ranged from 88.8% to 91.6%—higher than the separate nonmetric and metric population-inclusive model classification accuracies. These results indicate that this novel mixed model approach has the potential to better estimate assigned sex than metric or nonmetric models alone, and it is recommended that further applications should validate these findings on heterogeneous samples. Additionally, this study demonstrates the utility of VR CT scans for developing assigned-sex estimation models, despite the inherent limitations in analyzing the skull virtually. While the supraorbital margin, nuchal crest, and some measurements reliant on cranial sutures were difficult to assess—and should continue to be evaluated—this study affirms that VR CT scans are valid for the development of nonmetric and metric assigned-sex estimation methods.
Ongoing discussion in the field of forensic anthropology regarding the role of ancestry in the biological profile has made the problematic nature of currently used ancestry-dependent sex estimation models more apparent [29,30,35,37,39,40,41,43,45,46]. As sex estimation methods have generally been developed and tested on specific populations of African-American, European-American, and occasionally Native-American and Hispanic individuals [52], these models are inherently exclusive, and produce reduced classification accuracy when applied to biogeographically different groups. More specifically, the foundational ancestry methods for these models have not taken into consideration the evolutionary mechanisms behind biogeographic differences, or the influence that secular change, intersectionality, embodied racism, and biocultural processes have on skeletal variability across populations [29,30,37,39,40,46]. While population-specific methods of identification have a clear utility in certain population-circumscribed or relatively homogeneous contexts, the scope of populations that have validated estimation methods is lacking—particularly for a relatively heterogeneous country such as the U.S. Therefore, there is a necessity for the application of population-inclusive methods, which include significantly more variation and are, therefore, more appropriate for individuals who may not be included in the model development (e.g., truly unknown cases). This research indicates that the population-inclusive models will be able to accommodate significantly more variation than population-specific models. Furthermore, population-inclusive methods of sex, age, and stature estimation should be further explored, developed, validated, and made part of forensic anthropologists’ standard toolkit.

Author Contributions

Conceptualization, S.R.K. and S.D.T.; methodology, S.R.K. and S.D.T.; validation, S.R.K.; formal analysis, S.R.K.; investigation, S.R.K.; resources, S.R.K.; data curation, S.R.K.; writing—original draft preparation, S.R.K. and S.D.T.; writing—review and editing, S.R.K. and S.D.T.; visualization, S.R.K. and S.D.T.; supervision, S.D.T.; project administration, S.R.K. and S.D.T. All authors have read and agreed to the published version of the manuscript.

Funding

This research received no external funding.

Institutional Review Board Statement

The study was deemed “exempt” by Boston University’s Institutional Review Board (H-40441, 1 July 2020).

Informed Consent Statement

Not applicable.

Data Availability Statement

The data for this study are kept by the first author and the NMDID.

Acknowledgments

The authors would like to thank the personnel who manage the NMDID for curating the CT scans and providing access, particularly Heather Edgar. Additionally, the authors would like to thank Francisca Alves Cardoso, Vanessa Campanacho, and Claudia Regina Plens for editing this Special Issue and including our work. Lastly, our thanks to the anonymous peer reviewers whose comments helped to improve this article.

Conflicts of Interest

The authors declare no conflict of interest.

References

  1. Klales, A.R. Sex Estimation of the Human Skeleton: History, Methods, and Emerging Techniques, 1st ed.; Elsevier Press: Waltham, MA, USA, 2020; pp. 1–364. [Google Scholar]
  2. Tallman, S.D. Cranial nonmetric sexual dimorphism and sex estimation in east and southeast Asian individuals. Forensic Anthropol. 2019, 2, 204–221. [Google Scholar] [CrossRef]
  3. Ubelaker, D.H.; DeGaglia, C.M. Population variation in skeletal sexual dimorphism. Forensic Sci. Int. 2017, 278, 407.e1–407.e7. [Google Scholar] [CrossRef]
  4. Acsádi, G.; Nemeskéri, J. History of Human Life Span and Mortality; Akadémiai Kiadó: Budapest, Hungary, 1970. [Google Scholar]
  5. Broca, P. Instructions Craniologiques et Craniométriques; Series 2; Society of Anthropology of Paris: Paris, France, 1875. [Google Scholar]
  6. Buikstra, J.E.; Ubelaker, D.H. Standards for Data Collection from Human Skeletal Remains; Research Series No. 44; Arkansas Archaeological Survey: Fayetteville, NC, USA, 1994. [Google Scholar]
  7. Dayal, M.R.; Spocter, M.A.; Bidmos, M.A. An assessment of sex using the skull of black South Africans by discriminant function analysis. Homo 2008, 59, 209–221. [Google Scholar] [CrossRef] [PubMed]
  8. Garvin, H.M.; Sholts, S.B.; Mosca, L.A. Sexual dimorphism in human cranial trait scores: Effects of population, age, and body size. Am. J. Phys. Anthropol. 2014, 154, 259–269. [Google Scholar] [CrossRef]
  9. Graw, M.; Czarnetzki, A.; Haffner, H.T. The form of the supraorbital margin as a criterion in identification of sex from the skull: Investigations based on modern human skulls. Am. J. Phys. Anthropol. 1999, 108, 91–96. [Google Scholar] [CrossRef]
  10. Krogman, W.M. The skeleton in forensic medicine. Postgrad. Med. J. 1955, 17, A48–A62. [Google Scholar]
  11. Krogman, W.M.; Işcan, M.Y. The Human Skeleton in Forensic Medicine; Charles C Thomas: Springfield, IL, USA, 1986. [Google Scholar]
  12. Lewis, C.J.; Garvin, H.M. Reliability of the Walker cranial nonmetric method of implications for sex estimation. J. Forensic Sci. 2016, 61, 743–751. [Google Scholar] [CrossRef]
  13. Martin, R.; Knussman, R. Anthropologie: Handbuch der Vergleichenden Biologie des Menschen; Gustav Fisher Verlag: Stuttgart, Germany, 1988. [Google Scholar]
  14. Rogers, T.L. Determining the sex of human remains through cranial morphology. J. Forensic Sci. 2005, 50, 493–500. [Google Scholar] [CrossRef] [PubMed]
  15. Spradley, M.K.; Jantz, R.L. Sex estimation in forensic anthropology: Skull versus postcranial elements. J. Forensic Sci. 2011, 56, 289–296. [Google Scholar] [CrossRef] [PubMed]
  16. Tallman, S.D.; Go, M.C. Application of the optimized summed scored attributes method to sex estimation in Asian crania. J. Forensic Sci. 2018, 63, 809–814. [Google Scholar] [CrossRef] [PubMed]
  17. Walker, P.L. Sexing skulls using discriminant function analysis of visually assessed traits. Am. J. Phys. Anthropol. 2008, 136, 39–50. [Google Scholar] [CrossRef] [PubMed]
  18. Walrath, D.E.; Turner, P.; Bruzek, J. Reliability test of the visual assessment of cranial traits for sex determination. Am. J. Phys. Anthropol. 2004, 125, 132–137. [Google Scholar] [CrossRef] [PubMed]
  19. Karsten, J.K. A test of the preauricular sulcus as an indicator of sex. Am. J. Phys. Anthropol. 2017, 165, 604–608. [Google Scholar] [CrossRef]
  20. Letterman, G.S. The greater sciatic notch in American Whites and Negroes. Am. J. Phys. Anthropol. 1941, 98, 59–72. [Google Scholar] [CrossRef]
  21. Patterson, M.M.; Tallman, S.D. Cranial and postcranial metric sex estimation in modern Thai and Ancient Native American individuals. Forensic Anthropol. 2019, 2, 233–252. [Google Scholar] [CrossRef]
  22. Phenice, T.W. A newly developed visual method of sexing the os pubis. Am. J. Phys. Anthropol. 1969, 30, 297–301. [Google Scholar] [CrossRef]
  23. Rogers, T.L. A visual method of determining the sex of the skeleton using the distal humerus. J. Forensic Sci. 1999, 44, 57–60. [Google Scholar] [CrossRef] [PubMed]
  24. Rogers, N.L.; Flournoy, L.E.; McCormick, W.F. The rhomboid fossa of the clavicle as a sex and age estimator. J. Forensic Sci. 2000, 45, 61–67. [Google Scholar] [CrossRef]
  25. Tallman, S.D.; Blanton, A.I. Distal humerus morphological variation and sex estimation in modern Thai individuals. J. Forensic Sci. 2020, 65, 361–371. [Google Scholar] [CrossRef] [PubMed]
  26. Vance, V.L.; Steyn, M.; L’Abbé, E.N.L. Nonmetric sex determination from the distal and posterior humerus in Black and white South Africans. J. Forensic Sci. 2011, 56, 710–714. [Google Scholar] [CrossRef] [Green Version]
  27. Walker, P.L. Greater sciatic notch morphology: Sex, age, and population differences. Am. J. Phys. Anthropol. 2005, 127, 385–391. [Google Scholar] [CrossRef]
  28. Washburn, S.L. Sex difference in the pubic bone. Am. J. Phys. Anthropol. 1948, 6, 199–207. [Google Scholar] [CrossRef]
  29. Bethard, J.D.; DiGangi, E.A. Moving beyond a lost cause: Forensic anthropology and ancestry estimates in the United States. J. Forensic Sci. 2020, 65, 1791–1792. [Google Scholar] [CrossRef] [PubMed]
  30. DiGangi, E.A.; Bethard, J.D. Uncloaking a lost cause: Decolonizing ancestry estimation in the United States. Am. J. Phys. Anthropol. 2021, 175, 422–436. [Google Scholar] [CrossRef]
  31. Cunha, E.; van Vark, G. The construction of sex discriminant functions from a large collection of skulls of known sex. Int. J. Anthropol. 1991, 6, 53–66. [Google Scholar] [CrossRef] [Green Version]
  32. Eleveth, P.B.; Tanner, J.M. Worldwide Variation in Human Growth, 2nd ed.; Cambridge University Press: Cambridge, UK, 1990. [Google Scholar]
  33. Franklin, D.; Freedman, L.; Milne, N. Sexual dimorphism and discriminant function sexing in indigenous South African crania. Homo 2005, 55, 213–228. [Google Scholar] [CrossRef] [PubMed]
  34. Kemkes, A.; Gobel, T. Metric assessment of the “mastoid triangle” for sex determination: A validation study. J. Forensic Sci. 2006, 51, 985–989. [Google Scholar] [CrossRef]
  35. Adams, D.M.; Pilloud, M.A. The (mis)appropriation of biological anthropology in race science and the implications for forensic anthropology. Forensic Anthropol. 2021, 4, 1–22. [Google Scholar] [CrossRef]
  36. Albanese, J. A method for estimating sex using the clavicle, humerus, radius, and ulna. J. Forensic Sci. 2013, 58, 1413–1419. [Google Scholar] [CrossRef] [PubMed]
  37. Albanese, J.; Saunders, S.R. Is it possible to escape racial typology in forensic identification? In Forensic Anthropology and Medicine: Complementary Sciences from Recovery to Cause of Death; Schmitt, A., Cunha, E., Pinheiro, J., Eds.; Humana Press: Totowa, NJ, USA, 2006; pp. 281–316. [Google Scholar]
  38. Albanese, J.; Eklics, G.; Tuck, A. A metric method for sex determination using the proximal femur and fragmentary hipbone. J. Forensic Sci. 2008, 53, 1283–1288. [Google Scholar] [CrossRef] [PubMed]
  39. Blakey, M.L. Understanding racism in physical (biological) anthropology. Am. J. Phys. Anthropol. 2021, 175, 316–325. [Google Scholar] [CrossRef]
  40. Carson, E.A. Maximum likelihood estimation of human craniometrics heritabilities. Am. J. Phys. Anthropol. 2006, 131, 169–180. [Google Scholar] [CrossRef]
  41. Edgar, H.J.H. Population structure, population, heterogeneity, and sources of error in the forensic estimation of “race”. In Proceedings of the 72nd Annual Scientific Meeting of the American Academy of Forensic Sciences, Anaheim, CA, USA, 17–22 February 2020. [Google Scholar]
  42. Moss, J.L. The forgotten victims of missing white woman syndrome: An examination of legal measures that contribute to the lack of search and recovery of missing black girls and women. Race Gender Soc. Just. 2018, 25, 737–762. [Google Scholar]
  43. Ross, A.H.; Pilloud, M. The need to incorporate human variation and evolutionary theory in forensic anthropology: A call for reform. Am. J. Phys. Anthropol. 2021, 176, 672–683. [Google Scholar] [CrossRef] [PubMed]
  44. Sommers, Z. Missing white woman syndrome: An empirical analysis of race and gender disparities in online news coverage of missing persons. J. Crim. Law Criminol. 2016, 106, 275–314. [Google Scholar]
  45. Spradley, K.; Jantz, R.L. What are we really estimating in forensic anthropological practice, population affinity or ancestry? Forensic Anthropol. 2021, 4, 171–180. [Google Scholar] [CrossRef]
  46. Tallman, S.D.; Parr, N.M.; Winburn, A.P. Assumed differences; unquestioned typologies: The oversimplification of race and ancestry in forensic anthropology. Forensic Anthropol. 2021, 4, 73–96. [Google Scholar] [CrossRef]
  47. Albanese, J.; Tuck, A.; Gomes, J.; Cardoso, H.F.V. An alternative approach for estimating stature from long bones that is not population-or group-specific. Forensic Sci. Int. 2016, 259, 59–68. [Google Scholar] [CrossRef]
  48. Edgar, H.J.H.; Daneshvari Verry, S.; Moes, E.; Adolphi, N.L.; Bridges, P.; Nolte, K.B. New Mexico Decedent Image Database; Office of the Medical Investigator, University of New Mexico: Albuquerque, NM, USA, 2020. [Google Scholar] [CrossRef]
  49. Berry, S.R. Metadata Determination for Cadaveric Collection. Master’s Thesis, University of New Mexico, Albuquerque, NM, USA, 2014. [Google Scholar]
  50. Daneshvari Berry, S.; Edgar, H.J.H. Development of a large-scale, whole body CT image database. In Proceedings of the AMIA Annual Symposium, Washington, DC, USA, 6–8 November 2017. [Google Scholar]
  51. Daneshvari Berry, S.; Edgar, H.J.H. Announcement: The New Mexico decedent image database. Forensic Imaging 2021, 24, 1–3. [Google Scholar]
  52. Tise, M.L.; Spradley, M.K.; Anderson, B.E. Postcranial sex estimation of individuals considered Hispanic. J. Forensic Sci. 2013, 58 (Suppl. S1), S9–S14. [Google Scholar] [CrossRef] [PubMed]
  53. GLAAD. Available online: https://www.glaad.org/reference/transgender (accessed on 16 September 2021).
  54. Blackless, M.; Charuvastra, A.; Derryck, A.; Fausto-Sterling, A.; Lauzanne, K.; Lee, E. How sexually dimorphic are we? Review and synthesis. Am. J. Hum. Biol. 2000, 12, 151–156. [Google Scholar] [CrossRef]
  55. Stock, M.K. A preliminary analysis of the age of full expression of sexually dimorphic cranial traits. J. Forensic Sci. 2018, 63, 1802–1808. [Google Scholar] [CrossRef]
  56. Vanderschueren, D.; Vandenput, L.; Boonen, S.; Lindberg, M.L.; Bouillon, R.; Ohlsson, C. Androgens and bone. Endocr. Rev. 2004, 25, 389–425. [Google Scholar] [CrossRef] [Green Version]
  57. Bouillon, R.; Bex, M.; Vanderschueren, D.; Boonen, S. Estrogens are essential for male pubertal periosteal bone expansion. J. Clin. Endocrinol. Metab. 2004, 89, 6025–6029. [Google Scholar] [CrossRef] [Green Version]
  58. Carson, J.A.; Manolagas, S.C. Effects of sex steroids on bones and muscles: Similarities, parallels, and putative interactions in health and disease. Bone 2015, 80, 67–78. [Google Scholar] [CrossRef] [Green Version]
  59. Vanderschueren, D.; Venken, K.; Ophoff, J.; Boullon, R.; Boonen, S. Sex steroids and the periosteum-reconsidering the roles of androgens and estrogens in periosteal expansion. J. Clin. Endocrinol. Metab. 2006, 91, 378–382. [Google Scholar] [CrossRef] [Green Version]
  60. Saggese, G.; Baroncelli, G.I.; Bertelloni, S. Puberty and bone development. Best Pract. Res. Clin. Endocrinol. Metab. 2002, 16, 53–64. [Google Scholar] [CrossRef]
  61. Arsuaga, J.L.; Carretero, J.M. Multivariate analysis of the sexual dimorphism of the hip bone in modern human population and in early hominids. Am. J. Phys. Anthropol. 1994, 93, 241–257. [Google Scholar] [CrossRef]
  62. Best, K.C.; Garvin, M.S.; Cabo, L.L. An investigation into the relationship between human cranial and pelvic sexual dimorphism. J. Forensic Sci. 2018, 63, 990–1000. [Google Scholar] [CrossRef]
  63. Frayer, D.; Wolpoff, M. Sexual dimorphism. Annu. Rev. Anthropol. 1985, 14, 429–473. [Google Scholar] [CrossRef]
  64. Scheuer, L.; Black, S. The Juvenile Skeleton, 1st ed.; Academic Press: London, UK, 2004; p. 140. [Google Scholar]
  65. Klales, A.R. Current practices in physical anthropology for sex estimation in unidentified, adult individuals. Am. J. Phys. Anthropol. 2013, 150, 168. [Google Scholar]
  66. Klales, A.R.; Ousley, S.D.; Vollner, J.M. A revised method of sexing the human innominate using Phenice’s nonmetric traits and statistical methods. Am. J. Phys. Anthropol. 2012, 149, 104–114. [Google Scholar] [CrossRef] [PubMed]
  67. Stewart, T. Essentials for Forensic Anthropology; Charles C Thomas: Springfield, IL, USA, 1979. [Google Scholar]
  68. Curate, F.; Coelho, J.; Gonçalves, D.; Coelho, C.; Ferreira, M.T.; Navega, D.; Cunha, E. A method for sex estimation using the proximal femur. Forensic Sci. Int. 2016, 266, 579.e1–579.e7. [Google Scholar] [CrossRef] [Green Version]
  69. Bass, W.M. Human Osteology: A Laboratory and Field Manual, 5th ed.; Missouri Archaeological Society: Columbia, MO, USA, 2005. [Google Scholar]
  70. Garvin, H.M.; Ruff, C.B. Sexual dimorphism in skeletal browridge and chin morphologies determined using a new quantitative method. Am. J. Phys. Anthropol. 2012, 147, 661–670. [Google Scholar] [CrossRef] [PubMed]
  71. Tallman, S.D.; Kincer, C.D.; Plemons, E.D. Centering transgender individuals in forensic anthropology and expanding binary sex estimation in casework and research. Forensic Anthropol. 2022, 5, 161–180. [Google Scholar] [CrossRef]
  72. Jantz, R.; Ousley, S. Fordisc 3: Third generation of computer-aided forensic anthropology. Rechtsmedizin 2013, 23, 97–99. [Google Scholar]
  73. Burns, K.R. Forensic Anthropology Training Manual, 2nd ed.; Pearson: New York, NY, USA, 2006. [Google Scholar]
  74. Gray, H. Gray’s Anatomy; LEA & FEBIGER: Philadelphia, PA, USA, 1966. [Google Scholar]
  75. Hrdlička, A. Practical Anthropometry, 4th ed.; Stewart, T.D., Ed.; Wistar Institute of Anatomy and Biology: Philadelphia, PA, USA, 1952. [Google Scholar]
  76. Krogman, W.M. The Human Skeleton in Forensic Medicine; Charles C Thomas: Springfield, IL, USA, 1962. [Google Scholar]
  77. Montagu, M.F.A. Introduction to Physical Anthropology; Charles C Thomas: Springfield, IL, USA, 1960. [Google Scholar]
  78. Rogers, T.L.; Saunders, S. Accuracy of sex determination using morphological traits of the human pelvis. J. Forensic Sci. 1994, 39, 1047–1056. [Google Scholar] [CrossRef]
  79. Stewart, T.D. Evaluation of evidence form the skeleton. In Legal Medicine; Gradwohl, R.B.H., Ed.; CV Mosley: St. Louis, MO, USA, 1954. [Google Scholar]
  80. Rennie, S.R. Summary Sex: A Multivariate Approach to Sex Estimation from the Human Pelvis. Ph.D. Thesis, Liverpool John Moores University, Liverpool, UK, 2018. [Google Scholar]
  81. Washburn, S.L. Sex difference in the pubic bone of Bantu and Bushman. Am. J. Phys. Anthropol. 1949, 7, 425–432. [Google Scholar] [CrossRef]
  82. Roth, M.; Ousley, S.D.; Tuamsuk, P. Sex estimation using non-metric traits in Thai crania with the Walker (2008) method. In Proceedings of the 65th Annual Meeting of the American Academy of Forensic Sciences, Washington, DC, USA, 18–23 February 2013. [Google Scholar]
  83. Winburn, A.P.; Jennings, A.L.; Steadman, D.W.; DiGangi, E.A. Ancestral diversity in skeletal collections: Perspectives on African American body donation. Forensic Anthropol. 2022, 5, 141–152. [Google Scholar] [CrossRef]
  84. Decker, S.J.; Davy-Jow, S.L.; Ford, J.M.; Hilbelink, D.R. Virtual determination of sex: Metric and nonmetric traits of the adult pelvis from 3D computed tomography models. J. Forensic Sci. 2011, 56, 1107–1114. [Google Scholar] [CrossRef]
  85. Herrera, M.D.; Tallman, S.D. Craniometric variation and ancestry estimation in two contemporary Caribbean populations. Forensic Sci. Int. 2019, 305, 110013. [Google Scholar] [CrossRef] [PubMed]
  86. Hughes, C.E.; Tise, M.L.; Trammell, L.H.; Anderson, B.E. Cranial morphological variation among contemporary Mexicans: Regional trends, ancestral affinities, and genetic comparisons. Am. J. Phys. Anthropol. 2013, 151, 506–517. [Google Scholar] [CrossRef] [PubMed]
  87. Richard, A.H.; Parks, C.L.; Monson, K.L. Accuracy of standard craniometrics measurements using multiple data formats. Forensic Sci. Int. 2014, 242, 177–185. [Google Scholar] [CrossRef]
  88. Ross, A.H. Cranial evidence of pre-contact multiple population expansions in the Caribbean. Caribb. J. Sci. 2004, 40, 291–298. [Google Scholar]
  89. Stull, K.E.; Tise, M.L.; Ali, Z.; Fowler, D.R. Accuracy and reliability of measurements obtained from computed tomography 3D-volume rendered images. Forensic Sci. Int. 2014, 238, 133–140. [Google Scholar] [CrossRef] [Green Version]
  90. Field, A. Discovering Statistics Using SPSS, 3rd ed.; SAGE: Thousand Oaks, CA, USA, 2009; pp. 267–678. [Google Scholar]
  91. Hefner, J.T. Cranial nonmetric variation and estimating ancestry. J. Forensic Sci. 2009, 54, 985–995. [Google Scholar] [CrossRef]
  92. Cohen, J. A coefficient of agreement for nominal scales. Educ. Psychol. Meas. 1960, 20, 37–46. [Google Scholar] [CrossRef]
  93. Cohen, J. Weighted Kappa: Nominal scale agreement with provision for scaled disagreement or partial credit. Psychol. Bull. 1968, 70, 213–220. [Google Scholar] [CrossRef] [PubMed]
  94. Landis, J.R.; Koch, G.G. The measurement of observer agreement for categorical data. Biometrics 1977, 33, 159–174. [Google Scholar] [CrossRef] [Green Version]
  95. Barnes, M.L. Empirical methods and critical race theory: A discourse on possibilities for a hybrid methodology. Wis. L. Rev. 2016, 443, 443–476. [Google Scholar]
  96. Ford, C.L.; Airhihenbuwa, C.O. Commentary: Just what is critical race theory and what’s it doing in a progressive field like public health? Ethn. Dis. 2018, 28, 223–230. [Google Scholar] [CrossRef] [PubMed]
  97. Quintanilla, V.D. Critical race empiricism: A new means to measure civil procedure. UC Irvine L. Rev. 2013, 3, 187–216. [Google Scholar]
  98. Go, M.C.; Yuki, N.; Chu, E.Y. On WEIRD anthropologists and their white skeletons. Forensic Anthropol. 2021, 4, 145–160. [Google Scholar] [CrossRef]
  99. Williams, B.A.; Rogers, T. Evaluating the accuracy and precision of cranial morphological traits for sex determination. J. Forensic Sci. 2006, 51, 729–735. [Google Scholar] [CrossRef] [PubMed]
  100. Stinson, S. Sex differences in environmental sensitivity during growth and development. Yearb. Phys. Anthropol. 1985, 28, 123–147. [Google Scholar] [CrossRef]
  101. Stinson, S. Growth variation: Biological and cultural factors. In Human Biology: An Evolutionary and Biocultural Perspective, 2nd ed.; Stinson, S., Bogin, B., O’Rourke, D., Eds.; Wiley: Hoboken, NJ, USA, 2012; pp. 587–635. [Google Scholar]
  102. Klales, A.R.; Cole, S.J. Improving nonmetric sex classification for Hispanic individuals. J. Forensic Sci. 2017, 62, 975–980. [Google Scholar] [CrossRef]
  103. Spradley, M.K.; Jantz, R.L.; Robinson, A.; Peccerelli, F. Demographic change and forensic identification: Problems in metric identification of Hispanic skeletons. J. Forensic Sci. 2008, 53, 21–28. [Google Scholar] [CrossRef]
  104. Mendéndez, L.P. Comparing methods to assess intraobserver measurement of error of 3D craniofacial landmarks using geometric morphometrics through a digitizer arm. J. Forensic Sci. 2017, 62, 741–746. [Google Scholar] [CrossRef]
  105. Robinson, C.; Eisma, R.; Morgan, B.; Jeffery, A.; Graham, E.A.M.; Black, S.; Rutty, G.N. Anthropological measurement of lower limb and foot bones using multi-detector computed tomography. J. Forensic Sci. 2008, 53, 1289–1295. [Google Scholar] [CrossRef]
  106. Pinto, S.C.; Urbanová, P.; Ceaser, R.M., Jr. Two-dimensional wavelet analysis of supraorbital margins of the human skull for characterizing sexual dimorphism. IEEE Trans. Inf. Forensics Secur. 2016, 11, 1542–1548. [Google Scholar] [CrossRef]
Figure 1. Percentages of study sample by population affinity.
Forensicsci 02 00024 g001
Figure 2. Sample preparation example that includes the progression of an individual from CT image slices, to a 3D-VR CT image, to a completely edited Meshmix file.
Forensicsci 02 00024 g002
Figure 3. Example of the aspects used to view the five morphological traits of the skull.
Forensicsci 02 00024 g003
Figure 4. Examples of metric measurements from an anterior perspective, including (1) minimum frontal breadth, (2) orbital height, and (3) upper facial height.
Forensicsci 02 00024 g004
Figure 5. Examples of metric measurements from a lateral perspective, including (4) parietal chord, (5) glabella occipital length, (6) mastoid length, (7) mandibular length, and (8) maximum ramus height.
Forensicsci 02 00024 g005
Figure 6. Examples of metric measurements from an inferior perspective, including (9) bizygomatic breadth, (10) bicondylar breadth, (11) biauricular breadth, and (12) foramen magnum breadth.
Forensicsci 02 00024 g006
Figure 7. Examples of metric measurements from a posterior perspective, including (13) occipital chord and (14) bigonial breadth.
Forensicsci 02 00024 g007
Figure 8. Examples of metric measurements from an anterolateral perspective, including (15) basion–bregma height, (16) basion–nasion length, (17) frontal chord, and (18) nasal height.
Forensicsci 02 00024 g008
Table 1. Study sample divided by age cohort, population affinity, and assigned sex.
Age (years)Population AffinityAMABAFAB
18–30African American109
Asian American186
European American1012
Latin American1211
Native American1110
31–50African American1112
Asian American193
European American1211
Latin American1112
Native American1112
51–70African American1518
Asian American268
European American1813
Latin American1716
Native American2017
71–90African American44
Asian American63
European American35
Latin American 44
Native American43
Total Sample Size242189
Table 2. Metric measurements and associated landmarks following Spradley and Jantz [17].
Metric Measurements
1. Minimum frontal breadth (ft-ft)10. Bicondylar breadth (cdl-cdl)
2. Orbital height11. Biauricular breadth (au-au)
3. Upper facial height (n-pr)12. Foramen magnum breadth
4. Parietal chord (b-l)13. Occipital chord (l-o)
5. Glabella occipital length (g-op)14. Bigonial breadth (go-go)
6. Mastoid length15. Basion–bregma height (ba-b)
7. Mandibular length16. Basion–nasion length (ba-n)
8. Maximum ramus height17. Frontal chord (n-b)
9. Bizygomatic breadth (zy-zy)18. Nasal height (n-ns)
Table 3. Population-inclusive and population-specific binary logistic regression models a.
Stepwise-Selected Classification Functions bClassification Statistics
AFABAMABOverall c
Population-Inclusive
Y = (glabella * 1.385) + (mastoid process * 0.902) + (mental eminence * 0.44) + (−5.888)N149189338
%86.6%87.1%87.0%
Population-Inclusive d
Y = (glabella * 1.363) + (mastoid process * 0.876) + (nuchal crest * 0.393) + (−5.664)N103122225
%88.0%82.4%85.0%
African American
Y = (glabella * 1.335) + (mastoid process * 1.046) + (−5.164)N332760
%86.8%77.1%82.0%
Asian American
Y = (glabella * 3.033) + (mastoid process * 1.012) + (−6.438)N166177
%84.2%93.2%91.0%
European American
Y = (glabella * 1.628) + (metal eminence * 1.002) + (−6.309)N353469
%87.5%82.9%85.0%
Latin American
Y = (glabella * 1.324) + (nuchal crest * 0.995) + (−5.18)N333366
%89.2%80.5%85.0%
Native American
Y = (glabella * 1.827) + (mastoid process * 1.276) + (−7.037)N353570
%92.1%85.489.0%
a Sectioning point is 0.5; below = AFAB; above = AMAB. b All class means were statistically significant, p < 0.05. c No classification accuracies were significantly different from the population-inclusive model (p ≥ 0.5, 2-tailed). d Population-inclusive model calculated on 70% of the sample.
Table 4. Applied classification accuracies for binary logistic regression models.
Applied Model Classification Statistics
AFABAMABOverall
Population-InclusiveN156159315
%90.7%73.3%81.0%
Population-Inclusive aN5356109
%91.4%76.7%83.2%
African AmericanN372663
%88.1%70.3%79.7%
Asian AmericanN166177
%84.2%93.8%91.7% b
European AmericanN353469
%87.5%82.9%85.2%
Latin AmericanN382967
%90.5%67.4%78.8%
Native AmericanN383775
%92.7%84.1%88.2%
a Tested on the population-inclusive 30% HOS. b Significantly different accuracy compared to the overall % for the population-inclusive model (p ≤ 0.05, 2-tailed).
Table 5. Population-inclusive and population-specific discriminant function models.
Stepwise-Selected Classification Functions a and Sectioning Points (SP) bClassification Statistics
AFABAMABOverall
Population-Inclusive
Y = (glabella occipital length * 0.057) + (bizygomatic breadth * 0.126) + (biauricular breadth * −0.047) + (minimum frontal breadth * −0.069) + (nasal height * 0.059) + (orbital height * −0.115) + (mastoid height * 0.081) + (bigonial breadth * 0.037) + (maximum ramus height * 0.074) + (mandibular length * −0.046) + (−20.182); SP = −0.221N146180326
%88.0%85.7%86.7%
African American
Y = (bizygomatic breadth * 0.335) + (biauricular breadth * −0.188) + (minimum frontal breadth * −0.185) + (mastoid height * 0.123) + (bicondylar breadth * −0.089) + (maximum ramus height * 0.185) + (−9.561); SP = −0.312N323062
%84.2%88.2%86.1%
Asian American
Y = (basion–nasion length * 0.142) + (frontal chord * 0.102) + (mastoid height * 0.101) + (−29.68); SP = −0.6335N155267
%93.8%86.7%88.2%
European American
Y = (bizygomatic breadth * 0.14) + (orbital height * −0.337) + (bigonial breadth * 0.079) + (maximum ramus height * 0.109) + (mandibular length * −0.085) + (−13.013); SP = −0.059N313364
%81.6%80.5%81.0%
Latin American
Y = (bizygomatic breadth * 0.136) + (maximum ramus height * 0.106) + (−24.507); SP = −0.087N343064
%82.9%71.4%77.1% c
Native American
Y = (glabella occipital length * 0.082) + (orbital height * −0.197) + (mastoid height * 0.082) + (bigonial breadth * 0.102) + (maximum ramus height * 0.075) + (−25.132); SP = −0.248N294069
%80.6%90.9%86.3%
a All class means were statistically significant (p ≤ 0.05). b Below SP = AFAB; above SP = AMAB. c Significantly different overall accuracy compared to the population-inclusive model (p ≤ 0.05, 2-tailed).
Table 6. Applied classification accuracies for the discriminant function models.
Applied Model Classification Statistics
AFABAMABOverall
Population-InclusiveN150177327
%90.4%84.3%87.0%
African AmericanN343569
%89.5%100%95.0%
Asian AmericanN155469
%93.8%90.0%91.0%
European AmericanN323668
%84.2%87.8%86.0%
Latin AmericanN353065
%85.4%71.4%78.0% a
Native AmericanN294271
%80.6%95.5%89.0%
a Significantly different accuracy compared to the population-inclusive model (p ≤ 0.05, 2-tailed).
Table 7. Mixed-model population-inclusive (nonmetric and metric) binary logistic regression models.
Stepwise-Selected Classification Functions a,bClassification Statistics
AFABAMABOverall
Population-Inclusive
Y = (glabella * 1.13) + (mastoid * 0.957) + (mental eminence * 0.594) + (glabella occipital length * 0.102) + (bizygomatic breadth * 0.1620) + (maximum ramus height * 0.147) + (mandibular length * −0.101) + (−44.921)N111182293
%88.8%93.3%91.6%
Population-Inclusive c
Y = (glabella score * 2.027) + (bizygomatic breadth * 0.263) + (−38.097)N325385
%84.2%89.8%87.6%
a Sectioning point is 0.5; below = AFAB; above = AMAB. b All class means were significantly different (p ≤ 0.05). c Tested on the population-inclusive 30% HOS.
Table 8. Mixed-model population-inclusive applied binary logistic regression classification accuracies.
Applied Model Classification Statistics
AFABAMABOverall
Population-InclusiveN141160301
%88.1%89.3%88.8%
Population-Inclusive aN5257109
%91.2%86.8%88.8%
a Tested on the population-inclusive 30% HOS.
Table 9. Intraobserver error rates for the nonmetric trait scores.
Morphological Traits aKappa ValueLevel of Agreement bAsymptotic SEApproximate T
Nuchal crest0.365Fair0.0815.839
Mastoid0.563Moderate0.0887.267
Supraorbital margin0.432Moderate0.0886.097
Glabella0.531Moderate0.0837.393
Mental eminence0.452Moderate0.0886.210
a All class means were statistically significant (p ≤ 0.001). b As defined by Landis and Koch [94].
Table 10. Intraobserver error rates for metric measurements a.
MeasurementValid Cases (n)Valid Cases (%)Excluded Cases (n)Total Cases (n)ICC (for Average Measures)95% Confidence Interval
Glabella occipital length5198.1%1520.9890.980–0.994
Bizygomatic breadth52100%0520.9310.880–0.960
Basion–bregma height4688.5%6520.8250.682–0.903
Basion–nasion length5198.1%1520.9230.865–0.956
Biauricular breadth5096.2%2520.9090.836–0.949
Nasion–prosthion height3873.1%14520.9810.961–0.990
Minimum frontal breadth52100%0520.8800.792–0.931
Nasal height5198.1%1520.9410.896–0.966
Orbital height52100%0520.9300.877–0.960
Frontal chord4790.4%5520.9080.836–0.949
Parietal chord3873.1%14520.7770.575–0.883
Occipital chord3975.0%13520.9260.859–0.961
Foramen magnum breadth5198.1%1520.9800.965–0.988
Mastoid height5198.1%1520.8370.509–0.929
Bigonial breadth52100%0520.9870.978–0.003
Bicondylar breadth52100%0520.9380.893–0.965
Maximum ramus height52100%0520.9450.904–0.968
Mandibular length5096.2%2520.9040.813–0.948
a All class means were statistically significant (p ≤ 0.001).
Publisher’s Note: MDPI stays neutral with regard to jurisdictional claims in published maps and institutional affiliations.

