
Surface Characterization and Bulk Property Analysis of Aluminum Powders Treated with Hydrophobic Coatings: Stearic Acid and Phenyl-Phosphonic Acid


Abstract
:1. Introduction
2. Materials and Methods
2.1. Materials
2.2. Stearic Acid (SA-Al)
2.3. Phenyl-Phosphonic Acid (PPA-Al)
2.4. Diffuse Reflectance Infrared Spectroscopy
2.5. X-ray Photoelectron Spectroscopy
2.6. Bulk Density
2.7. FT4 Powder Rheometer® Measurements
3. Results and Discussion
3.1. Surface Characterization
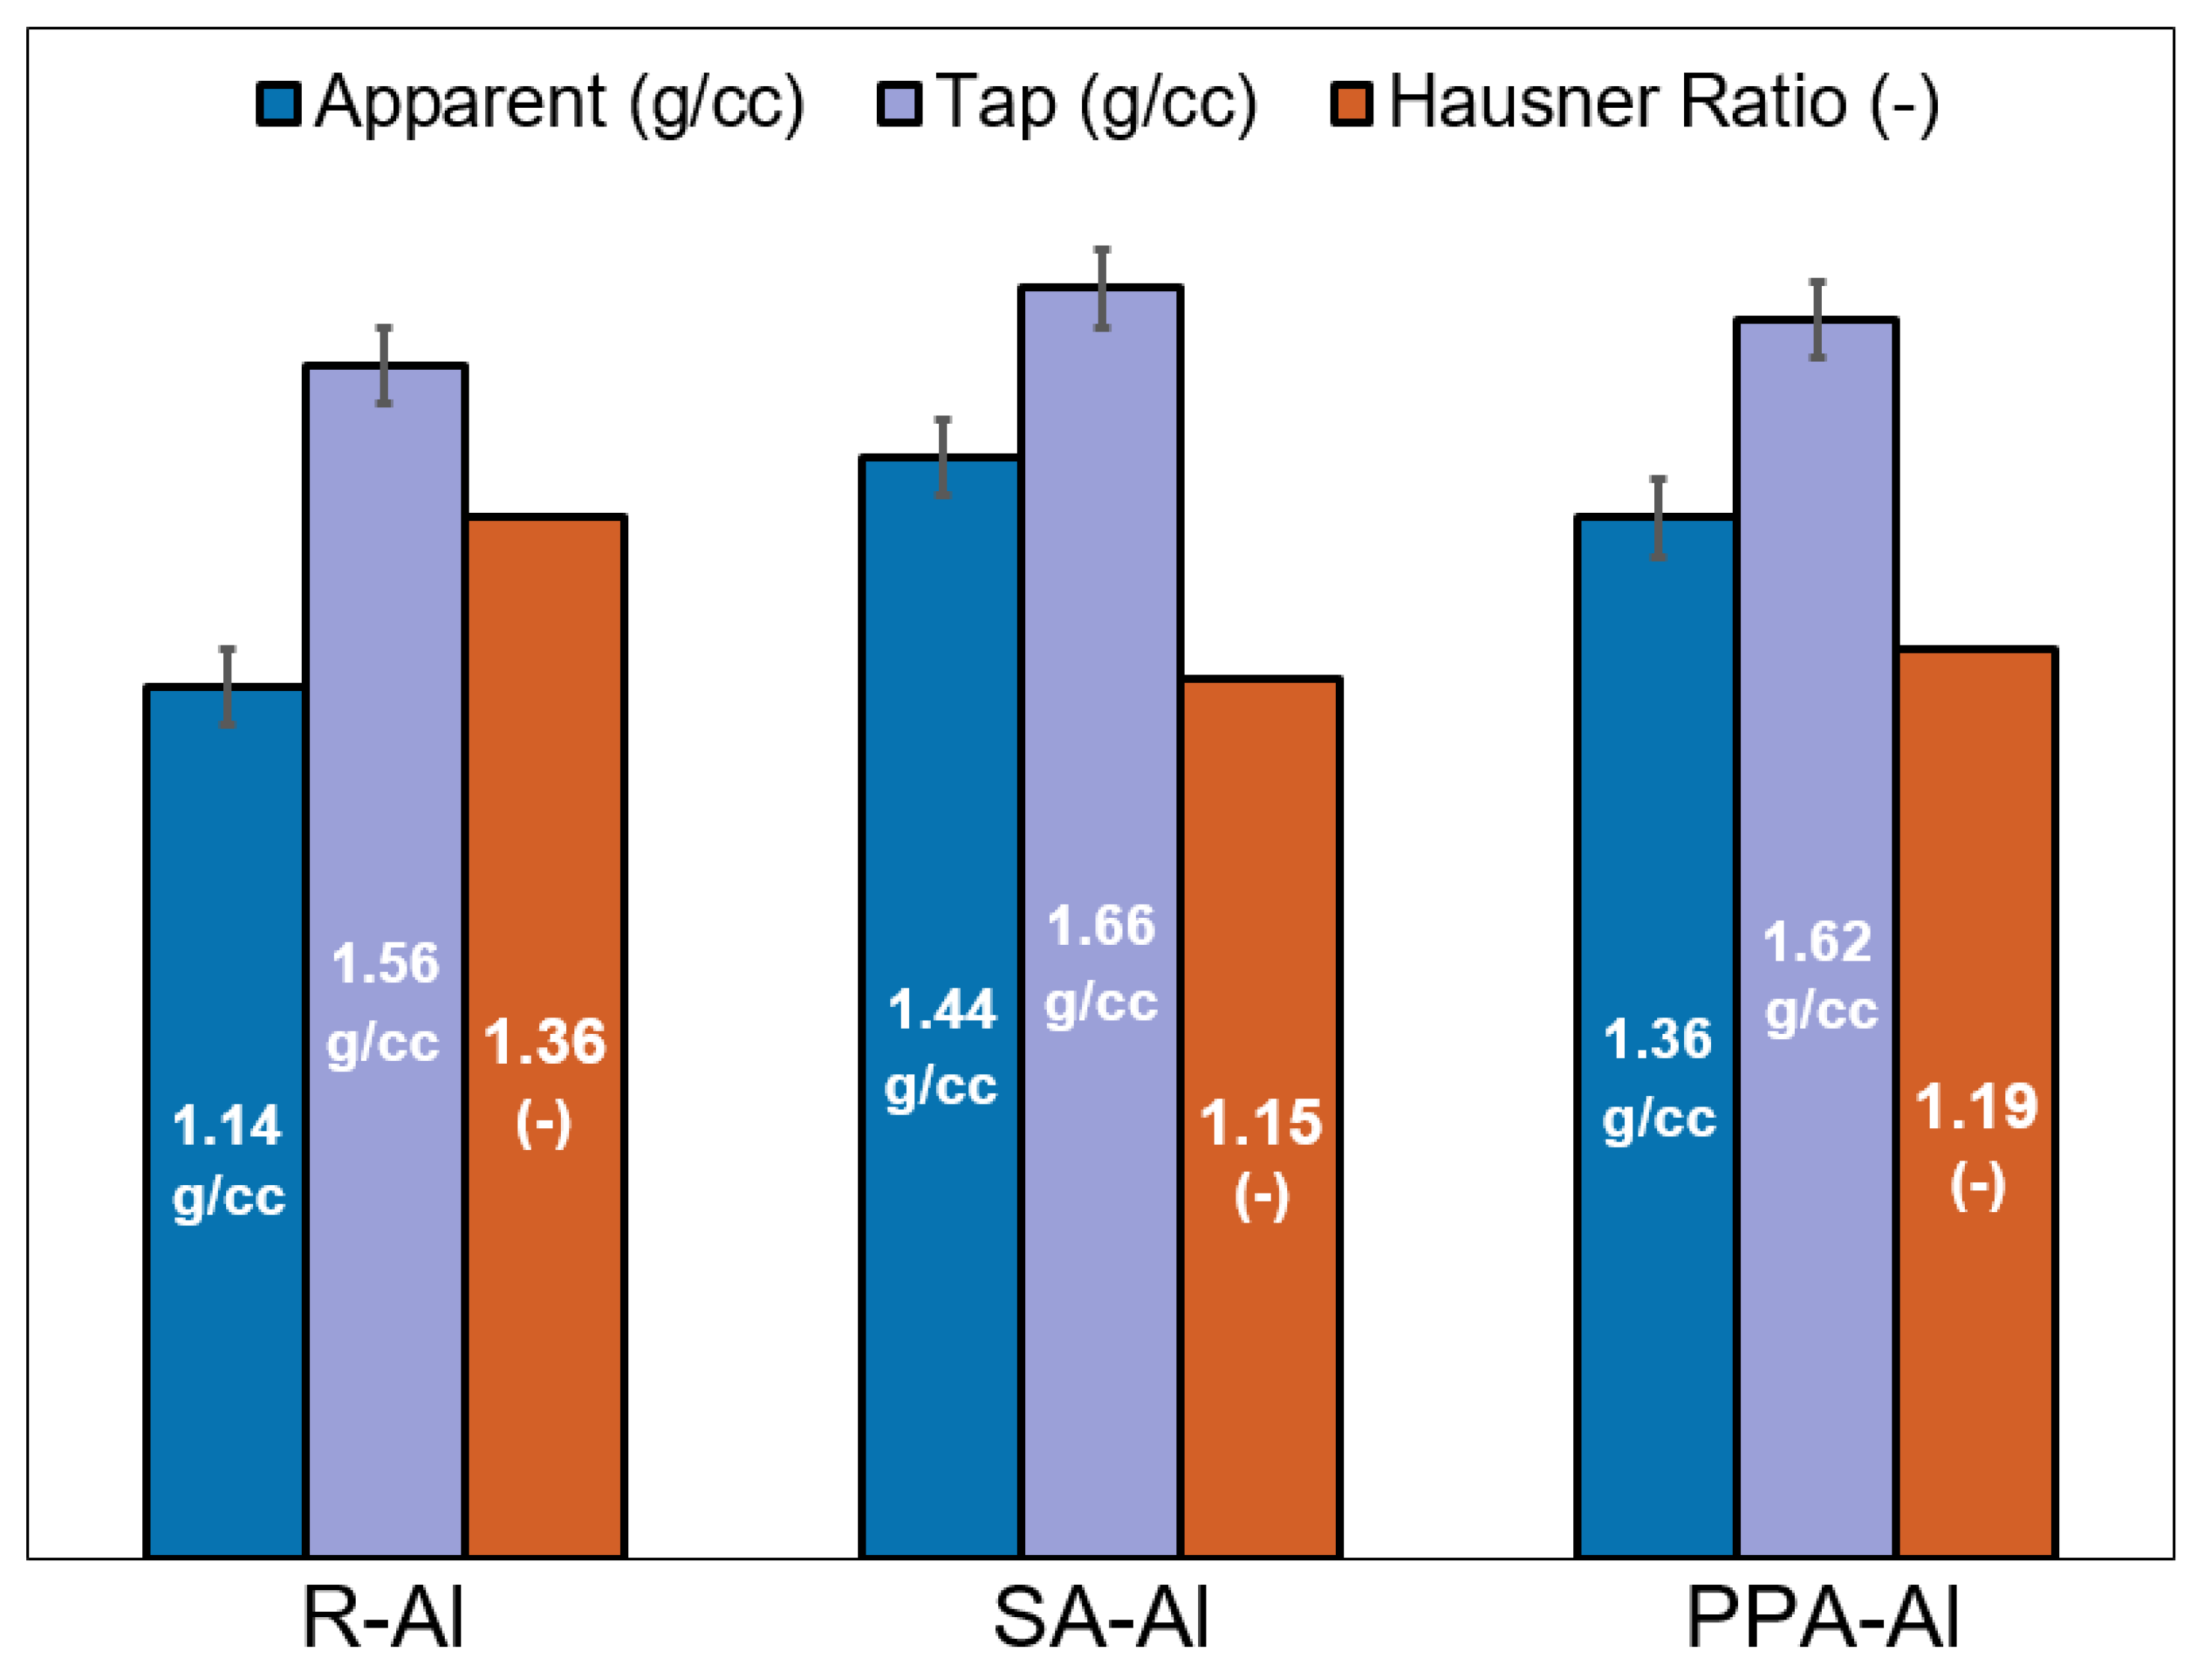
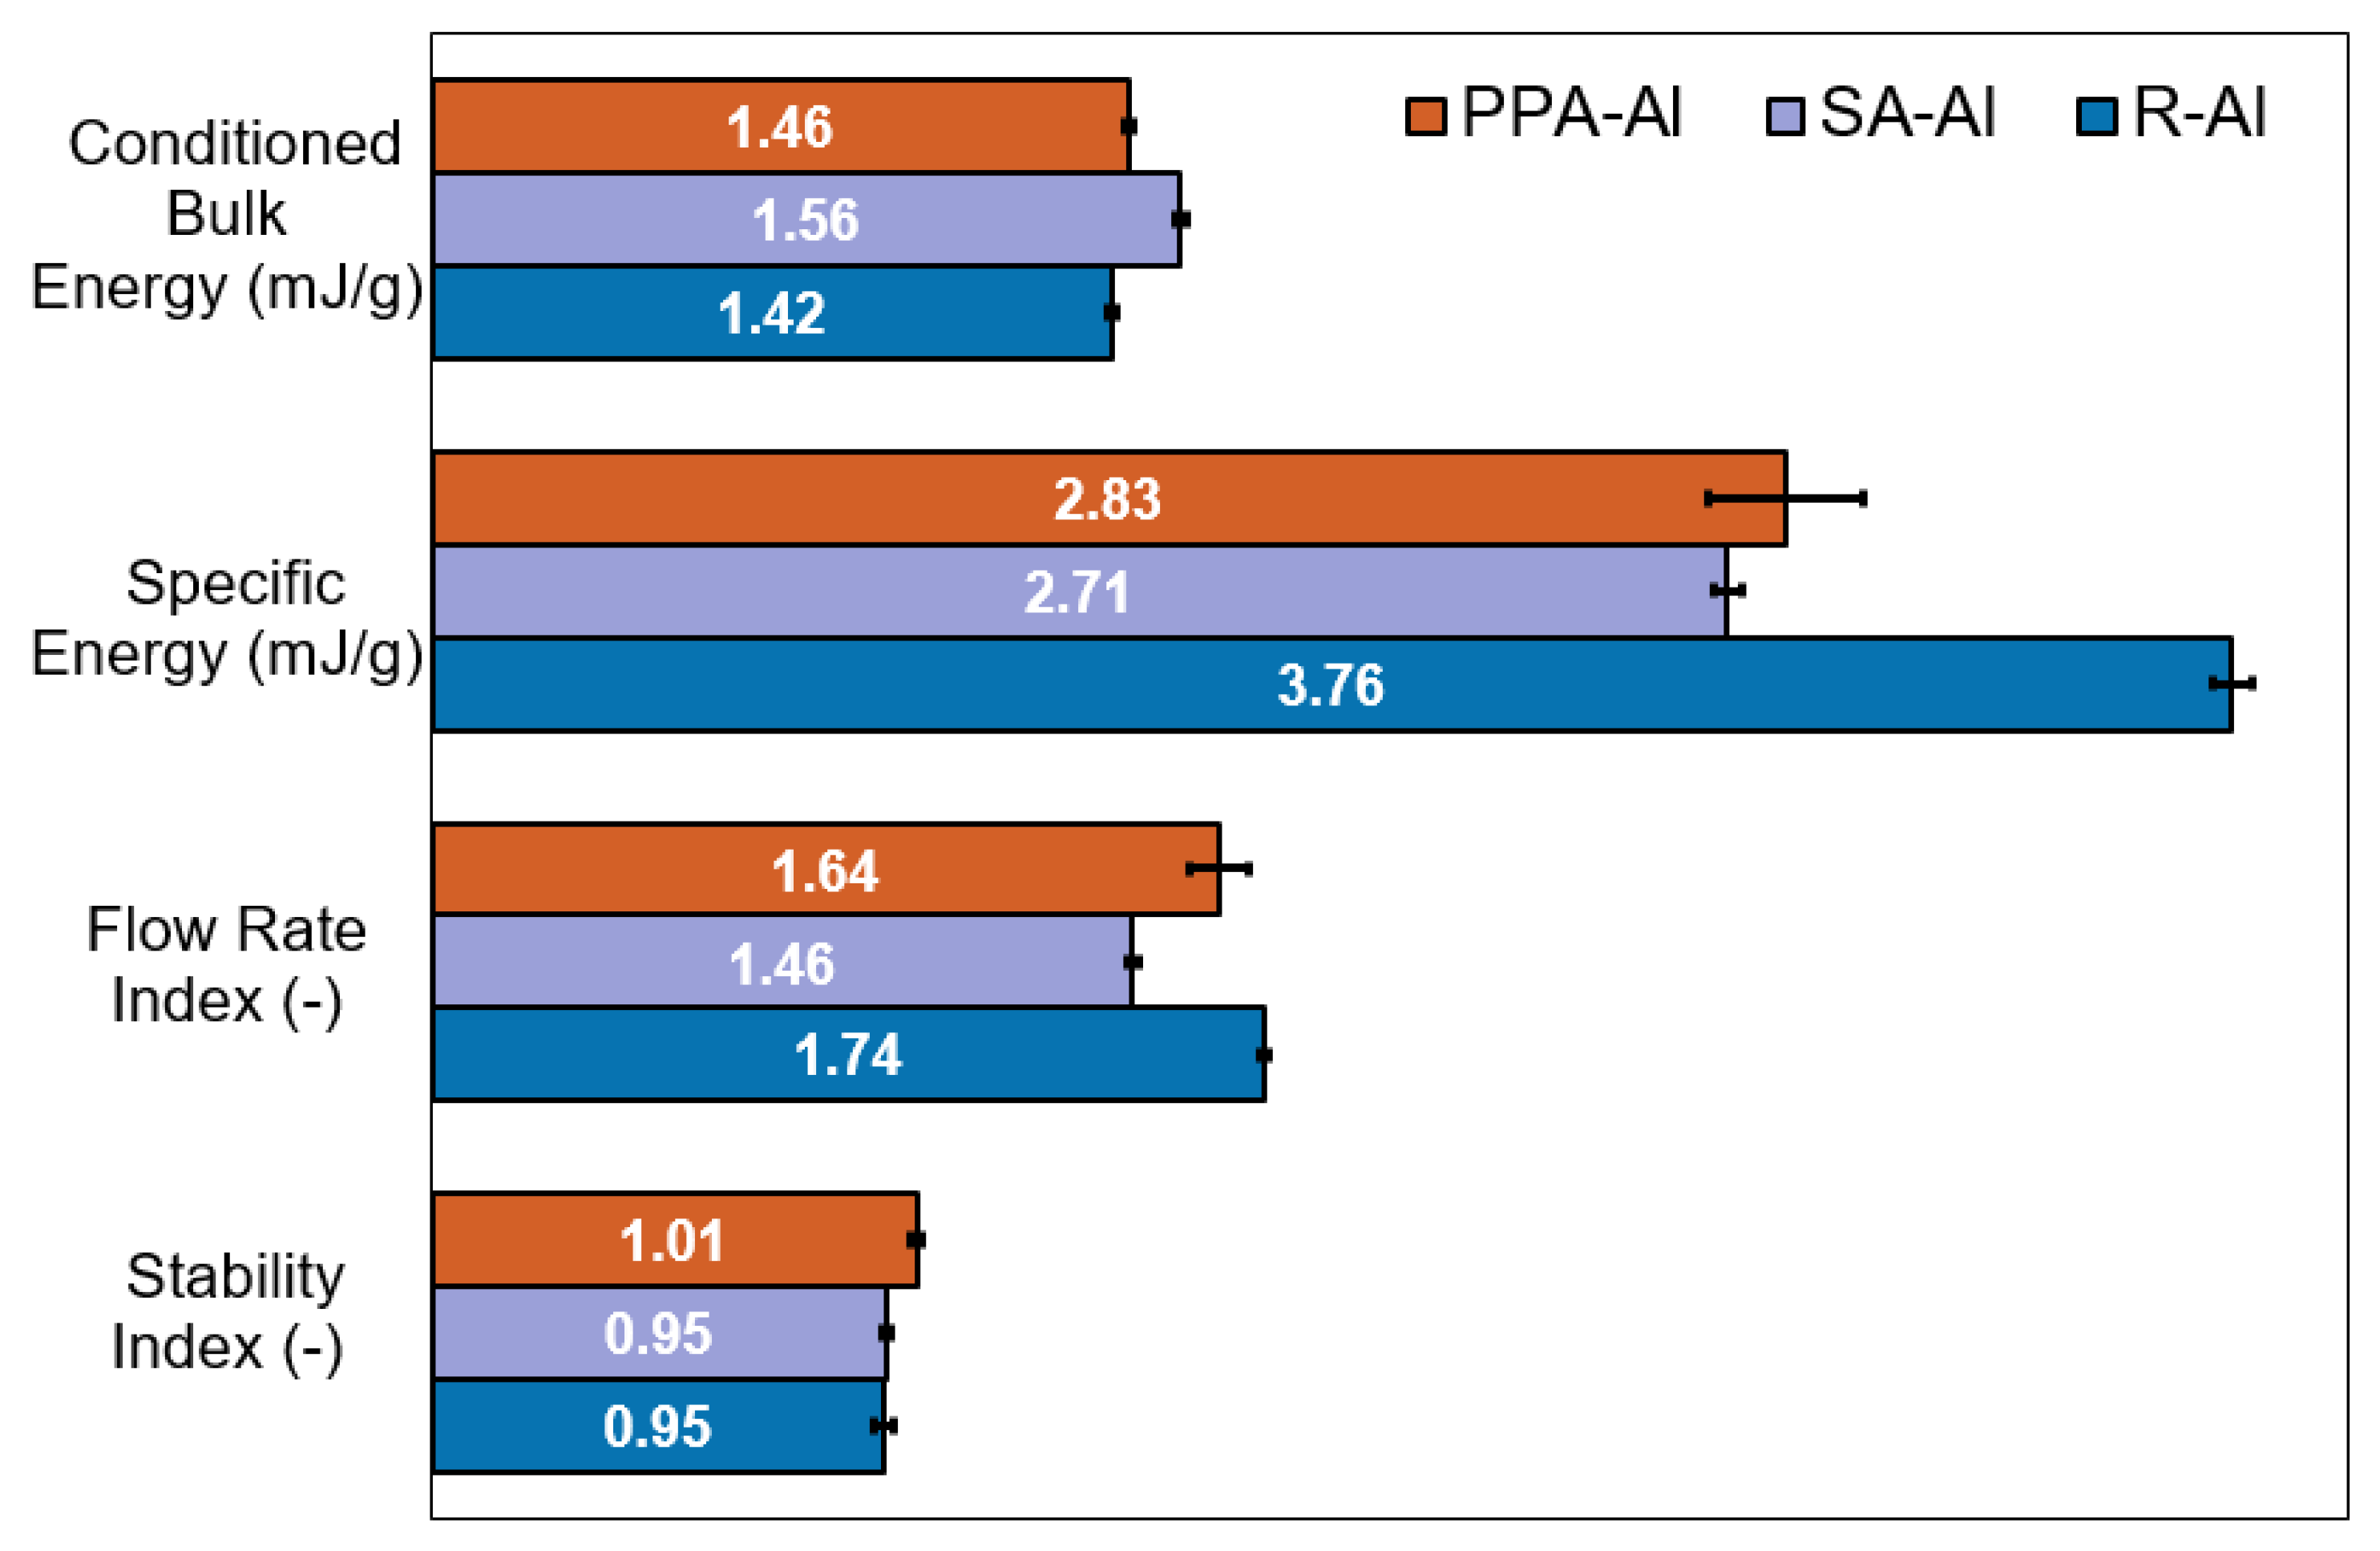
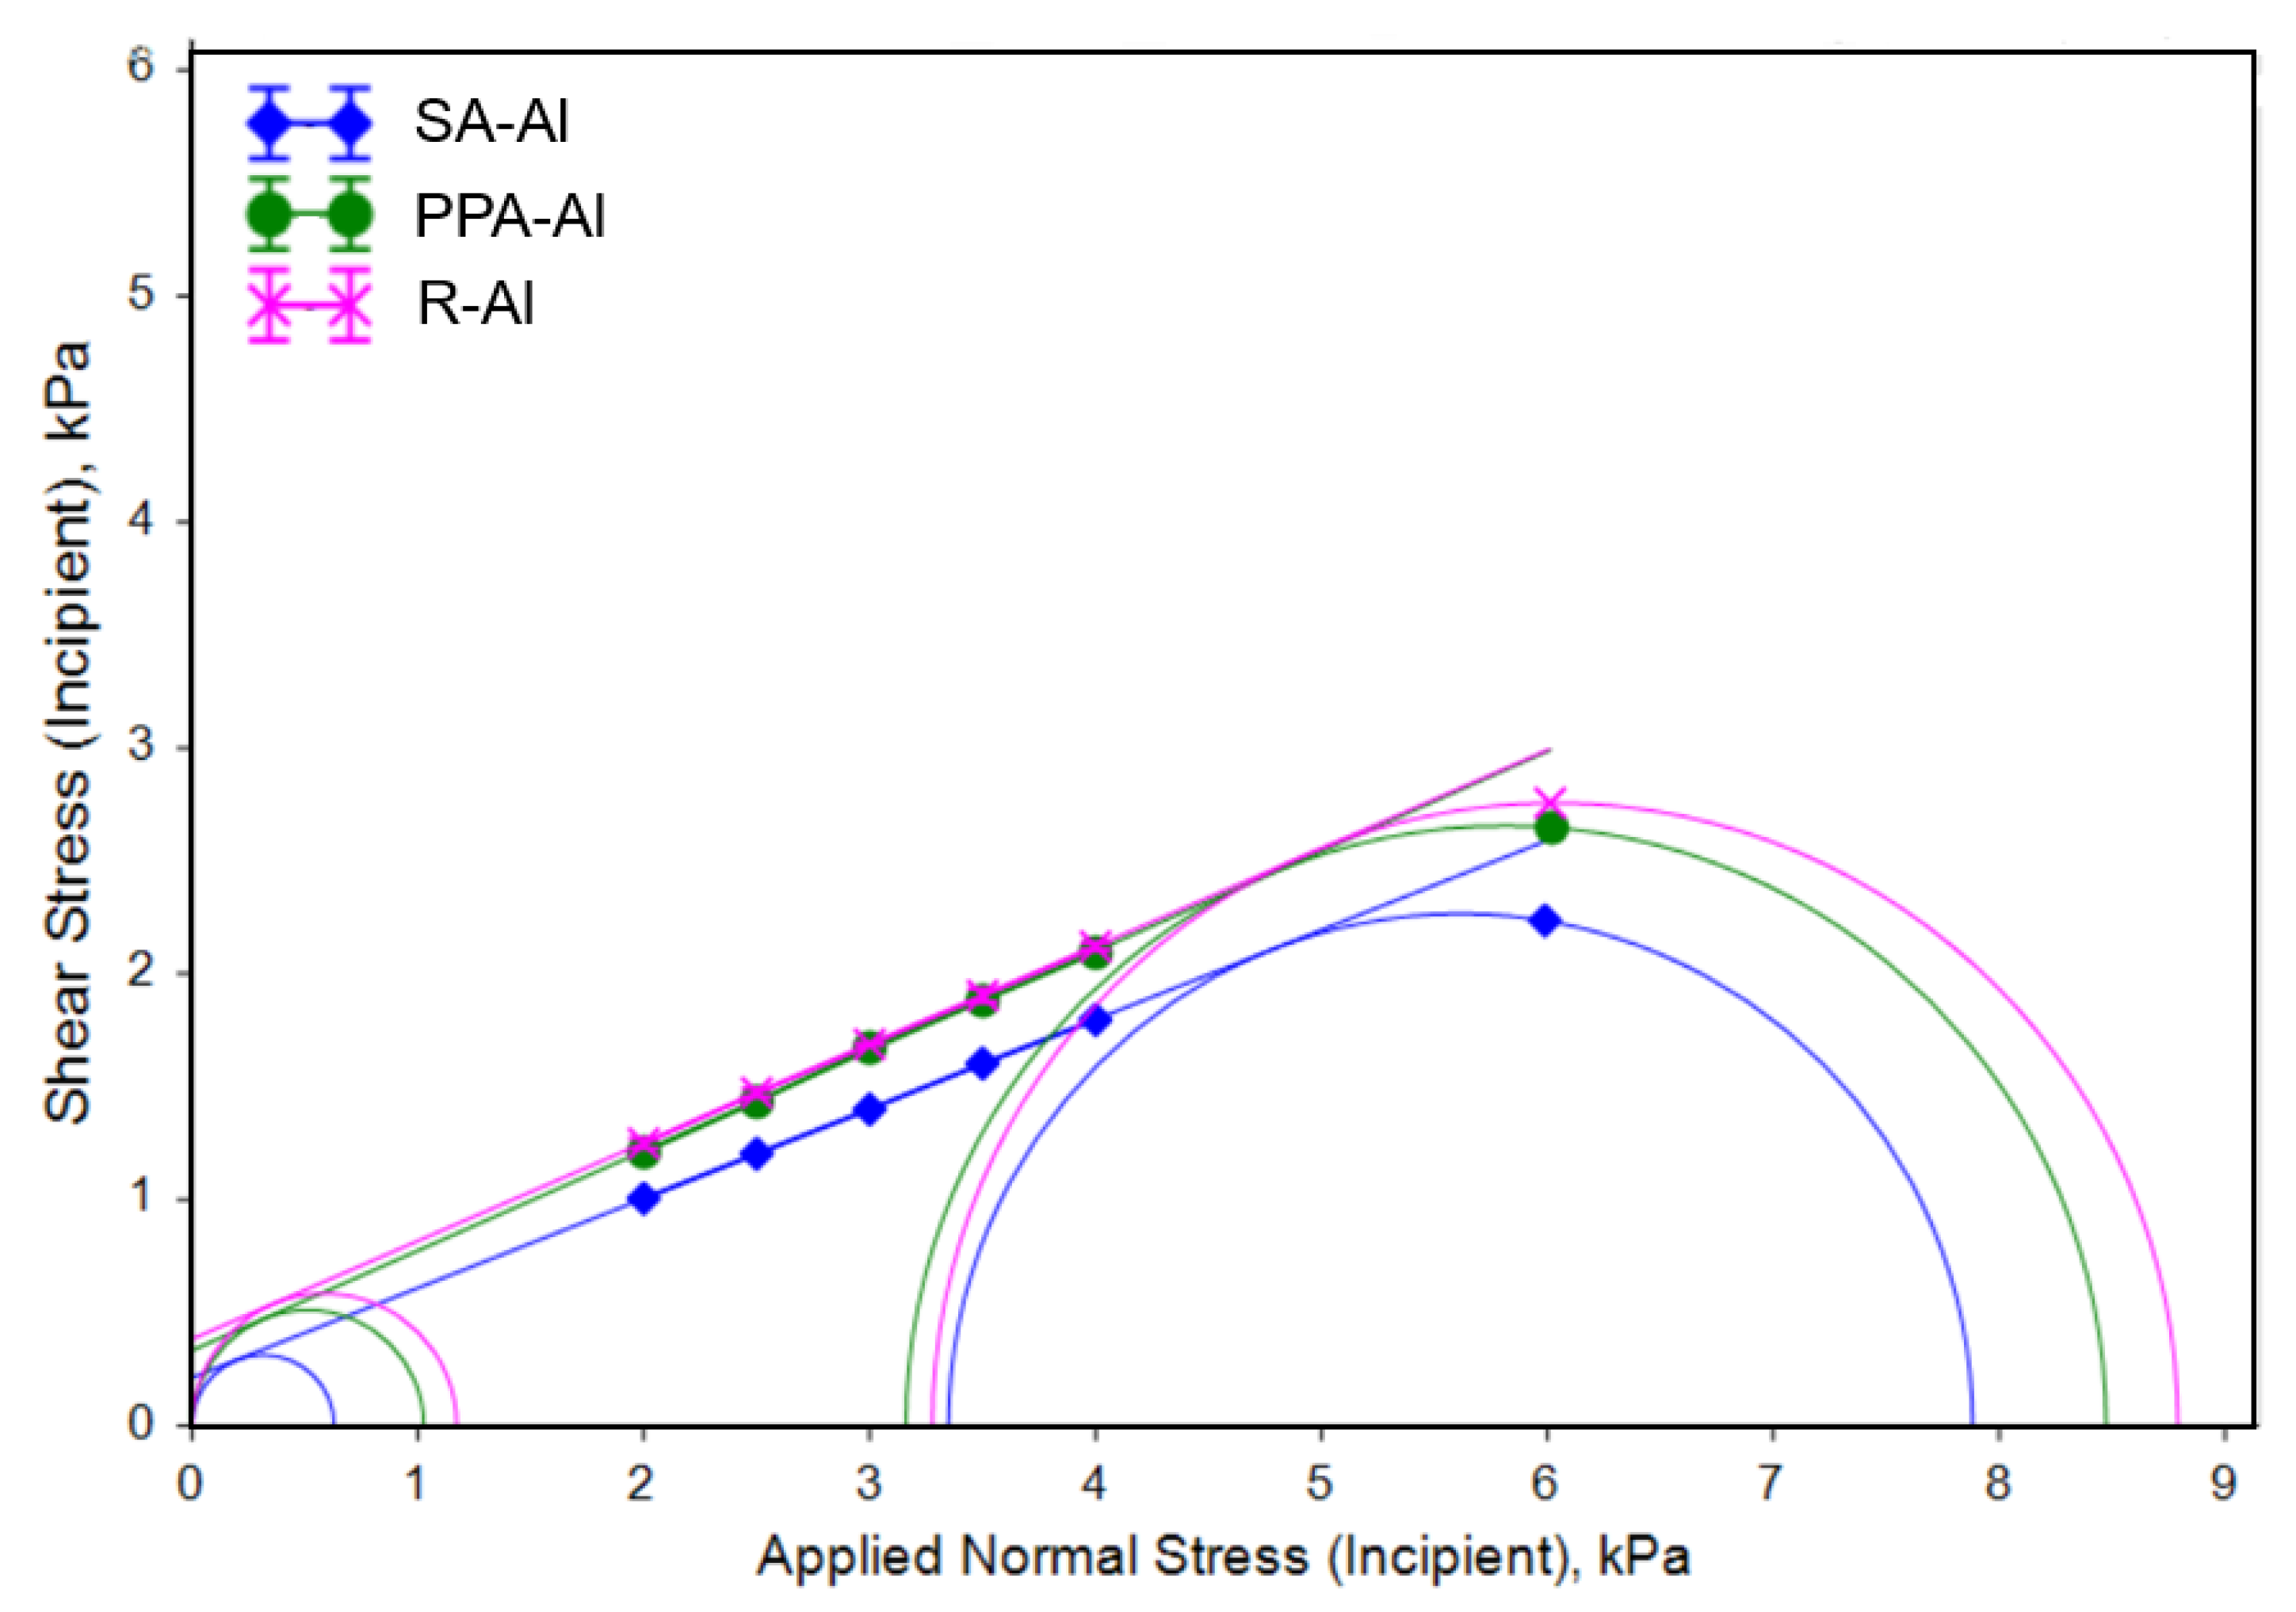
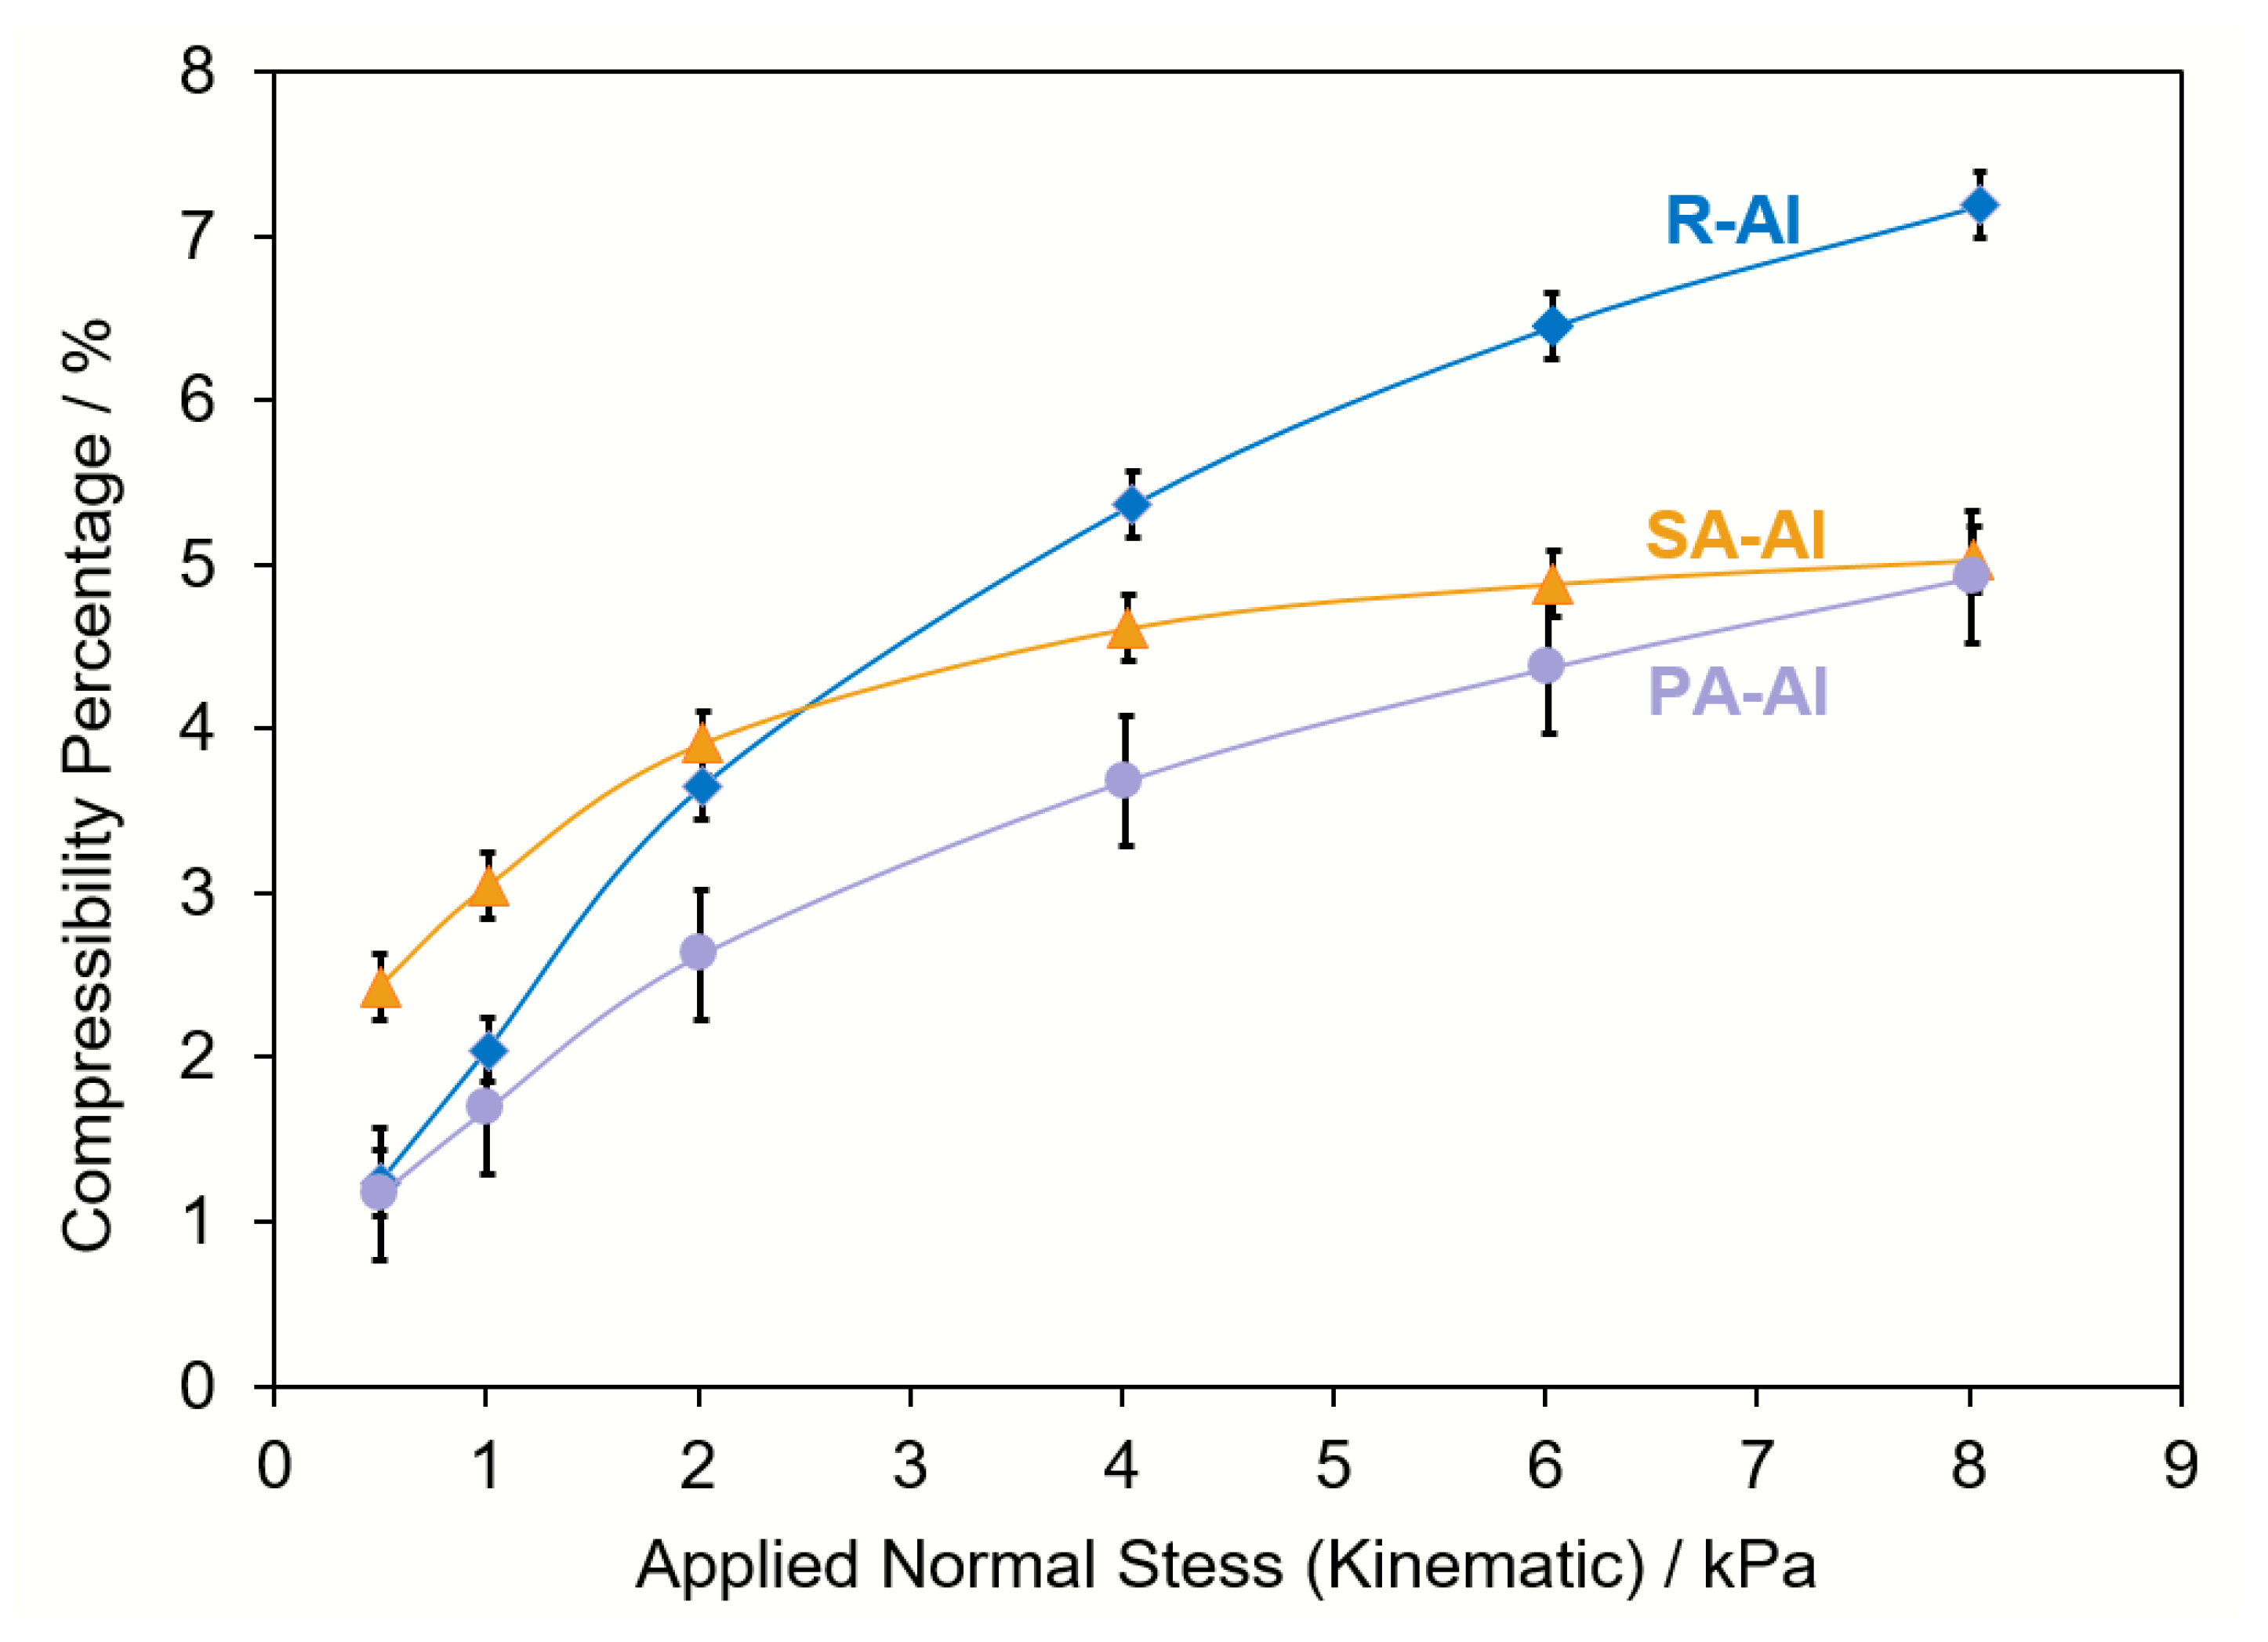
3.2. Comparison of Bulk Properties
4. Conclusions
Funding
Institutional Review Board Statement
Informed Consent Statement
Data Availability Statement
Acknowledgments
Conflicts of Interest
Abbreviations
| Apparent density (g/mL) | |
| CBD | Conditioned Bulk Density (g/mL) |
| DRIFTS | Diffuse Reflectance Infrared Fourier Transform Spectroscopy |
| FRI | Flow Rate Index (-) |
| Hausner Ratio (-) | |
| PPA-Al | Phenyl-phosphonic Acid Treated Aluminum Powder |
| R-Al | Raw aluminum powder |
| SI | Stability Index (-) |
| SA | Stearic Acid |
| SA-Al | Stearic Acid Treated Aluminum Powder |
| SE | Specific Energy (mJ/g) |
| Tap density (g/mL) | |
| XPS | X-ray photoelectron spectroscopy |
References
- Palmero, P.; Montanaro, L.; Reveron, H.; Chevalier, J. Surface coating of oxide powders: A new synthesis method to process biomedical grade nano-composites. Materials 2014, 7, 5012–5037. [Google Scholar] [CrossRef]
- Bidulsky, R.; Gobber, F.; Bidulska, J.; Ceroni, M.; Kvackaj, T.; Marco, A.G. Coated metal powders for laser powder bed fusion (L-PBF) processing: A review. Metals 2021, 11, 1831. [Google Scholar] [CrossRef]
- Foster, G.; Kempema, N.J.; Boyer, J.E.; Harris, J.R.; Yetter, R.A. Experimental investigation of aluminum-air burning velocity at elevated pressure. Combust. Flame. 2023, 248, 112532. [Google Scholar] [CrossRef]
- Przybyszewski, B.; Boczkowska, A.; Kozera, R.; Mora, J.; Garcia, P.; Aguero, A.; Borras, A. Hydrophobic and icephobic behaviour of polyurethane-based nanocomposite coatings. Coatings 2019, 9, 811. [Google Scholar] [CrossRef]
- Jallo, J.; Schoenitz, M.; Dreizin, E.L.; Dave, R.N.; Johnson, C.E. The effect of surface modification of aluminum powder on its flowability, combustion and reactivity. Powder Technol. 2010, 204, 63–70. [Google Scholar] [CrossRef]
- Chen, Y.; Jallo, J.; Quintanilla, M.A.S.; Dave, R. Characterization of particle and bulk level cohesion reduction of surface modified fine aluminum powders. Colloids Surf. A. 2010, 361, 60–80. [Google Scholar] [CrossRef]
- Ludwig, B.; Miller, T.F. Rheological and surface chemical characterization showing enhanced flowability and fluidization behavior for deliver applications. Powder Technol. 2015, 283, 380–388. [Google Scholar] [CrossRef]
- Ludwig, B.; Gray, J.L. The effect of gas phase polydimethylsiloxane surface treatment of metallic aluminum particles: Surface characterization and flow behavior. Particuology 2017, 30, 92–101. [Google Scholar] [CrossRef]
- Johansson, E.; Nyborg, L. XPS study of carboxylic acid layers on oxidized metals with reference to particulate materials. Surf. Interface Anal. 2003, 35, 375–381. [Google Scholar] [CrossRef]
- Nguyen, D.M.; Vu, T.N.; Nguyen, T.M.L.; Nguyen, T.D.; Thuc, C.N.H.; Bui, Q.B.; Colin, J.; Perré, P. Synergistic influences of stearic acid coating and recycled PET microfibers on the enhanced properties of composite materials. Materials 2020, 13, 1461. [Google Scholar] [CrossRef]
- Nguyen, T.T.; Nguyen, V.L.; Pham, T.T.H.; Pham, T.T.; Nguyen, T.D. Effects of Surface Modification with Stearic Acid on the Dispersion of Some Inorganic Fillers in PE Matrix. J. Compos. Sci. 2021, 5, 270. [Google Scholar] [CrossRef]
- Lim, M.S.; Feng, K.; Chen, X.; Wu, N.; Raman, A.; Nightingale, J.; Gawalt, E.S.; Korakakis, D.; Hornak, L.A.; Timperman, A.T. Adsorption and desorption of stearic acid self-assembled monolayers on aluminum oxide. Langmuir 2007, 23, 2444–2452. [Google Scholar] [CrossRef]
- Zang, D.; Zhu, R.; Zhang, W.; Wu, J.; Yu, X.; Zhang, Y. Stearic acid modified aluminum surfaces with controlled wetting properties and corrosion resistance. Corros. Sci. 2014, 83, 86–93. [Google Scholar] [CrossRef]
- Li, N.; Zhang, Y.; Guo, R.; Yang, J.; Zhang, X.; Wang, X. Effect of stearic acid coating on the explosion characteristics of aluminum dust. Fuel 2022, 320, 123880. [Google Scholar] [CrossRef]
- Yagyo, S.; Yoshitake, M.; Tsud, N.; Chikyow, T. Adsorption structure of phenyl-phosphonic acid on an alumina surface. Appl. Surf. Sci. 2009, 256, 1140–1143. [Google Scholar] [CrossRef]
- Lee, J.; Bong, J.; Ha, Y.G.; Park, S.; Ju, S. Durability of self-assembled monolayers on aluminum oxide for determining surface wettability. Appl. Surf. Sci. 2015, 330, 445–448. [Google Scholar] [CrossRef]
- Davies, P.R.; Newton, N.G. The chemisorption of organophosphorous compounds at an Al(111) surface. Appl. Surf. Sci. 2001, 181, 296–306. [Google Scholar] [CrossRef]
- Aresti, A.; Aragoneses, J.; Lopez-Valverde, N.; Suarez, A.; Aragoneses, J.M. Effectiveness of Biofunctionalization of Titanium Surfaces with Phosphonic Acid. Biomedicines 2021, 9, 1663. [Google Scholar] [CrossRef]
- Zhao, R.; Rupper, P.; Gaan, S. Recent Development in Phosphonic Acid-Based Organic Coatings on Aluminum. Coatings 2017, 7, 133. [Google Scholar] [CrossRef]
- Thissen, P.; Valtiner, M.; Grundmeier, G. Stability of phosphonic acid self-assembled monolayers on amorphous and single crystal aluminum oxide surfaces in aqueous solution. Langmuir 2010, 26, 156–164. [Google Scholar] [CrossRef]
- ASTM B527-06; Standard Test Method for Determination of Tap Density of Metallic Powders and Compounds. ASTM International: West Conshohocken, PA, USA, 2006.
- Hausner, H.H. Friction conditions in a mass of metal powder. J. Powder Metall. 1967, 3, 7–13. [Google Scholar]
- Dote, J.L.; Mowery, R.L. Infrared reflectance-absorption spectra of Langmuir-Blodgett stearic acid monolayers on gold and aluminum, influence of substrate. J. Phys. Chem. 1988, 92, 1571–1575. [Google Scholar] [CrossRef]
- Morterra, C.; Magnacca, G. A case study: Surface chemistry and surface structure of catalytic alumina as studied by vibrational spectroscopy of adsorbed species. J. Catal. Today 1996, 27, 497. [Google Scholar] [CrossRef]
- Silverstein, R.M.; Webster, F.X. Spectrometric Identification of Organic Compounds, 6th ed.; Wiley: Hoboken, NJ, USA, 1998; p. 142. [Google Scholar]
- Raman, A.; Quinones, R.; Barriger, L.; Eastman, R.; Parsi, A.; Gawalt, E.S. Understanding Organic Film Behavior on Alloy and Metal Oxides. Langmuir 2009, 26, 1747–1754. [Google Scholar] [CrossRef]
- Koh, S.E.; McDonald, K.D.; Holt, D.H.; Dulcey, C.S.; Chaney, J.A.; Pehrsson, P.E. Phenylphosphonic Acid Functionalization of Indium Tin Oxide: Surface Chemistry and Work Functions. Langmuir 2006, 22, 6249–6255. [Google Scholar] [CrossRef]


| Value | Group | Designation |
|---|---|---|
| >1.4 | C | Cohesive |
| 1.4−1.25 | A−C | Transition Group |
| <1.25 | A | Aeratable |
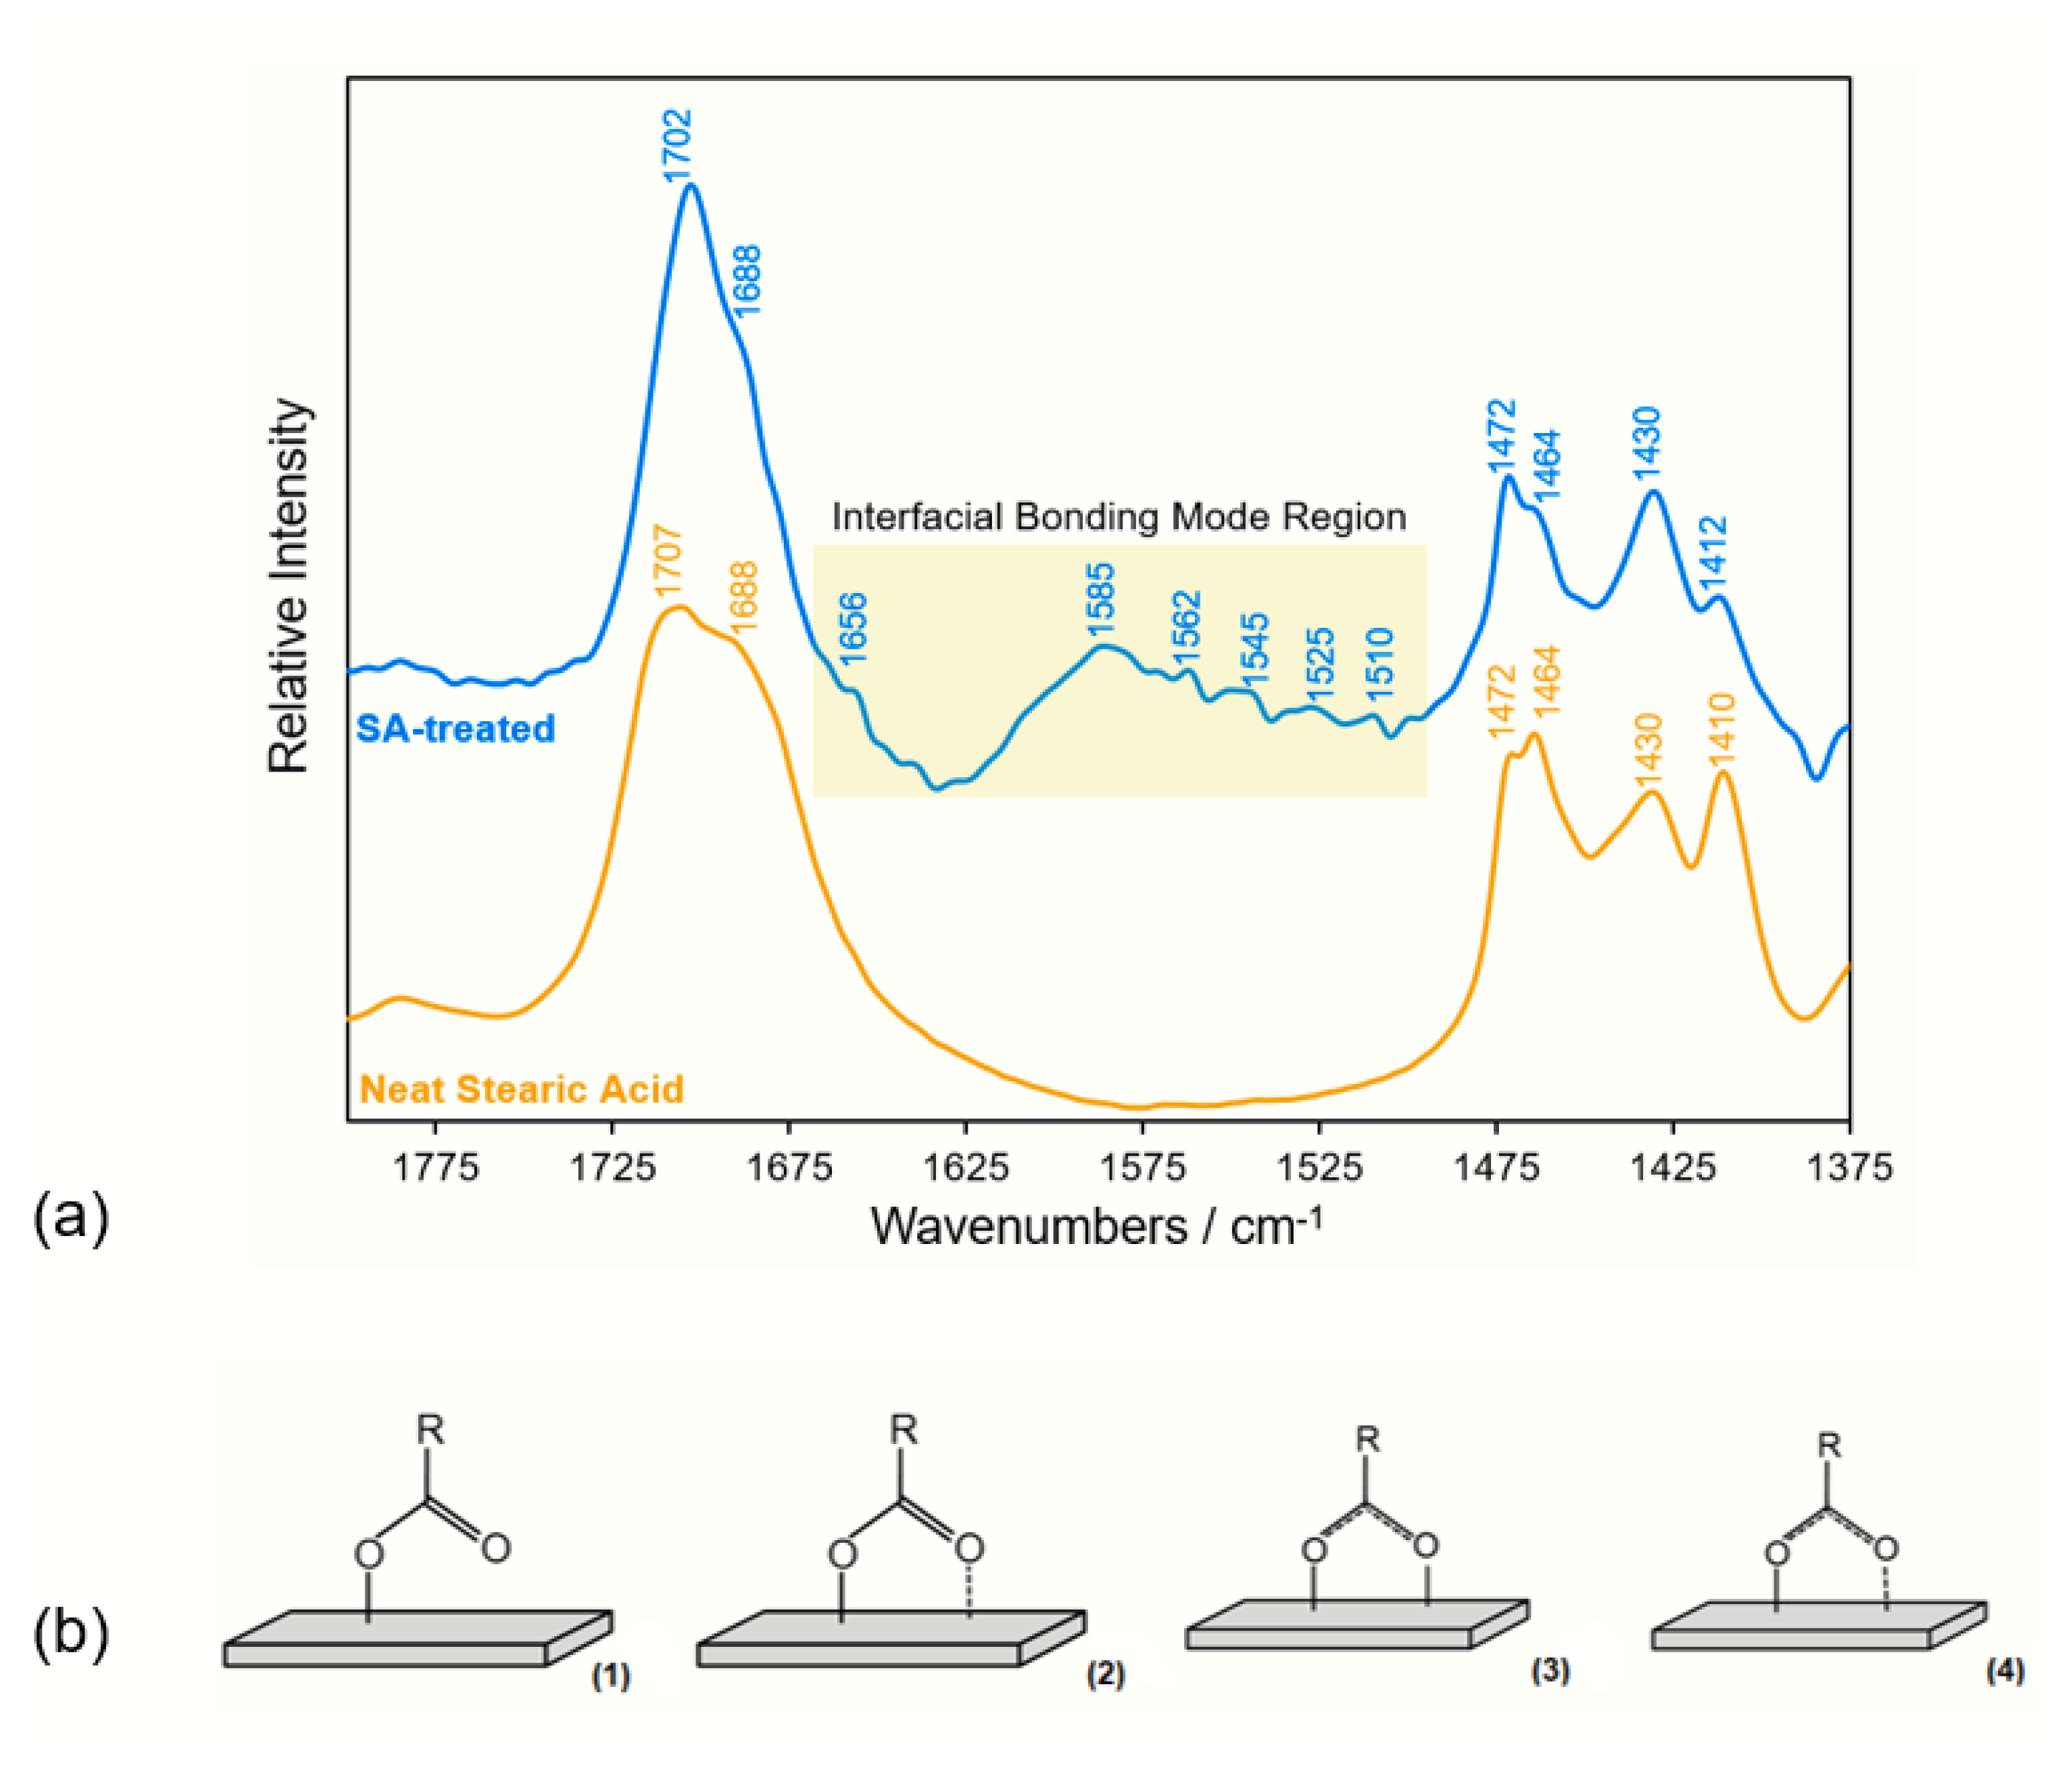
| Label | Peak or Band (cm−1) | References |
|---|---|---|
| 1472 | [12,13,23] | |
| 1510 | [12,13,23] | |
| 1584 | [12,13,23] | |
| 1656 | [12,13,23] | |
| 1688 | [12,13,23] | |
| 1702 | [12,13,23] |
Disclaimer/Publisher’s Note: The statements, opinions and data contained in all publications are solely those of the individual author(s) and contributor(s) and not of MDPI and/or the editor(s). MDPI and/or the editor(s) disclaim responsibility for any injury to people or property resulting from any ideas, methods, instructions or products referred to in the content. |
© 2023 by the author. Licensee MDPI, Basel, Switzerland. This article is an open access article distributed under the terms and conditions of the Creative Commons Attribution (CC BY) license (https://creativecommons.org/licenses/by/4.0/).
Share and Cite
Ludwig, B. Surface Characterization and Bulk Property Analysis of Aluminum Powders Treated with Hydrophobic Coatings: Stearic Acid and Phenyl-Phosphonic Acid. Solids 2024, 5, 1-13. https://doi.org/10.3390/solids5010001
Ludwig B. Surface Characterization and Bulk Property Analysis of Aluminum Powders Treated with Hydrophobic Coatings: Stearic Acid and Phenyl-Phosphonic Acid. Solids. 2024; 5(1):1-13. https://doi.org/10.3390/solids5010001
Chicago/Turabian StyleLudwig, Bellamarie. 2024. "Surface Characterization and Bulk Property Analysis of Aluminum Powders Treated with Hydrophobic Coatings: Stearic Acid and Phenyl-Phosphonic Acid" Solids 5, no. 1: 1-13. https://doi.org/10.3390/solids5010001