Article

Effect of Vanadium Catalysts on Hydrogen Evolution from NaBH4

by
Piotr Antoni Orłowski
1,2,* and
Wojciech Grochala
1,*
1
Centre of New Technologies, University of Warsaw, Żwirki i Wigury 93, 02-089 Warsaw, Poland
2
Faculty of Chemistry, University of Warsaw, Pasteura 1, 02-093 Warsaw, Poland
*
Authors to whom correspondence should be addressed.
Solids 2022, 3(2), 295-310; https://doi.org/10.3390/solids3020021
Submission received: 20 January 2022 / Revised: 15 May 2022 / Accepted: 16 May 2022 / Published: 18 May 2022
(This article belongs to the Special Issue Solids in Europe)

Abstract

:
NaBH4 is a very cheap and hydrogen-rich material, as well as a potential hydrogen store. However, the high temperature of its thermal decomposition (above 530 °C) renders it inapplicable in practical use. Here, we studied the effect of addition of diverse V-containing catalysts on thermal hydrogen desorption. It turns out that mechanochemical doping of NaBH4 with vanadium metal, its oxides, or nanoparticles lowers the temperature of pyrolysis significantly. Notably, NaBH4 milled for 3 h with 25 wt.% V2O5 or VO2 releases ca. 70% of stored hydrogen in the temperature range of ca. 370–450 °C. On the other hand, precursors and solvents used to prepare rather uniform vanadium nanoparticles (~4 nm) suspended in THF or less uniform and larger ones (~15 nm) in o- difluorobenzene have adverse effect on the purity of hydrogen evolved.

1. Introduction

Fossil fuels have been widely used as an energy source all over the world for centuries. Their intense usage has led to environmental pollution and climate change, and this has forced humanity to seek alternative, green energy sources and carriers. Hydrogen, next to none in its high gravimetric energy density, is a clean source of energy, with its combustion resulting only in water. This makes it a promising alternative to both fossil energy carriers and electric energy accumulators [1,2,3,4,5].
Sodium borohydride is one of the cheapest and most hydrogen-rich compounds known, having highly competitive volumetric hydrogen density [6]. Therefore, it is not surprising that much effort has been devoted to the possibility of using it as a hydrogen storage material. Hydrogen can be released from NaBH4 either during its hydrolysis or upon thermal decomposition. Hydrolysis reactions in alkaline aqueous solutions take place at room temperature upon contact with a catalyst (so called Hydrogen-on-demand® technology [7]). However, the reversibility of this process is poor, as it is associated with the necessity to recycle very stable oxoborates(III) back to BH4 species. On the other hand, the pyrolysis profile has a maximum desorption peak above 500 °C [8] (values up to 534 ± 10 °C at 1 bar of hydrogen [9] are given in the literature), which is quite high for mobile applications. Three main approaches taken to lower the decomposition temperature are catalytic enhancement of pyrolysis, tuning it via hydride mixing, and nanosizing of hydrogen-containing species [10,11,12]. Various dopants have been studied by numerous teams, and we can group them for convenience into four main categories (Table 1, Table 2, Table 3 and Table 4): (I) first-period transition metal (TM) elements and their compounds, (II) second-period TM elements and their compounds, (III) lanthanides and their compounds, and (IV) other hydrides. Additionally, composites of NaBH4 with diverse “inert” materials such as graphene and zeolites have been prepared, and their thermal profiles have been studied (Table 5). Last but not the least, attempts to prepare NaBH4 nanoparticles to decrease the thermal decomposition temperature of the pristine material are gathered in the last group (Table 6).
Some of the most spectacular results achieved via doping with the first-period TM species (Table 1) were seen for zinc(II) fluoride and titanium(III) chloride, which evolve hydrogen around 95 and 100 °C, respectively. However, as typical for the rather low temperature of thermal decomposition, H2 gas is, in these cases, severely polluted with B2H6 or B2H6 and diglyme. For metals from the second TM period (Table 2), the lowest temperature of thermal decomposition of 379 °C was achieved for 10%mol and 15%mol doping with NbF5. The third-period TM catalysts were also tested but the decrease in thermal decomposition temperature was not impressive (TaCl5—460 °C and ReCl3—465 °C [14]). In lanthanide series (Table 3), the best result was achieved for neodymium fluoride doping (413 °C).
Co-milling NaBH4 with other hydrogen storage materials (Table 4), particularly protic ones, often leads to facile evolution of H2 from a composite system. As for NaBH4, particularly promising results were achieved for 5 wt.% Co-Ni-B doped 2NaNH2/NaBH4 mixture, milled in hexane environment, for which the temperature of pyrolysis with H2 evolution dropped to a value as low as 285 °C. However, hydridic–protic stores rarely show sufficient reversibility [54,55].
If composites with diverse “inert” materials are considered (Table 5), substantial (45 wt.%) fluorographite addition resulted in the thermal decomposition point of 141 °C; an also interesting approach with the use of ionic liquid led to pure hydrogen desorption starting at 104 °C. Other composites usually yielded less appealing results.
The last group of proposed NaBH4 modifications involves either nanostructurization or coating it with metal or graphene layers (Table 6) which could lead to a decomposition temperature as low as 350 °C for NaBH4 nanoparticles coated with cobalt.
It may be seen from the literature screening that vanadium compounds have rather seldom been used to modify the H2-release properties NaBH4, and only moderate results were achieved when using VF3, VF4, or V3B as catalysts. This is quite disappointing in view of the fact that, from 40 to 100 °C, the γ phase of vanadium(II) hydride is known to exist in equilibrium with hydrogen gas and its metallic β form [56]. This implies a rather low temperature of H2 release from VH2, especially in an H2-free atmosphere. Moreover, the process of H2 release from VH2 must have a rather low activation barrier, as it tends to be fast. Consequently, vanadium metal or its compounds (reduced in situ to VNPs) could act as catalysts and destabilize [BH4] anions present in NaBH4, thus decreasing the temperature of thermal decomposition of this material and leading to facile H2 evolution at low temperature. Therefore, in this study, we researched doping of sodium borohydride with vanadium, vanadium oxides (V2O3, VO2, V2O5), or vanadium nanoparticles and their effects on thermal stability of NaBH4 hydrogen storage material.

2. Experimental

2.1. Materials

NaBH4 (≥98%), LiAlH4 2.0 M solution in THF and catalysts V2O5 (≥99.6%), VO2 (≥99%), and V2O3 (99.99%) were purchased from Sigma Aldrich (St. Louis, MO, USA). Ph4PCl (98%) used in Ph4PBH4 synthesis was delivered by abcr GmbH (Karlsruhe, Germany). Solvents dichloromethane (DCM) (≥99.8% ≤50 ppm H2O) and tetrahydrofuran (THF) (≥99.8%, ≤50 ppm H2O) were purchased from ROTH (Karlsruhe, Germany), while o-difluorobenzene (o-DFB) (98%) was obtained from Fluorochem (Hadfield, UK). Before synthesis, DCM and THF were dried with P2O5 and distilled; o-DFB was degassed using a Schlenk line and LN2. All solvents were then sealed in containers with 4 Å molecular sieves.

2.2. Equipment

A Vigor SG1200/750TS-F glovebox (Houston, TX, USA) was used for storing and preparing the samples; all reactions were performed in an inert gas (Ar) atmosphere (<10 ppm O2, <0.05 ppm H2O) or using a Schlenk line. Mechanochemical doping was conducted in a stainless-steel disc bowl using a Testchem vibration mill (1400 RPM). Suspensions of VNPs were firstly sonicated using Polsonic Sonic-6D in an ice-cooled water bath. Thermal decomposition analysis of the samples was investigated using a thermogravimeter (TGA) combined with differential scanning calorimeter (DSC) from Netzsch STA 409 PG (NETZSCH-Gerätebau GmbH, Selb, Germany) using Al2O3 crucibles. TGA/DSC chamber was constantly purged at a constant Ar (99.9999%) flow rate of 80 mL·min−1. The evolved gases were analyzed with a quadrupole mass spectrometer (MS) QMS 403 C (Pfeiffer Vacuum, Aβlar, Germany), connected to the TGA/DSC device by a quartz capillary preheated to 200 °C to avoid condensation of low-boiling volatiles. Fourier-transform infrared spectroscopy (FTIR) of all solid products of doping was measured using a Vertex 80v FT-IR spectrometer (Bruker, Billerica, MA, USA). Anhydrous KBr was used as a pellet material.

2.3. Synthesis and Doping

Vanadium nanoparticles (VNPs) were synthesized via reduction of vanadium(III) compounds. The THF suspension was prepared using vanadium (III) chloride and LiAlH4 solutions in THF. Then, 10 mL of a stoichiometric amount of reducer solution was added dropwise to 30 mL of 0.05 M solution of VCl3 under intense stirring. In the case of VNPs suspended in o-DFB, acetonitrile-coordinated vanadium(III) bis(tetra(nonafluoro-tert-butoxy)aluminate) monochloride (VCl(Al(OC(CF3)3)4)2·5ACN) was synthesized according to [57] and used as source of vanadium and tetraphenylphosphonium borohydride (Ph4PBH4) as a reducer and dissolved in o-DFB. Next, 20 mL of 0.015 M reducer solution was added dropwise to 20 mL of 0.005 M solution of vanadium salt, under intense stirring. Excess of the reducer was used to ensure complete reduction of vanadium cation. Both suspensions were stirred for 24 h before use and denoted in dependence of solvent used as VNPsTHF and VNPsO-DFB. Attempts of purification by centrifuging brought no results since VNPs could not be separated from their suspension that way and were used without further purification. The rationale behind the use of VNs is in their large specific area, which could imply fast and uniform catalysis of H2 evolution within the entire bulk of the hydrogen store.
Doping was carried out by mixing 5 or 25 wt.% of powder catalysts (V, V2O3, VO2, or V2O5) with NaBH4 and milling in 100 g batches for 5 or 30 min in milling periods of 1 and 5 min respectively, altered with liquid nitrogen (LN2) cooling to avoid overheating of samples. In addition, one V2O5 sample was also milled for 3 h in 20 min periods. The samples were then denoted using the Na:XY T pattern, where X stands for the catalyst used, Y is its wt.% amount, and T is the milling time; the samples were tested with TGA/DSC in 20–450 or 20–600 °C range with 5 K/min heating rate together with MS of evolved gases and compared with milled pure NaBH4 as reference. For activation energy studies of Na:V2O525%_180 min, three additional heating rates were used: 10, 1, and 0.5 K/min.
In the case of VNP doping (100 mg) of NaBH4, 2 or 10 mL of VNPsTHF or VNPsO-DFB, respectively, were added to the glass ampoule, which was firstly sonicated for 20 min in ice-cold bath, and then dried under a dynamic vacuum using a Schlenk line until the pressure dropped to 5 × 10⁻² mbar and for 30 min after. Samples were then transferred to a milling bowl, further milled for 30 min in the same way as powder-doped samples, and denoted Na:VNPsTHF and Na:VNPsO-DFB, respectively.

3. Results

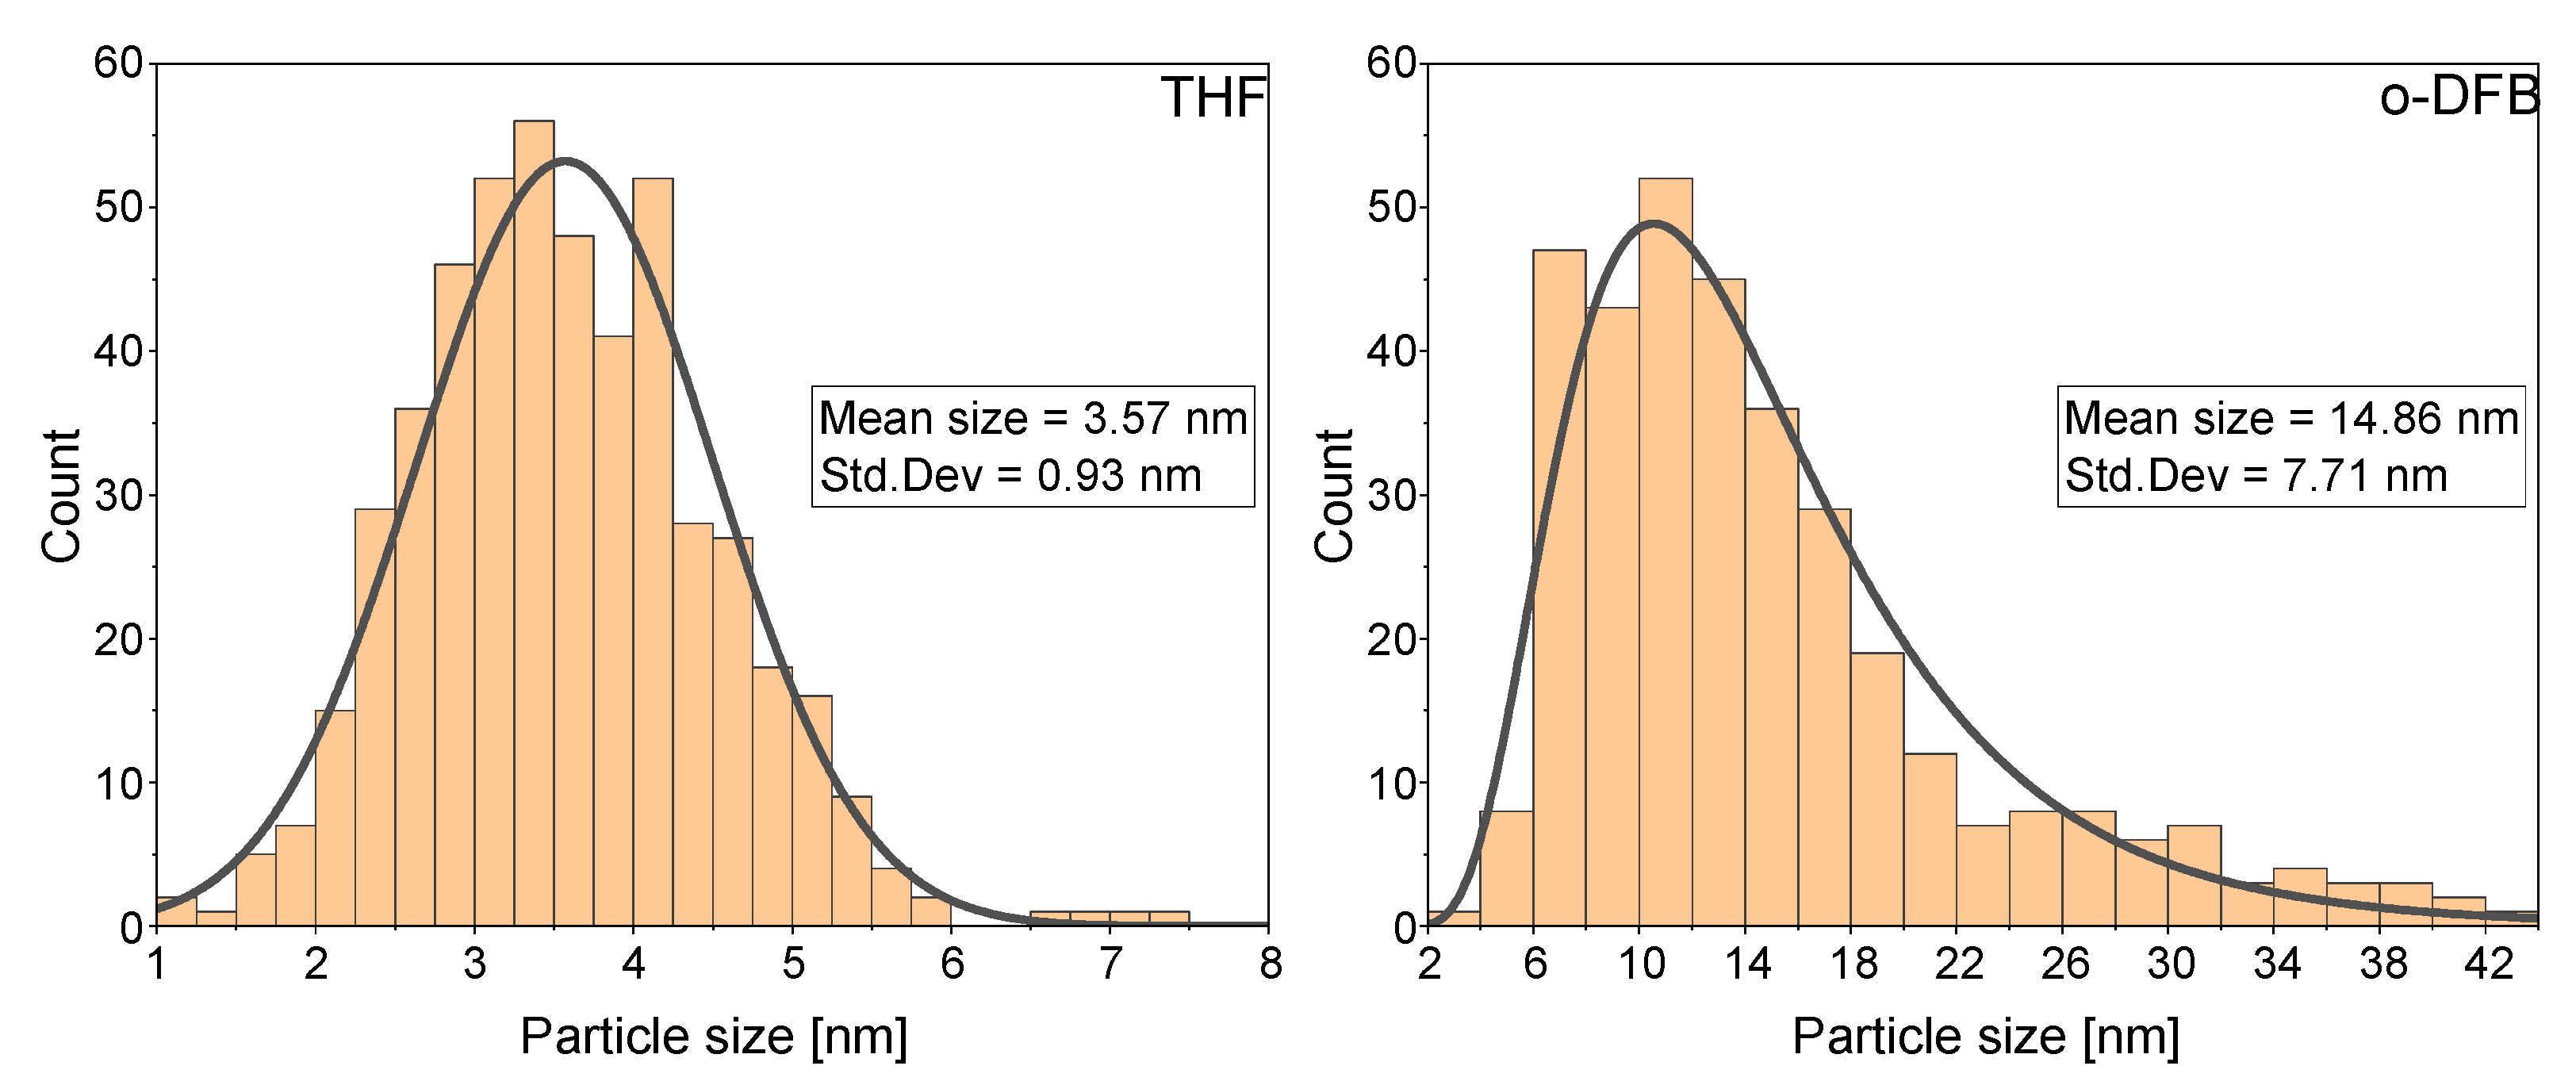
3.1. Synthesis of VNPs

TEM analysis of synthesized VNPs (Figure 1) showed that nanoparticles prepared in THF using LiAlH4 are smaller and more uniform than those synthesized in o-DFB.
The particle radius distribution based on several TEM images (Figure 2) was prepared in order to estimate size and standard deviation of their size. As calculated, mean sizes of VNPs were 14.86 ± 7.71 nm and 3.57 ± 0.93 nm for o-DFB and THF suspensions, respectively. The VNPsTHF size histogram could be described with a normal distribution, being more uniform in size and smaller than VNPsO-DFB which had various, aspherical shapes and a size histogram looking more like a lognormal distribution. Since LiAlH4 is a much stronger reducer than Ph4PBH4, vanadium is reduced more quickly; therefore, nanoparticles grow to a more uniform, smaller size. Unstirred VNPs are stable and stay suspended without any sign of agglomeration for months, despite no surfactant being used.

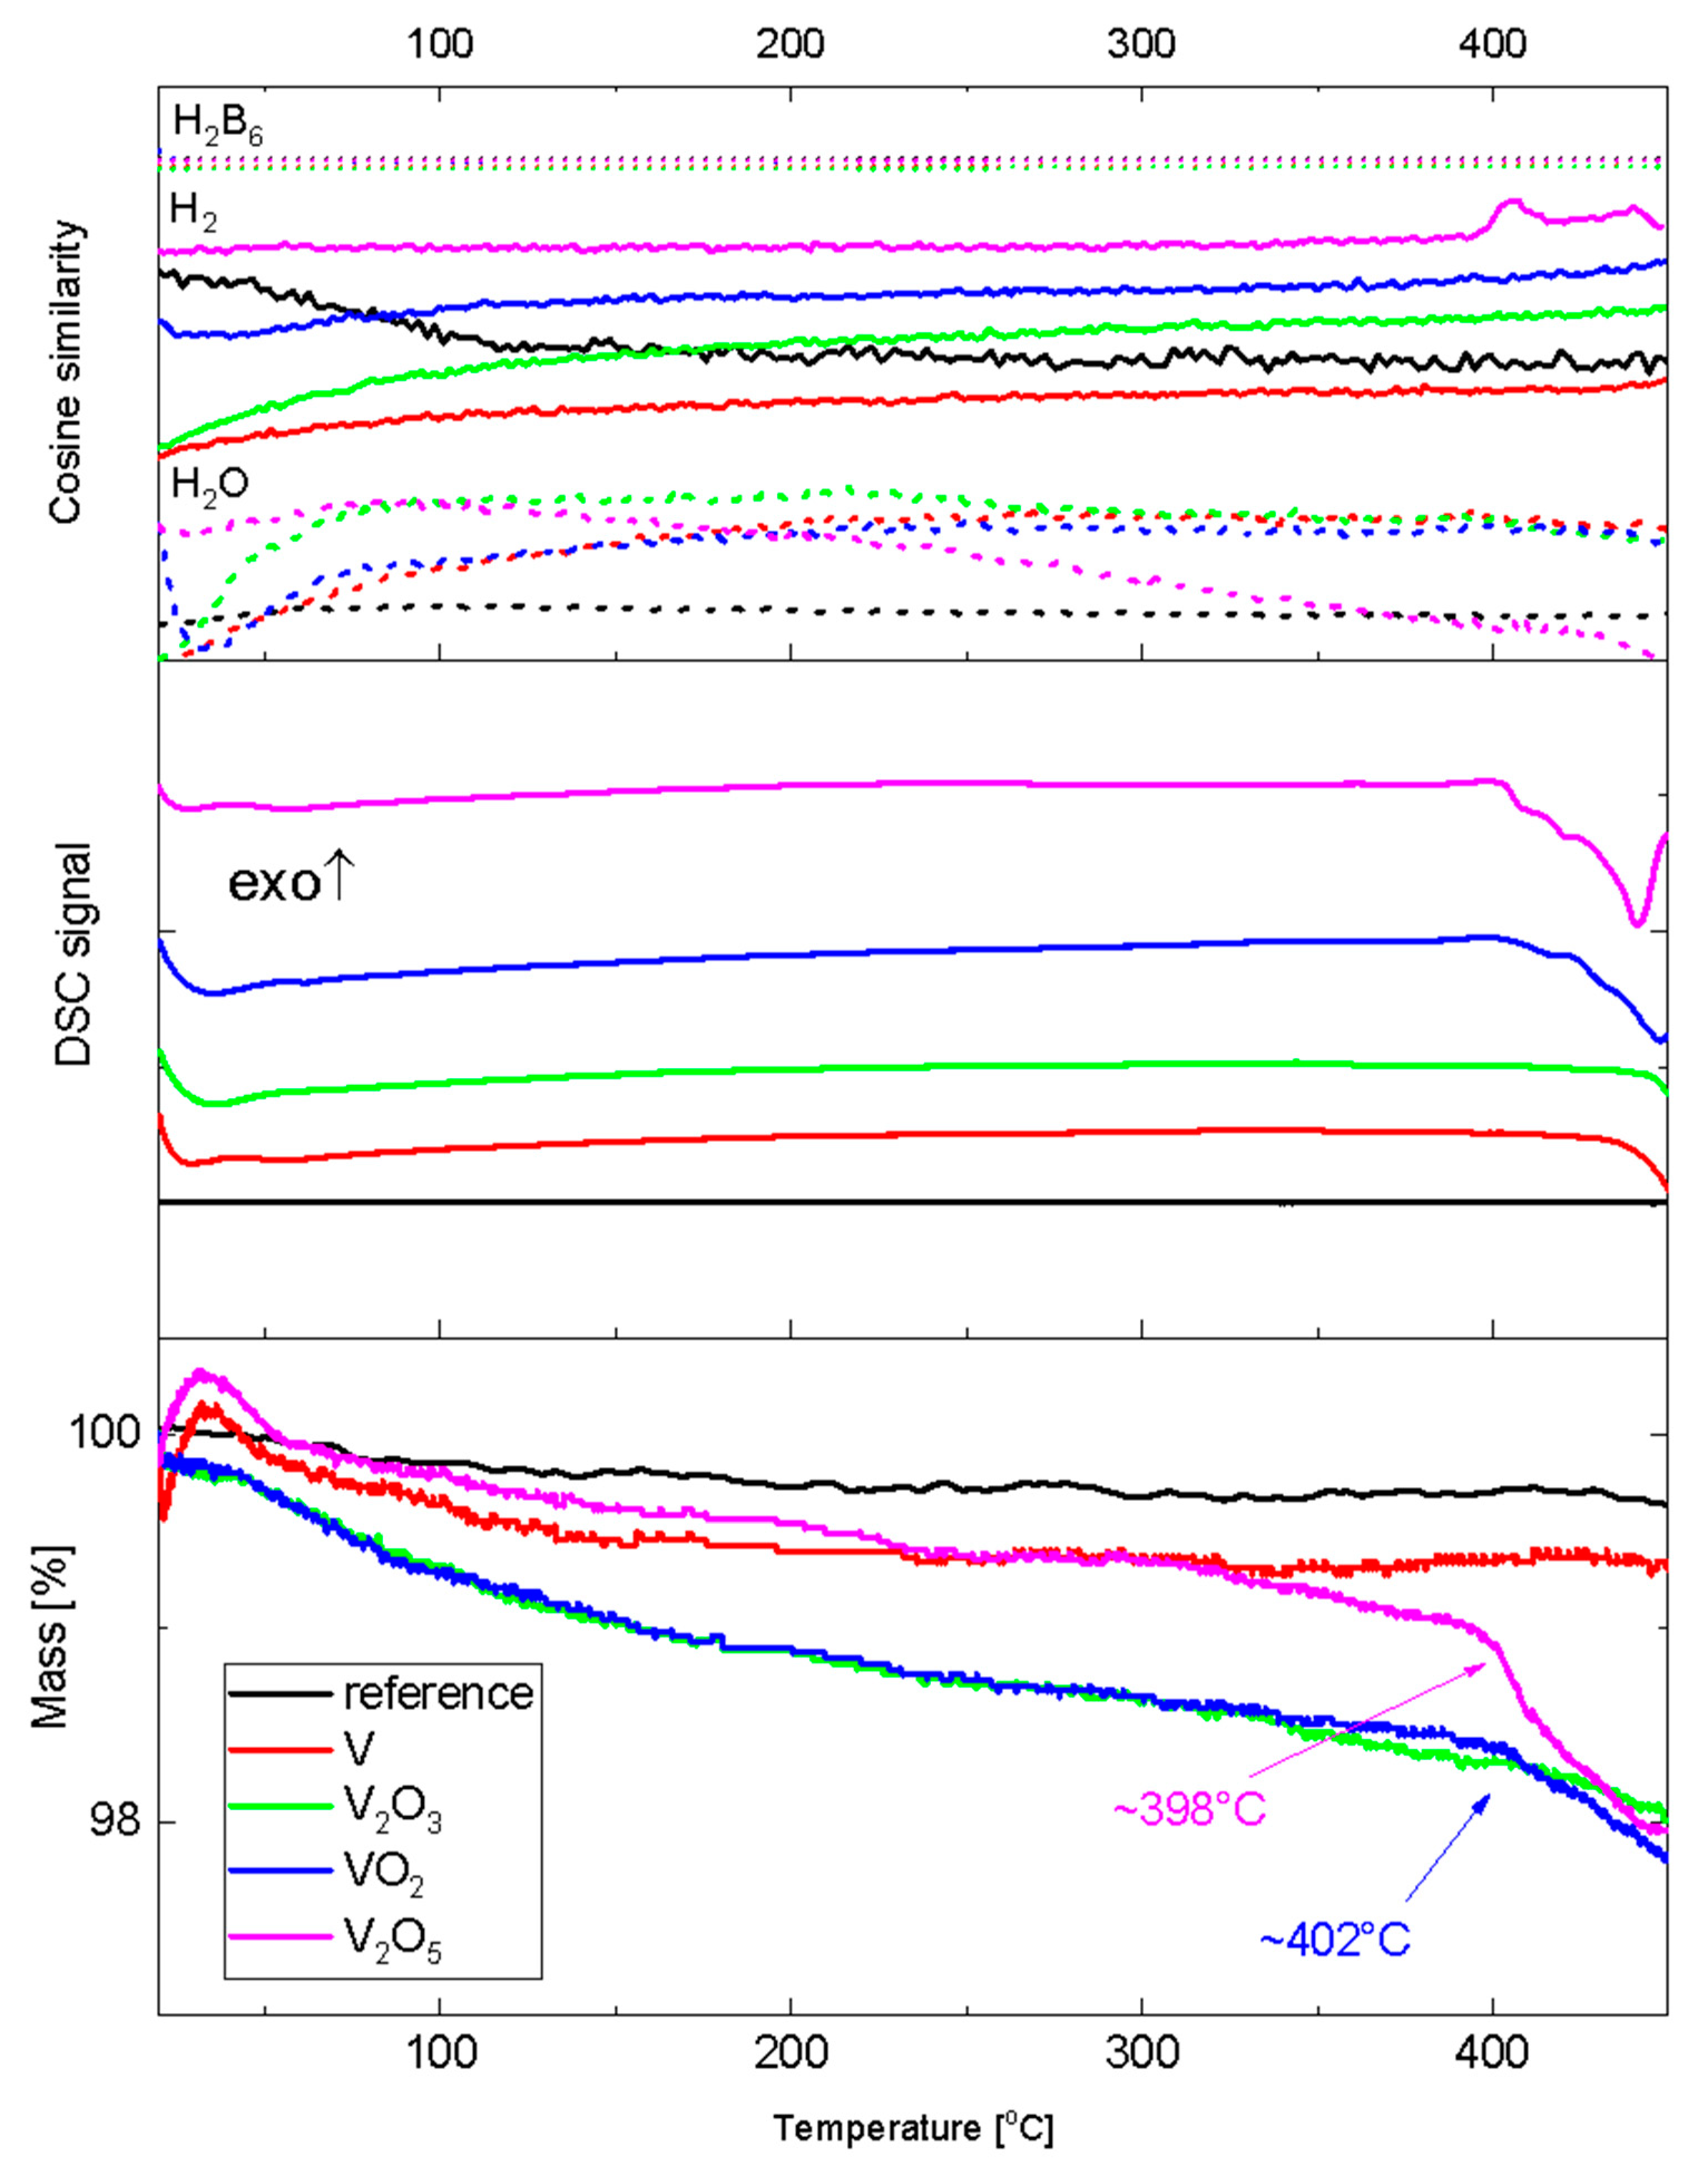
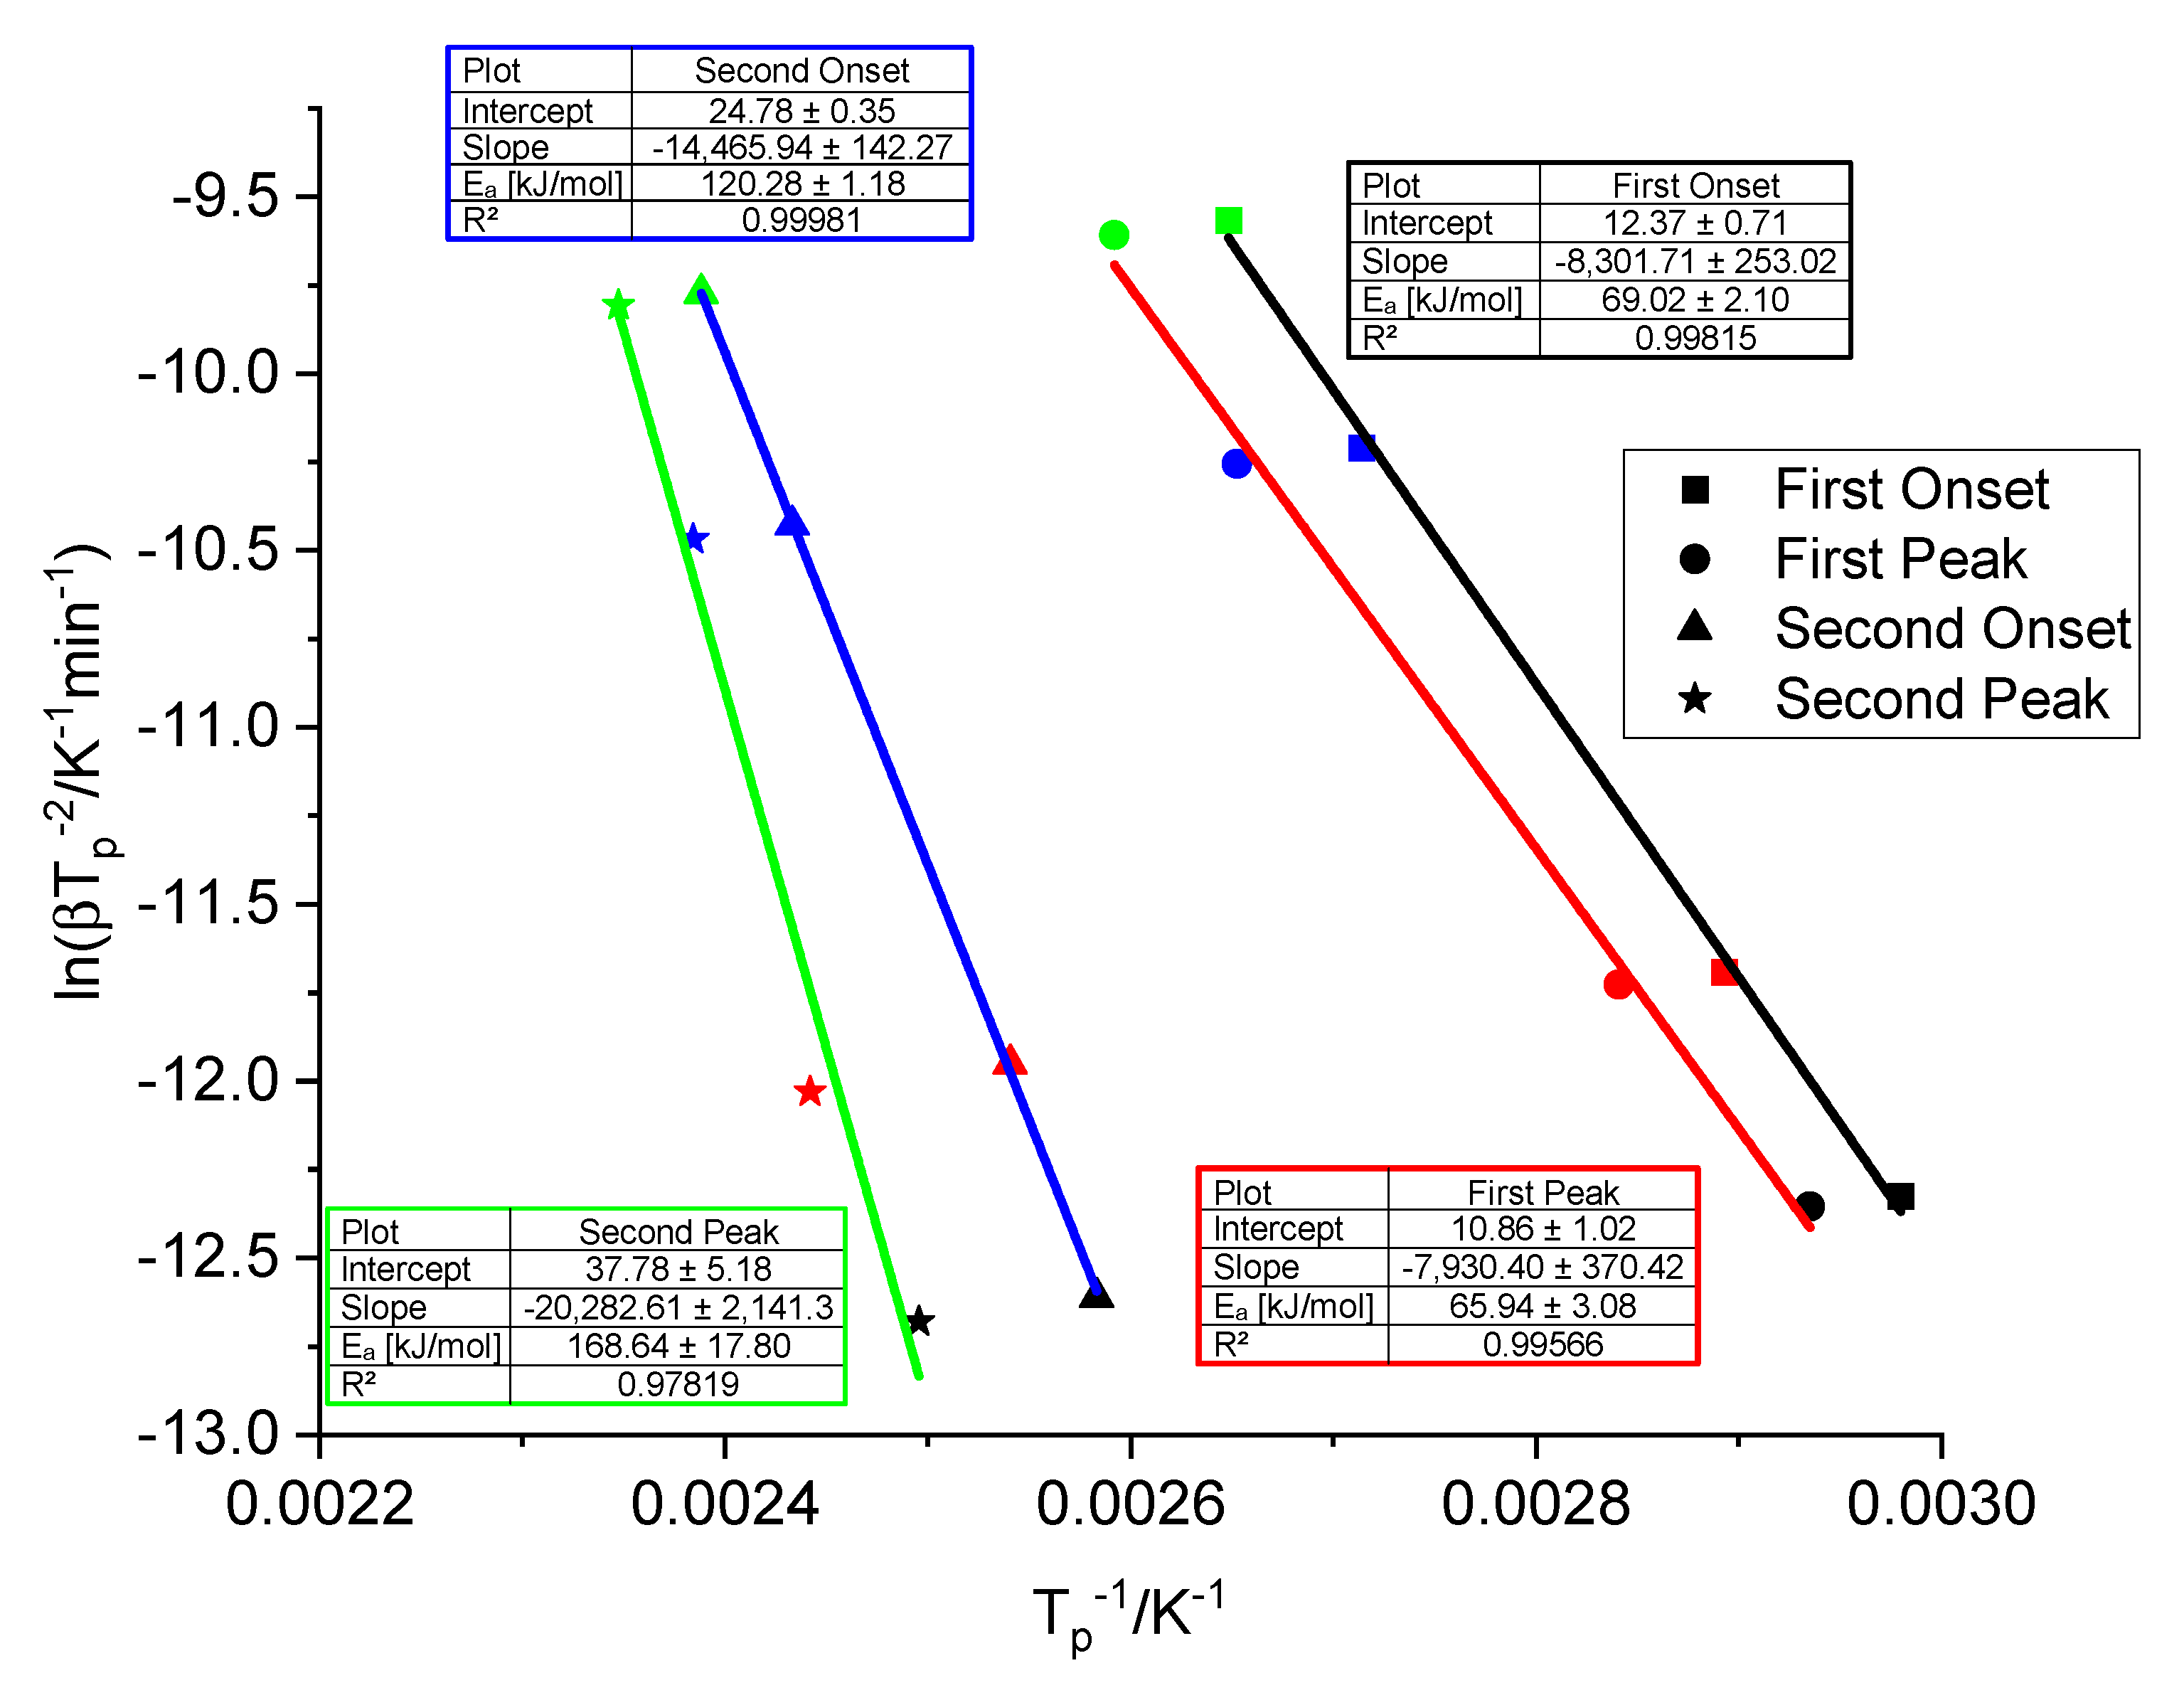
3.2. Thermogravimetric and Spectroscopic Analysis of Doped Samples

To screen the behavior of diverse V dopants, samples with 5 wt.% of catalyst milled in five short periods of 1 min each were preliminarily studied. The TG–DSC profiles for these samples, as well as a reference sample of pristine NaBH4 (milled in a similar way), together with the ion current for diverse mass peaks in the MS of the evolved gas, are shown jointly in Figure 3. The picked masses in MS correspond to hydrogen, water, and diborane fragmentation patterns.
There was a relatively minor effect of these short-milled dopants on the thermal decomposition of NaBH4, with a noticeable effect seen only for VO2 (inflection of the TG curve at 402 °C associated with mass loss of 0.6 wt.% up to 450 °C) and a more pronounced one for V2O5 (clear mass decrease above 398 °C, associated with the total mass loss of 1.0 wt.% up to 450 °C). At the same time, there was no visible decomposition in the milled pristine NaBH4 sample. MS clearly indicated that these events corresponded to endothermic H2 evolution but not associated with water or diborane.
It is worth mentioning that the small mass drift observable on a few TGA curves is a phenomenon resulting from apparatus imperfection and cannot always be avoided (despite hours-long weight stabilization). However, the sudden mass drop resulting from the decomposition reaction can be clearly distinguished; thus, it does not result in data misinterpretation in qualitative studies. Encouraged by this result, we further focused on V2O5-doped samples. Another three samples with increased content of vanadium pentoxide of 25 wt.% were prepared via 5, 30, and 180 min milling. As-obtained samples were inspected with FTIR, and the results were compared to those for pristine NaBH4 and V2O5 (Figure 4).
No change in wavenumber at peak or in the relative intensities of diverse absorption bands characteristic for NaBH4 (2400, 2295, 2223, and 1120 cm−1) was observed upon doping with V2O5, independent of the milling time. However, bands at 1018, 838, 621, and 482 cm−1 which are characteristic for V2O5 clearly decreased their intensity when the sample was milled for 30 instead of 5 min, while the band at 514 cm−1 could be barely seen in the 5 min milled sample. Noticeable shifts in the 838 and 621 cm−1 peaks could be observed as a function of milling time. When milled for 3 h, these bands disappeared almost completely, and a few new bands could be described: a very weak band at 732 cm−1, two weak bands at 882 and 816 cm−1, a moderate band at 602 cm−1, and a very strong band at 436 cm−1 (off the scale), together with bands characteristic for water in the range of 3000–3600 cm−1. This result indicates that V2O5 slowly reacted with milled borohydride and underwent a progressive reduction, associated with the formation of unknown species. These bands did not originate from any known compound of vanadium, as revealed by our scrutiny. Simultaneously, X-ray diffraction patterns for the 3 h milled sample did not show the presence of any new crystalline moiety. In each case, however, there remained a substantial amount of bulk NaBH4 in these samples as evidenced by stable B–H stretching and H–B–H bending regions, as also evidenced in X-ray diffraction patterns (not shown).
All three samples were studied with TGA–DSC–MS, and the results were compared to those for Na:V2O55%_5 min obtained with a very short milling time (5 min) and low catalyst load of 5 wt.% (Figure 5).
There was a clear effect of both catalyst load and milling time on the thermal decomposition of NaBH4/V2O5 conglomerates, as seen in TG–DSC–MS profiles. The weak effect seen for the Na:V2O55%_5 min sample at 398 °C was enhanced and shifted to lower temperature of 390 °C for the sample Na:V2O525%_5 min and further shifted to 383 °C for the sample Na:V2O525%_30 min. The lowest onset of thermal decomposition was seen for the 3 h milled sample (369 °C). All these events corresponded to the sharp and complex endothermic peaks of hydrogen desorption and were adjoined by sharp H2 release in the temperature range of 380 to 410 °C as seen in the MS. Hydrogen was free from major contamination, as additionally evidenced by the MS.
The total mass loss between the onset of thermal decomposition and 450 °C was 4.0%, 4.1%, and 5.4% for 25 wt.% doped samples milled for 5, 30, and 180 min, respectively (Figure 6). The latter value corresponds to ca. 70% of total hydrogen stored by the sample. Importantly, as indicated by MS, hydrogen was not contaminated by common impurities such as B2H6, other boron hydrides, and water.
The onset of thermal decomposition for doped samples (368–388 °C) was quite low as compared to the temperature of thermal decomposition for pristine NaBH4 and even to that for the best catalyzed samples described in the literature. Actually, only TiF3 was proven to provide an even lower decomposition onset than catalysts studied here (300 °C) [15].
The Kissinger method [58,59] was used to determine the activation energy of decomposition for NaV2O525%_180 min. Three additional experiments were conducted using heating rates of 0.5, 1, and 10 K/min in addition to the default 5 K/min used before (Figure 7). The clearly observable intermediate decomposition step for 10 and 5 K/min heating rates could not be detected at lower heating rates due to its size compared to neighboring ones; thus, only the first and last (strong) peaks were taken into activation energy calculations (Figure 8).
The activation energy of the first decomposition step for doped sample decreased drastically to 65.9 ± 3 kJ/mol (peak) or 69.0 ± 2 kJ/mol (onset) in comparison with 275 kJ/mol for pristine NaBH4 [21]. This implies a fourfold reduction of the activation energy; our result may also be compared to that of ZrCl4-doped NaBH4, which is characterized by an Ea of 180 kJ/mol [21]. On the other hand, the Ea value for the last decomposition step varied when calculated for onset or peak value (120.3 ± 1 and 169 ± 18 kJ/mol respectively); nevertheless, it was still remarkably smaller than the literature value for NaBH4. It is worth noticing, however, that the first decomposition step, characterized by very small activation energy, corresponded to the vast majority of hydrogen desorbed. Interestingly, the activation energies obtained for undoped but long-milled NaBH4 were as follows: 143.0 ± 1.6 kJ/mol (first peak) and 70.0 ± 0.9 kJ/mol (second peak). Therefore, the reduction in the activation barrier at the first stage of decomposition observed in V2O5-catalyzed samples was partially due to nano-amorphization of NaBH4 and partially due to the presence of a catalyst. On the other hand, the processes taking place at the second stage of decomposition were supposedly entirely different for the V2O5-free and V2O5-rich samples, as indicated by the counterintuitive behavior of the activation energies at that stage.
The fact that two main peaks were observed in the thermal profile means that two different species were decomposing at each of these steps. We attempted to gain insight into the nature of intermediate decomposing species and reaction products by performing additional experiments. The initial surmise was that the last step of decomposition could originate from the part of NaBH4 not in contact with catalyst, but where H2 release was easier than for pristine NaBH4 due to pronounced milling and non-amorphization of the sample. Indeed, as already mentioned, milled NaBH4 showed two major distinct decomposition steps, similarly to the catalyzed samples. However, none of those occurred at temperatures as low as 335–425 °C since the onset of thermal decomposition for milled NaBH4 was as high as 461 °C (not shown) and extended to over 600 °C (in agreement with literature data). Additional X-ray diffraction experiments for samples heated up to diverse temperatures failed to observe any crystalline species beyond traces of the bulk NaBH4. Moreover, while both thermal peaks coincided with H2 evolution, the evolved gas analysis failed to detect any impurity species such as B2H6 and higher boron hydrides. Therefore, at the current stage, the genuine nature of a (probably in situ formed) catalyst and that of the hydride intermediate undergoing the second stage of decomposition must remain an open question. We notice that the unequivocal detection of the catalyst nature is often nontrivial, as documented by many cases including that of Ti species-catalyzed NaAlH4, which stands today as one of reference materials in hydrogen storage. One cannot exclude even a scenario that the presence of V2O5 modifies the path of the decomposition reaction so substantially that sodium is no longer a volatile product of decomposition but remains in the solid residue (e.g., as some sort of vanadate salt). All these issues go beyond the scope of the current preliminary work and remain to be thoroughly studied in the future.
Having achieved a marked reduction in the thermal decomposition temperature of NaBH4 by the high load of V2O5 and a prolonged milling time, we applied the same procedure to the remaining vanadium oxides. The TG–DSC–MS profiles for all samples are jointly shown in Figure 9.
A substantial effect (and comparable to that for V2O5) on TG and DSC profiles can only be seen for VO2; here, the onset of thermal decomposition was around 377 °C, but the amount of hydrogen evolved up to 450 °C was smaller than that for the V2O5 additive. The effects seen for V2O3 and V were the least pronounced.
It is important to note that the total mass loss up to 600 °C in almost all samples exceeded the total H content of the samples. This is because sodium vapor is partly released at high temperatures [17,50,60]. It is uncertain at this time what amount of sodium remained in the doped samples, as well as the chemical identity of the phase(s) containing this metal.
Having studied vanadium- and vanadium oxide-doped samples, our attention turned to vanadium nanoparticles. Samples doped with vanadium nanoparticles were denoted Na:VNPsTHF and Na:VNPsO- DFB, and they were studied with TGA–DSC–MS analogously to previous samples (Figure 10). Reference curves for milled NaBH4 were added for comparison.
Both VNP-doped samples seemingly released H2 at a lower temperature than the reference sample, as can be judged from the MS profiles. However, the doped samples also released copious amounts of CO2, B2H6, and solvent residues (only in the case of Na:VNPsTHF) at even lower temperatures, as seen in the MS and TGA profiles. These contaminations most probably came from byproducts of VNP synthesis and are certainly highly undesired for any practical application.

4. Conclusions

We studied the effect of vanadium and its oxides and nanoparticles (VNPs) on the thermal decomposition of NaBH4. It was revealed that 3 h milling of NaBH4 with 25 wt.% of V2O5 decreased the temperature of NaBH4 decomposition by as much as 165 °C with respect to pristine sodium borohydride. VO2 doping also decreased the temperature of NaBH4 pyrolysis, but to a lesser degree; moreover, the hydrogen release peak was much broader than for V2O5 doping. The hydrogen released up to 450 °C was free from B2H6, other boron hydrides, and water. In contrast to expectations, vanadium metal provided nearly no improvement in the hydrogen desorption temperature of sodium borohydride. Doping with VNPs resulted in contamination of the evolved H2 with some precursors used for their synthesis, which is a highly undesirable effect.
Extension of these studies may focus on the chemical nature of vanadium in the extensively milled and thermally decomposed samples, attempts to achieve at least partial reversibility of H2 storage, understanding the nature of the hydride intermediate and of the fate of sodium in the catalyzed samples, and broadening of the study toward other light metal borohydrides.

Author Contributions

Conceptualization, W.G.; Data curation, P.A.O.; Formal analysis, P.A.O.; Funding acquisition, P.A.O.; Investigation, P.A.O.; Methodology, P.A.O.; Project administration, P.A.O.; Resources, P.A.O.; Validation, P.A.O.; Visualization, P.A.O.; Writing–original draft, P.A.O.; Writing–review & editing, W.G. All authors have read and agreed to the published version of the manuscript.

Funding

This research was funded by Ministry of Science and Higher Education of Poland, grant number 501-D313-59-0557788.

Data Availability Statement

The data presented in this study are available on request from the P.A.O. The data are not publicly available.

Acknowledgments

Piotr Antoni Orłowski acknowledges the Ministry of Science and Higher Education for the scholarship awarded by the Diamond Grant competition.

Conflicts of Interest

The authors declare no conflict of interest.

References

  1. Grochala, W.; Edwards, P.P. Thermal decomposition of the non-interstitial hydrides for the storage and production of hydrogen. Chem. Rev. 2004, 104, 1283–1316. [Google Scholar] [CrossRef]
  2. Züttel, A. Hydrogen storage methods. Sci. Nat. 2004, 91, 157–172. [Google Scholar] [CrossRef] [PubMed]
  3. Bannenberg, L.J.; Heere, M.; Benzidi, H.; Montero, J.; Dematteis, E.M.; Suwarno, S.; Jaroń, T.; Winny, M.; Orłowski, P.A.; Wegner, W.; et al. Metal (boro-) hydrides for high energy density storage and relevant emerging technologies. Int. J. Hydrogen Energy 2020, 45, 33687–33730. [Google Scholar] [CrossRef]
  4. Schlapbach, L.; Züttel, A. Hydrogen-storage materials for mobile applications. In Materials for Sustainable Energy: A Collection of Peer-Reviewed Research and Review Articles from Nature Publishing Group; World Scientific: Singapore, 2011; Volume 414, pp. 265–270. [Google Scholar]
  5. Graetz, J. New approaches to hydrogen storage. Chem. Soc. Rev. 2009, 38, 73–82. [Google Scholar] [CrossRef]
  6. Li, H.-W.; Zhu, M.; Buckley, C.; Jensen, T.R. Functional materials based on metal hydrides. Inorganics 2018, 6, 91. [Google Scholar] [CrossRef] [Green Version]
  7. Mohring, R.M.; Eason, I.A.; Fennimore, K.A. Performance Bench Testing of Auotive-Scale Hydrogen on Demand™ Hydrogen Generation Technology; SAE Technical Paper: Warrendale, PA, USA, 2002. [Google Scholar]
  8. Huang, Y.; Cheng, Y.; Zhang, J. A Review of High Density Solid Hydrogen Storage Materials by Pyrolysis for Promising Mobile Applications. Ind. Eng. Chem. Res. 2021, 60, 2737–2771. [Google Scholar] [CrossRef]
  9. Martelli, P.; Caputo, R.; Remhof, A.; Mauron, P.; Borgschulte, A.; Zuttel, A. Stability and decomposition of NaBH4. J. Phys. Chem. C 2010, 114, 7173–7177. [Google Scholar] [CrossRef]
  10. Puszkiel, J.; Garroni, S.; Milanese, C.; Gennari, F.; Klassen, T.; Dornheim, M.; Pistidda, C. Tetrahydroborates: Development and potential as hydrogen storage medium. Inorganics 2017, 5, 74. [Google Scholar] [CrossRef] [Green Version]
  11. Milanese, C.; Jensen, T.R.; Hauback, B.C.; Pistidda, C.; Dornheim, M.; Yang, H.; Lombardo, L.; Zuettel, A.; Filinchuk, Y.; Ngene, P.; et al. Complex hydrides for energy storage. Int. J. Hydrogen Energy 2019, 44, 7860–7874. [Google Scholar] [CrossRef] [Green Version]
  12. Andersson, J.; Grönkvist, S. Large-scale storage of hydrogen. Int. J. Hydrogen Energy 2019, 44, 11901–11919. [Google Scholar] [CrossRef]
  13. Llamas, J.I.; Kalantzopoulos, G.N.; Nordholm, K.; Hauback, B.C. Destabilization of NaBH4 by transition metal fluorides. Molecules 2020, 25, 780. [Google Scholar] [CrossRef] [Green Version]
  14. Humphries, T.D.; Kalantzopoulos, G.N.; Llamas-Jansa, I.; Olsen, J.E.; Hauback, B.C. Reversible hydrogenation studies of NaBH4 milled with Ni-containing additives. J. Phys. Chem. C 2013, 117, 6060–6065. [Google Scholar] [CrossRef] [Green Version]
  15. Mao, J.; Guo, Z.; Nevirkovets, I.P.; Liu, H.K.; Dou, S.X. Hydrogen de-/absorption improvement of NaBH4 catalyzed by titanium-based additives. J. Phys. Chem. C 2012, 116, 1596–1604. [Google Scholar] [CrossRef] [Green Version]
  16. Mao, J.F.; Yu, X.B.; Guo, Z.P.; Poh, C.K.; Liu, H.K.; Wu, Z.; Ni, J. Improvement of the LiAlH4–NaBH4 system for reversible hydrogen storage. J. Phys. Chem. C 2009, 113, 10813–10818. [Google Scholar] [CrossRef]
  17. Lai, Q.; Milanese, C.; Aguey-Zinsou, K.F. Stabilization of nanosized borohydrides for hydrogen storage: Suppressing the melting with TiCl3 doping. ACS Appl. Energy Mater. 2018, 1, 421–430. [Google Scholar] [CrossRef]
  18. Chong, L.; Zou, J.; Zeng, X.; Ding, W. Reversible hydrogen sorption in NaBH4 at lower temperatures. J. Mater. Chem. A 2013, 1, 13510–13523. [Google Scholar] [CrossRef]
  19. Zhang, Z.G.; Wang, H.; Zhu, M. Hydrogen release from sodium borohydrides at low temperature by the addition of zinc fluoride. Int. J. Hydrogen Energy 2011, 36, 8203–8208. [Google Scholar] [CrossRef]
  20. Zou, J.; Li, L.; Zeng, X.; Ding, W. Reversible hydrogen storage in a 3NaBH4/YF3 composite. Int. J. Hydrogen Energy 2012, 37, 17118–17125. [Google Scholar] [CrossRef]
  21. Kumar, S.; Jaina, J.; Miyaoka, H.; Ichikawa, T.; Kojima, Y. Study on the thermal decomposition of NaBH4 catalyzed by ZrCl4. Int. J. Hydrogen. Energy 2017, 42, 22432–22437. [Google Scholar] [CrossRef]
  22. Huang, T.; Zou, J.; Zeng, X.; Wang, J.; Liu, H.; Ding, W. Reversible hydrogen sorption behaviors of the 3NaBH4-(x)YF3-(1-x)GdF3 system: The effect of double rare earth metal cations. Int. J. Hydrogen Energy 2019, 44, 4868–4877. [Google Scholar] [CrossRef]
  23. Chong, L.; Zou, J.; Zeng, X.; Ding, W. Effects of La fluoride and La hydride on the reversible hydrogen sorption behaviors of NaBH4: A comparative study. J. Mater. Chem. A 2014, 2, 8557–8570. [Google Scholar] [CrossRef]
  24. Chong, L.; Zou, J.; Zeng, X.; Ding, W. Mechanisms of reversible hydrogen storage in NaBH4 through NdF3 addition. J. Mater. Chem. A 2013, 1, 3983–3991. [Google Scholar] [CrossRef]
  25. Chong, L.; Zou, J.; Zeng, X.; Ding, W. Study on reversible hydrogen sorption behaviors of a 3NaBH4/HoF3 composite. Int. J. Hydrogen Energy 2014, 39, 14275–14281. [Google Scholar] [CrossRef]
  26. Afonso, G.; Bonakdarpour, A.; Wilkinson, D.P. Hydrogen storage properties of the destabilized 4NaBH4/5Mg2NiH4 composite system. J. Phys. Chem. C 2013, 117, 21105–21111. [Google Scholar] [CrossRef]
  27. Yahya, M.S.; Ali, N.A.; Sazelee, N.A.; Mustafa, N.S.; Yap, F.A.H.; Ismail, M. Intensive investigation on hydrogen storage properties and reaction mechanism of the NaBH4-Li3AlH6 destabilized system. Int. J. Hydrogen Energy 2019, 44, 21965–21978. [Google Scholar] [CrossRef]
  28. Nwakwuo, C.C.; Pistidda, C.; Dornheim, M.; Hutchison, J.L.; Sykes, J.M. Microstructural study of hydrogen desorption in 2NaBH4+MgH2 reactive hydride composite. Int. J. Hydrogen Energy 2012, 37, 2382–2387. [Google Scholar] [CrossRef]
  29. Garroni, S.; Pistidda, C.; Brunelli, M.; Vaughan, G.B.M.; Surinach, S.; Baro, M.D. Hydrogen desorption mechanism of 2NaBH4+MgH2 composite prepared by high-energy ball milling. Scr. Mater. 2009, 60, 1129–1132. [Google Scholar] [CrossRef]
  30. Mao, J.F.; Yu, X.B.; Guo, Z.P.; Liu, H.K.; Wu, Z.; Ni, J. Enhanced hydrogen storage performances of NaBH4–MgH2 system. J. Alloys Compd. 2009, 479, 619–623. [Google Scholar] [CrossRef]
  31. Mao, J.; Guo, Z.; Yu, X.; Liu, H. Improved hydrogen storage properties of NaBH4 destabilized by CaH2 and Ca(BH4)2. J. Phys. Chem. C 2011, 115, 9283–9290. [Google Scholar] [CrossRef]
  32. Somer, M.; Acar, S.; Koz, C.; Kokal, I.; Höhn, P.; Cardoso-Gil, R.; Aydemir, U.; Akselrud, L. Alpha-and beta-Na2[BH4][NH2]: Two modifications of a complex hydride in the system NaNH2–NaBH4; syntheses, crystal structures, thermal analyses, mass and vibrational spectra. J. Alloys Compd. 2010, 491, 98–105. [Google Scholar] [CrossRef]
  33. Pei, Z.; Wu, C.; Bai, Y.; Liu, X.; Wu, F. NaNH2–NaBH4 hydrogen storage composite materials synthesized via liquid phase ball-milling: Influence of Co–Ni–B catalyst on the dehydrogenation performances. Int. J. Hydrogen Energy 2017, 42, 14725–14733. [Google Scholar] [CrossRef]
  34. Mustafa, N.S.; Ismail, M. Significant effect of TiF3 on the performance of 2NaAlH4+ Ca(BH4)2 hydrogen storage properties. Int. J. Hydrogen Energy 2019, 44, 21979–21987. [Google Scholar] [CrossRef]
  35. Javadian, P.; Sheppard, D.A.; Buckley, C.E.; Jensen, T.R. Hydrogen storage properties of nanoconfined LiBH4–NaBH4. Int. J. Hydrogen Energy 2015, 40, 14916–14924. [Google Scholar] [CrossRef] [Green Version]
  36. Liu, Y.; Reed, D.; Paterakis, C.; Vasquez, L.C.; Baricco, M.; Book, D. Study of the decomposition of a 0.62LiBH4–0.38NaBH4 mixture. Int. J. Hydrogen Energy 2017, 42, 22480–22488. [Google Scholar] [CrossRef]
  37. Jensen, S.R.H.; Jepsen, L.H.; Skibsted, J.; Jensen, T.R. Phase Diagram for the NaBH4–KBH4 System and the Stability of a Na1–xKxBH4 Solid Solution. J. Phys. Chem. C 2015, 119, 27919–27929. [Google Scholar] [CrossRef]
  38. Ley, M.B.; Roedern, E.; Thygesen, P.M.M.; Jensen, T.R. Melting behavior and thermolysis of NaBH4−Mg(BH4)2 and NaBH4−Ca(BH4)2 composites. Energies 2015, 8, 2701–2713. [Google Scholar] [CrossRef] [Green Version]
  39. Dematteis, E.M.; Santoru, A.; Poletti, M.G.; Pistidda, C.; Klassen, T.; Dornheim, M.; Baricco, M. Phase stability and hydrogen desorption in a quinary equimolar mixture of light-metals borohydrides. Int. J. Hydrogen Energy 2018, 43, 16793–16803. [Google Scholar] [CrossRef]
  40. Fu, H.; Wu, Y.; Chen, J.; Wang, X.; Zheng, J.; Li, X. Promoted hydrogen release from alkali metal borohydrides in ionic liquids. Inorg. Chem. Front. 2016, 3, 1137–1145. [Google Scholar] [CrossRef]
  41. Xi, S.; Zhang, P.; Fu, Y.; Tome, K.C.; Zhang, T.; Zhou, S.; Guo, Y.; Yu, H. Hydrogen Release: Thermodynamic and kinetic studies of NaBH4 activated by different zeolite nanoparticles. Energy Fuels 2020, 34, 10218–10224. [Google Scholar] [CrossRef]
  42. Manoharan, K.; Palaniswamy, V.K.; Raman, K.; Sundaram, R. Investigation of solid state hydrogen storage performances of novel NaBH4/Ah-BN nanocomposite as hydrogen storage medium for fuel cell applications. J. Alloys Compd. 2021, 860, 158444. [Google Scholar] [CrossRef]
  43. Ampoumogli, A.; Steriotis, T.; Trikalitis, P.; Giasafaki, D.; Bardaji, E.G.; Fichtner, M.; Charalambopoulou, G. Nanostructured composites of mesoporous carbons and boranates as hydrogen storage materials. J. Alloys Compd. 2011, 509, S705–S708. [Google Scholar] [CrossRef]
  44. Ngene, P.; van den Berg, R.; Verkuijlen, M.H.W.; de Jong, K.P.; de Jongh, P.E. Reversibility of the hydrogen desorption from NaBH4 by confinement in nanoporous carbon. Energy Environ. Sci. 2011, 4, 4108–4115. [Google Scholar] [CrossRef] [Green Version]
  45. Zhang, L.; Xiao, X.; Fan, X.; Li, S.; Ge, H.; Wang, Q.; Chen, L. Fast hydrogen release under moderate conditions from NaBH4 destabilized by fluorographite. RSC Adv. 2014, 4, 2550–2556. [Google Scholar] [CrossRef]
  46. Fang, Y.; Zhang, J.; Hua, M.Y.; Zhou, D.W. Modifying effects and mechanisms of graphene on dehydrogenation properties of sodium borohydride. J. Mater. Sci. 2020, 55, 1959–1972. [Google Scholar] [CrossRef]
  47. Chong, L.; Zeng, X.; Ding, W.; Liu, D.; Zou, J. NaBH4 in “graphene wrapper:” Significantly enhanced hydrogen storage capacity and regenerability through nanoencapsulation. Adv. Mater. 2015, 27, 5070–5074. [Google Scholar] [CrossRef]
  48. Wang, T.; Aguey-Zinsou, K.F. “Surfactant-free” sodium borohydride nanoparticles with enhanced hydrogen desorption properties. ACS Appl. Energy Mater. 2020, 3, 9940–9949. [Google Scholar] [CrossRef]
  49. Wang, T.; Aguey-Zinsou, K.F. Controlling the growth of NaBH4 nanoparticles for hydrogen storage. Int. J. Hydrogen Energy 2020, 45, 2054–2067. [Google Scholar] [CrossRef]
  50. Christian, M.L.; Aguey-Zinsou, K.F. Core--shell strategy leading to high reversible hydrogen storage capacity for NaBH4. ACS Nano 2012, 6, 7739–7751. [Google Scholar] [CrossRef]
  51. Christian, M.; Aguey-Zinsou, K.F. Synthesis of core-shell NaBH4@M (M = Co, Cu, Fe, Ni, Sn) nanoparticles leading to various morphologies and hydrogen storage properties. Chem. Comm. 2013, 49, 6794–6796. [Google Scholar] [CrossRef]
  52. Li, Y.; Ding, X.; Zhang, Q. Self-printing on graphitic nanosheets with metal borohydride nanodots for hydrogen storage. Sci. Rep. 2016, 6, 31144. [Google Scholar] [CrossRef] [Green Version]
  53. Yang, H.; Lombardo, L.; Luo, W.; Kim, W.; Zuttel, A. Hydrogen storage properties of various carbon supported NaBH4 prepared via metathesis. Int. J. Hydrogen Energy 2018, 43, 7108–7116. [Google Scholar] [CrossRef]
  54. Maj, Ł.; Grochala, W. Theoretical design of catalysts for the heterolytic splitting of H2. Adv. Funct. Mater. 2006, 16, 2061–2076. [Google Scholar] [CrossRef]
  55. Hamilton, C.W.; Baker, R.T.; Staubitz, A.; Manners, I. B-N compounds for chemical hydrogen storage. Chem. Soc. Rev. 2009, 38, 279–293. [Google Scholar] [CrossRef] [PubMed]
  56. Reilly, J.J.; Wiswall, R.H. Higher hydrides of vanadium and niobium. Inorg. Chem. 1970, 9, 1678–1682. [Google Scholar] [CrossRef]
  57. Koteras, K. Synteza i właściwości fizykochemiczne nowych, wysoce reaktywnych soli wapnia, tytanu i wanadu z anionami słabo koordynującymi. Master’s Thesis, Warsaw University of Technology, Warsaw, Poland, 2018. [Google Scholar]
  58. Kissinger, H.E. Variation of peak temperature with heating rate in differential thermal analysis. J. Res. Natl. Bur. Stand. 1956, 57, 217–221. [Google Scholar] [CrossRef]
  59. Kissinger, H.E. Reaction kinetics in differential thermal analysis. Anal. Chem. 1957, 29, 1702–1706. [Google Scholar] [CrossRef]
  60. Wang, T.; Aguey-Zinsou, K.-F. Direct Synthesis of NaBH4 Nanoparticles from NaOCH3 for Hydrogen Storage. Energies 2019, 12, 4428. [Google Scholar] [CrossRef] [Green Version]
Figure 1. TEM images of VNPs prepared in THF and o-DFB solutions.
Solids 03 00021 g001
Figure 2. VNPs size distribution depending on route of synthesis.
Solids 03 00021 g002
Figure 3. TGA/DSC + MS curves of pristine NaBH4 and NaBH4 doped for 5 min with 5 wt.% of catalyst. DCS and MS curves are stacked in each section with an offset applied for their better distinction, but without distortion of the quantitative proportion between them. The fact that the TGA profiles are not flat for the doped samples may be associated with the absorption of a very small amount of moisture during milling; water vapor was then released during heating. Note that the TGA scale comprises 3 wt.% only; hence, the noise is more pronounced than in all forthcoming figures.
Solids 03 00021 g003
Figure 4. FTIR spectra of Na:V2O525%_5 min and Na:V2O525%_30 min in comparison to pure NaBH4 and V2O5. Spectra of NaBH4-containing species were normalized to the most intense peak originating from B–H stretching. Spectra were shifted in vertical scale for clarity. Inset shows a blow-up of the 400–1000 cm−1 range.
Solids 03 00021 g004
Figure 5. TGA/DSC + MS curves of Na:V2O55%_5 min, Na:V2O525%_5 min, Na:V2O525%_30 min, and Na:V2O525%_180 min samples. DCS and MS curves are stacked in each section with an offset for visual improvement, without proportion distortion.
Solids 03 00021 g005
Figure 6. Mass loss up to 450 °C observed for Na:V2O525%_5 min, Na:V2O525%_30 min and Na:V2O525%_180 min with respect to the milling time together with the onset of the thermal decomposition temperature.
Solids 03 00021 g006
Figure 7. DSC measurement for Na:V2O525%_180 min sample using four different heating rates. Values of peaks and onsets are marked with symbols; onset values are additionally described with their value in °C.
Solids 03 00021 g007
Figure 8. Kissinger plot of Na:V2O525%_180 min sample for first and last peaks of decomposition onsets and maxima together with associated by color tables containing the activation energy calculated and a description of fitted lines.
Solids 03 00021 g008
Figure 9. TGA/DSC + MS curves of pristine NaBH4 and sampled doped for 30 min with 25 wt.% of diverse vanadium catalysts. DCS and MS curves are stacked in each section with an offset for better distinction, without distortion of the quantitative proportions.
Solids 03 00021 g009
Figure 10. TGA/DSC + MS curves of milled NaBH4 and both VNP-doped samples. DCS and MS curves are stacked in each section with an offset for better distinction, but without distortion of quantitative proportions. Values of m/z = 42 and 114 correspond to the THF and o-DFB MS main peaks, respectively.
Solids 03 00021 g010
Table 1. Influence of the first-period transition metal-based dopants on thermal decomposition temperature of NaBH4 (5%mol doping if not specified differently).
Sc [13]TiVCr [13]Mn [13]
ScF3—501 °C Nano—493 °C [14]
TiF3—300 °C [15]
5%mol TiF3—~300 °C [16]
TiF4—522 °C [13]
TiCl3 1:6—100 °C * [17]
TiB2—503 °C [14]
TiSiO4—489 °C [14]
VF4—499 °C [13]
NaBH4 + PrF3 + VF3 3:1:0.2—417 °C [18]
V3B—478 °C [14]
CrF3—500 °C MnF3—483 °C
Fe [13]CoNiCu [13]Zn
FeF3—498 °CCoF3—501 °C [13]
Co3B—480 °C [14]
Nano—483 °C [14]
NiF2—452 °C [13]
NiF2—453 °C [14]
wt.10% Ni on Si/Al2O3—449 °C [14]
NiCl2—460 °C [14]
Ni3B—462 °C [14]
CuF2—476 °C ZnF2—504 °C [13]
ZnF2 1:2—95 °C ** [19]
* polluted with B2H6 and diglyme; ** polluted with B2H6.
Table 2. Influence of the second-period transition metal-based dopants on thermal decomposition temperature of NaBH4 (5%mol doping if not specified differently).
YZrNb [13]Rh [14]Pd [14]Ag [13]Cd [13]
YF3—513 °C [13]
YF3 3:1—423 °C [20]
ZrF4—503°C [13]
ZrCl4—503 °C [21]
NbF5:
2%mol—442 °C
10%mol—379 °C 15%mol—379 °C
Rh (5 wt.%) on Al2O3—476 °CNano—420 °CAgF—498 °CCdF2—512 °C
(x)YF3 + (1 − x)GdF3 3:1 [22]:
x = 2/3—449 °C
x = 1/2—446 °C
x = 1/3—440 °C
Table 3. Influence of lanthanide series metal-based dopants on thermal decomposition temperature of NaBH4 (5%mol doping if not specified differently).
La [23]Ce [13]Pr [18]Nd [24]Ho [25]
LaF3 3:1—396 °C
La 3:1—442 °C
CeF3—506 °C
CeF4—502 °C
PrF3 3:1—439 °CNdF3 3:1—413 °CHoF3 3:1—443 °C
Table 4. Influence of co-milling of other hydrogen-rich compounds with NaBH4 on its thermal decomposition temperature (molar ratio was used if not described differently).
MH2Mg2NiH4 [26]NaNH2M(AlH4)xLi3AlH6 [27]MBH4
M = Mg:
1:2—420 °C [28]
1:2—490 °C [29]

1:2 with 5%mol of [30]:
TiF3—~470 °C
TiO2—~470 °C
Zr—~470 °C
Si—~470 °C
BCC—~470 °C

M = Ca:
1:6—390 °C [31]
5:4—~350 °C 1:1—330 °C * [32]

2:1 with Co–Ni–B catalyst [33]:
1 wt.%—~300 °C
3 wt.%—~285 °C
5 wt.%—285 °C
7 wt.%—~285 °C
M = Li:
1:1 [16]:
No catalyst—446 °C
5% TiF3—~300 °C

M = Ca:
2NaAlH4 + Ca(BH4)2 with 5 wt.% TiF3 —400 °C [34]
1:1 (1 h)—400 °C
1:1 (24 h)—392 °C
1:2—430 °C
1:3—430 °C
M = Li 0.38:0.62:
pure—350 °C [35]
pure—~420 °C [36]
60%vol in carbon areogel—~333 °C [35]

M = K—~472 °C [37]

M = Mg—~205 °C [38]

M = Li, K, Mg, and Ca (equimolar)—~330 °C [39]
* polluted with ammonia.
Table 5. Thermal decomposition of NaBH4 in its composite materials (mass ratio was used if not described differently).
Ionic Liquids [40]CarbonCarbon BasedZeolites [41]Ah-BN [42]NaBF4 ** [34]
1%mol solution in:
bmimBr—~165 °C
bmimNTf2—104 °C
20% of scaffolds CMK-3 —235 °C and 380 °C * [43]

~25% of HSAG-500 [44]:
infiltrated—~270 °C
melted—~300 °C
mixed—~320 °C
45% fluorographite—141 °C [45]
graphene:
10%—370 °C [46]
?—426 °C [47]
MCM-22:
1:1—490 °C
1:2—503 °C
1:3—507 °C
1:4—508 °C

SAPO-34:
1:1—483 °C
1:2—491 °C
1:3—493 °C
1:4—495 °C
1:1—399 °C1:10 mol—468 °C
1:2 mol—305 °C
* polluted with ammonia; ** polluted with BF3 and B2H6.
Table 6. Influence of nanosizing of NaBH4 on its thermal decomposition temperature.
Solvented Ion Stabilization * [48]Evaporation with 10%mol of Ligands or Solvents [49]Anti-Solvent PrecipitationMilled LiBH4 + NaCl
LiCl—495 °C
MgCl2—445 °C
NaI—485 °C
Hexyloamine—489 °C
dodecyloamine—476 °C
octodecyloamine—473 °C
tertabuthylamonium bromide—464 and 482 °C
tetraoctylamonium bromide—484 °C
tetradecyloamonium bromide—~500 °C
dodecane—478 °C
dodecanothiol—464 °C
tri-decylic acid—~400 and 474 °C
tetrabutylphosphonium bromide—471 °C
Bare—460 and 535 °C [50]
Coated with:
Ni—418 °C [50]
Co—350 °C [51]
Cu—400 °C [51]
Fe—380 °C [51]
Sn—450 °C [51]
Graphene coated (ultrasonicated and dried)—400 °C [47]
Milled with graphene nanoflakes—~300 °C [52]
Milled 1:10 mass with [53]:
graphite—109 °C
graphene oxide—114 °C
carbon nanotubes—116 °C
* polluted with buthylamine.
Publisher’s Note: MDPI stays neutral with regard to jurisdictional claims in published maps and institutional affiliations.

