
Global Resource Circularity for Lithium-Ion Batteries up to 2050: Traction and Stationary Use


Abstract
:1. Introduction
2. Materials and Methods
2.1. Total Material Requirement
2.1.1. Calculation Concept
2.1.2. Production
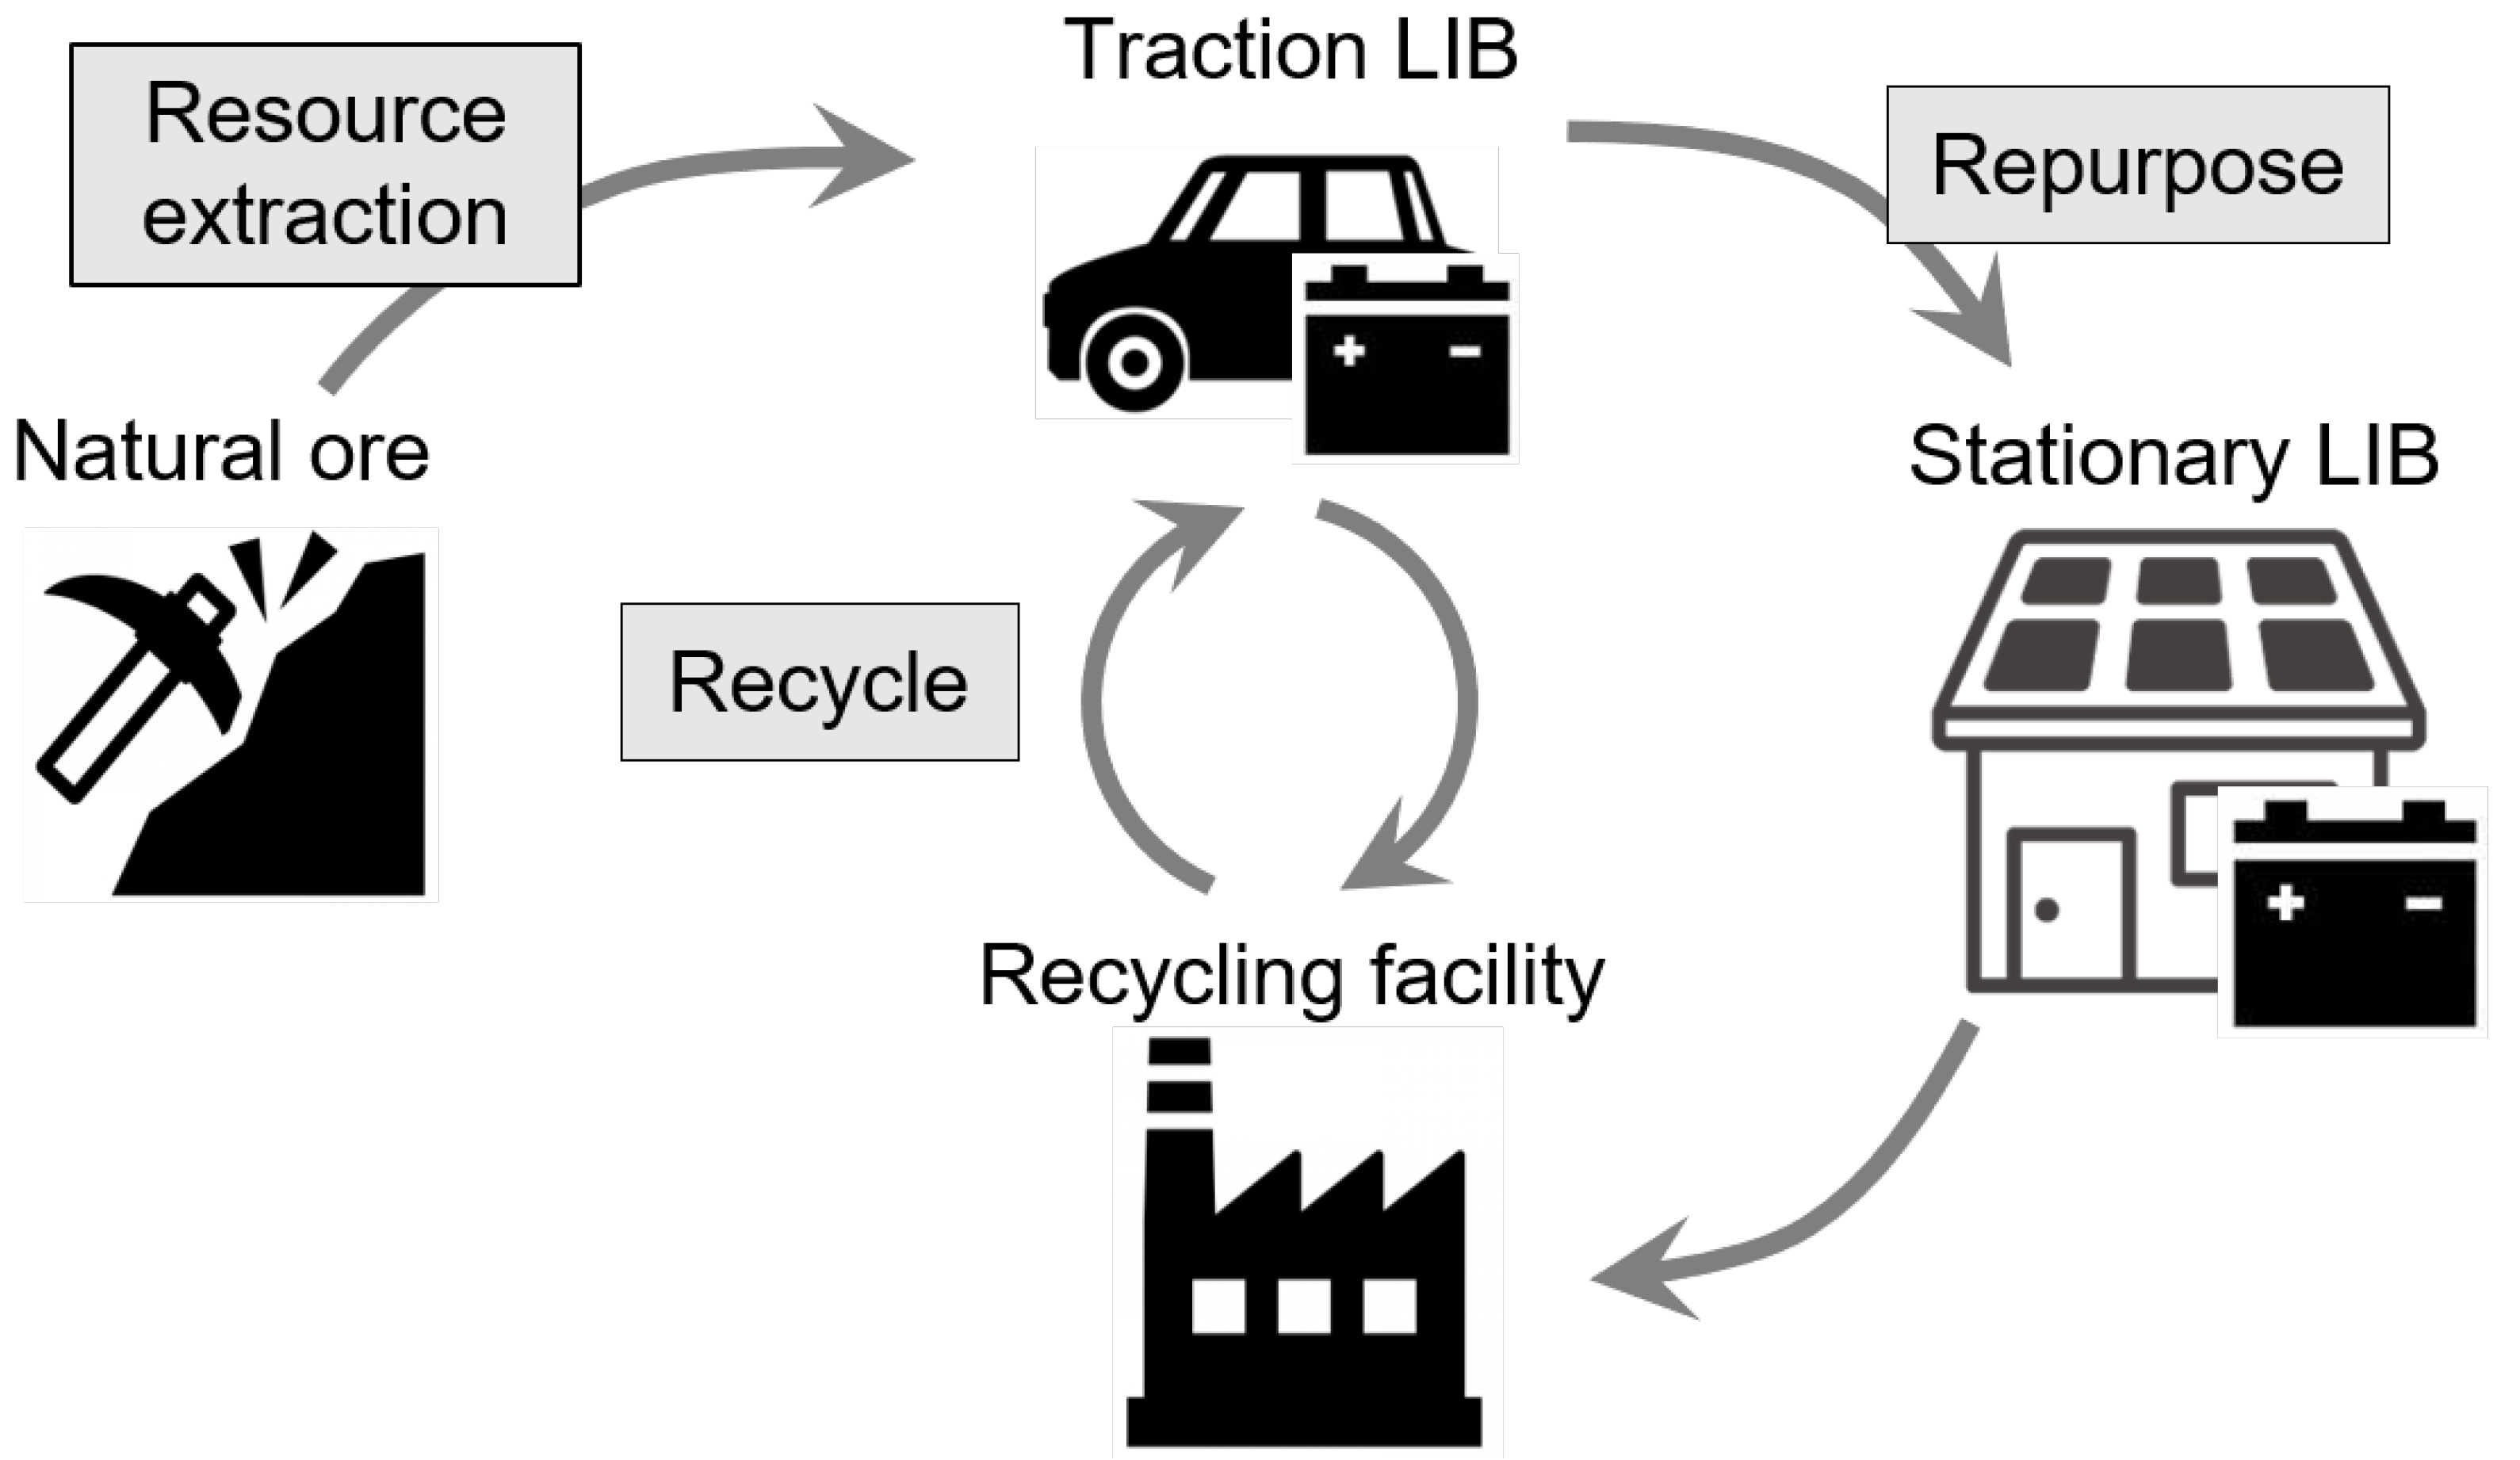
2.1.3. Repurposing
2.1.4. Recycling
2.2. Circularity of LIBs
2.2.1. Dynamic Material Flow Analysis
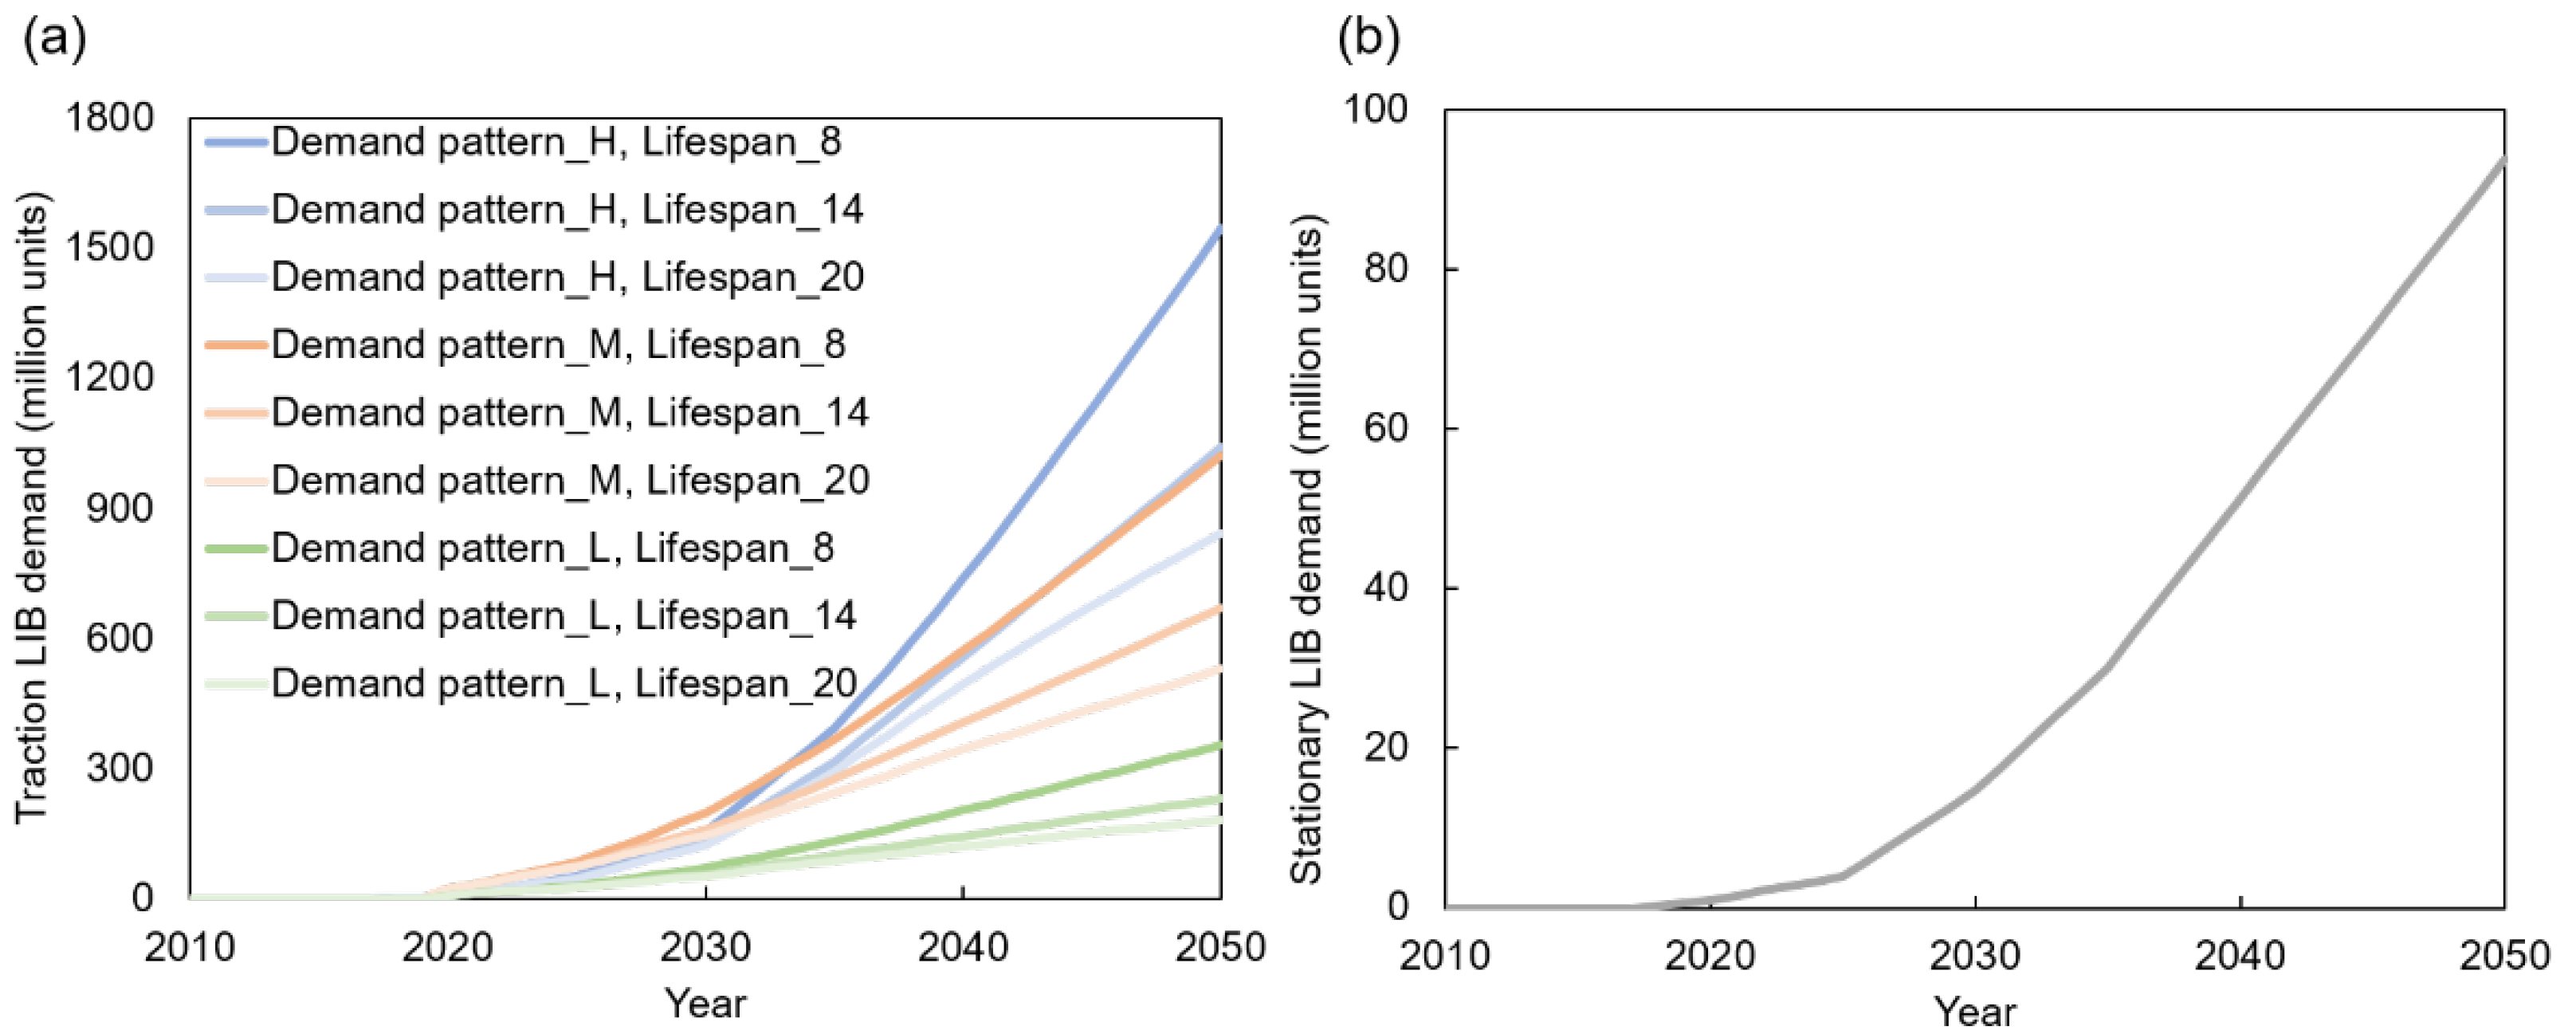
2.2.2. Lifespan
2.2.3. Demand
2.2.4. Effectiveness of Circularity
3. Results
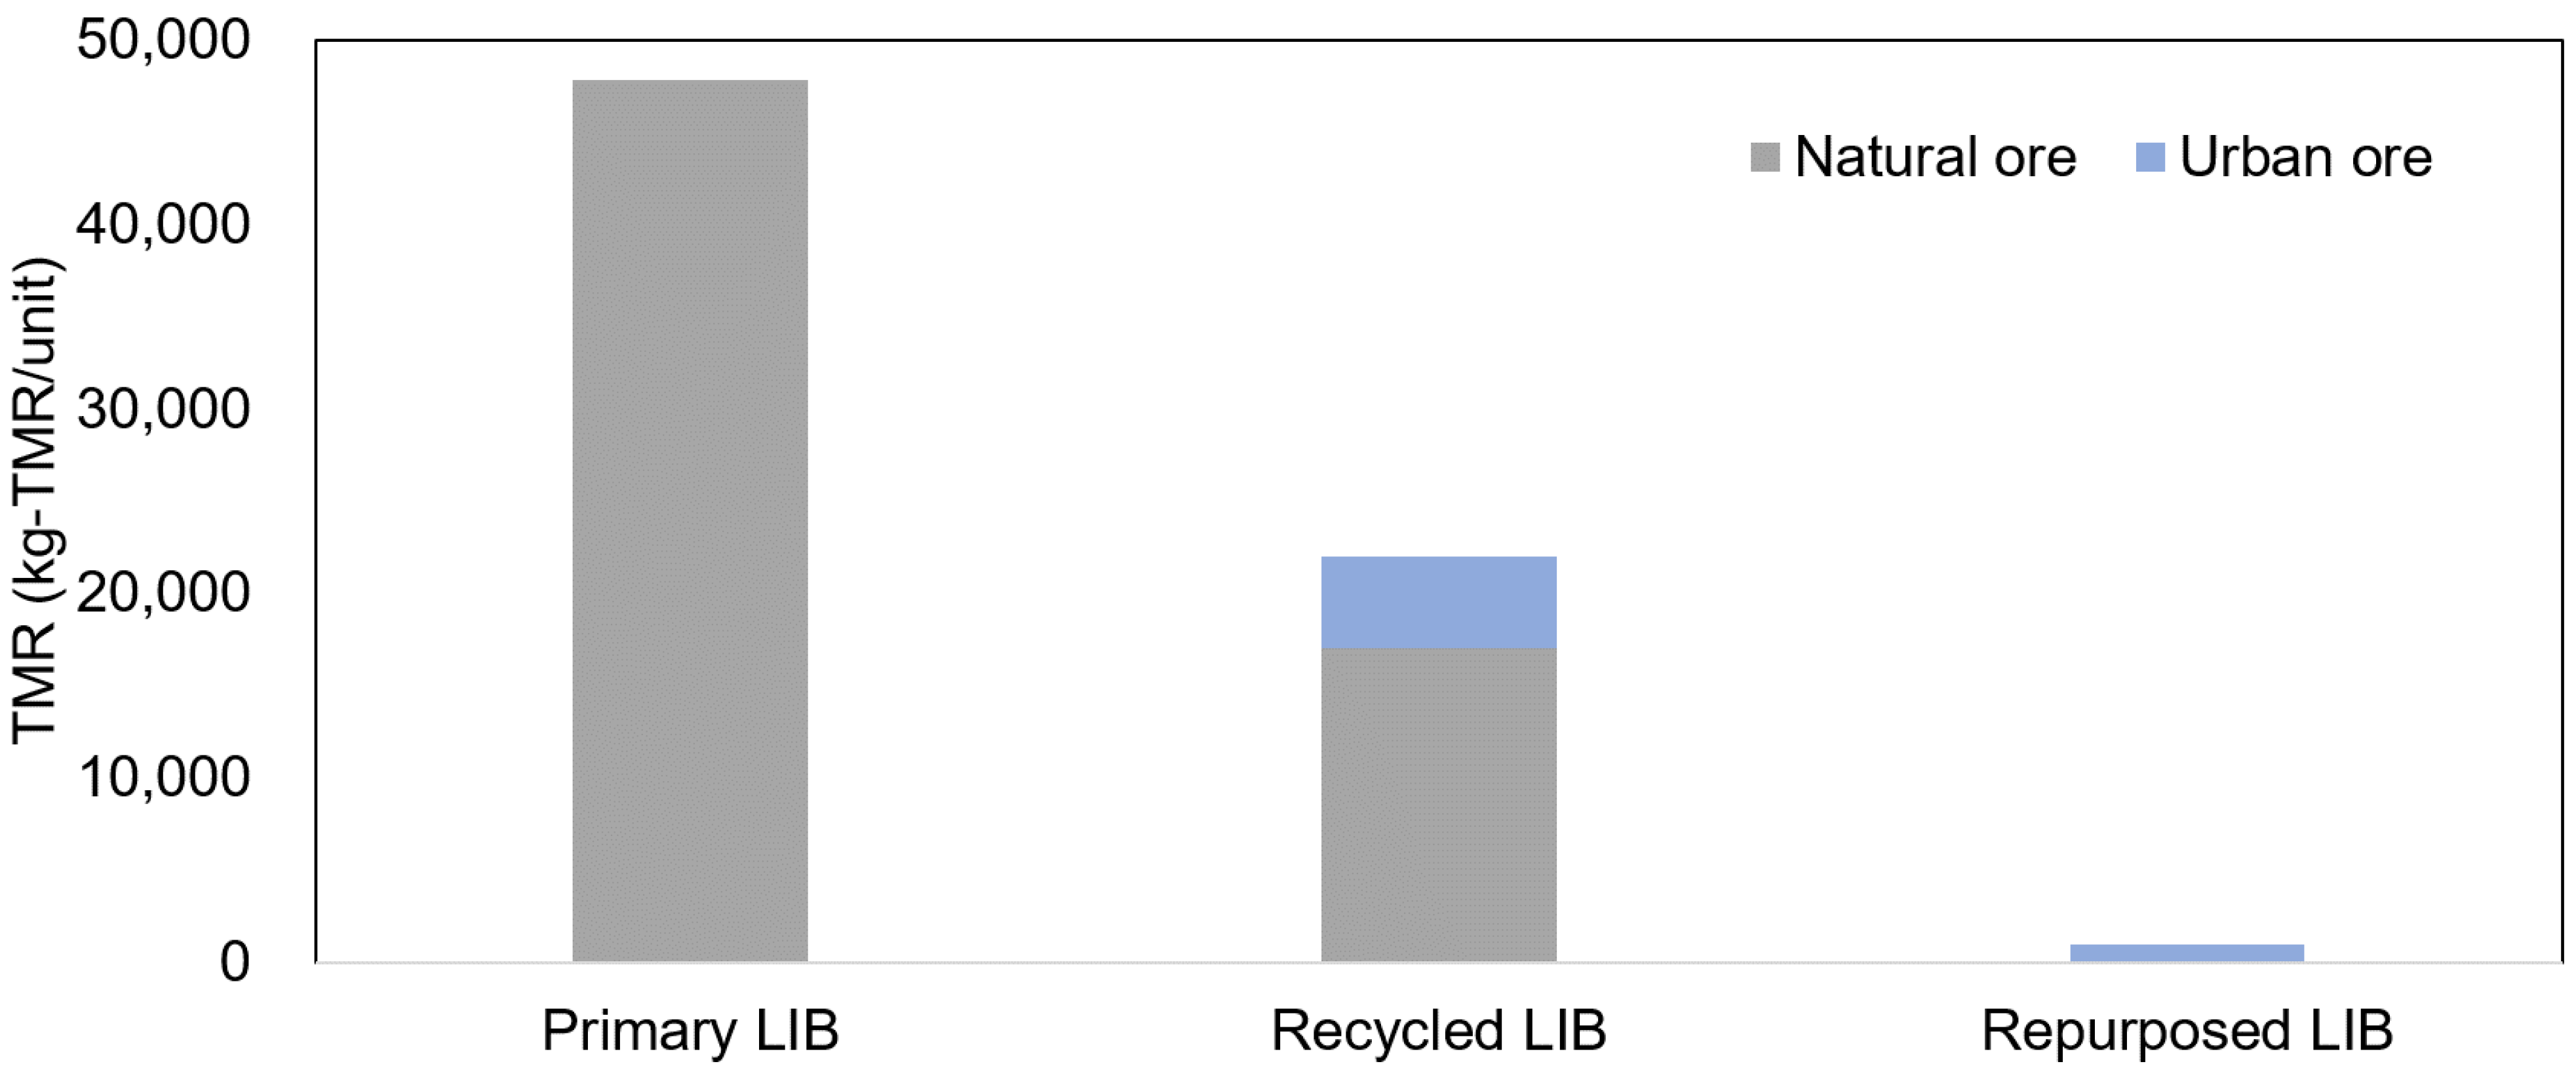
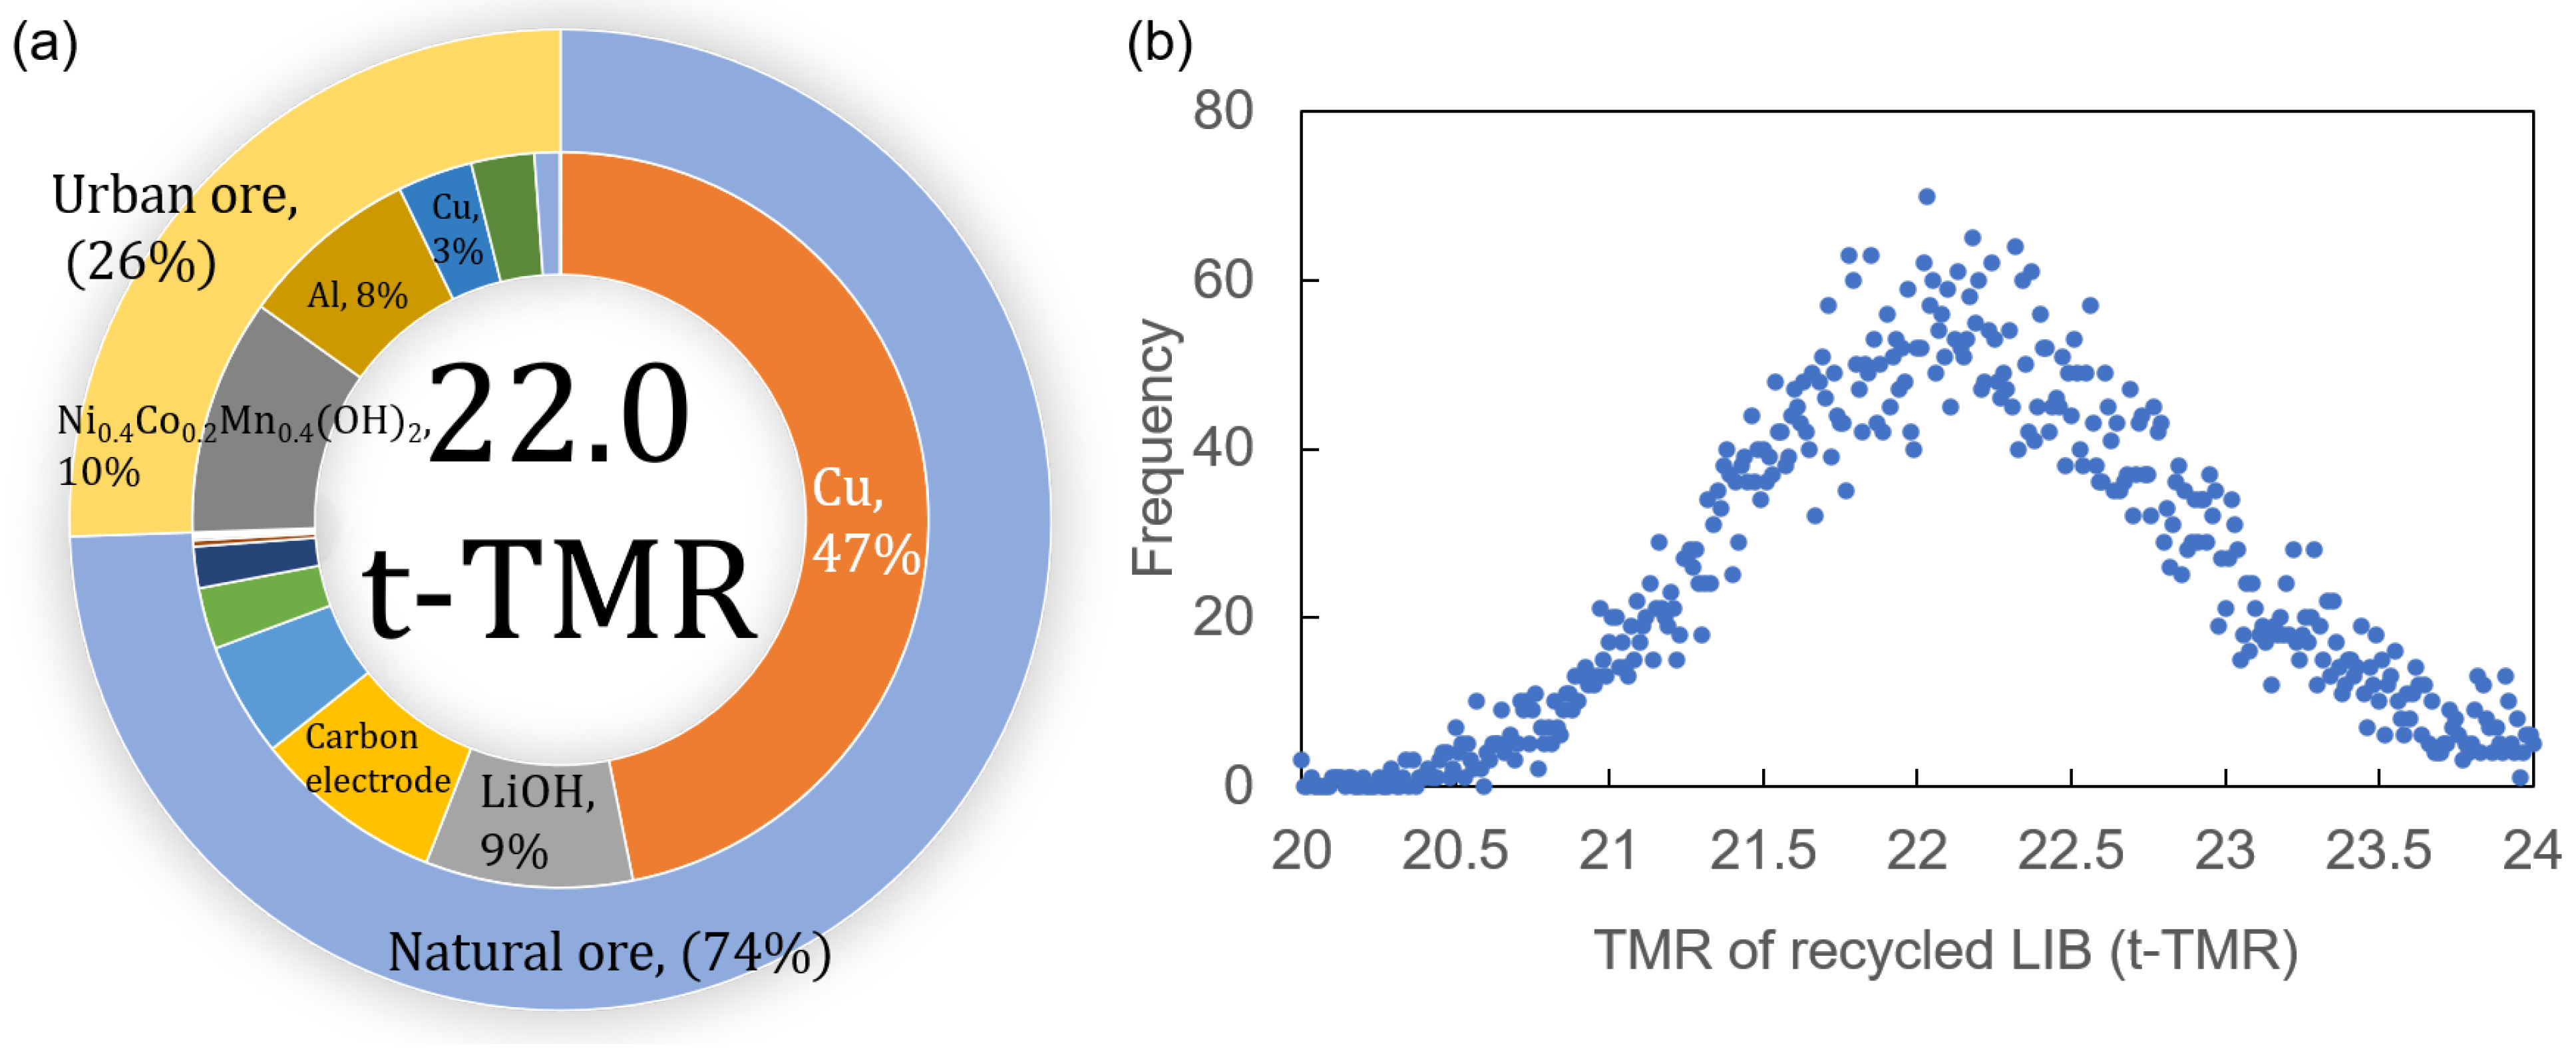
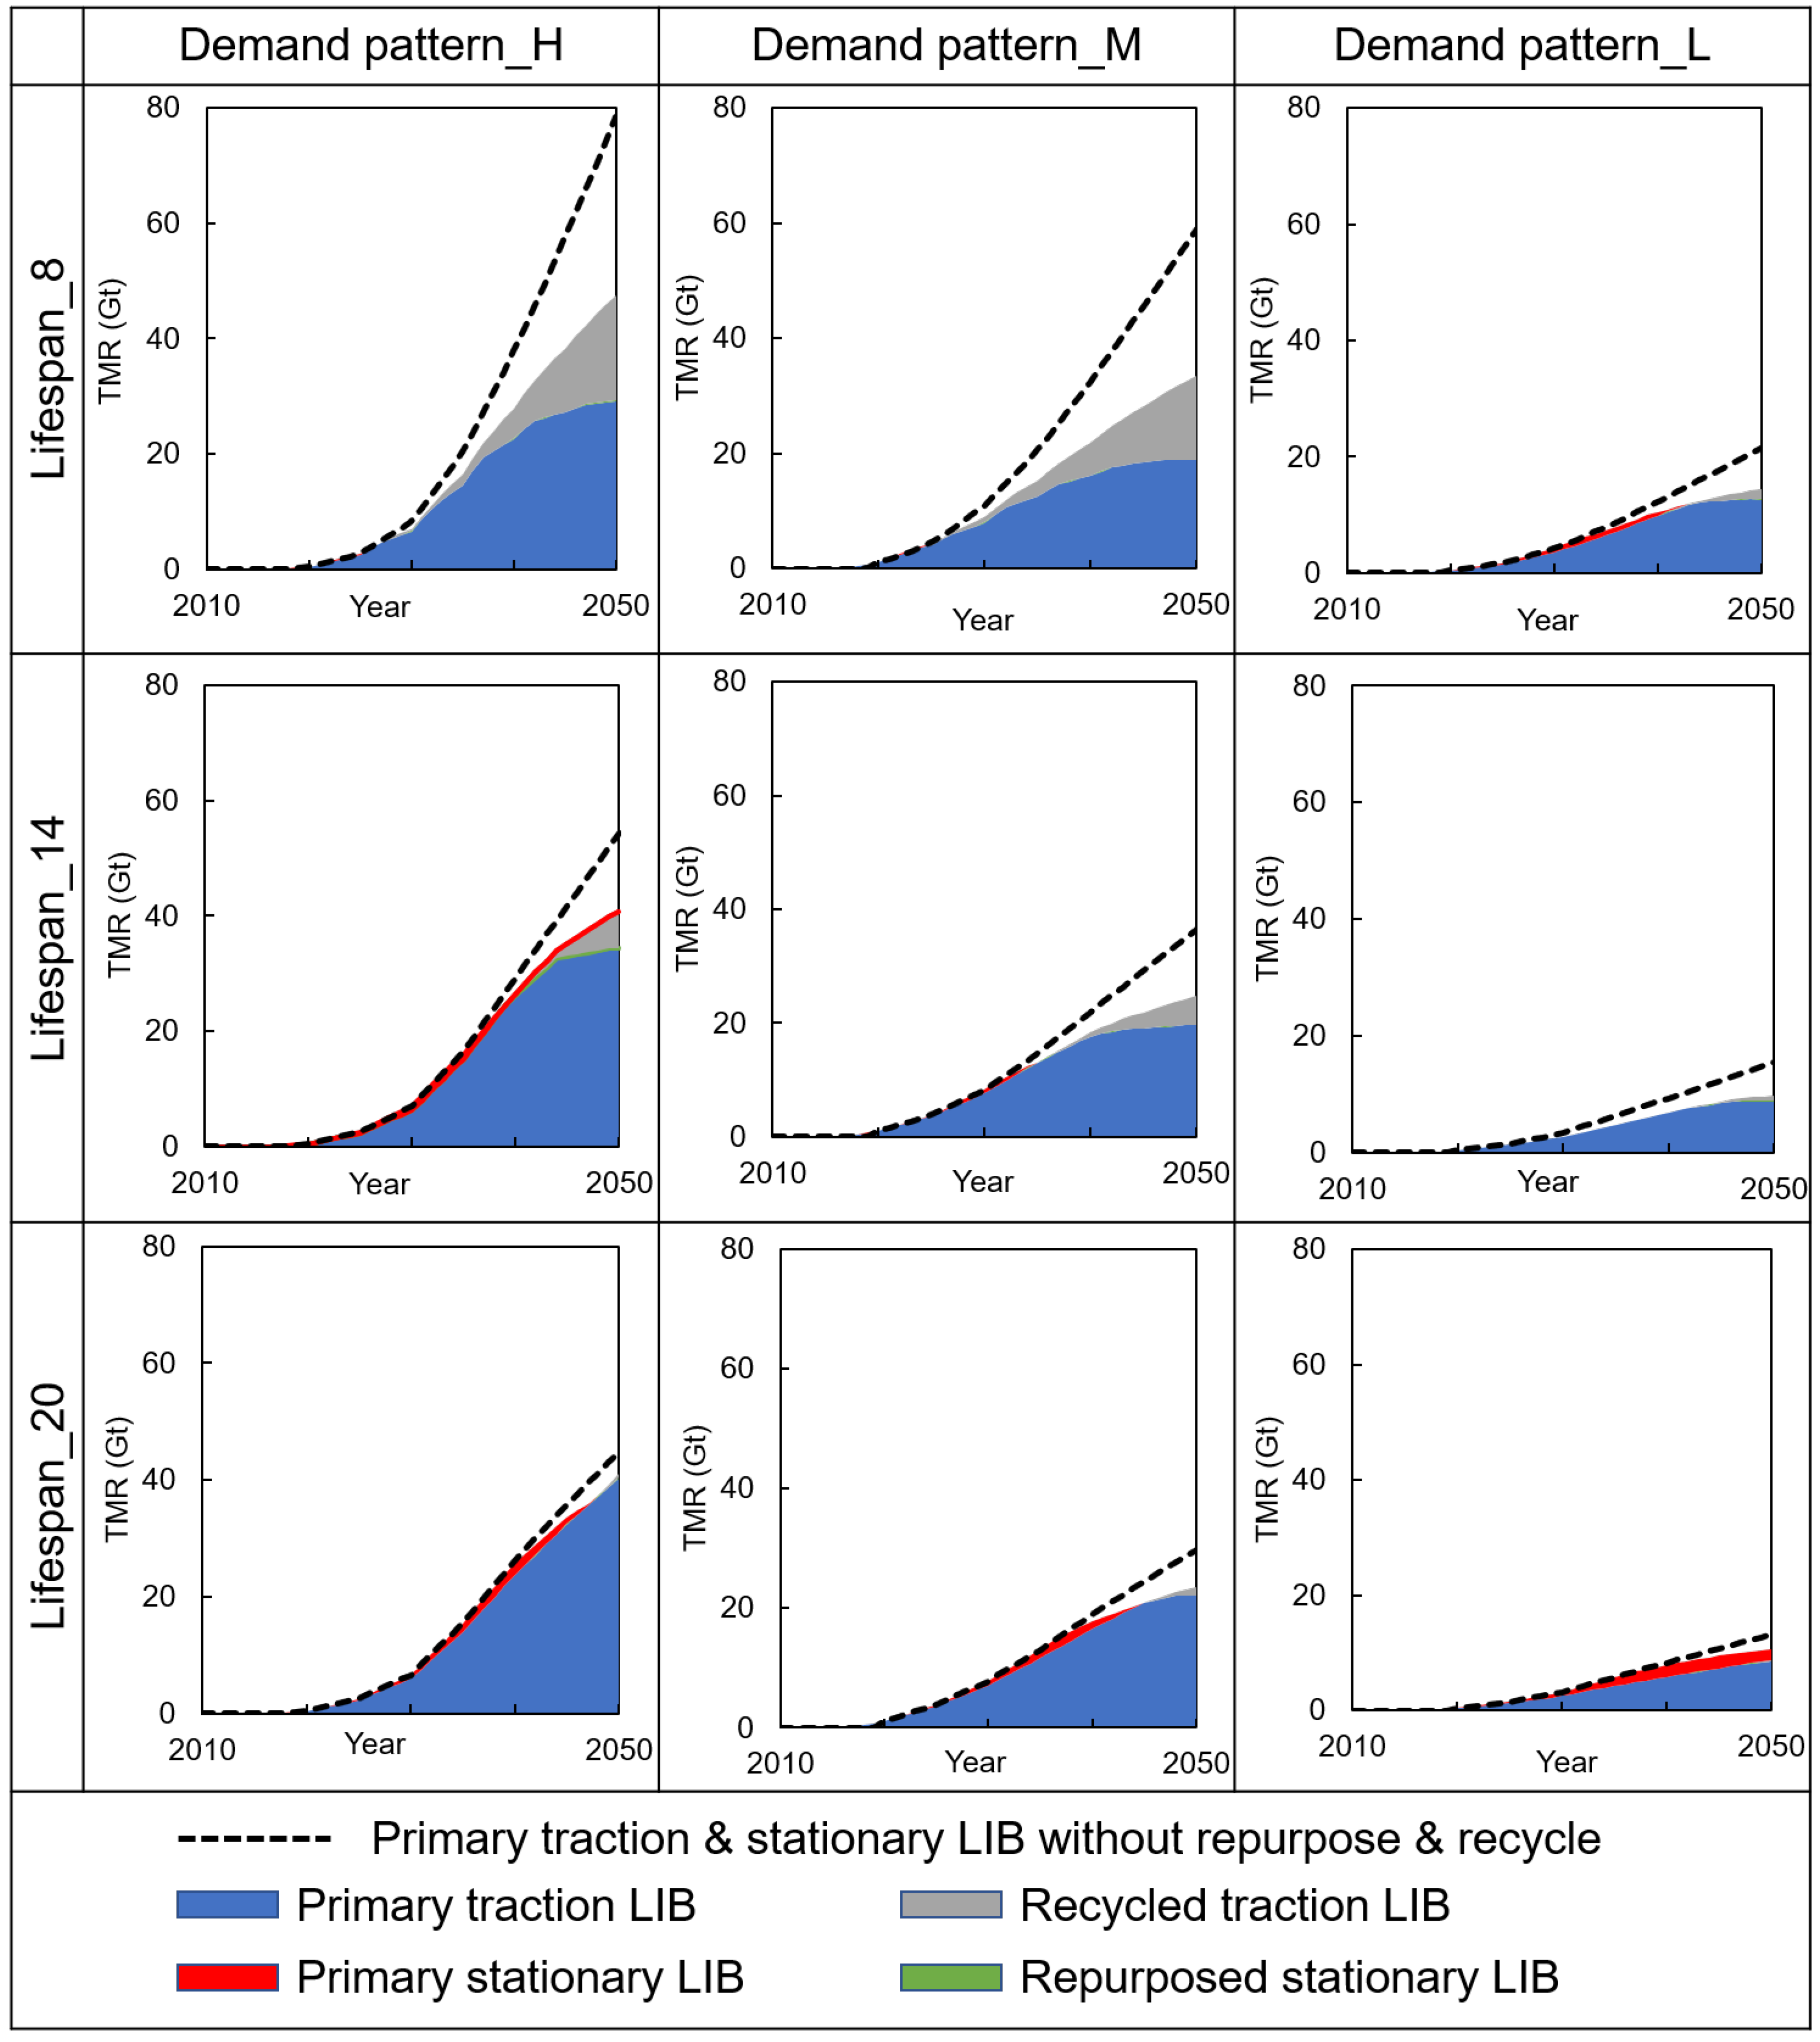
3.1. TMR for Repurposed and Recycled LIBs
3.2. Global Circular Resource Use
4. Discussion
4.1. Strategic Implications
4.2. Limitations and Future Prospective
Supplementary Materials
Author Contributions
Funding
Data Availability Statement
Acknowledgments
Conflicts of Interest
References
- Hu, X.; Murgovski, N.; Johannesson, L.M.; Egardt, B. Comparison of three electrochemical energy buffers applied to a hybrid bus power train with simultaneous optimal sizing and energy management. IEEE Trans. Intell. Transp. Syst. 2014, 15, 1193–1205. [Google Scholar] [CrossRef]
- Hammond, G.P.; Hazeldine, T. Indicative energy technology assessment of advanced rechargeable batteries. Appl. Energy 2015, 138, 559–571. [Google Scholar] [CrossRef] [Green Version]
- International Energy Agency. Energy Technology Perspectives 2020; International Energy Agency: Paris, France, 2020. [Google Scholar]
- International Energy Agency. Global EV Outlook 2017; IEA: Paris, France, 2017. [Google Scholar]
- Hua, Y.; Zhou, S.; Huang, Y.; Liu, X.; Ling, H.; Zhou, X.; Zhang, C.; Yang, S. Sustainable value chain of retired lithium-ion batteries for electric vehicles. J. Power Sources 2020, 478, 228753. [Google Scholar] [CrossRef]
- Velenturf, A.P.; Purnell, P. Principles for a sustainable circular economy. Sustain. Prod. Consum. 2021, 27, 1437–1457. [Google Scholar] [CrossRef]
- Ali, H.; Khan, H.A.; Pecht, M.G. Circular economy of Li Batteries: Technologies and trends. J. Energy Storage 2021, 40, 102690. [Google Scholar] [CrossRef]
- Harris, S.; Martin, M.; Diener, D. Circularity for circularity’s sake? Scoping review of assessment methods for environmental performance in the circular economy. Sustain. Prod. Consum. 2020, 26, 172–186. [Google Scholar] [CrossRef]
- Doose, S.; Mayer, J.; Michalowski, P.; Kwade, A. Challenges in Ecofriendly Battery Recycling and Closed Material Cycles: A Perspective on Future Lithium Battery Generations. Metals 2021, 11, 291. [Google Scholar] [CrossRef]
- Baars, J.; Domenech, T.; Bleischwitz, R.; Melin, H.E.; Heidrich, O. Circular economy strategies for electric vehicle batteries reduce reliance on raw materials. Nat. Sustain. 2020, 4, 71–79. [Google Scholar] [CrossRef]
- Xu, C.; Dai, Q.; Gaines, L.; Hu, M.; Tukker, A.; Steubing, B. Future material demand for automotive lithium-based batteries. Commun. Mater. 2020, 1, 99. [Google Scholar] [CrossRef]
- Kosai, S.; Matsui, K.; Matsubae, K.; Yamasue, E.; Nagasaka, T. Natural resource use of gasoline, hybrid, electric and fuel cell vehicles considering land disturbances. Resour. Conserv. Recycl. 2020, 166, 105256. [Google Scholar] [CrossRef]
- van Loon, P.; Diener, D.; Harris, S. Circular products and business models and environmental impact reductions: Current knowledge and knowledge gaps. J. Clean. Prod. 2020, 288, 125627. [Google Scholar] [CrossRef]
- Sommerville, R.; Zhu, P.; Rajaeifar, M.A.; Heidrich, O.; Goodship, V.; Kendrick, E. A qualitative assessment of lithium ion battery recycling processes. Resour. Conserv. Recycl. 2020, 165, 105219. [Google Scholar] [CrossRef]
- Ardente, F.; Peiró, L.T.; Mathieux, F.; Polverini, D. Accounting for the environmental benefits of remanufactured products: Method and application. J. Clean. Prod. 2018, 198, 1545–1558. [Google Scholar] [CrossRef] [PubMed]
- Zhao, G. Reuse and Recycling of Lithium-Ion Power Batteries; Wiley: Hoboken, NJ, USA, 2017. [Google Scholar] [CrossRef]
- Pagliaro, M.; Meneguzzo, F. Lithium battery reusing and recycling: A circular economy insight. Heliyon 2019, 5, e01866. [Google Scholar] [CrossRef] [Green Version]
- British Standardisation Institute. BS 8887-2-Design for Manufacture, Assembly, Disassembly and End-Of-Life Processing (MADE). Terms and Definitions; BSI: London, UK, 2009. [Google Scholar]
- Bobba, S.; Mathieux, F.; Ardente, F.; Blengini, G.A.; Cusenza, M.A.; Podias, A.; Pfrang, A. Life Cycle Assessment of re-purposed electric vehicles batteries: An adapted method based on modelling of energy flows. J. Energy Storage 2018, 19, 213–225. [Google Scholar] [CrossRef]
- Albertsen, L.; Richter, J.L.; Peck, P.; Dalhammar, C.; Plepys, A. Circular business models for electric vehicle lithium-ion batteries: An analysis of current practices of vehicle manufacturers and policies in the EU. Resour. Conserv. Recycl. 2021, 172, 105658. [Google Scholar] [CrossRef]
- Hein, R.; Kleindorfer, P.R.; Spinler, S. Valuation of electric vehicle batteries in vehicle-to-grid and battery-to-grid systems. Technol. Forecast. Soc. Chang. 2012, 79, 1654–1671. [Google Scholar] [CrossRef]
- Cusenza, M.A.; Guarino, F.; Longo, S.; Mistretta, M.; Cellura, M. Reuse of electric vehicle batteries in buildings: An integrated load match analysis and life cycle assessment approach. Energy Build. 2019, 186, 339–354. [Google Scholar] [CrossRef]
- Hua, Y.; Liu, X.; Zhou, S.; Huang, Y.; Ling, H.; Yang, S. Toward Sustainable Reuse of Retired Lithium-ion Batteries from Electric Vehicles. Resour. Conserv. Recycl. 2020, 168, 105249. [Google Scholar] [CrossRef]
- Mossali, E.; Picone, N.; Gentilini, L.; Rodrìguez, O.; Pérez, J.M.; Colledani, M. Lithium-ion batteries towards circular economy: A literature review of opportunities and issues of recycling treatments. J. Environ. Manag. 2020, 264, 110500. [Google Scholar] [CrossRef]
- Dunn, J.; Slattery, M.; Kendall, A.; Ambrose, H.; Shen, S. Circularity of Lithium-Ion Battery Materials in Electric Vehicles. Environ. Sci. Technol. 2021, 55, 5189–5198. [Google Scholar] [CrossRef] [PubMed]
- Ziemann, S.; Müller, D.B.; Schebek, L.; Weil, M. Modeling the potential impact of lithium recycling from EV batteries on lithium demand: A dynamic MFA approach. Resour. Conserv. Recycl. 2018, 133, 76–85. [Google Scholar] [CrossRef]
- Kamran, M.; Raugei, M.; Hutchinson, A. A dynamic material flow analysis of lithium-ion battery metals for electric vehicles and grid storage in the UK: Assessing the impact of shared mobility and end-of-life strategies. Resour. Conserv. Recycl. 2021, 167, 105412. [Google Scholar] [CrossRef]
- Castro, F.D.; Cutaia, L.; Vaccari, M. End-of-life automotive lithium-ion batteries (LIBs) in Brazil: Prediction of flows and revenues by 2030. Resour. Conserv. Recycl. 2021, 169, 105522. [Google Scholar] [CrossRef]
- Parchomenko, A.; Nelen, D.; Gillabel, J.; Vrancken, K.C.; Rechberger, H. Resource effectiveness of the European automotive sector—A statistical entropy analysis over time. Resour. Conserv. Recycl. 2021, 169, 105558. [Google Scholar] [CrossRef]
- Acerbi, F.; Taisch, M. A literature review on circular economy adoption in the manufacturing sector. J. Clean. Prod. 2020, 273, 123086. [Google Scholar] [CrossRef]
- Fischer-Kowalski, M.; Krausmann, F.; Giljum, S.; Lutter, S.; Mayer, A.; Bringezu, S.; Moriguchi, Y.; Schütz, H.; Schandl, H.; Weisz, H. Methodology and Indicators of Economy-wide Material Flow Accounting: State of the Art and Reliability Across Sources. J. Ind. Ecol. 2011, 15, 855–876. [Google Scholar] [CrossRef]
- Kovanda, J.; Weinzettel, J. Economy-wide Material Flow Indicators on a Sectoral Level and Strategies for Decreasing Material Inputs of Sectors. J. Ind. Ecol. 2016, 21, 26–37. [Google Scholar] [CrossRef] [Green Version]
- Bringezu, S.; Schütz, H.; Steger, S.; Baudisch, J. International comparison of resource use and its relation to economic growth: The development of total material requirement, direct material inputs and hidden flows and the structure of TMR. Ecol. Econ. 2004, 52, 97–124. [Google Scholar] [CrossRef]
- Nakajima, K.; Noda, S.; Nansai, K.; Matsubae, K.; Takayanagi, W.; Tomita, M. Global Distribution of Used and Unused Extracted Materials Induced by Consumption of Iron, Copper, and Nickel. Environ. Sci. Technol. 2019, 53, 1555–1563. [Google Scholar] [CrossRef] [Green Version]
- Kosai, S.; Yamasue, E. Global warming potential and total material requirement in metal production: Identification of changes in environmental impact through metal substitution. Sci. Total Environ. 2018, 651, 1764–1775. [Google Scholar] [CrossRef] [PubMed]
- Södersten, C.-J.; Wood, R.; Wiedmann, T. The capital load of global material footprints. Resour. Conserv. Recycl. 2020, 158, 104811. [Google Scholar] [CrossRef]
- Watari, T.; Nansai, K.; Nakajima, K.; Giurco, D. Sustainable energy transitions require enhanced resource governance. J. Clean. Prod. 2021, 312, 127698. [Google Scholar] [CrossRef]
- Halada, K.; Iijima, K.; N, N.; Okura, T. An Approximate Estimation of Total Material Requirement of Metals. J. Jpn. Inst. Met. Mater 2001, 65, 564–670. [Google Scholar] [CrossRef] [Green Version]
- Nakajima, K.; Halada, K.; Ijima, K.; Nagasaka, T. Estimation of Total Materials Requirement: Energy Resources and Industrial Materials. J. Life Cycle Assess. Jpn. 2006, 2, 152–158. [Google Scholar] [CrossRef] [Green Version]
- Wuppertal Institut for Climate, Environment and Energy. Material Intensity of Materials, Fuels, Transport Services, Food; Wuppertal Institute: Wuppertal, Germany, 2011. [Google Scholar]
- Kosai, S.; Takata, U.; Yamasue, E. Natural resource use of a traction lithium-ion battery production based on land dis-turbances through mining activities. J. Clean. Prod. 2021, 280, 124871. [Google Scholar] [CrossRef]
- Ellingsen, L.A.-W.; Majeau-Bettez, G.; Singh, B.; Srivastava, A.K.; Valøen, L.O.; Strømman, A.H. Life Cycle Assessment of a Lithium-Ion Battery Vehicle Pack. J. Ind. Ecol. 2013, 18, 113–124. [Google Scholar] [CrossRef] [Green Version]
- Yamasue, E.; Minamino, R.; Numata, T.; Nakajima, K.; Murakami, S.; Daigo, I.; Hashimoto, S.; Okumura, H.; Ishihara, K. Novel Evaluation Method of Elemental Recyclability from Urban Mine—Concept of Urban Ore TMR—. Mater. Trans. 2009, 50, 1536–1540. [Google Scholar] [CrossRef] [Green Version]
- Yamasue, E.; Matsubae, K.; Nakajima, K.; Daigo, I.; Ishihara, K.N. Total Material Requirement of Scrap Steel from End-of-Life Vehicle. Tetsu Hagane 2014, 100, 778–787. [Google Scholar] [CrossRef] [Green Version]
- Tomić, T.; Schneider, D.R. The role of energy from waste in circular economy and closing the loop concept—Energy analysis approach. Renew. Sustain. Energy Rev. 2018, 98, 268–287. [Google Scholar] [CrossRef]
- Huysman, S.; Debaveye, S.; Schaubroeck, T.; De Meester, S.; Ardente, F.; Mathieux, F.; Dewulf, J. The recyclability benefit rate of closed-loop and open-loop systems: A case study on plastic recycling in Flanders. Resour. Conserv. Recycl. 2015, 101, 53–60. [Google Scholar] [CrossRef]
- Müller, E.; Hilty, L.M.; Widmer, R.; Schluep, M.; Faulstich, M. Modeling metal stocks and flows: A review of dynamic material flow analysis methods. Environ. Sci. Technol. 2014, 48, 2102–2113. [Google Scholar] [CrossRef] [PubMed]
- Wang, F.; Huisman, J.; Stevels, A.; Baldé, C.P. Enhancing e-waste estimates: Improving data quality by multivariate Input-Output Analysis. Waste Manag. 2013, 33, 2397–2407. [Google Scholar] [CrossRef] [PubMed]
- Yano, J.; Muroi, T.; Sakai, S.-I. Rare earth element recovery potentials from end-of-life hybrid electric vehicle components in 2010. J. Mater. Cycles Waste Manag. 2015, 18, 655–664. [Google Scholar] [CrossRef]
- Takata, S.; Suemasu, K.; Asai, K. Life cycle simulation system as an evaluation platform for multitiered circular manu-facturing systems. CIRP Ann. Manuf. Technol. 2019, 68, 21–24. [Google Scholar] [CrossRef]
- NISSAN. Driving Range. Available online: https://area.nissan.co.jp/fair/ni-aichi/18/11/leaf-for-you/distance/ (accessed on 10 February 2021).
- IEA. Global EV Outlook 2018; IEA: Paris, France, 2018. [Google Scholar]
- Zou, Y.; Hu, X.; Ma, H.; Li, S.E. Combined State of Charge and State of Health estimation over lithium-ion battery cell cycle lifespan for electric vehicles. J. Power Sources 2015, 273, 793–803. [Google Scholar] [CrossRef]
- Casals, L.C.; García, B.A.; Aguesse, F.; Iturrondobeitia, A. Second life of electric vehicle batteries: Relation between materials degradation and environmental impact. Int. J. Life Cycle Assess. 2015, 22, 82–93. [Google Scholar] [CrossRef]
- Derousseau, M.; Gully, B.; Taylor, C.; Apelian, D.; Wang, Y. Repurposing Used Electric Car Batteries: A Review of Options. JOM 2017, 69, 1575–1582. [Google Scholar] [CrossRef]
- Peters, J.F.; Baumann, M.; Zimmermann, B.; Braun, J.; Weil, M. The environmental impact of Li-Ion batteries and the role of key parameters—A review. Renew. Sustain. Energy Rev. 2017, 67, 491–506. [Google Scholar] [CrossRef]
- Tsasaki, T.; Oguchi, M.; Kameya, T.; Urano, K. A Prediction Method for the Number of Waste Durable Goods. J. Jpn. Soc. Waste Manag. Experts 2001, 12, 49–58. (In Japanese) [Google Scholar] [CrossRef]
- Tsiropoulos, I.; Tarvydas, D.; Lebedeva, N. Li-Ion Batteries for Mobility and Stationary Storage Applications—Scenarios for Costs and Market Growth; EUR 29440 EN.; Publications Office of the European Union: Luxembourg, 2018. [Google Scholar]
- Douglas, I.; Lawson, N. Material Flows Due to Mining and Urbanization; Edward Elgar Publishing: Cheltenham, UK, 2002. [Google Scholar] [CrossRef]
- Wiedmann, T.; Schandl, H.; Lenzen, M.; Moran, D.; Suh, S.; West, J.; Kanemoto, K. The material footprint of nations. Proc. Natl. Acad. Sci. USA 2015, 112, 6271–6276. [Google Scholar] [CrossRef] [Green Version]
- Wiedenhofer, D.; Fishman, T.; Lauk, C.; Haas, W.; Krausmann, F. Integrating Material Stock Dynamics Into Economy-Wide Material Flow Accounting: Concepts, Modelling, and Global Application for 1900–2050. Ecol. Econ. 2019, 156, 121–133. [Google Scholar] [CrossRef]
- Nissan. Nissan LEAF Range & Charging, Nissan USA. Available online: https://www.nissanusa.com/vehicles/electric-cars/leaf/range-charging.html (accessed on 1 August 2018).
- Martinez-Laserna, E.; Gandiaga, I.; Sarasketa-Zabala, E.; Badeda, J.; Stroe, D.I.; Swierczynski, M.; Goikoetxea, A. Battery second life: Hype, hope or reality? A critical review of the state of the art. Renew. Sustain. Energy Rev. 2018, 93, 701–718. [Google Scholar] [CrossRef]
- Wewer, A.; Bilge, P.; Dietrich, F. Advances of 2nd Life Applications for Lithium Ion Batteries from Electric Vehicles Based on Energy Demand. Sustainability 2021, 13, 5726. [Google Scholar] [CrossRef]
- Shao, J.; Ünal, E. What do consumers value more in green purchasing? Assessing the sustainability practices from demand side of business. J. Clean. Prod. 2018, 209, 1473–1483. [Google Scholar] [CrossRef]
- Yin, B.; Liu, L.; Coulombel, N.; Viguié, V. Appraising the environmental benefits of ride-sharing: The Paris region case study. J. Clean. Prod. 2017, 177, 888–898. [Google Scholar] [CrossRef]
- Pauliuk, S.; Heeren, N.; Berrill, P.; Fishman, T.; Nistad, A.; Tu, Q.; Wolfram, P.; Hertwich, E.G. Global scenarios of resource and emission savings from material efficiency in residential buildings and cars. Nat. Commun. 2021, 12, 1–10. [Google Scholar] [CrossRef]
- Ministry of Economy Trade and Industry. Vehicle Recycling; Ministry of Economy Trade and Industry: Tokyo, Japan, 2020. [Google Scholar]
- Yano, J.; Hirai, Y.; Okamoto, K.; Sakai, S.-I. Dynamic flow analysis of current and future end-of-life vehicles generation and lead content in automobile shredder residue. J. Mater. Cycles Waste Manag. 2013, 16, 52–61. [Google Scholar] [CrossRef] [Green Version]
- Xiang, Y.; Liu, K.; Su, T.; Li, J.; Ouyang, S.; Mao, S.S.; Geimer, M. An Extension of BIM Using AI: A Multi Working-Machines Pathfinding Solution. IEEE Access 2021, 9, 124583–124599. [Google Scholar] [CrossRef]


| Lifecycle Stage | Lifespan_8 | Lifespan_14 | Lifespan_20 | |||
|---|---|---|---|---|---|---|
| SOH (%) | Duration (Year) | SOH (%) | Duration (Year) | SOH (%) | Duration (Year) | |
| 1 * | 100~95 | 8 | 100~90 | 14 | 100~85 | 20 |
| 2 ** | 95~90 | 10 | 90~85 | 10 | 85~80 | 10 |
| Demand Pattern_H | Demand Pattern_M | Demand Pattern_L | ||
|---|---|---|---|---|
| Lifespan_8 | Reduction rate | 39% | 44% | 33% |
| TMR | 47.5 Gt | 30.0 Gt | 14.4 Gt | |
| Lifespan_14 | Reduction rate | 25% | 32% | 37% |
| TMR | 40.7 Gt | 24.8 Gt | 9.7 Gt | |
| Lifespan_20 | Reduction rate | 8% | 21% | 20% |
| TMR | 41.1 Gt | 23.5 Gt | 10.6 Gt | |
Publisher’s Note: MDPI stays neutral with regard to jurisdictional claims in published maps and institutional affiliations. |
© 2022 by the authors. Licensee MDPI, Basel, Switzerland. This article is an open access article distributed under the terms and conditions of the Creative Commons Attribution (CC BY) license (https://creativecommons.org/licenses/by/4.0/).
Share and Cite
Kosai, S.; Takata, U.; Yamasue, E. Global Resource Circularity for Lithium-Ion Batteries up to 2050: Traction and Stationary Use. Mining 2022, 2, 449-462. https://doi.org/10.3390/mining2030024
Kosai S, Takata U, Yamasue E. Global Resource Circularity for Lithium-Ion Batteries up to 2050: Traction and Stationary Use. Mining. 2022; 2(3):449-462. https://doi.org/10.3390/mining2030024
Chicago/Turabian StyleKosai, Shoki, Ukyo Takata, and Eiji Yamasue. 2022. "Global Resource Circularity for Lithium-Ion Batteries up to 2050: Traction and Stationary Use" Mining 2, no. 3: 449-462. https://doi.org/10.3390/mining2030024