Article

Inhibition of Lactate Dehydrogenase-A by Singlet Oxygen and Hypochlorous Acid via Cysteine Oxidation and Irreversible Conformational Changes

Department of Chemistry, College of William and Mary, Williamsburg, VA 23187-8795, USA
*
Author to whom correspondence should be addressed.
BioChem 2024, 4(1), 18-37; https://doi.org/10.3390/biochem4010002
Submission received: 9 December 2023 / Revised: 9 January 2024 / Accepted: 22 January 2024 / Published: 2 February 2024

Abstract

:
Muscle lactate dehydrogenase (LDH-A) catalyzes the reduction of pyruvate to lactate, the end product of anaerobic glycolysis. LDH-A is overexpressed in many cancers prior to and even when tumors receive adequate oxygen, and lactate has multiple cellular roles. We assessed the effect of singlet oxygen and hypochlorous acid (HOCl) on mammalian LDH-A. Oxidants induced distinct patterns of protein crosslinks observed by SDS-PAGE under reducing conditions. LDH-A cysteines were detected using fluorescein-modified maleimide to assess their oxidation and accessibility. Singlet oxygen initially increased cysteine exposure, but higher doses resulted in their oxidation in addition to non-reducible covalent crosslinks. LDH-A cysteines were oxidized by micromolar HOCl (1–10 equivalents over enzyme) but were resistant to millimolar H2O2, chloramines and Angeli’s salt. HOCl oxidation inhibited LDH-A activity and yielded inter-chain disulfides observed by nonreducing SDS-PAGE. Disulfide reduction did not restore LDH-A activity that was lost due to HOCl oxidation. An irreversible conformational change induced by HOCl was detected by native gel electrophoresis and tryptophan fluorescence. In the absence of pyruvate, LDH-A enhanced NADH oxidation resulting in H2O2 formation. Singlet oxygen, but not HOCl, initiated this superoxide-dependent chain reaction. Once damaged by both singlet oxygen or HOCl, LDH-A had decreased NADH oxidation activity.

1. Introduction

Lactate dehydrogenase (LDH) is a cytosolic enzyme that catalyzes the reduction of pyruvate to lactate with the concomitant oxidation of NADH to NAD+. The two LDH isozymes were originally designated as muscle (LDH-A) and heart (LDH-B) LDH decades ago [1]. While LDH-A preferentially catalyzes the formation of L-lactate, LDH-B favors the reverse reaction. Their cellular expression even within tissues varies widely, with LDH-B expressed in neurons and LDH-A expressed in astrocytes [2]. Likewise, cancer-associated fibroblasts expressing LDH-A produce lactate, and adjacent cancer cells expressing LDH-B consume lactate for energy in a symbiotic manner [3].
Early studies of LDH and lactate synthesis focused on its role in carbohydrate metabolism as an end product of anaerobic glycolysis. More recently, efforts have been directed at understanding the role of LDH enzymes in tumor growth [4,5]. LDH-A is overexpressed in many cancers, especially prior to and even when tumors receive adequate oxygen [6]. Otto Warburg observed enhanced glycolysis despite functionally intact mitochondria more than 80 years ago [7,8].
LDH-A has numerous moonlighting functions. A dimeric complex between LDH-A and the glycolytic enzyme GAPDH acts as a nuclear transcription factor [9]. Also, LDH-A serves as a single-stranded DNA binding protein in an NADH-dependent manner [10,11]. A mitochondrial LDH isozyme has been identified in some prostate and liver cancer cells [12]. L-lactate has been identified as a signaling molecule with roles in immune cell function, histone modification and gene expression [3,13]. In addition, L-lactate decreases immune cell function so that tumor cells evade detection. Millimolar concentrations of L-lactate inhibit histone deacetylases thereby coupling a cell’s metabolic state with gene transcription [14].
Beyond its pivotal role in cancer cell metabolism, LDH-A has been identified as a target of oxidative stress in a neuronal cell line [15]. The hypothesis that cumulative oxidative damage to proteins contributes to the development of neurodegenerative diseases is based on extensive pathologic and cellular data [16]. Myeloperoxidase (MPO), the enzyme that generates the strong oxidant hypochlorous acid (HOCl), is aberrantly expressed in neurons in Alzheimer’s disease brains [17]. As a result, the MPO-specific metabolite 3-chlorotyrosine has been shown to be increased threefold in Alzheimer’s brains relative to control brains.
Only very limited studies have addressed the effect of oxidants on LDH-A activity [18]. Given its critical role in both cancer cell metabolism and in the neuron-astrocyte lactate shuttle, we examined the effects of several reactive oxygen species (ROS) including singlet oxygen (1O2), HOCl and H2O2 on LDH-A kinetics and structure. Our initial interest focused on the cysteines of LDH-A because thiol oxidation is a likely outcome of cellular oxidative stress and is associated with degenerative disease progression [19,20]. Each of the four subunits of the LDH-A homotetramer has five reduced cysteines; one of these is essential for catalytic activity and another is adjacent to the active site [21,22].
Although we recently reported that 1O2 induced the formation of multiple crosslinks between LDH-A subunits thereby inhibiting activity, we did not specifically investigate the effects of 1O2 or other ROS on the cysteines of LDH-A [23]. Given that 1O2 is produced as the primary oxidant during photodynamic therapy and that LDH-A is often overexpressed in tumors, a more thorough investigation is warranted [24].
Using SDS-PAGE in conjunction with cysteine-specific fluorescent tags, kinetic assays, native gel electrophoresis and tryptophan fluorescence, we provide evidence for LDH-A conformational changes induced by 1O2 and HOCl that alter cysteine accessibility. While HOCl did oxidize LDH-A cysteines and inhibit activity, conformational changes were not reversed by disulfide reduction; therefore, damage to LDH-A by HOCl is irreversible. LDH-A was resistant to inhibition and to cysteine oxidation by H2O2, chloramines and Angeli’s salt, a cysteine-reactive nitroxyl donor.
Lastly, the ability of LDH-A to enhance NADH oxidation, independent of pyruvate, was examined. Several research groups have reported that mammalian LDH-A enhances NADH oxidation following ROS exposure in vitro [25,26]. They determined that increased NADH oxidation by LDH-A involves a chain reaction propagated by superoxide anion (O2•−) that yields H2O2. Wu et al. demonstrated in HeLa cells that LDH enzymes were directly responsible for increased H2O2 production and overall oxidative stress [27]. Herein, we show that 1O2, but not HOCl, initiated NADH oxidation by LDH-A via intermediate O2•−. LDH-A oxidation by 1O2 or HOCl prior to initiation resulted in decreased capacity to perform this reaction.

2. Materials and Methods

2.1. Materials and Reagents

The West Pico chemiluminescence detection system, Tris(2-carboxyethyl)phosphine (TCEP), maleimide-5-fluorescein (M5F) and 5-iodoacetomido-fluorescein (IAF) were from Thermo Fisher Scientific (Waltham, MA, USA). Rabbit muscle LDH-A was from Millipore (Burlington, MA, USA). Rabbit muscle pyruvate kinase and human leukocyte myeloperoxidase were from Sigma (St. Louis, MO, USA). Mouse monoclonal LDH-A antibody was from Abcam (Cambridge, UK). Cibacron Blue resin and 10DG columns were from Bio-Rad (Hercules, CA, USA). All other chemicals were from Fisher or Sigma and were of the highest purity available. The concentration of HOCl was determined by measuring the absorbance at 292 nm (ε292 = 350 M−1 cm−1) in 0.1 M NaOH [28]. A solution of Angeli’s salt was prepared in 0.01 M NaOH immediately prior to use. Glycine chloramine was synthesized as described [29]. All reactions were performed at 20–22 °C unless otherwise stated. To calculate the LDH concentration, the absorbance at 280 nm was converted to mg/mL using 1.13 as the conversion factor.

2.2. LDH-A Purification by Cibacron Blue (CB) Chromatography

LDH-A was isolated from contaminants by CB chromatography as described [30]. A CB column (1 mL bed volume) was equilibrated with 50 mM PB pH 7.1. Approximately 15 mg of total protein dissolved in 3 mL 50 mM PB pH 7.1 was loaded, and the column was washed with 2 bed volumes of the same buffer. Contaminants were eluted with 50 mM PB pH 7.1 containing 0.2 M NaCl (3 × 1 mL fractions). Pure LDH-A was eluted with 50 mM PB pH 7.1 plus 1 mM NADH (5 × 1 mL). Fractions with LDH-A activity were pooled, treated with 10 mM DTT for 15 min and desalted on a Bio-Rad 10DG desalting column to remove DTT and NADH and to exchange LDH-A into 10 mM PB pH 7.4.

2.3. Pyruvate Kinase Assay Using DNPH

Protein samples (typically 5–10 μL of column fractions or LDH-A preparations) were combined with PEP and ADP (2 mM each) in 50 mM Tris pH 7.4 containing 10 mM KCl and 2.5 mM MgSO4 at 20 °C (50 μL reaction). At varying times (5–30 min), 10 μL aliquots were removed and combined with 60 μL 1 mM DNPH in 2 M HCl in a 96-well plate. After 5 min, reactions were quenched with 130 μL 2.4 M NaOH. The DNP-hydrazone derivative of pyruvate was detected at 450 nm. A standard curve of 25 to 150 μM pyruvate reacted with DNPH under the same conditions was linear at 450 nm.

2.4. Photo-Oxidation of LDH-A

LDH-A (10 μM) was combined with 2.5 μM MB in 10 mM PB 7.4 under ambient oxygen conditions (20 μL rxn). A 36 watt red light composed of eighteen 2 watt LEDs was used for all experiments. The wavelength of emitted light was 660 nm. The intensity of the red light was quantitated in lux, and the light intensity as a function of the distance from the light source to the samples was measured. All buffers were equilibrated to 20–22 °C to ensure no differences in dissolved O2.

2.5. Enhanced NADH Oxidation by LDH-A; Initiation by 1O2

Reactions (100 μL) contained 2.5 μM MB and 200 μM NADH in 50 mM PB pH 7.1 in a 96-well plate [26]. 1O2 formation was initiated with 10 s of red light. Additions included control and oxidant-treated LDH-A (10 μM) and SOD (10 U/100 μL). Absorbance at 340 nm was measured prior to and immediately after light exposure. Absorbance was measured every 5 min for 40 min then at 10 min intervals until 60 min total.

2.6. LDH-A Activity Assay

LDH-A (10 μM) in 10 mM PB pH 7.4 was treated with 10, 25, 50 and 100 μM HOCl for 30 min at 20 °C. Residual HOCl was quenched with 0.2 mM methionine or S-methyl-cysteine prior to dilution. HOCl dilutions were prepared in water immediately prior to use. After HOCl treatment, samples were diluted 1:10 in 20 mM Tris pH 8.6. Assays (200 μL) contained 20 mM Tris pH 8.6, 25 nM LDH-A, 0.5 mM NADH and either 0.75 mM or 0.5 mM sodium pyruvate. NADH oxidation was monitored at 340 nm in a 96-well plate for 4 min at 30 °C. Rates were determined from the slope of the curve. Slopes were converted to M/min using 3500 as the conversion factor (for the plate assay). NADH (ε = 6220 M−1 cm−1) samples were scanned in a microcuvette and in the 96-well plate to determine the conversion factor (ε × path length)

2.7. Labeling of LDH-A Cysteines with M5F and IAF

LDH-A was diluted to 10 µM (50 µM cys max) in 10 mM PB pH 7.4 prior to oxidation with HOCl for 2–30 min at 20 °C (reaction volume = 20 µL). Either methionine or S-methyl-cys (0.2 mM) was added to scavenge HOCl. M5F or IAF (10 mM stock in DMF) was added to achieve a 10-fold molar excess relative to LDH-A cys (500 μM), and samples were incubated at 37 °C for an additional 30 min. Proteins were resolved by SDS-PAGE on 9 or 10% gels under reducing conditions, and gel images were captured using a Bio-Rad Chemi-doc XRS imaging system. The intensity of the fluorescein-labeled protein bands was measured using Bio-Rad Image Lab software, version 4.0.
M5F- and IAF-labeled LDH samples were precipitated with 80% ethanol and incubated on ice for 20 min, and the protein pellet was collected at 16,000 × g for 10 min. Pellets were washed twice with 80% ethanol and then resuspended in 3 M guanidine HCl in 0.1 M Tris pH 8.8. Fluorescein in each protein sample was quantitated at 490 nm relative to a fluorescein standard curve also prepared in 3 M guanidine HCl in 0.1 M Tris pH 8.8.

2.8. Detection of LDH-A Oxidation Products by Western Blotting

Following treatment with HOCl as described above, LDH-A (5 µg protein per lane) was separated by SDS-PAGE on 9% polyacrylamide gels under reducing and nonreducing conditions. Proteins were transferred to PVDF membranes, blocked with 5% milk in PBS-T for 30 min and probed with a mouse monoclonal anti-LDH-A antibody (1:2000) for two hours. The LDH-A/antibody complex was detected using a goat anti-mouse HRP conjugate (1 hr, 1:10,000) and chemiluminescent substrate. Chemiluminescence was captured using the Bio-Rad Chemi-doc XRS imaging system.

2.9. Native Gel Electrophoresis of LDH-A with Activity Staining

LDH-A samples were treated with HOCl and reducing agents as described above. Native gel electrophoresis was performed using 0.8% agarose gels; 20 mM Tris, 20 mM glycine and 2 mM EDTA pH 9.5 was used to prepare the gels and as the running buffer. Sample loading buffer (6×) contained 25% glycerol and 5% Coomassie blue in Tris/glycine/EDTA buffer. Gels were run for 45–60 min at 90 V. The LDH-A activity stain (20 mL) contained 0.75 mM NAD+, 25 mM lithium lactate, 8–10 mg NBT and 1–2 mg PMS in 100 mM Tris pH 8.6. Gels were incubated with activity stain solution for 10–20 min in the dark to allow LDH activity bands to develop.

2.10. Tryptophan Emission of HOCl-Treated LDH-A

Samples were excited with a 290 nm LED lamp, and emission was captured with an Ocean Optics Flame detector. The scan speed was 1500 ms, and 10 scans were averaged to yield emission spectra. LDH-A samples were treated with were treated with 1–10 equivalents of HOCl. LDH-A oxidation reactions (10 μM, 60 or 80 μL) were quenched and diluted to 600 μL with 10 mM PB pH 7.4. Spectra were saved as soon as consistent emission was detected (1–2 min). For the time dependence, LDH-A (10 μM, 80 μL) was treated with 100 μM HOCl and immediately transferred to a microcuvette, and spectra were saved at the indicated times. A control sample without HOCl was also scanned over the 30 min time interval to assess any changes due to photobleaching or air oxidation.

2.11. Detection of Dityrosine by Fluorescence Emission

LDH-A (10 μM) was treated with HOCl (50 to 250 μM) as described above except the volume was 60 μL. Unreacted HOCl was quenched with 0.5 mM S-methyl-cysteine. NaOH (0.1 M, 40 μL) was added to deprotonate tyrosines. The entire volume was transferred to a black 96-well plate and photographed on a UV transilluminator. Emission was quantitated using Bio-Rad Image Lab software. Emission of the LDH-A control was subtracted from that of the HOCl-treated samples and the values normalized.
For fluorescence emission, LDH-A (10 μM) was treated with 150 μM HOCl (15 equiv) in 10 mM PB pH 7.4 (600 μL reaction volume). S-methyl-cysteine (10 μL of 40 mM) and NaOH (30 μL, 1 M NaOH) were added. The entire volume was transferred to a fluorescence cuvette. The samples were excited with a 325 nm LED lamp, and emission was captured with an Ocean Optics Flame detector. The scan speed was 1000 ms, and 10 scans were averaged to yield emission spectra. A blank sample (-LDH-A) and a control sample (-HOCl) were also scanned.
LDH-A (50 μM, 100 μL) was treated with 1 mM HOCl (20 equiv) in 10 mM PB pH 7.4. Following the addition of S-methyl-cysteine and NaOH, the samples were excited with a 325 nm LED lamp, and emission was captured with an Ocean Optics Flame detector. The scan speed was 1000 ms, and 25 scans were averaged to yield emission spectra.
HOCl was produced using MPO, H2O2 and Cl− as described [31]. Briefly, reactions contained H2O2 (100–200 μM), NaCl (50 mM) and 50 nM MPO from human leukocytes in 10 mM PB pH 7.4 at 20 °C. Catalase was added to stop reactions after 20–30 min. Oxidation of methionine to methionine sulfoxide by enzymatically generated HOCl was detected as described [29].

3. Results

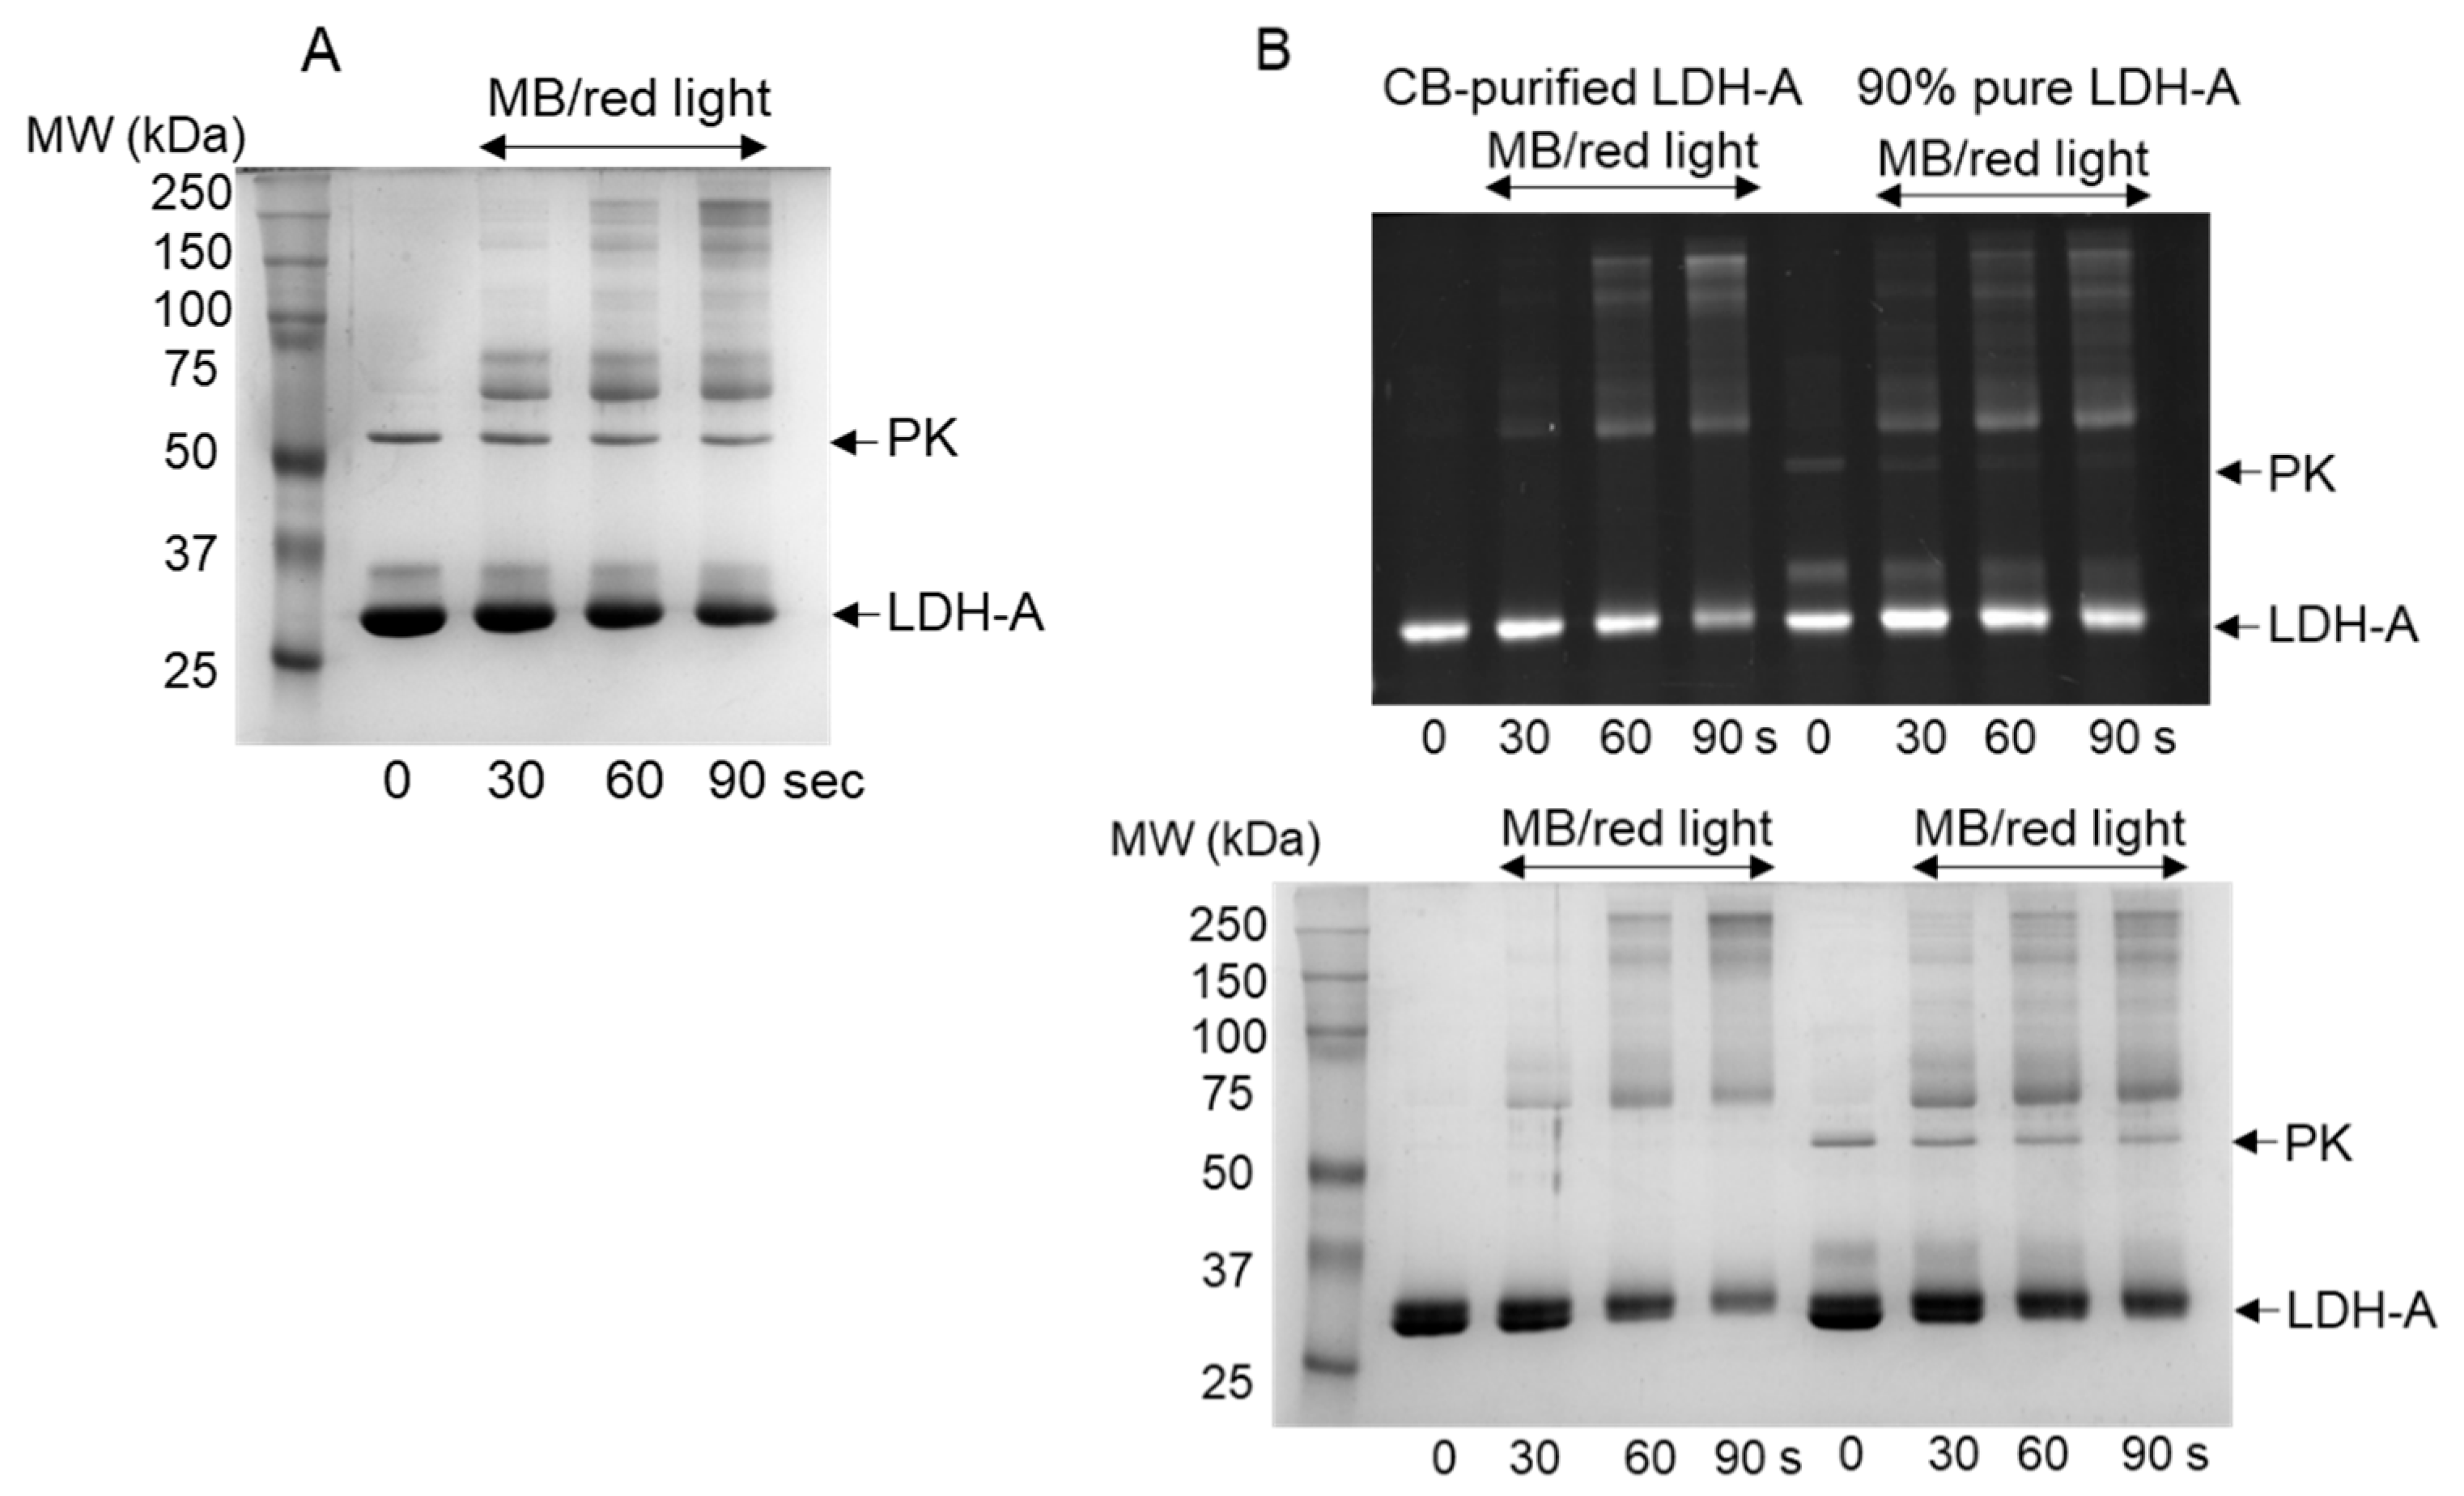
3.1. Oxidation of LDH-A by 1O2

Recently, we reported that singlet oxygen (1O2) inhibited mammalian LDH-A activity and induced the formation of higher MW crosslinks observed by SDS-PAGE under reducing conditions [23]. The combination of a photosensitizer, methylene blue (MB) and red light under ambient oxygen was used to generate 1O2. Multiple higher MW crosslinks formed as the light exposure time increased. For the conditions employed in Figure 1A, a 90 s dose of red light resulted in complete inhibition of LDH-A activity.
In our initial published studies and in Figure 1A, commercially available rabbit muscle LDH-A (~90% pure by densitometry) was used without further purification. Figure 1A shows two contaminants in addition to LDH-A: one at 55–60 kDa that we have identified as the glycolytic enzyme pyruvate kinase (PK), and another directly above LDH-A that remains unidentified. The intensities of all three protein bands decreased with increasing light exposure indicative of contaminant crosslinks. While this afforded the opportunity to observe PK damage/oxidation by 1O2, further purification of LDH-A was warranted. Cibacron Blue chromatography was effective at removing both contaminants so that LDH-A was then >99% pure by densitometry of stained gels (Supplemental Figure S1).
Our interest in protein thiol oxidation prompted us to examine any changes to LDH-A cysteine availability induced by 1O2. Because the crosslinks in Figure 1A were detected under reducing conditions, they are not disulfides. Based on the comparison of rate constants for individual amino acids, cysteine is not the preferred target for 1O2; however, the most reactive and surface-exposed residues of a protein are typically damaged by ROS [15,18]. Further, the accessibility of individual side chains is expected to change as damage by ROS accumulates.
The status of the LDH-A cysteines, five per monomer, following red light exposure was assessed by reaction with fluorescein-derivatized thiol-specific reagents and subsequent analysis by SDS-PAGE under reducing conditions. Only reduced cysteines can be labeled with M5F, a maleimide, or IAF, an iodoacetamide; therefore, oxidation of cysteines to disulfides or higher oxidation states of sulfur would result in decreased incorporation of fluorescein. Holbrook et al. reported that the cysteines of muscle LDH-A react more readily with maleimides than with iodoacetamides; therefore, we employed fluorescein maleimide (M5F) primarily [22].
In Figure 1B, both 90% pure and CB-purified LDH-A were treated with MB and increasing doses of red light and subsequently with M5F. Comparison of Figure 1A (Coomassie stain only) and Figure 1B confirmed that fluorescein labeling did not alter LDH-A monomer mobility. Cysteine labeling of the 36 kDa monomer with M5F was observed as was labeling of multiple higher MW crosslinks. As the dose of 1O2 increased, both LDH-A and PK were oxidized and their monomer bands decreased (both fluorescence and Coomassie stain in Figure 1B). Densitometry of the fluorescence, indicative of total reduced cysteines, showed that the 30 s dose of red light increased labeling relative to the control and that total cysteine labeling of all bands for the 60 s dose of red light was equal to that of the control. Only the 90 s dose of red light yielded a net decrease in total cysteine labeling.
Previously, Pamp et al. reported that reactivity of LDH-A with DTNB, a cysteine specific reagent, increased following Cu(II)-mediated protein oxidation [32]. This is consistent with our observations in Figure 1B that 1O2 damage increased cysteine exposure and reactivity with M5F. We were interested in ROS that react primarily with cysteines to determine if they induced a similar conformational change. HOCl is a potent oxidant that reacts with cysteine, methionine and tyrosine [28,33].

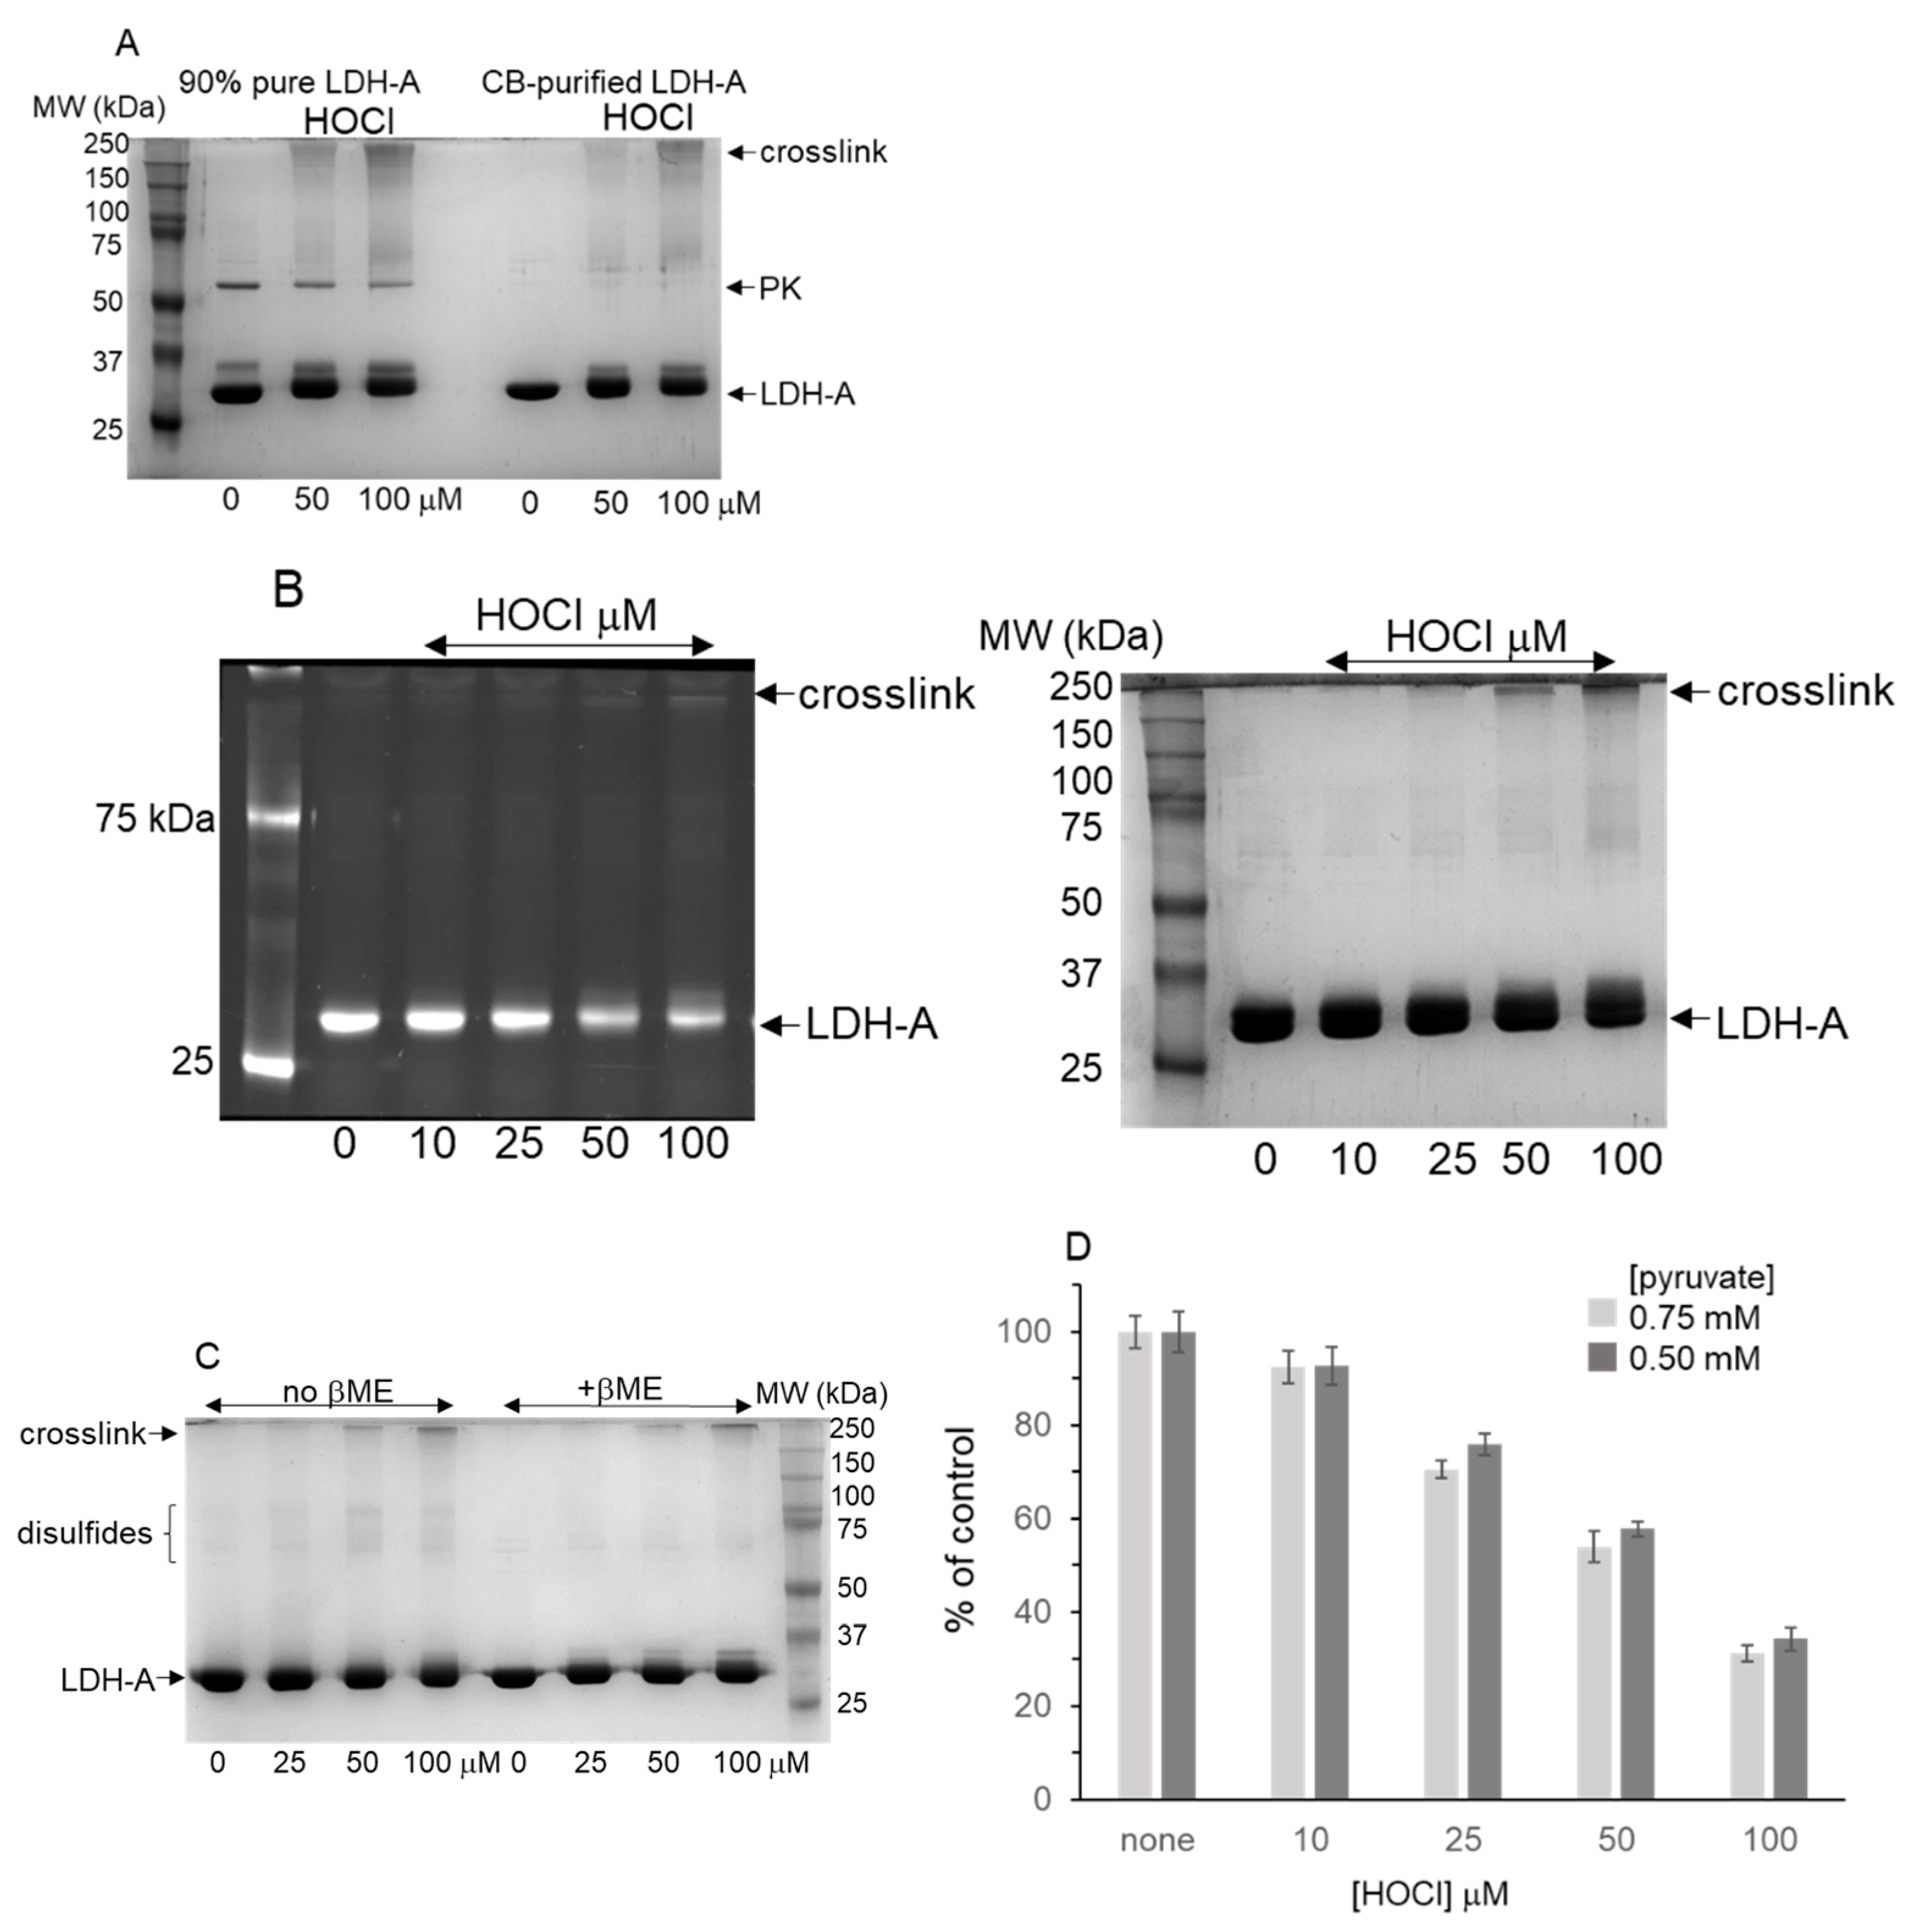
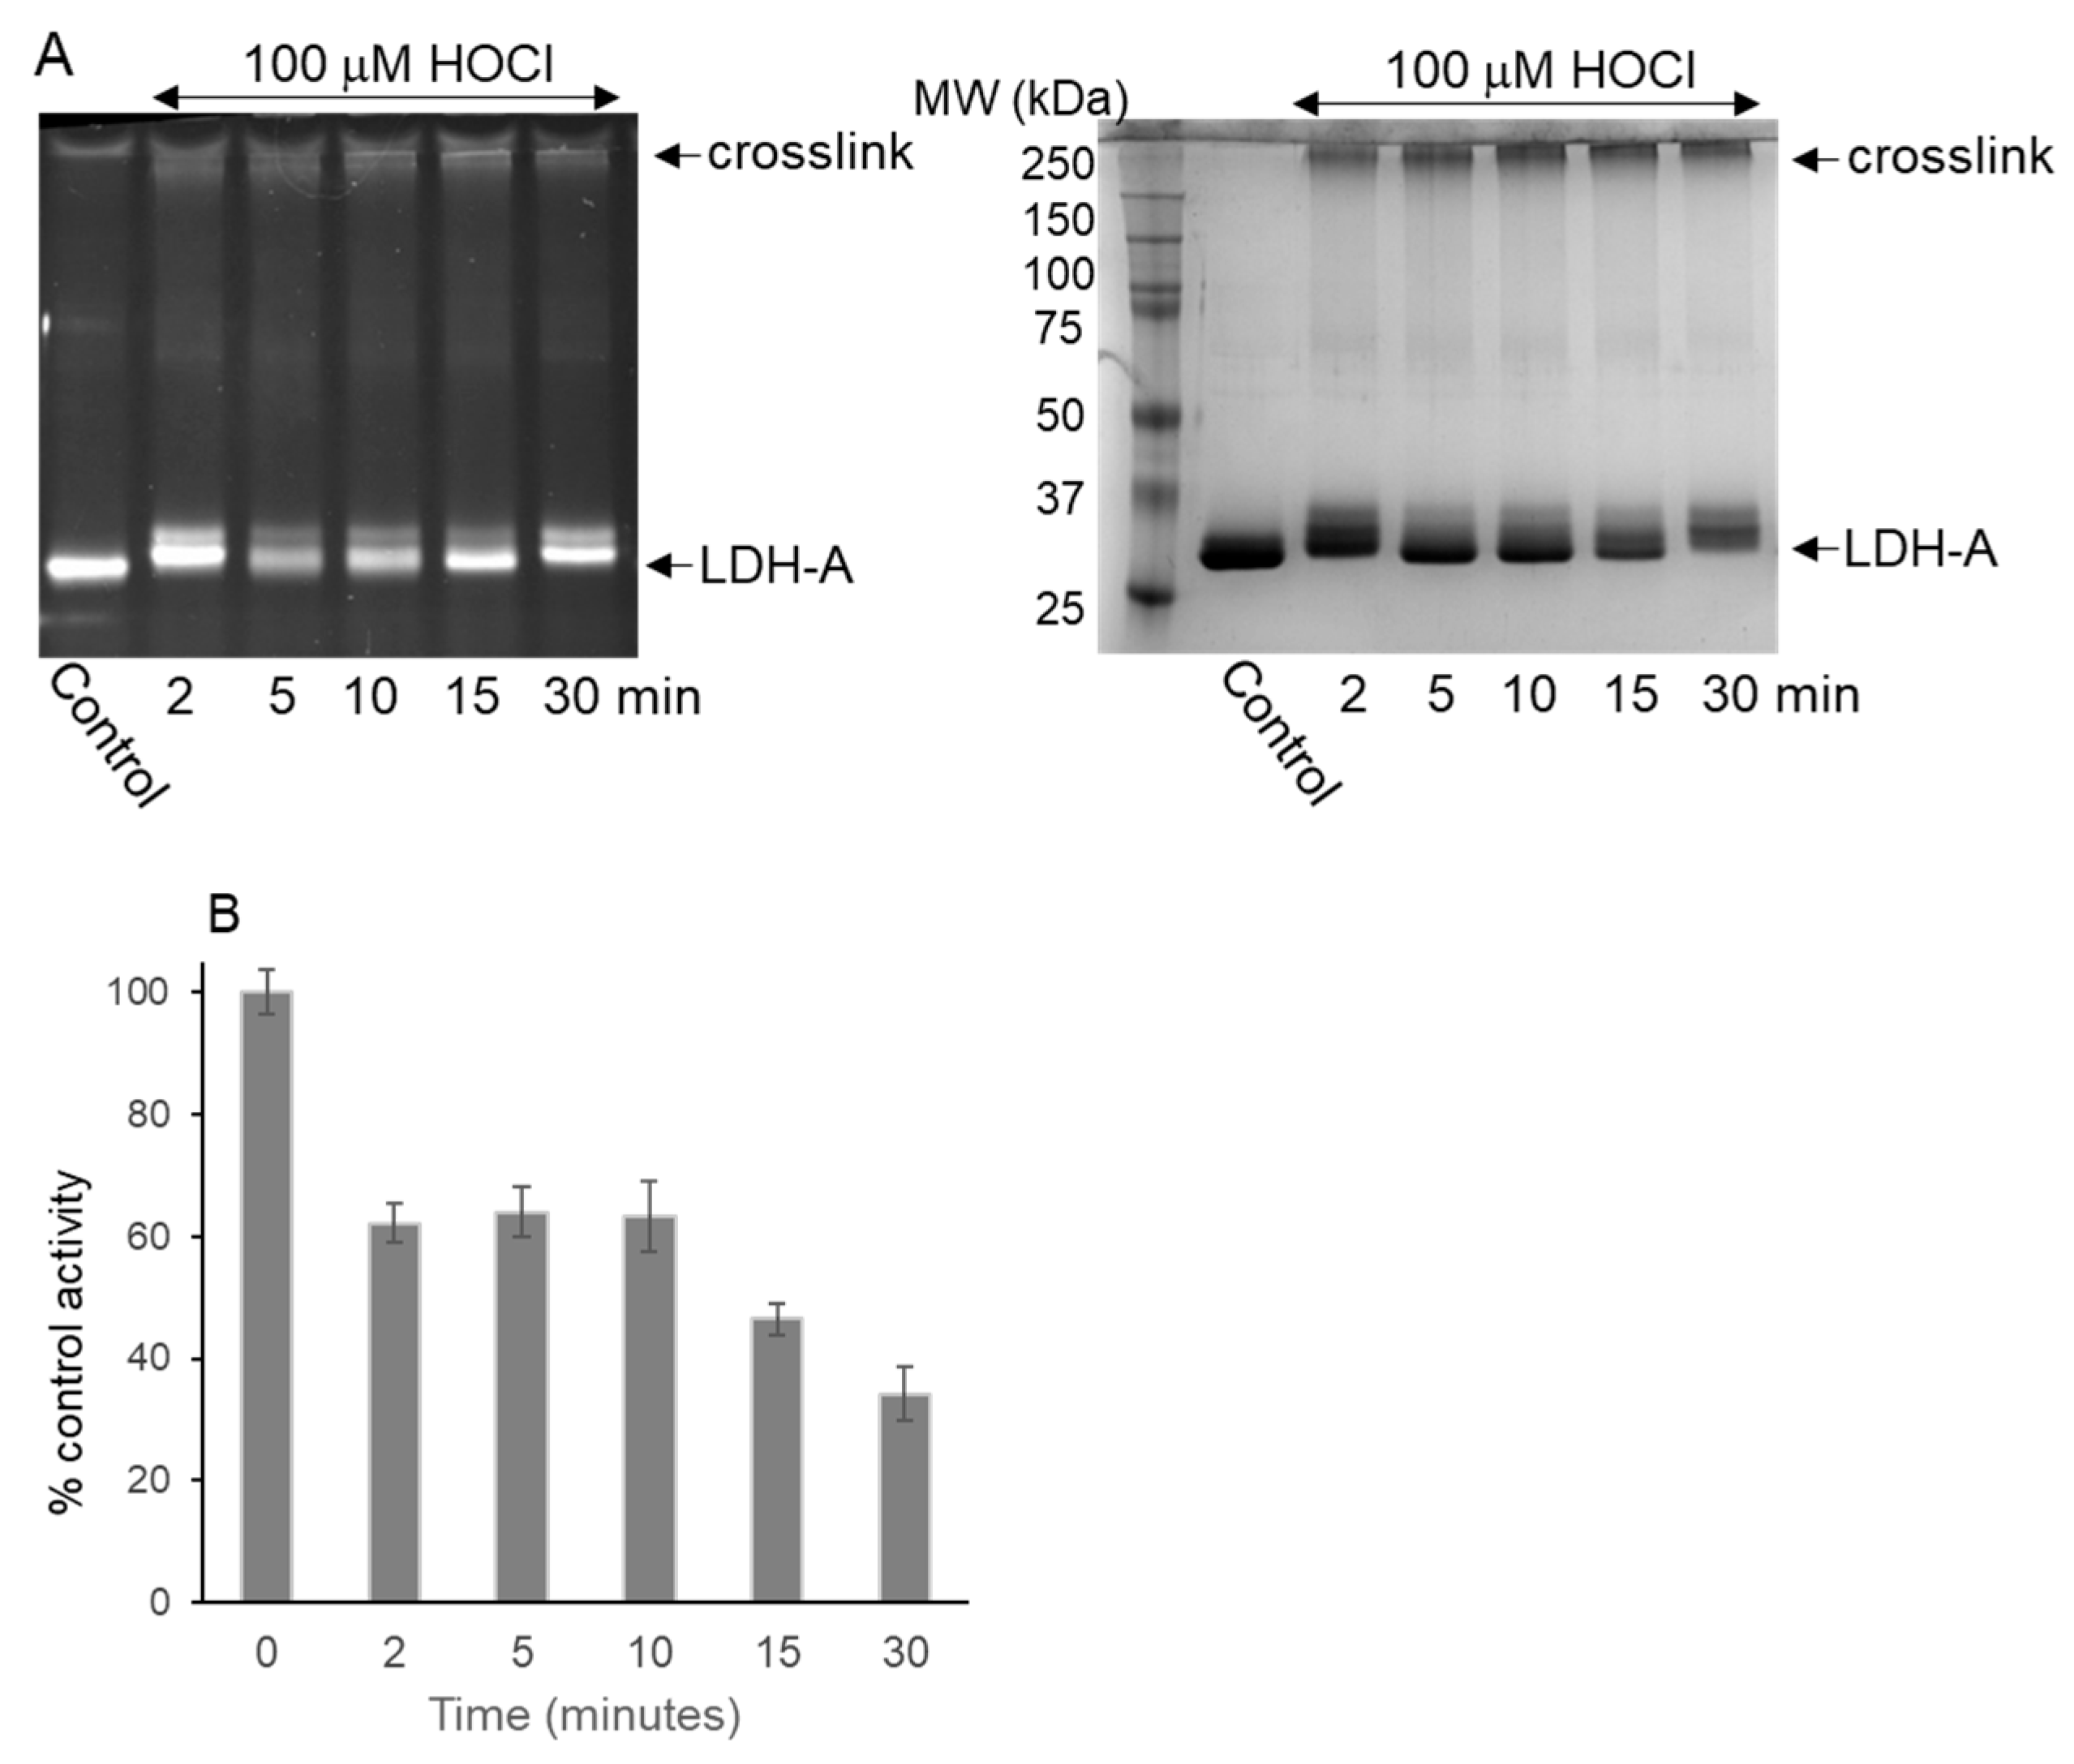
3.2. LDH-A Oxidation by HOCl

Both 90% pure and CB-purified LDH-A samples in phosphate buffer (PB) pH 7.4 were treated with HOCl and analyzed by SDS-PAGE and Coomassie stain. PB, unlike amine-based buffers, does not react with HOCl. The pKa of HOCl is 7.5; therefore, a mixture of HOCl and OCl- is present at pH 7.4 [28,34]. For consistency and simplicity, we use HOCl herein to represent both species.
We observed HOCl-induced higher MW crosslinks in Figure 2A that were markedly different from those in Figure 1. The PK contaminant was also oxidized by HOCl, and its intensity decreased indicative of crosslinking. HOCl induced a change in mobility of the 36 kDa LDH-A band. It shifted up and also produced a distinct, but less intense, second band directly above it. This new band co-migrates with the second, unidentified contaminant in the 90% pure LDH-A preparation. Therefore, it was essential that all HOCl-oxidation studies be performed with CB-purified LDH-A.
As for 1O2, the status of LDH-A cysteines after HOCl oxidation was assessed. Reactions were quenched with either methionine or its thioether analog, S-methyl-cys, to ensure that no HOCl remained while labeling reagent was present. Using both M5F and IAF, there was a dose-dependent decrease in fluorescein incorporation as the concentration of HOCl increased (Figure 2B and Supplemental Figure S2). When a dansyl derivative, IAEDANS, was employed, a dose-dependent decrease in labeling was also observed (Supplemental Figure S3). Regardless of the fluorescent tag, even 10 μM HOCl (1 equiv) showed decreased LDH-A labeling by densitometry.
For LDH-A samples treated with 50 or 100 μM HOCl, a weak fluorescent band was detected at the top of the separating gel that was also observed after Coomassie staining (Figure 2B). Samples were treated with loading dye containing βME prior to SDS-PAGE because βME reacts with excess M5F to halt labeling. Disulfides that were formed by HOCl would have been reduced, but not labeled, because M5F was no longer available to react. Therefore, any high-molecular-weight crosslink that is tagged with M5F or IAF must contain reduced cysteines that were not oxidized by HOCl.
The fluorescence image in Figure 2B also shows some labeling of a band directly above the main 36 kDa band for samples treated with 50 or 100 μM HOCl. The shift in mobility of HOCl-treated LDH-A is not due to the mass of fluoresceins attached to LDH-A cysteines because the Coomassie-stained gel (Figure 2A—no M5F) shows the same shift as in Figure 2B. Examination of the Coomassie staining also shows some broadening of the LDH-A band as the HOCl concentration increased.
To examine the effect of a reducing agent on LDH-A mobility, control and HOCl-treated LDH-A were analyzed by SDS-PAGE with and without βME (no label). LDH-A was split into multiple bands by all three HOCl concentrations on the plus βME side (Figure 2C). In the absence of βME, the intensity of the LDH-A monomer decreased with increasing HOCl. Band splitting was not observed in the minus βME samples, but several faint bands were observed at sizes that were consistent with disulfide-linked dimers, trimers or tetramers.
A Western blot of control and HOCl-treated LDH-A samples identical to those in Figure 2C was performed. The minus βME lanes revealed more crosslinks (Supplemental Figure S4). As in Figure 2C, bands between the 50 and 75 kDa standards were detected. Likewise, there was an additional broad band near the 100 kDa standard. Of note, the 36 kDa LDH-A band ran below the 37 kDa standard, so a disulfide-linked trimer or tetramer mass of roughly 100 kDa is likely.
The control in the minus βME lane contained some oxidized LDH-A even though it had been treated with a reducing agent and desalted. Air oxidation of cysteines to disulfides during manipulation has also been observed in our tubulin studies [35]. For the plus βME samples, similar high-molecular-weight species were detected as in Figure 2A,B.
The pyruvate-dependent oxidation of NADH by control and HOCl-treated LDH-A was measured at 340 nm. The range of HOCl concentrations used in Figure 2D represents only 1–10 equivalents relative to the LDH-A monomer concentration. Figure 2D shows a dose-dependent decrease in LDH-A activity with only 30–35% of control activity remaining after 100 μM HOCl treatment. Statistical analysis confirmed that all concentrations tested, except 10 μM, were different from the control and from each other. Kinetic studies of control and HOCl-treated LDH-A were performed with 0.5 and 0.75 mM pyruvate. Assays were also performed with 1.5 mM pyruvate to determine if higher pyruvate could override the inhibition induced by HOCl, and no change in the extent of inhibition was observed. In addition, controls were performed in which S-methyl-cysteine was added prior to the HOCl, and no decrease in LDH-A activity was detected.
To determine if pH affected HOCl oxidation of LDH-A, the protein was treated with 100 μM HOCl in 10 mM PB pH 6.0 to 8.0. Following HOCl treatment, quenching, dilution and assays, no difference in HOCl inhibition of LDH-A was observed.
To quantify cysteine oxidation by HOCl, M5F-labeled LDH-A samples were precipitated with ethanol, and fluorescein absorbance at 490–500 nm was measured. Using a molar absorptivity of 77,000 M−1 cm−1 for the dibasic form of fluorescein, we determined that 54% of the theoretical cysteines were labeled by M5F in 30 min at 37 °C [36]. Longer incubation periods, up to 4 h, did not increase labeling with M5F. By contrast, for IAF, only 14–18% of theoretical cysteines were labeled in 30 min at 37 °C. IAF labeling increased up to 4 h, though no longer times were assayed.
Table 1 summarizes the effect of HOCl on the cysteines of LDH-A from both precipitated samples labeled with M5F and integration of gel bands using both M5F and IAF. Given the disparity in overall % labeling by M5F and IAF, it is not surprising that the HOCl dose responses for the two fluorescein tags varied, though both showed a dose-dependent decrease in cysteine labeling. The addition of 100 μM HOCl to 10 μM LDH-A resulted in oxidation of ~50% of available cysteines based on the integration of gel bands.
Of the five cysteines per LDH-A monomer, two were located near the NADH binding domain with one of the two, cys162, identified as an essential cysteine [37]. When LDH-A was preincubated with NADH prior to the addition of M5F or IAF, labeling by both reagents decreased to 60% of the control (Supplementary Materials, Figure S5). Regardless of the NADH concentration, labeling did not decrease further. This shows that the cysteines protected from M5F or IAF by NADH are accessible and that oxidation of these cysteines by HOCl results in decreased labeling. Further, modification with M5F or N-ethyl maleimide inhibited LDH-A activity.
The data in Figure 2 support an LDH-A conformational change induced by HOCl that yields a subtle change in electrophoretic mobility and a high-molecular-weight crosslink. Multiple gel analyses of LDH-A treated with HOCl for different times showed inconsistent LDH-A monomer band splitting. Therefore, LDH-A was treated with 100 μM HOCl for 2–30 min using S-methyl-cysteine to scavenge HOCl at each time.
The M5F image shows time-dependent changes in cysteine labeling (Figure 3A). The upward band shift is apparent after only 2 min. Labeling decreased after 5 min with HOCl but increased at 10 and 15 min before decreasing again at 30 min. These data suggest that an LDH-A conformational change exposed buried cysteines that were labeled with M5F at 10, 15 and 30 min. Band splitting is apparent in all HOCl-treated lanes. When IAF was used as the cysteine label, changes at 10 and 15 min were not apparent. This suggests that the cysteine(s) exposed reacts more readily with a maleimide than with an iodoacetamide. The Coomassie-stained image also showed that splitting of the LDH-A monomer is time-dependent (Figure 3A).
The fluorescein-labeled high MW crosslink is already apparent at 2 min; labeling increased up to 15 min but then decreased at 30 min (Figure 3A). The Coomassie image detects all crosslinks regardless of available cysteines and showed nearly identical amounts at 5–15 min but increased at 30 min.
Figure 3B shows that inhibition of LDH-A activity by 100 μM HOCl was also time dependent. Activity dropped to 60% of the control after 2 min and remained constant through 10 min. At 15 min, the activity decreased to 45% of the control and reached 35% of the control at 30 min, consistent with Figure 2D. Activity was not assayed beyond 30 min.

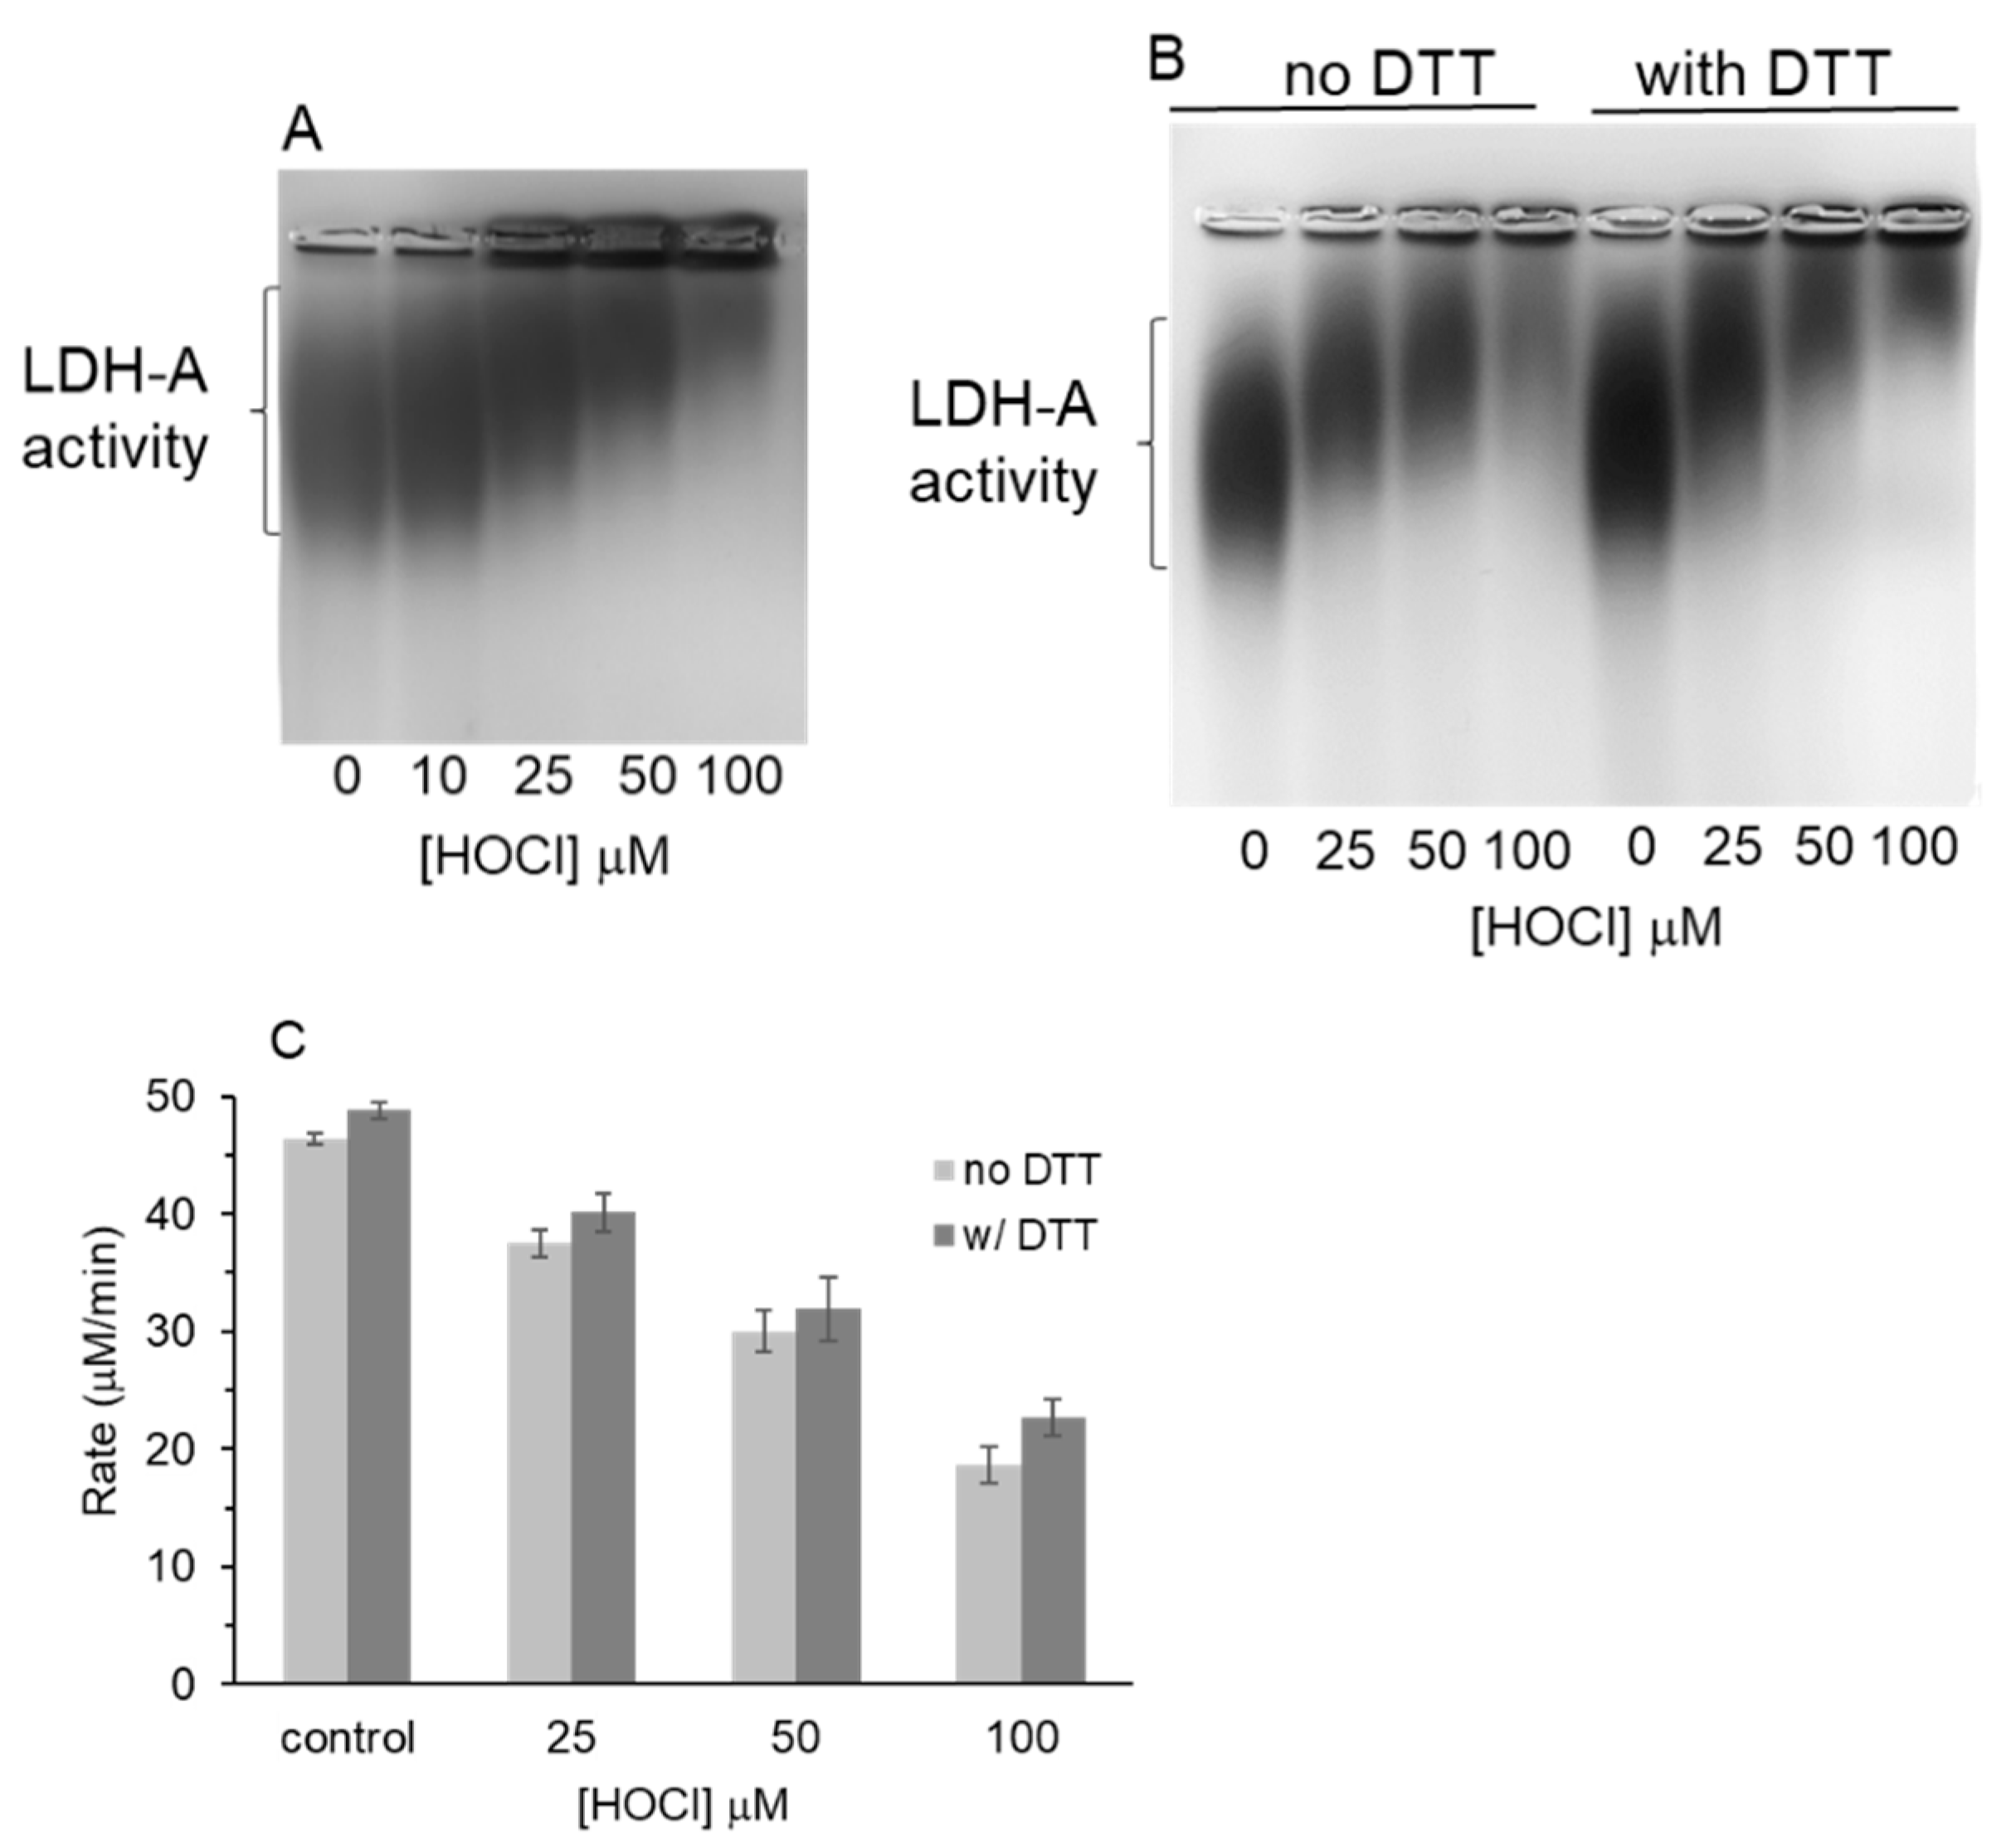
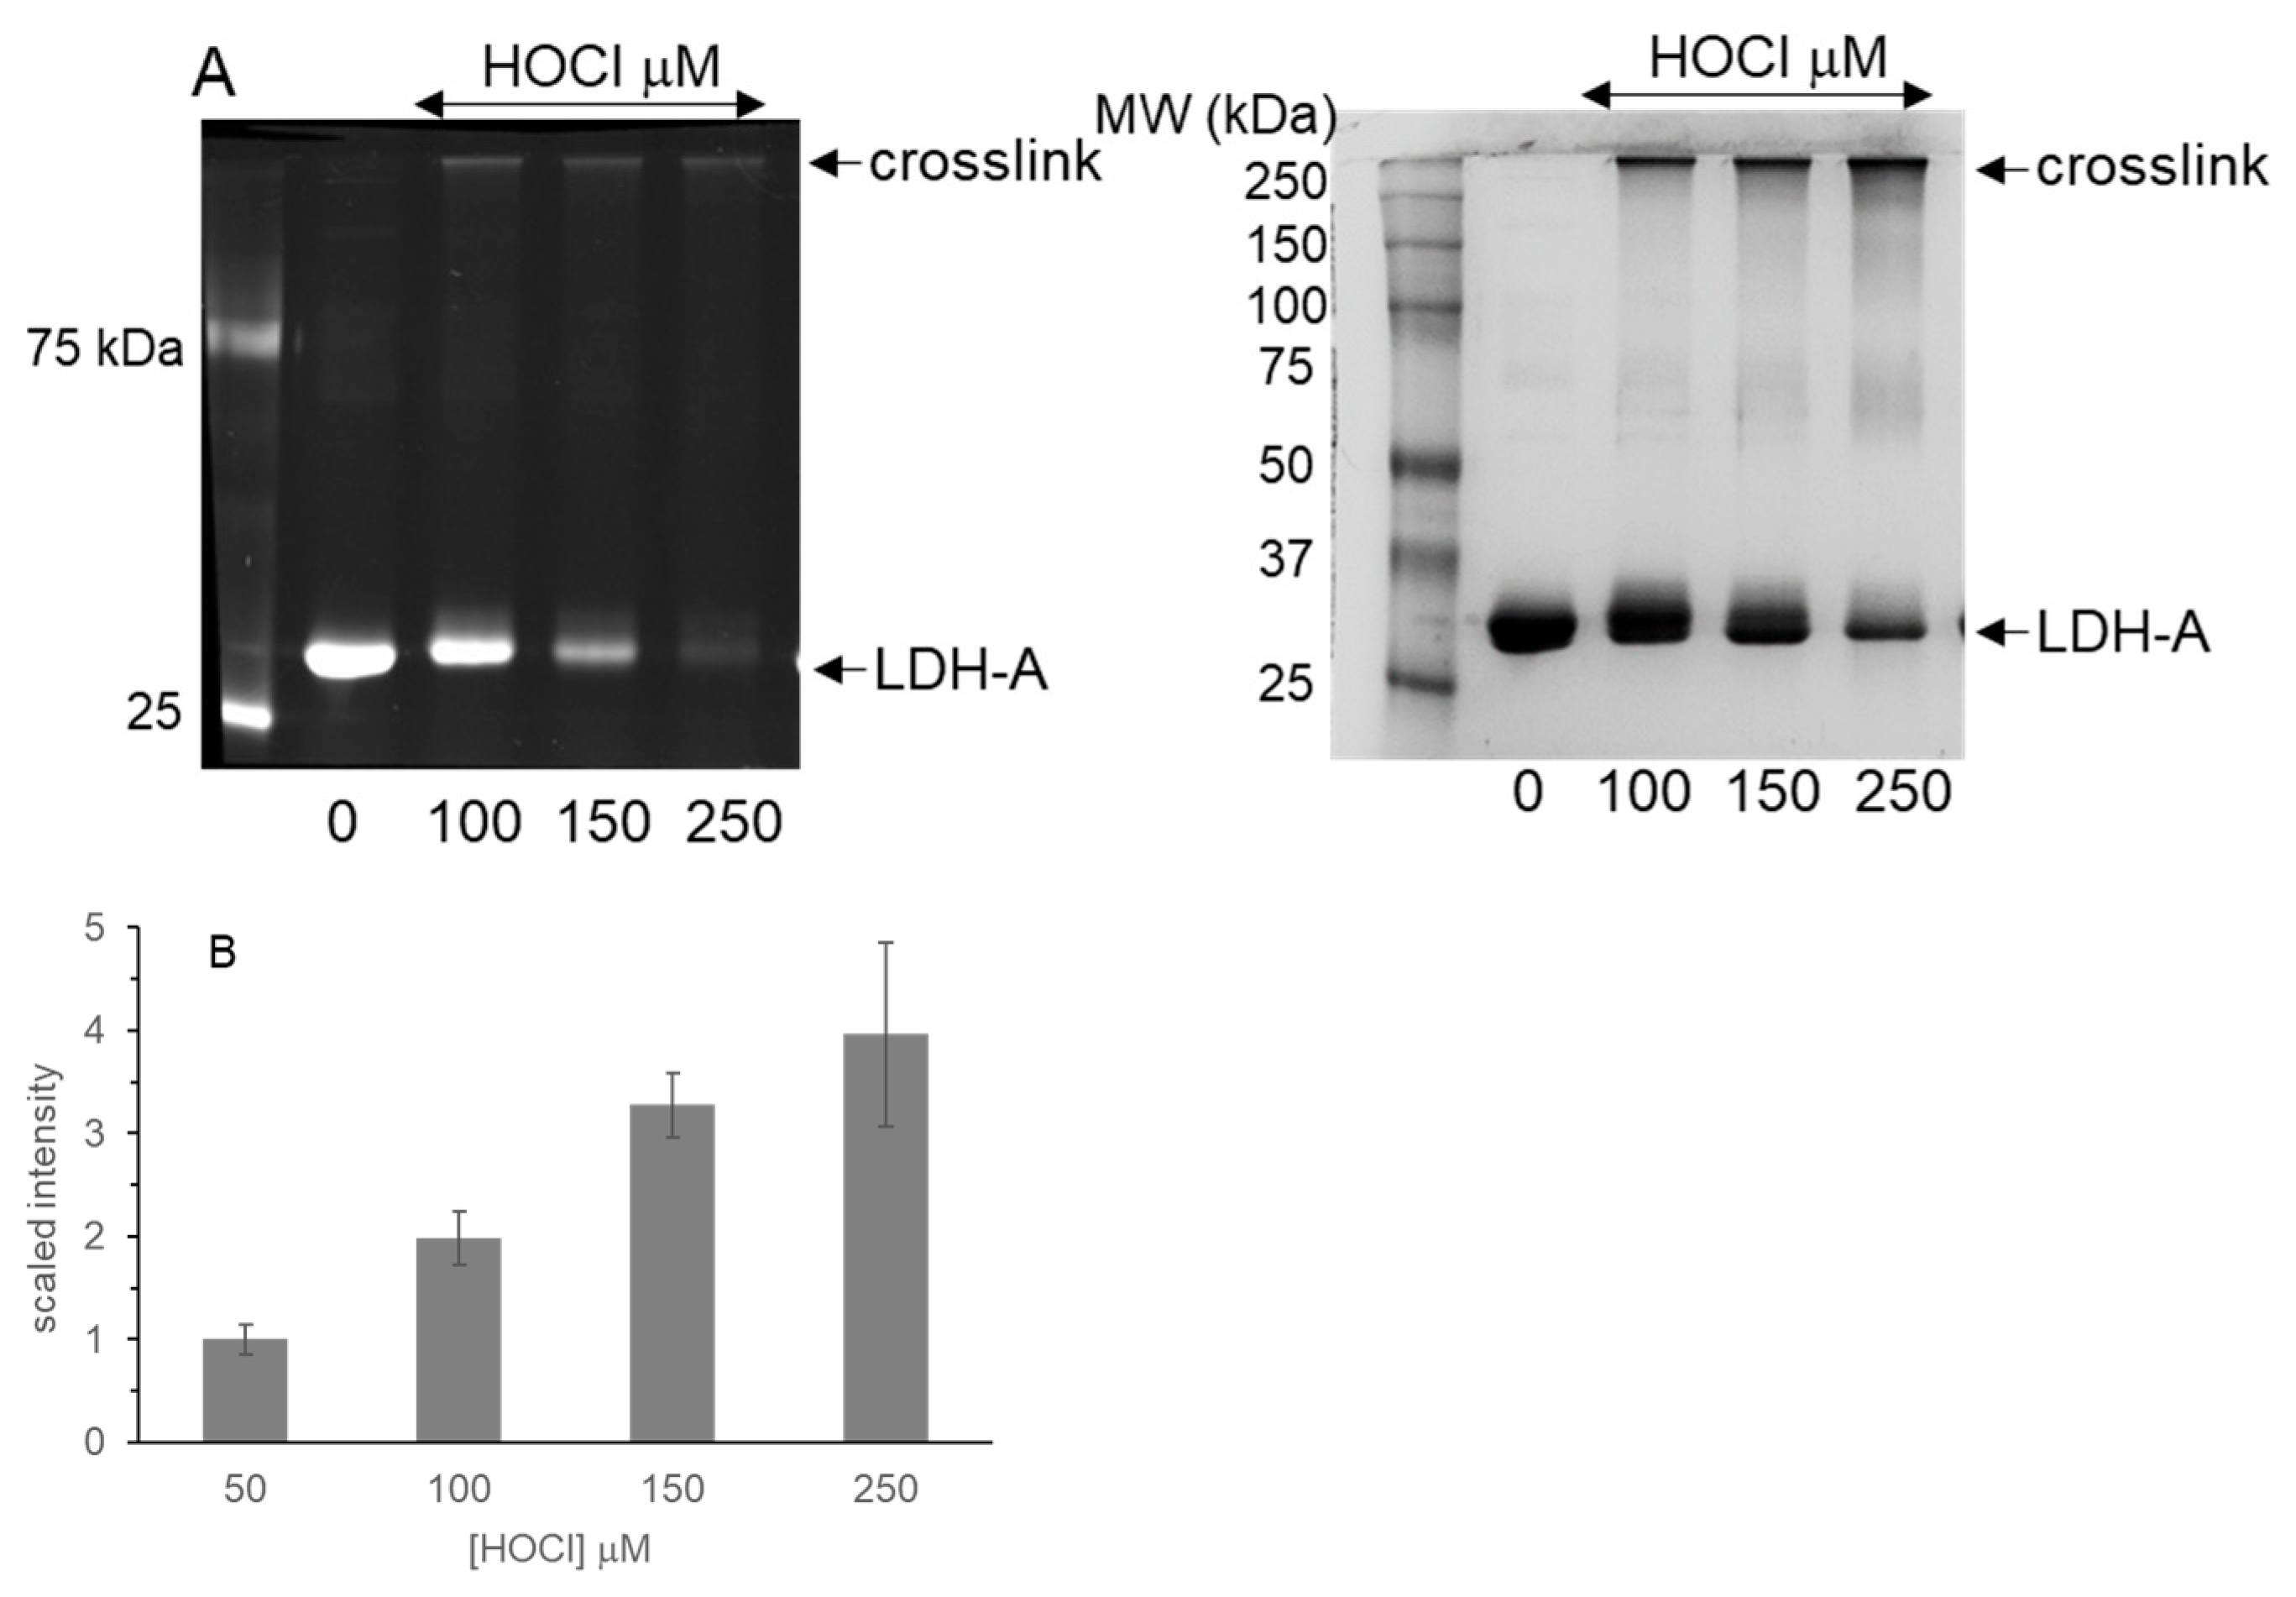
3.3. Native Gel Analysis of HOCl-Treated LDH-A; Activity Staining

The combination of native gel electrophoresis and activity staining assessed changes in LDH-A activity and protein conformation. In a blue native gel, Coomassie blue is added to impart a negative charge to proteins without denaturation but not to stain total protein [38]. Though LDH-A preferentially catalyzes the reduction of pyruvate to lactate, it will catalyze the reverse reaction. To determine if oxidation of lactate to pyruvate by LDH-A is also inhibited by HOCl, a coupled assay was required to drive the reaction in the unfavored direction. As lactate is oxidized to pyruvate, NAD+ is reduced to NADH. NADH reacts with the redox cyclers PMS and NBT to yield the reduced formazan stain.
Figure 4A shows a dose-dependent decrease in LDH-A activity and a change in mobility following treatment with HOCl. The lowest dose of HOCl tested, 10 μM, did not result in a change in activity or mobility. LDH-A activity was detected in the sample wells for HOCl-treated LDH-A (Figure 4A). Given that the high MW crosslink was at the top of the SDS-PAGE separating gel, it was expected that it would have a different mobility and remain near the sample wells of the 0.8% agarose native gel. The crosslink retains activity because it contains reactive cysteines that could be labeled with M5F or IAF (Figure 2B and Figure 3A, Supplemental Figure S2). At 150 μM HOCl, any residual activity was only detected in the sample wells.
Treatment of HOCl-oxidized LDH-A with DTT restored some LDH-A activity because the intensity of the activity stain increased for all HOCl concentrations tested (Figure 4B). The 50 and 100 μM HOCl samples in the plus DTT lanes also showed increased activity in the sample wells. This increased activity cannot be attributed to a reaction of DTT with NAD+/PMS/NBT because the plus DTT control did not stain the wells. Despite a modest increase in activity, the addition of DTT did not reverse the HOCl-induced change in native gel mobility.
Kinetic assays in the pyruvate to lactate direction were performed to quantify any increase in LDH-A activity when DTT or TCEP were added after HOCl. Both control and HOCl-treated LDH-A activity increased modestly when treated with excess DTT for 10 min (Figure 4C). However, this increase was only statistically significant at 100 μM HOCl. When TCEP was used instead of DTT, there was a similar increase of only 7–10% at each HOCl concentration tested.
LDH-A was treated with up to a 500-fold excess H2O2 (10 μM LDH-A and 5 mM H2O2) for 30 min. H2O2 was scavenged with catalase, and LDH-A was assayed as described in Figure 2D. No inhibition of LDH-A activity was observed. Further, H2O2-treated LDH-A was analyzed by blue native gel electrophoresis, and no change in mobility or lactate to pyruvate oxidation was detected. H2O2 treatment, followed by cysteine labeling with IAF or M5F, also showed no change in LDH-A cysteine status. Angeli’s salt, an HNO donor that reacts avidly with some protein cysteines, also had no effect on LDH-A cysteines or LDH-A kinetic activity. Lastly, glycine chloramine, a cysteine oxidant made from HOCl and glycine, had no effect on LDH-A cysteines or activity [29].

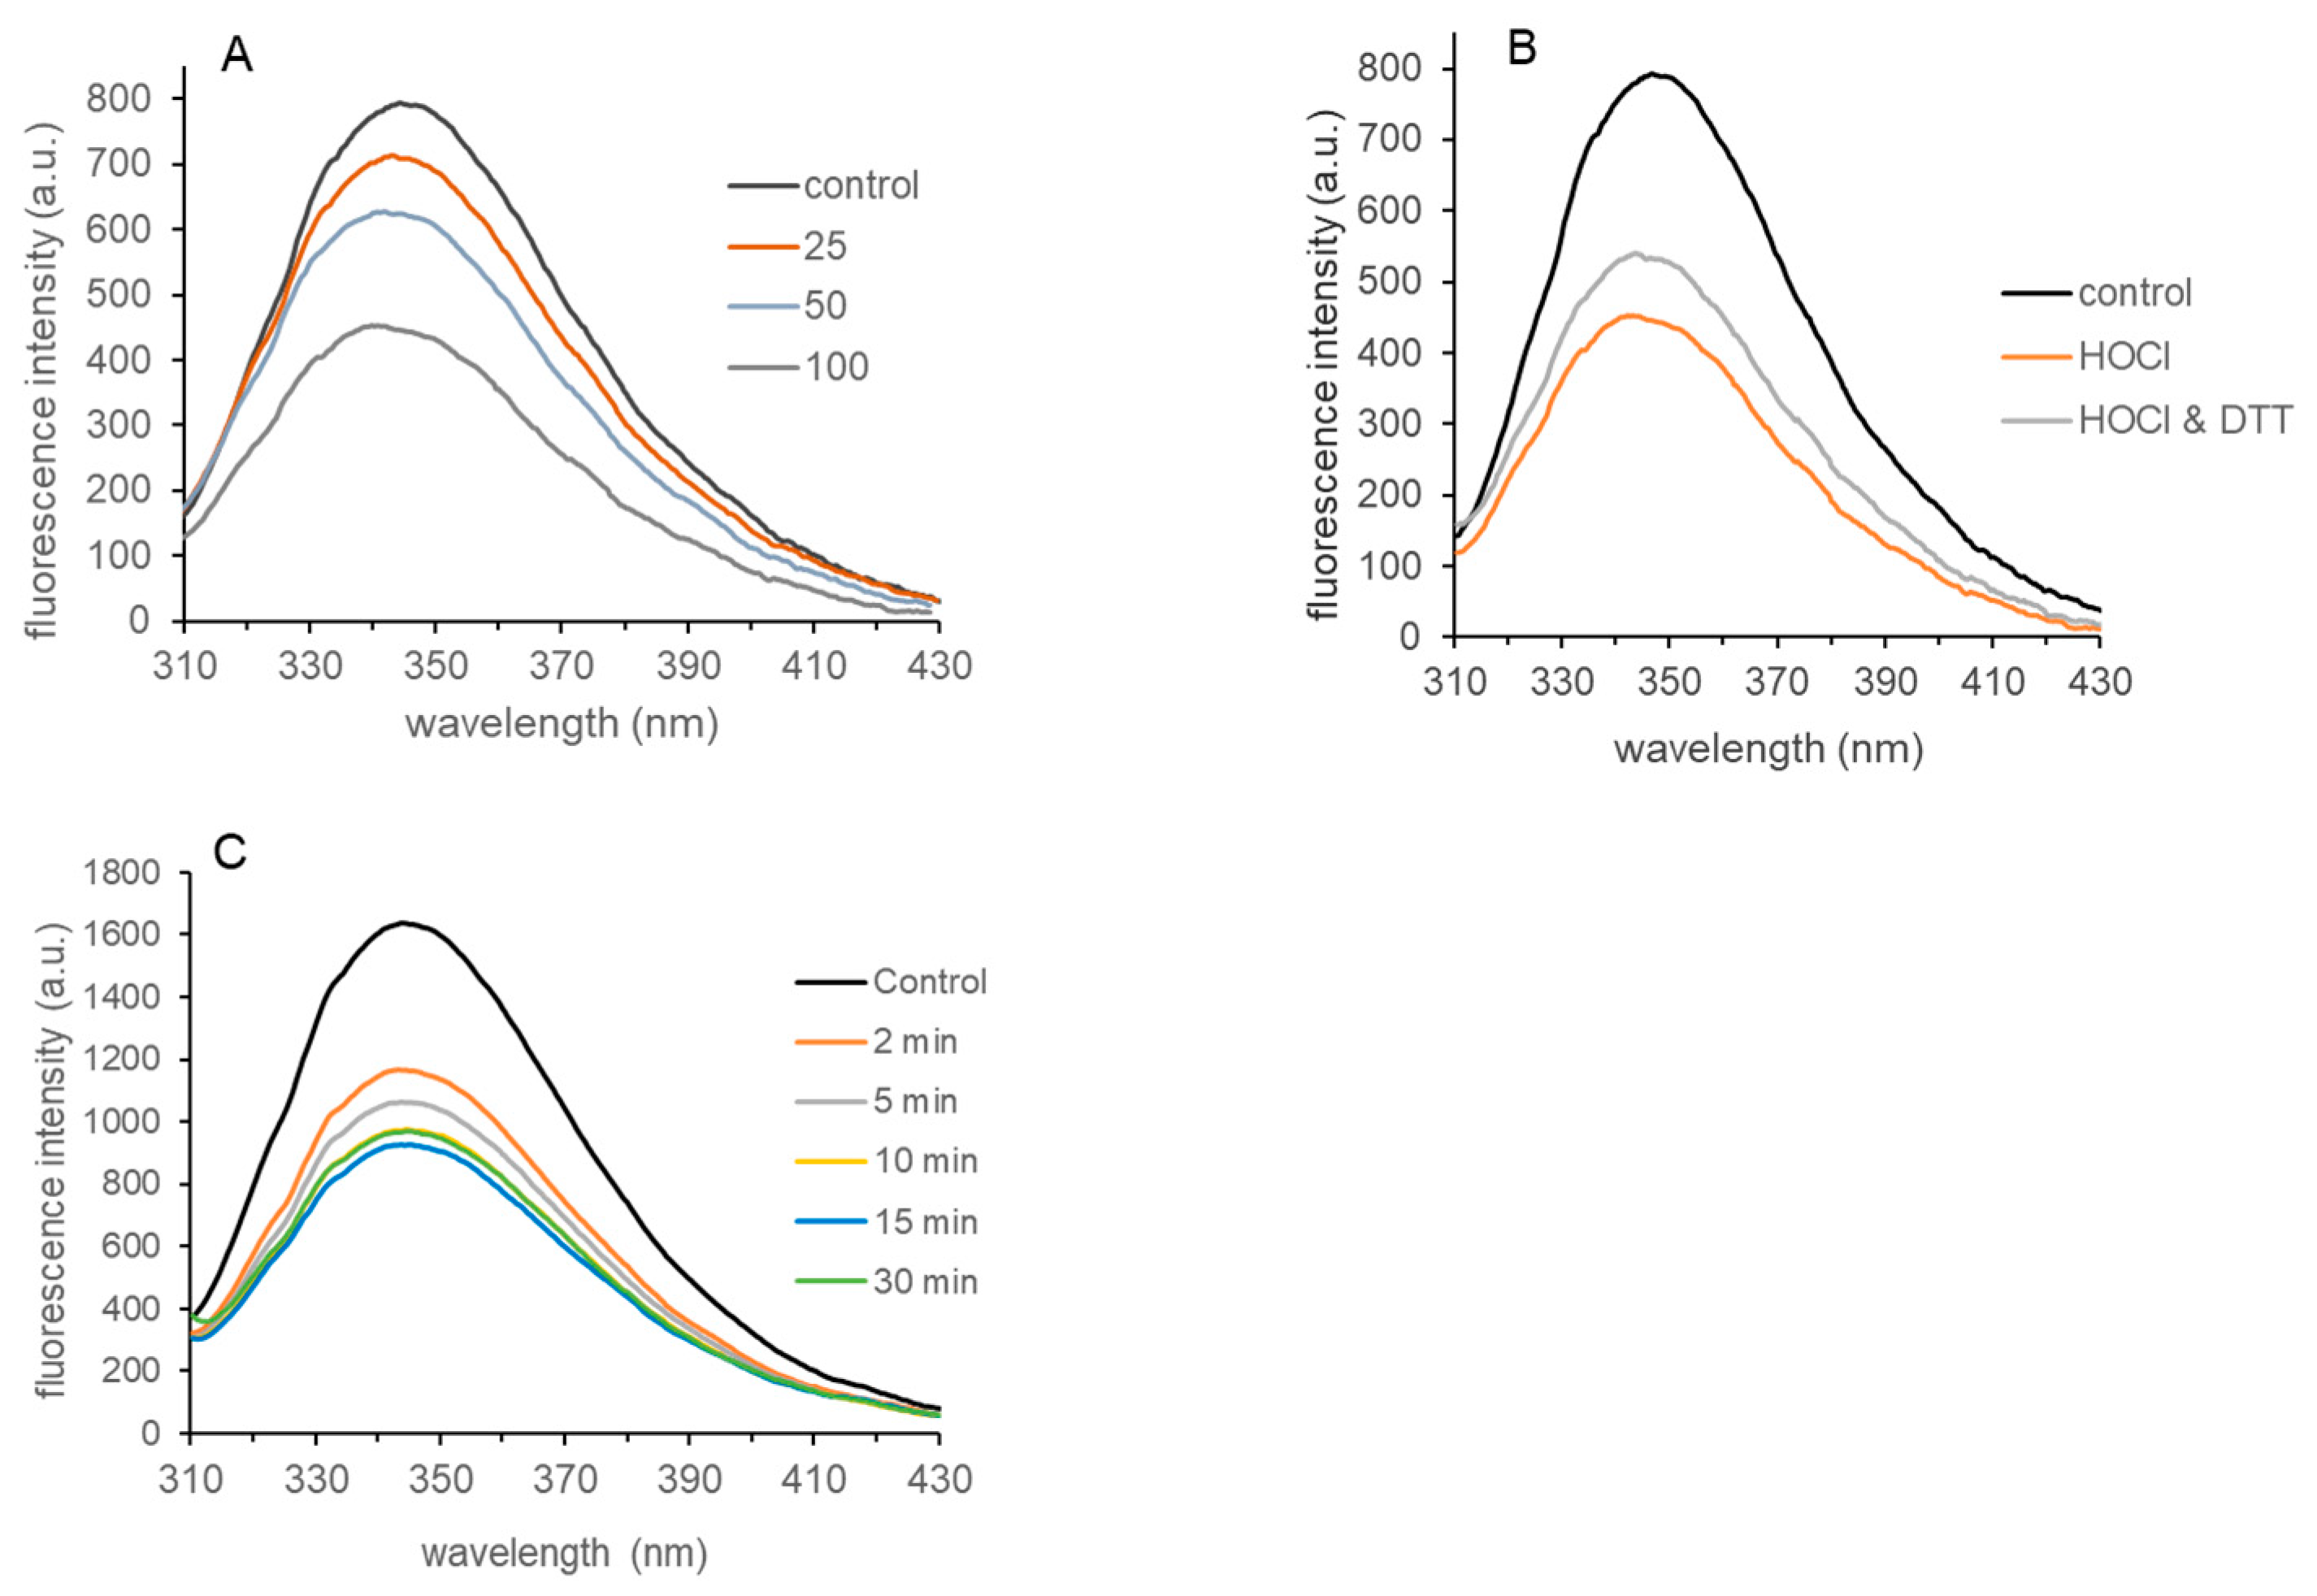
3.4. Tryptophan Fluorescence of HOCl-Treated LDH-A

Tryptophan fluorescence is sensitive to the local microenvironment; therefore, it is useful for studying protein conformational changes. Rabbit muscle LDH-A contains six tryptophan residues that contribute to the overall fluorescence emission observed at 340–350 nm. The addition of increasing concentrations of HOCl resulted in a dose-dependent decrease in LDH-A tryptophan emission, but no shift in the emission maximum wavelength was observed (Figure 5A). Samples were treated with HOCl and scavengers in the same manner as for the kinetic and electrophoresis analyses in Figure 2, Figure 3 and Figure 4. Emission decreased with only 10 μM HOCl (1 equivalent relative to LDH-A concentration) (Supplemental Figure S6).
The addition of DTT to HOCl-treated LDH-A did not restore tryptophan fluorescence to control levels (Figure 5B). The DTT concentration and incubation time were sufficient to reduce all disulfides that had been formed by HOCl and were identical to those employed in Figure 4B,C. The addition of 10 equivalents of HOCl to LDH-A resulted in a 50–55% decrease in emission after 30 min. The addition of DTT restored only 20–25% of the fluorescence that was lost. DTT had no effect on control emission.
As in Figure 3B, we examined the time dependence of the HOCl-induced change in tryptophan emission. Figure 5C shows a sizeable drop (~30%) in tryptophan emission after only 2 min with HOCl. That was followed by a more modest, but continual decrease to 55% of the control emission at 30 min.
While both M5F labeling (Figure 3A) and tryptophan fluorescence (Figure 5C) showed changes in LDH-A conformation, neither time course tracked exactly with the loss of LDH-A activity in Figure 3B. Based on the data presented, we cannot conclusively say why the time courses are different, though both methods were consistent with a protein conformational change.

3.5. Evidence for Dityrosine in HOCl-Treated LDH-A

Because the LDH-A crosslink induced by HOCl at the top of the SDS-PAGE separating gel is not affected by disulfide reducing agents, we suspected it was dityrosine because it is a well-characterized product of HOCl oxidation of tyrosine [28,33,34]. It is fluorescent when the cross-linked phenols are deprotonated to the phenolates. No other amino acid oxidation product of HOCl is fluorescent.
To maximize formation of the crosslink, HOCl concentrations greater than 100 μM were tested. SDS-PAGE analysis showed further loss of cysteine labeling with M5F and increased crosslinks detected at the top of the separating gel (Figure 6A). At 250 μM HOCl, little LDH-A monomer remained at 36 kDa. Only 15–20% of control activity was detected at 150 μM HOCl, and at 250 μM HOCl (25 equivalents), no activity remained.
LDH-A oxidized with HOCl was treated with NaOH, and fluorescence was detected following excitation on a UV transilluminator. Figure 6B shows a dose-dependent increase in emission. In the absence of NaOH, no fluorescence was detected. HOCl concentrations below 50 μM did not yield emission consistently above untreated LDH-A values. The increase in intensity matched the increase in the crosslink detected in Figure 6A. The increased error for 250 μM HOCl was attributed to protein aggregation in the sample well that hindered quantitation. Further, samples treated with NaOH, including control LDH-A, showed some precipitate due to the high pH required to detect dityrosine.
Emission characteristic of dityrosine was detected when HOCl-treated LDH-A was excited at 325 nm following NaOH treatment. Using the ratio of HOCl to LDH-A employed in kinetic and electrophoresis experiments yielded a weak emission spectrum with a peak between 375 and 385 nm that was consistent with dityrosine (Supplemental Figure S7). While emission for isolated dityrosine is typically at 410 nm, protein bound dityrosine in actin has been detected in the 370–380 nm range [39,40]. The emission spectrum required higher LDH-A concentrations while maintaining the same oxidant to protein ratio. The requirement for NaOH and a higher LDH-A concentration resulted in protein precipitation; therefore, quantitation of LDH-A dityrosine was not possible.
We attempted to induce dityrosine formation in LDH-A using horseradish peroxidase (HRP) and excess H2O2. Isolated tyrosine is readily oxidized to dityrosine by this method [39]. However, no LDH-A crosslink or fluorescence was detected. There was no change in LDH-A monomer mobility by SDS-PAGE, native gel electrophoresis and no decrease in LDH-A enzyme activity.

3.6. Effects of HOCl Scavengers on LDH-A Inhibition

Several well-characterized HOCl scavengers including nitrite, GSH and S-methyl-cys, a thioether like methionine, were used to assess LDH-A sensitivity to HOCl. By premixing LDH-A and a scavenger with a known rate constant prior to HOCl addition, changes in LDH-A oxidation and inhibition can be used to estimate a rate constant for protein plus oxidant.
In the presence of excess nitrite, LDH-A cysteines were not oxidized by HOCl as evidenced by increased M5F labeling relative to HOCl alone (Supplemental Figure S8). The intensity of the high MW crosslink decreased when nitrite was premixed with LDH-A prior to HOCl addition. Consistent with the report of Eiserich et al., premixed nitrite and HOCl labeled yielded a different result from the addition of HOCl to a mixture of nitrite and LDH-A [41]. Kinetic data confirmed that nitrite ion protected LDH-A from HOCl-induced inhibition (Supplemental Figure S9). To retain control activity, 1 mM nitrite was required to protect 10 μM LDH-A from 100 μM HOCl. GSH (100 μM) or 200 μM S-methyl-cys protected 10 μM LDH-A from oxidation and inhibition by 100 μM HOCl (Table 2).
Analogous competition assays were performed to assess LDH-A sensitivity to 1O2. Scavengers included ascorbate, NADH, GSH and S-methyl-cys. For 1O2, ascorbate and NADH were most effective at protecting LDH-A (Supplemental Figure S10). Higher concentrations of GSH (>1 mM) and S-methyl-cys (1 mM) were required to afford full protection of LDH-A from ~20 μM 1O2 (60 s red light).

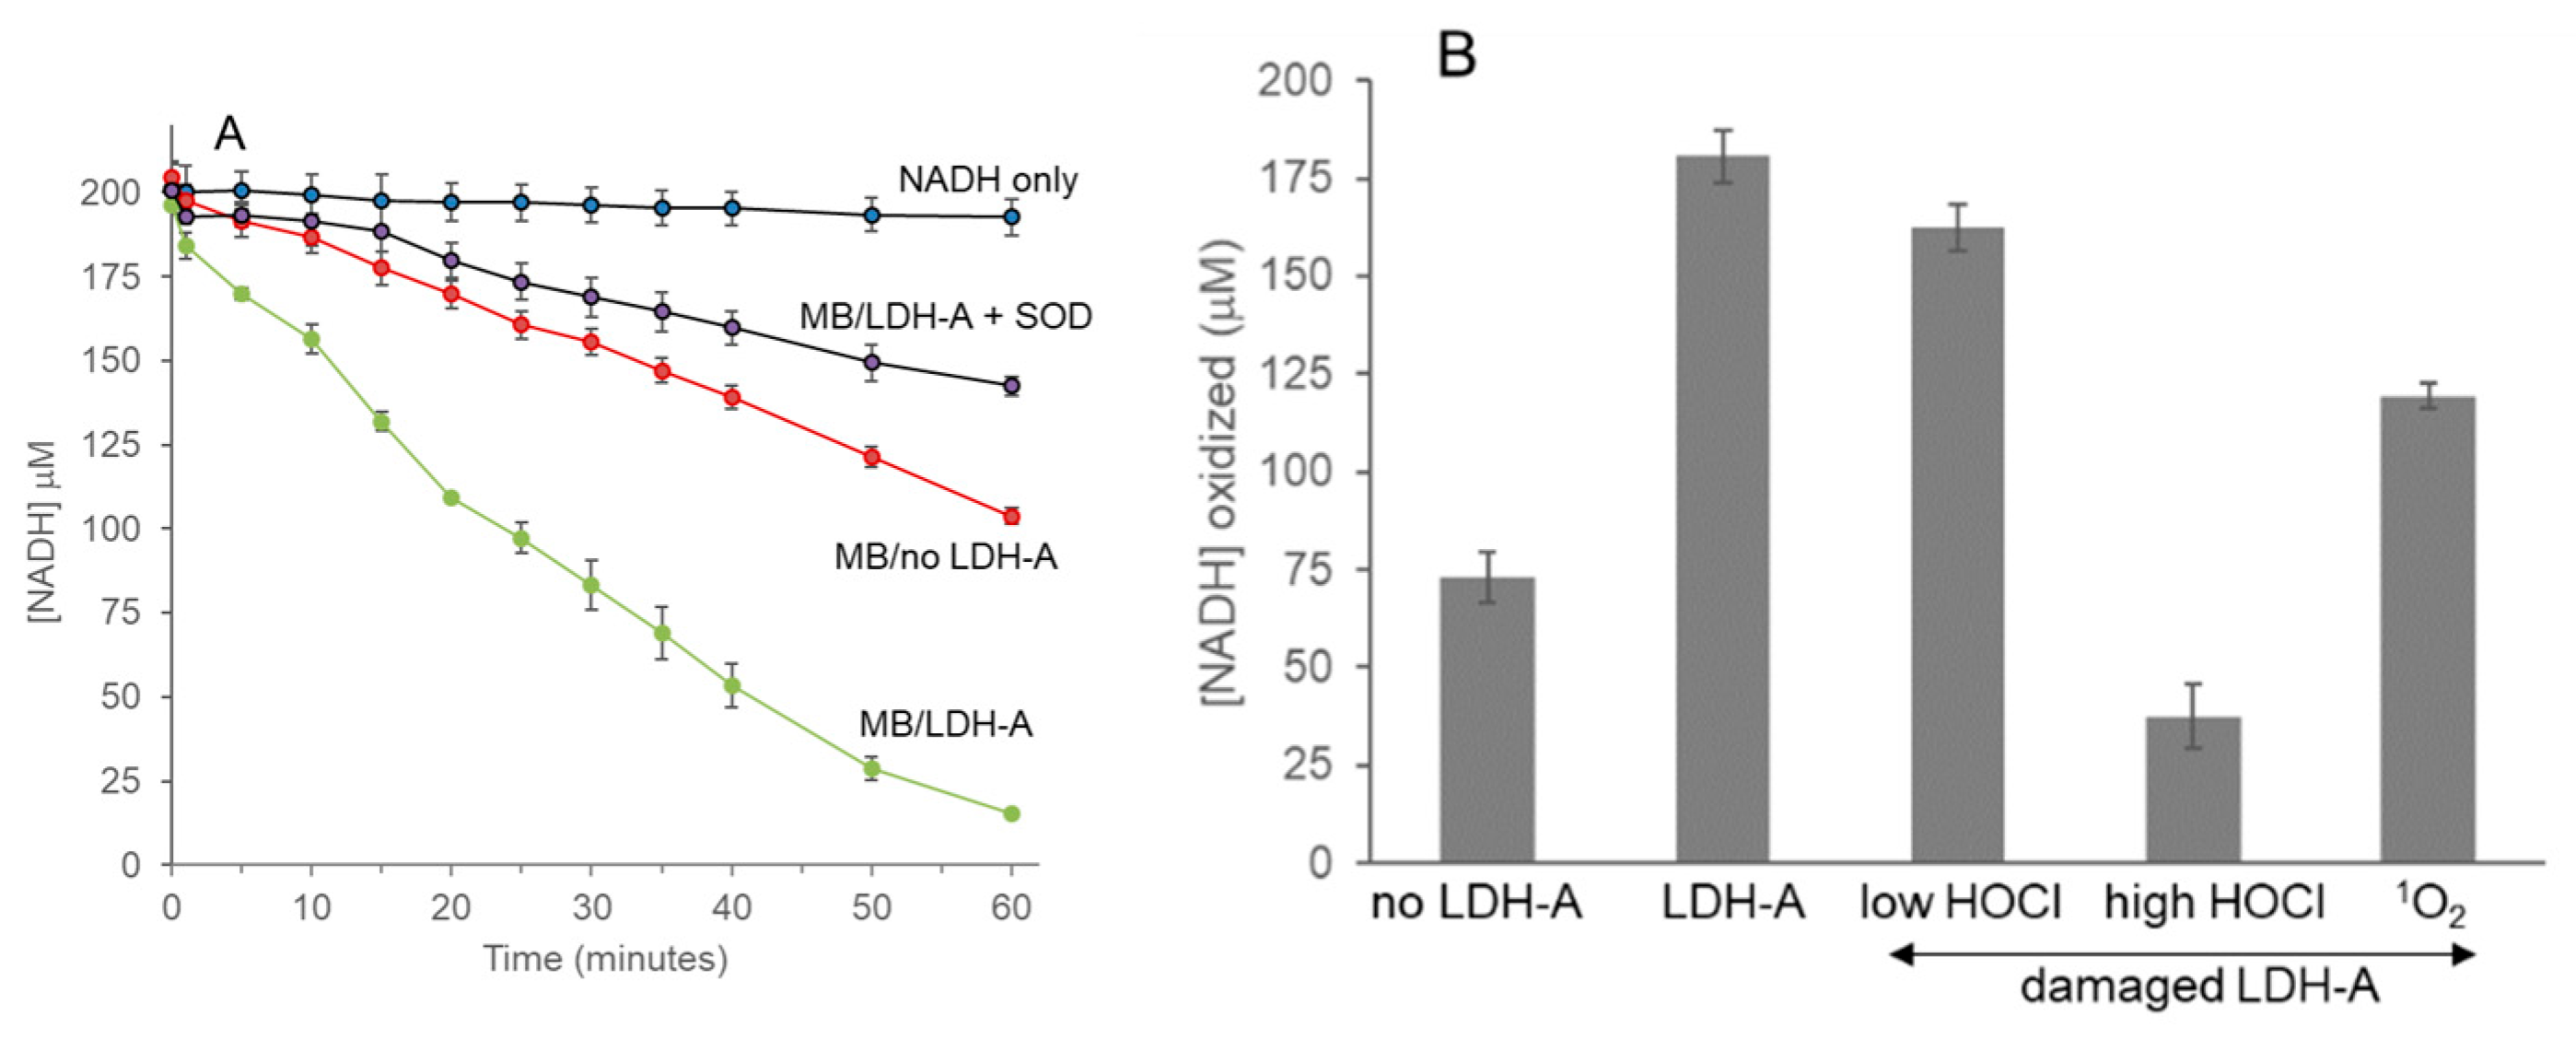
3.7. Enhanced NADH Oxidation by LDH-A; Activation by 1O2

We sought to determine if either 1O2 or HOCl activated NADH oxidation in a manner similar to superoxide anion and other ROS [25,26]. In particular, we were interested in 1O2 because its reaction with NADH produces the NAD radical (NAD) and O2•−. Further, NAD· reacts with O2 to produce NAD+ and O2•−. H2O2 forms via O2•− dismutation [43,44].
The combination of MB, ambient O2 and red light (10 s) initiated NADH oxidation in the absence and presence of LDH-A (Figure 7A). This brief light exposure yielded ~3–4 μM 1O2 based on the resulting decrease in NADH absorbance. Once activated, NADH oxidation was monitored for 60 min. In the absence of MB (NADH only), NADH was stable, and 193 μM NADH remained after 60 min. For MB/no LDH-A, oxidation occurred at a linear rate of 1.6 μM NADH/min. LDH-A enhanced the rate twofold, and only 15 μM NADH remained after 60 min (MB/LDH-A).
For samples containing MB, LDH-A and SOD, only 60 μM NADH was oxidized vs. 185 μM in the absence of SOD (Figure 7A). When 10 μM HOCl was added instead of MB and red light, no activation of the NADH oxidation chain reaction occurred. HOCl directly oxidizes NADH to NAD+ and does not produce radical intermediates [45].
H2O2 was confirmed by adding HRP, which reacts with it and a co-substrate. NADH is a co-substrate; therefore, after HRP addition, the absorbance at 340 nm decreased further [46]. For the MB/LDH-A sample, a different co-substrate, guaiacol, was added prior to HRP addition because very little NADH remained after 60 min. HRP-oxidized guaiacol yielded an orange product that absorbed at 470 nm. When catalase was added prior to HRP to consume H2O2, no decrease in NADH absorbance or guaiacol product was detected.
HOCl- and 1O2-pretreated LDH-A samples were assayed to determine if damage by oxidants affected enhanced NADH oxidation by LDH-A. Samples labeled “no LDH-A” and “LDH-A” in Figure 7B correspond to MB/no LDH-A and MB/LDH-A in Figure 7A and should represent the range of NADH oxidation by LDH-A pretreated with oxidants.
For low HOCl and for 1O2 in Figure 7B, NADH oxidation decreased to within the expected range. For those LDH-A samples, we conclude that the protein is damaged enough that it cannot enhance the rate of NADH oxidation to the same extent as the control, undamaged LDH-A.
However, pretreatment with high HOCl (150 μM) decreased NADH oxidation below that of “no LDH-A”. The data in Figure 6A show that this HOCl concentration induced considerable cross-linking and aggregation and high HOCl reduced LDH-A activity to only 15–20% of the control LDH-A (line 535). We hypothesize that, in this unfolded state, HOCl-damaged LDH-A may scavenge the small amount of 1O2 that is required to initiate the superoxide-dependent NADH oxidation process. If so, then its overall NADH oxidation activity would be below NADH oxidation by “no LDH-A”.

4. Discussion

This study investigated the effect of several ROS, primarily HOCl and 1O2, on LDH-A structure and function. Multiple techniques confirmed a conformational change in LDH-A induced by HOCl. We observed changes in SDS-PAGE mobility of the LDH-A monomer (Figure 2A–C and Figure 3A,B), shifts in mobility by native gel electrophoresis (Figure 4A,B) and decreased tryptophan fluorescence (Figure 5A). Further, the conformational change was time-dependent (Figure 3A,B and Figure 5C) and not reversed by disulfide reducing agents, TCEP and DTT. Irreversible inhibition of LDH-A by HOCl was unexpected given that DTT and TCEP reversed nearly all HOCl damage to tubulin and restored polymerization to 90% of untreated tubulin activity [29].
The conformational change(s) induced by HOCl and 1O2 exposed LDH-A cysteines that were modified by M5F (Figure 3A). This is consistent with published work using Cu(II) to initiate oxidative damage to porcine LDH-A in which cysteine reactivity with DTNB increased after oxidation [32]. Thus, cysteine-specific reagents may be useful tools for studying other LDH-A modifications and even binding of selective inhibitors.
Multiple mammalian LDH-A enzymes, including human, rabbit and mouse, contain five cysteines with identical flanking sequences [47]. Results herein on the effects of ROS likely apply to other mammalian LDH-A enzymes. For example, enhanced NADH oxidation, in the absence of pyruvate, has been reported for human, porcine, bovine and herein with rabbit LDH-A [25,26,27].
Cysteine oxidation is a likely outcome given the large rate constants for ROS and cysteine [33]. The reaction of any ROS with a protein target depends on the relative abundance and accessibility of a protein’s side chains. LDH-A contains an essential cysteine, cys 162, in rabbit muscle LDH-A, situated adjacent to the active site, though it was not directly involved in the reaction mechanism. Once modified by simple maleimides and iodoacetate, the LDH-A reaction cannot proceed [1,22]. However, the essential cysteine need not be the most reactive cysteine.
Cysteine oxidation by as little as 1–2.5 equivalent of HOCl was evident by decreased labeling of LDH-A cysteines using multiple cysteine-specific fluorescent tags (Table 1, Figure 2A and Supplemental Figures S2 and S3). Disulfides between LDH-A monomers were detected by SDS-PAGE and Western blotting under nonreducing conditions (Figure 2C and Supplemental Figure S4). Based on the decrease in cysteine labeling and the loss of LDH-A activity, we conclude that some nonessential, solvent-exposed cysteines were oxidized prior to the essential cysteine. This is noteworthy because LDH-A has multiple functions in addition to its role in glucose metabolism that may be affected by oxidation of cysteines that are not required for catalysis.
Preincubation of LDH-A with the substrate, NADH, blocked both M5F and IAF labeling (Supplemental Figure S5). Simple maleimides and iodoacetamides are known to react with the active site cys162. Therefore, it is likely that M5F and IAF reacted with cys162. However, it is important to distinguish between modification of the essential cysteine and the formation of a disulfide bond. Examination of the rabbit muscle LDH-A X-ray structure (pdb 5NQQ) shows that cys34 is closest to cys162 and near the NADH binding domain. By comparison, cys184 and cys130 are closer to the protein’s surface and would be more accessible to ROS and labeling reagents. From the X-ray structure, none of the cysteines are located directly at the interface between LDH-A monomers. This may explain the relatively low yield of inter-subunit disulfides detected by Western blotting (Supplemental Figure S4) relative to tubulin, a protein we have studied in detail [48].
Evidence for dityrosine, a well-characterized product of HOCl oxidation, was confirmed by fluorescence spectroscopy [49]. If Tyr246 of one subunit formed dityrosine with Tyr246 of a second subunit in the intact homotetramer, we would expect to see a prominent dimer of approximately 70–75 kDa and even a tetramer of ~150 kDa, but we did not. Therefore, it is likely that dityrosine forms only after other types of HOCl damage have altered LDH-A conformation to the extent that tyrosines are close enough to yield the very high-molecular-weight species that barely enters the separating gel. By comparison, 1O2 damage in Figure 1 shows the more typical laddering that occurs when dimers, trimers and tetramers form when a native homotetramer is damaged by an oxidant.
Dityrosine within a monomer may explain the band splitting of the 36 kDa protein observed by SDS-PAGE (Figure 2A and Figure 3A). Also, we have observed that oxidative damage can alter SDS binding so that proteins shift on SDS-PAGE [48].
Native gel electrophoresis with activity staining was vital to understand effects of HOCl on LDH-A. This technique showed the conformational change as band shifts with decreasing activity as HOCl increased. Also, the crosslink, present in the sample wells, retained some activity (Figure 4A). Further, the addition of DTT modestly increased the activity of cross-linked LDH-A (Figure 4B). We know that the crosslink contained reduced cysteines that were labeled by M5F and IAF (Figure 2A and Supplemental Figure S2). Native gel results may differ from those in Figure 4C because the activity stain measures LDH-A activity in the lactate to pyruvate direction unlike Figure 2D where the opposite reaction was evaluated.
Tryptophan fluorescence data supported our observations in Figure 1, Figure 2, Figure 3 and Figure 4. Of the six tryptophans in LDH-A, Trp187 is noteworthy because it is near Cys184. Because both HOCl and NEM treatment decreased tryptophan fluorescence, we conclude that cysteine damage alone is sufficient to alter LDH-A structure. Further, the decrease in emission was associated with increased cysteine oxidation and a loss of LDH-A activity. Tryptophan fluorescence is a sensitive technique because small motions of the indole side chain can result in changes in emission [50]. One can expect such effects to be highly sensitive to the conformation of the protein and the relative orientation of tryptophan.
Based on the data presented, we believe that both cysteine oxidation and dityrosine formation by HOCl are required to initiate the conformational change that rendered LDH-A inactive. Of the oxidants tested, only HOCl is capable of inducing both types of damage. This is important because HOCl is being explored as a possible treatment for several cancers [51,52]. Of note, damage by 1O2 is markedly different from HOCl with crosslinks but not band splitting or shifting (Figure 1).
Oxidation of non-essential cysteines to disulfides is a probable first step because HOCl is a potent cysteine oxidant [33,34]. Formation of a disulfide may induce a conformational change that moves tyrosines close enough to form dityrosine. Both cysteine oxidation and crosslink formation in LDH-A were time-dependent (Figure 3A). This proposed order is supported by evidence that HRP and H2O2, known to form dityrosine, did not induce it in LDH-A.
Competition studies with GSH, nitrite ion, and S-methyl-cys, a methionine analog, provide insight into the rate constant for the reaction of LDH-A with HOCl (Table 2). The reported rate constant for the reaction of HOCl with nitrite at pH 7.2 and 25 °C is 7.3 × 10³ M−1 s−1 [42]. Both kinetic and gel data show that 0.5 and 1 mM nitrite competed with 10 μM LDH-A for reaction with HOCl. Using nitrite or S-methyl-cys in competition experiments is advantageous over GSH. Oxidation of GSH by HOCl yields GSSG, which can undergo thiol/disulfide exchange with protein thiols [48]. Further, because it is a thiol, excess GSH complicates the detection of protein thiols following HOCl treatment. This information provides an excellent starting point when we assess the sensitivity of other proteins to oxidation by HOCl.
Despite using 500-fold higher concentrations (relative to LDH-A) of other ROS including H2O2, glycine chloramine and Angeli’s salt, no inhibition or oxidation of cysteines was observed. These high oxidant concentrations oxidize cysteines of GAPDH and tubulin and result in decreased activity of both [29,53]. This resistance is noteworthy given the pivotal role of LDH-A in cancer cells where high oxidative stress is ever present. Also, because LDH-A can produce H2O2 via the superoxide-initiated NADH oxidation chain reaction, H2O2 would not be expected to inhibit it.
Previously, we reported that 2–3 equivalents of 1O2 relative to LDH-A induced crosslinks and abolished all catalytic activity [23]. Our results herein build on these findings to show that 1O2 damage to LDH-A exposed cysteines that were not accessible prior to damage (Figure 1B). Likewise, the fact that 1O2 can activate NADH oxidation by LDH-A and that it is superoxide-dependent is noteworthy (Figure 7A). When photodynamic therapy generates 1O2, the resulting Type I photo-oxidation yields superoxide anion when hydrogen atom abstraction generates NAD·or amino acid radicals that react with O2 [54]. Even if LDH-A were not a primary target for ROS, its ability to oxidize NADH, in the absence of pyruvate, and generate H2O2 are important mechanisms to affect viability regardless of the cell type.
The results presented and methodology employed are important because LDH-A is a target for anti-cancer drug development due to its overexpression and metabolic role in several cancers [5,6,12]. Lastly, Figure 7B shows that the extent of inhibition of pyruvate-dependent (Figure 2 and Figure 3) and superoxide-dependent NADH oxidation by LDH-A need not be identical. A direct comparison is not possible because even if LDH-A had diminished ability to oxidize NADH, oxidation still proceeds without enzyme. While both activities require NADH binding to LDH-A, there may be differential outcomes with respect to lactate formation, NADH oxidation and H2O2 generation.

Supplementary Materials

The following supporting information can be downloaded at: https://www.mdpi.com/article/10.3390/biochem4010002/s1. Figure S1: Purification of LDH-A by Cibacron Blue chromatography; Figure S2: IAF labeling of LDH-A oxidized by HOCl (90% pure LDH-A); Figure S3: IAEDANS labeling of LDH-A oxidized by HOCl (90% pure LDH-A); Figure S4: Western blot of LDH-A oxidized by HOCl +/− BME; Figure S5: Preincubation of LDH-A with NADH decreases cysteine labeling; Figure S6: LDH-A tryptophan emission at 10 μM HOCl vs control; Figure S7: Fluorescence emission of LDH-A oxidized with HOCl: emission at 380 nm; Figure S8: Effect of nitrite on HOCl oxidation LDH-A–M5F labeling; Figure S9: Effect of nitrite on LDH-A inhibition by HOCl; Figure S10: Effect of singlet oxygen scavengers on LDH-A inhibition.

Author Contributions

L.L.: conceptualization, methodology, investigation, formal analysis, writing—original draft preparation, writing—review and editing, supervision, project administration. L.B.: methodology, investigation, writing—original draft preparation. T.L.: methodology, investigation. All authors have read and agreed to the published version of the manuscript.

Funding

This research received no external funding.

Data Availability Statement

The data presented in this study are available upon request from the corresponding author.

Acknowledgments

This work was supported by undergraduate Honors fellowships to L.B. and T.L. by the Charles Center at William & Mary.

Conflicts of Interest

The authors declare no conflicts of interest.

Abbreviations

AS, Angeli’s salt; DNPH, dinitrophenylhydrazine; DTNB, 5,5′-dithiobis(2-nitrobenzoic acid); DTT, dithiothreitol; GSH, glutathione; HNO, nitroxyl; HOCl, hypochlorous acid; HRP, horseradish peroxidase; IAEDANS, (1,5-IAEDANS, 5-((((2-iodoacetyl)amino)ethyl)amino)naphthalene-1-sulfonic acid); IAF, 5-iodoacetomido-fluorescein; IAM, iodoacetamide; LDH, lactate dehydrogenase; MB, methylene blue; M5F, fluorescein-5-maleimide; MPO, myeloperoxidase; NBT, nitroblue tetrazolium; NEM, N-ethyl maleimide; PB, phosphate buffer; PEP, phosphoenolpyruvate; PK, pyruvate kinase; PMS, phenazine methosulfate; SOD, superoxide dismutase; TCEP, Tris(2-carboxyethyl)phosphine.

References

  1. Holbrook, J.J.; Liljas, A.; Steindel, S.J.; Rossmann, M.J. Lactate Dehydrogenase. In The Enzymes; Boyer, P.D., Ed.; Academic Press: New York, NY, USA, 1975; Volume 11, pp. 191–292. [Google Scholar]
  2. Newington, J.T.; Harris, R.A.; Cumming, R.C. Reevaluating Metabolism in Alzheimer’s Disease from the Perspective of the Astrocyte-Neuron Lactate Shuttle. J. Neurodegener. Dis. 2013, 2013, 1–13. [Google Scholar] [CrossRef]
  3. Ippolito, L.; Morandi, A.; Giannoni, E.; Chiarugi, P. Lactate: A Metabolic Driver in the Tumour Landscape. Trends Biochem. Sci. 2019, 44, 153–166. [Google Scholar] [CrossRef]
  4. Fantin, V.R.; St-Pierre, J.; Leder, P. Attenuation of LDH-A Expression Uncovers a Link between Glycolysis, Mitochondrial Physiology, and Tumor Maintenance. Cancer Cell 2006, 9, 425–434. [Google Scholar] [CrossRef]
  5. Miao, P.; Sheng, S.; Sun, X.; Liu, J.; Huang, G. Lactate Dehydrogenase a in Cancer: A Promising Target for Diagnosis and Therapy. Int. Union Biochem. Mol. Biol. 2013, 65, 904–910. [Google Scholar] [CrossRef] [PubMed]
  6. Le, A.; Cooper, C.R.; Gouw, A.M.; Dinavahi, R.; Maitra, A.; Deck, L.M.; Royer, R.E.; Vander Jagt, D.L.; Semenza, G.L.; Dang, C. V Inhibition of Lactate Dehydrogenase A Induces Oxidative Stress and Inhibits Tumor Progression. Proc. Natl. Acad. Sci. USA 2010, 107, 2037–2042. [Google Scholar] [CrossRef]
  7. Warburg, O.; Wind, F.; Negelein, E. The Metabolism of Tumors in the Body. J. Gen. Physiol. 1927, 8, 519–530. [Google Scholar] [CrossRef]
  8. Potter, M.; Newport, E.; Morten, K.J. The Warburg Effect: 80 Years On. Biochem. Soc. Trans. 2016, 44, 1499–1505. [Google Scholar] [CrossRef]
  9. Fan, J.; Hitosugi, T.; Chung, T.-W.; Xie, J.; Ge, Q.; Gu, T.-L.; Polakiewicz, R.D.; Chen, G.Z.; Boggon, T.J.; Lonial, S.; et al. Tyrosine Phosphorylation of Lactate Dehydrogenase A Is Important for NADH/NAD+ Redox Homeostasis in Cancer Cells. Mol. Cell. Biol. 2011, 31, 4938–4950. [Google Scholar] [CrossRef] [PubMed]
  10. Kim, J.; Dang, C.V. Multifaceted Roles of Glycolytic Enzymes. Trends Biochem. Sci. 2005, 30, 142–150. [Google Scholar] [CrossRef] [PubMed]
  11. Boukouris, A.E.; Zervopoulos, S.D.; Michelakis, E.D. Metabolic Enzymes Moonlighting in the Nucleus: Metabolic Regulation of Gene Transcription. Trends Biochem. Sci. 2016, 41, 712–729. [Google Scholar] [CrossRef] [PubMed]
  12. Gallo, M.; Sapio, L.; Spina, A.; Naviglio, D.; Calogero, A.; Naviglio, S. Lactic Dehydrogenase and Cancer: An Overview. Front. Biosci. 2015, 20, 1234–1249. [Google Scholar]
  13. Hirschhaeuser, F.; Sattler, U.G.A.; Mueller-Klieser, W. Lactate: A Metabolic Key Player in Cancer. Cancer Res. 2011, 71, 6921–6925. [Google Scholar] [CrossRef]
  14. Latham, T.; Mackay, L.; Sproul, D.; Karim, M.; Culley, J.; Harrison, D.J.; Hayward, L.; Langridge-Smith, P.; Gilbert, N.; Ramsahoye, B.H. Lactate, a Product of Glycolytic Metabolism, Inhibits Histone Deacetylase Activity and Promotes Changes in Gene Expression. Nucleic Acids Res. 2012, 40, 4794–4803. [Google Scholar] [CrossRef]
  15. Cumming, R.C.; Andon, N.L.; Haynes, P.A.; Park, M.; Fischer, W.H.; Schubert, D. Protein Disulfide Bond Formation in the Cytoplasm during Oxidative Stress. J. Biol. Chem. 2004, 279, 21749–21758. [Google Scholar] [CrossRef]
  16. Butterfield, D.A.; Perluigi, M.; Sultana, R. Oxidative Stress in Alzheimer’s Disease Brain: New Insights from Redox Proteomics. Eur. J. Pharmacol. 2006, 545, 39–50. [Google Scholar] [CrossRef]
  17. Green, P.S.; Mendez, A.J.; Jacob, J.S.; Crowley, J.R.; Growdon, W.; Hyman, B.T.; Heinecke, J.W. Neuronal Expression of Myeloperoxidase Is Increased in Alzheimer’s Disease. J. Neurochem. 2004, 90, 724–733. [Google Scholar] [CrossRef] [PubMed]
  18. Pullar, J.M.; Winterbourn, C.C.; Vissers, M.C.M. Loss of GSH and Thiol Enzymes in Endothelial Cells Exposed to Sublethal Concentrations of Hypochlorous Acid. Am. J. Physiol. 1999, 277, H1505–H1512. [Google Scholar] [CrossRef] [PubMed]
  19. McBean, G.J.; Aslan, M.; Griffiths, H.R.; Torrao, R.C. Thiol Redox Homeostasis in Neurodegenerative Disease. Redox Biol. 2015, 5, 186–194. [Google Scholar] [CrossRef] [PubMed]
  20. Biswas, S.; Chida, A.S.; Rahman, I. Redox Modifications of Protein-Thiols: Emerging Roles in Cell Signaling. Biochem. Pharmacol. 2006, 71, 551–564. [Google Scholar] [CrossRef] [PubMed]
  21. Holbrook, J.J.; Gutfreund, H. Approaches to the Study of Enzyme Mechanisms Lactate Dehydrogenase. FEBS Lett. 1973, 31, 157–169. [Google Scholar] [CrossRef] [PubMed]
  22. Holbrook, J.J.; Stinson, R.A. Reactivity of the Essential Thiol Group of Lactate Dehydrogenase and Substrate Bindng. Biochem J 1970, 120, 289–297. [Google Scholar] [CrossRef]
  23. Landino, L.M.; Shuckrow, Z.T.; Mooney, A.S.; Lauderback, C.O.; Lorenzi, K.E. Photo-Oxidation and Photoreduction of Catechols by Chlorophyll Metabolites and Methylene Blue. Chem. Res. Toxicol. 2022, 35, 1851–1862. [Google Scholar] [CrossRef] [PubMed]
  24. Dąbrowski, J.M. Chapter Nine—Reactive Oxygen Species in Photodynamic Therapy: Mechanisms of Their Genration and Potentiation. In Inorganic Reaction Mechanisms; van Eldik, R., Hubbard, C.D., Eds.; Academic Press: Cambridge, MA, USA, 2017; Volume 70, pp. 343–394. ISBN 0898-8838. [Google Scholar]
  25. Chan, P.C.; Bielski, H.J. Enzyme-Catalyzed Free Radical Reactions with Nicotinamide Adenine Nucleotides: II.Lactate Dehydrogenase-Catalyzed Oxidation of Reduced Nicotinamide Adenine Dinucleotide by Superoxide Radicals Denerated by Xanthine Oxidase. J. Biol. Chem. 1974, 249, 1317–1319. [Google Scholar] [CrossRef] [PubMed]
  26. Petrat, F.; Bramey, T.; Kirsch, M.; De Groot, H. Initiation of a Superoxide-Dependent Chain Oxidation of Lactate Dehydrogenase-Bound NADH by Oxidants of Low and High Reactivity. Free Radic. Res. 2005, 39, 1043–1057. [Google Scholar] [CrossRef] [PubMed]
  27. Wu, H.; Wang, Y.; Ying, M.; Jin, C.; Li, J.; Hu, X. Lactate Dehydrogenases Amplify Reactive Oxygen Species in Cancer Cells in Response to Oxidative Stimuli. Signal Transduct. Target. Ther. 2021, 6, 242. [Google Scholar] [CrossRef] [PubMed]
  28. Winterbourn, C.C.; Brennan, S.O. Characterization of the Oxidation Products of the Reaction between Reduced Glutathione and Hypochlorous Acid. Biochem. J. 1997, 326, 87–92. [Google Scholar] [CrossRef] [PubMed]
  29. Landino, L.M.; Hagedorn, T.D.; Kim, S.B.; Hogan, K.M. Inhibition of Tubulin Polymerization by Hypochlorous Acid and Chloramines. Free Radic. Biol. Med. 2011, 50, 1000–1008. [Google Scholar] [CrossRef]
  30. Makriyannis, T.; Clonis, Y.D. Simultaneous Separation and Purification of Pyruvate Kinase and Lactate Dehydrogenase by Dye-Ligand Chromatography. Process Biochem. 1993, 28, 179–185. [Google Scholar] [CrossRef]
  31. Rees, M.D.; Bottle, S.E.; Fairfull-Smith, K.E.; Malle, E.; Whitelock, J.M.; Davies, M.J. Inhibition of Myeloperoxidase-Mediated Hypochlorous Acid Production by Nitroxides. Biochem. J. 2009, 421, 79–86. [Google Scholar] [CrossRef]
  32. Pamp, K.; Bramey, T.; Kirsch, M.; de Groot, H.; Petrat, F. NAD(H) Enhances the Cu(II)-Mediated Inactivation of Lactate Dehydrogenase by Increasing the Accessibility of Sulfhydryl Groups. Free Radic. Res. 2005, 39, 31–40. [Google Scholar] [CrossRef]
  33. Storkey, C.; Davies, M.J.; Pattison, D.I. Reevaluation of the Rate Constants for the Reaction of Hypochlorous Acid (HOCl) with Cysteine, Methionine, and Peptide Derivatives Using a New Competition Kinetic Approach. Free Radic. Biol. Med. 2014, 73, 60–66. [Google Scholar] [CrossRef]
  34. Peskin, A.V.; Winterbourn, C.C. Kinetics of the Reactions of Hypochlorous Acid and Amino Acid Chloramines with Thiols, Methionine and Ascorbate. Free Radic. Biol. Med. 2001, 30, 572–579. [Google Scholar] [CrossRef]
  35. Landino, L.M.; Hasan, R.; McGaw, A.; Cooley, S.; Smith, A.W.; Masselam, K.; Kim, G. Peroxynitrite Oxidation of Tubulin Sulfhydryls Inhibits Microtubule Polymerization. Arch. Biochem. Biophys. 2002, 398, 213–220. [Google Scholar] [CrossRef]
  36. Sjoback, R.; Nygren, J.; Kubista, M. Absorption and Fluorescence Properties of Fluorescein. Spectrochim. Acta Part A 1995, 51, L7–L21. [Google Scholar] [CrossRef]
  37. Bloxham, D.P.; Sharma, R.P.; Wilton, D.C. A Detailed Investigation of the Properties of Lactate Dehydrogenase in Which the Essential Cysteine-165 Is Modified by Thioalkylation. Biochem. J. 1979, 177, 769–780. [Google Scholar] [CrossRef] [PubMed]
  38. Braz, V.A.; Howard, K.J. Separation of Protein Oligomers by Blue Native Gel Electrophoresis. Anal. Biochem. 2009, 388, 170–172. [Google Scholar] [CrossRef] [PubMed]
  39. Malencik, D.A.; Sprouse, J.F.; Swanson, C.A.; Anderson, S.R. Dityrosine: Preparation, Isolation and Analysis. Anal. Biochem. 1996, 242, 202–213. [Google Scholar] [CrossRef] [PubMed]
  40. Dalle-Donne, I.; Milzani, A.; Colombo, R. Fluorometric Detection of Dityrosine Coupled with HPLC Separation for Determining Actin Oxidation. Am. Biotechnol. Lab. 2001, 19, 34–36. [Google Scholar]
  41. Eiserich, J.P.; Cross, C.E.; Jones, A.D.; Halliwell, B.; Van der Vliet, A. Formation of Nitrating and Chlorinating Species by Reaction of Nitrite with Hypochlorous Acid. J. Biol. Chem. 1996, 271, 19199–19208. [Google Scholar] [CrossRef] [PubMed]
  42. Whiteman, M.; Rose, P.; Siau, J.L.; Halliwell, B. Nitrite-Mediated Protection against Hypochlorous Acid-Induced Chondrocyte Toxicity. Arthritis Rheum. 2003, 48, 3140–3150. [Google Scholar] [CrossRef] [PubMed]
  43. Peters, G.; Rodgers, M.A.J. Single-Electron Transfer from NADH Analogues to Singlet Oxygen. Biochim. Biophys. Acta-Bioenerg. 1981, 637, 43–52. [Google Scholar] [CrossRef] [PubMed]
  44. Petrat, F.; Pindiur, S.; Kirsch, M.; de Groot, H. NAD(P)H, a Primary Target of 1O2 in Mitochondria of Intact Cells. J. Biol. Chem. 2003, 278, 3298–3307. [Google Scholar] [CrossRef]
  45. Prütz, W.A.; Kissner, R.; Koppenol, W.H.; Rüegger, H. On the Irreversible Destruction of Reduced NicotinamideNucleotides by Hypohalous Acids. Arch. Biochem. Biophys. 2000, 380, 181–191. [Google Scholar] [CrossRef] [PubMed]
  46. Yang, X.; Ma, K. Determination of Hydrogen Peroxide Generated by Reduced Nicotinamide Adenine Dinucleotide Oxidase. Anal. Biochem. 2005, 344, 130–134. [Google Scholar] [CrossRef] [PubMed]
  47. Li, Y.-J.; Tsoi, S.C.-M. Phylogenetic Analysis of Vertebrate Lactate Dehydrogenase (LDH) Multigene Families. J. Mol. Evol. 2002, 54, 614–624. [Google Scholar] [CrossRef]
  48. Landino, L.M.; Moynihan, K.L.; Todd, J.V.; Kennett, K.L. Modulation of the Redox State of Tubulin by the Glutathione/Glutaredoxin Reductase System. Biochem. Biophys. Res. Commun. 2004, 314, 555–560. [Google Scholar] [CrossRef]
  49. Heinecke, J.W.; Li, W.; Daehnke, H.L.; Goldstein, J.A. Dityrosine, a Specific Marker of Oxidation, Is Synthesized by the Myeloperoxidase-Hydrogen Peroxide System of Human Neutrophils and Macrophages. J. Biol. Chem. 1993, 268, 4069–4077. [Google Scholar] [CrossRef]
  50. Vivian, J.T.; Callis, P.R. Mechanisms of Tryptophan Fluorescence Shifts in Proteins. Biophys. J. 2001, 80, 2093–2109. [Google Scholar] [CrossRef]
  51. Freund, E.; Miebach, L.; Stope, M.B.; Bekeschus, S. Hypochlorous Acid Selectively Promotes Toxicity and the Expression of Danger Signals in Human Abdominal Cancer Cells. Oncol. Rep. 2021, 45, 71. [Google Scholar] [CrossRef]
  52. Chiang, C.L.-L.; Ledermann, J.A.; Aitkens, E.; Benjamin, E.; Katz, D.R.; Chain, B.M. Oxidation of Ovarian Epithelial Cancer Cells by Hypochlorous Acid Enhances Immunogenicity and Stimulates T Cells That Recognize Autologous Primary Tumor. Clin. Cancer Res. 2008, 14, 4898–4907. [Google Scholar] [CrossRef]
  53. Landino, L.M.; Hagedorn, T.D.; Kennett, K.L. Evidence for Thiol/Disulfide Exchange Reactions Between Tubulin and Glyceraldehyde-3-Phosphate Dehydrogenase. Cytoskeleton 2014, 71, 707–718. [Google Scholar] [CrossRef] [PubMed]
  54. Di Mascio, P.; Martinez, G.R.; Miyamoto, S.; Ronsein, G.E.; Medeiros, M.H.G.; Cadet, J. Singlet Molecular Oxy gen Reactions with Nucleic Acids, Lipids, and Proteins. Chem. Rev. 2019, 119, 2043–2086. [Google Scholar] [CrossRef] [PubMed]
Figure 1. 1O2 oxidation of LDH-A (A) 90% pure LDH-A (10 μM) samples containing 1.5 μM MB were irradiated for 0–90 s. Samples were analyzed by SDS-PAGE under reducing conditions on 10% gels. Gels were stained with Coomassie blue. (B) Cibacron Blue (CB)-purified LDH-A samples were prepared as in (A). After cys modification with 500 μM M5F for 30 min at 37 °C, samples were analyzed by SDS-PAGE under reducing conditions on 10% polyacrylamide gels. Gel images were captured using Bio-Rad Chemi-doc XRS imaging system. After imaging, gels were stained with Coomassie blue.
Biochem 04 00002 g001
Figure 2. HOCl oxidation and inhibition of LDH-A (A) 90% pure (left) and Cibacron Blue-purified LDH-A (right) in 10 mM PB pH 7.4 was treated with 50 and 100 μM HOCl for 30 min at 20 °C. Excess HOCl was quenched with 0.2 mM S-methyl-cys. Samples were analyzed by SDS-PAGE under reducing conditions on 10% gels. Gels were stained with Coomassie blue. (B). Cibacron Blue-purified LDH-A (10 μM) in 10 mM PB pH 7.4 was treated with 10, 25, 50 and 100 μM HOCl for 30 min at 20 °C. Excess HOCl was quenched with 0.2 mM S-methyl-cys. After cys modification with 500 μM M5F for 30 min at 37 °C, samples were analyzed by SDS-PAGE under reducing conditions on 10% polyacrylamide gels. Gel images were captured using the Bio-Rad Chemi-doc XRS imaging system. After imaging, gels were stained with Coomassie blue. (C) LDH-A (10 μM) in 10 mM PB pH 7.4 was treated with 25–100 μM HOCl for 20 min at 20 °C. Samples were combined with SDS-PAGE gel loading buffer with or without βME. Samples were analyzed by SDS-PAGE on 10% gels and stained with Coomassie blue. (D) Samples were prepared as in B. Excess HOCl was quenched with 0.2 mM S-methyl-cys. Samples (15 μL) were diluted 1:10 in 20 mM Tris pH 8.6. Assays (200 μL) contained 20 mM Tris pH 8.6, 25 nM LDH-A, 0.5 mM NADH and either 0.50 or 0.75 mM sodium pyruvate. NADH oxidation was monitored at 340 nm in a 96-well plate for 4 min at 30 °C. Rates were determined from the initial linear portion of the reaction. These data represent the mean ± standard error of at least three independent experiments. One-way ANOVA with the Tukey post hoc test showed that each concentration of HOCl except 10 μM was significant p < 0.001.
Biochem 04 00002 g002
Figure 3. Time-dependent LDH-A oxidation by 100 μM HOCl (A) LDH-A (10 μM) in 10 mM PB pH 7.4 was treated with 100 μM HOCl for 0–30 min at 20 °C. Excess HOCl was quenched with 0.2 mM S-methyl-cys. After cys modification by 500 μM M5F for 30 min at 37 °C, samples were analyzed by SDS-PAGE under reducing conditions on 10% polyacrylamide gels. Gel images were captured using the Bio-Rad Chemi-doc XRS imaging system. Gels were stained with Coomassie blue. (B) LDH-A samples were treated with HOCl and quenched with S-methyl-cys as described in (A). Samples were diluted 1:10 in 20 mM Tris pH 8.6. Assays (200 μL) contained 20 mM Tris pH 8.6, 25 nM LDH-A, 0.5 mM sodium pyruvate and NADH. NADH oxidation was monitored at 340 nm in a 96-well plate for 4 min at 30 °C. Rates were determined from the initial linear portion of the reaction. These data represent the average of three independent experiments ± standard error.
Biochem 04 00002 g003
Figure 4. Native gel electrophoresis of HOCl-treated LDH-A with activity stain (A) LDH-A (10 μM) in 10 mM PB pH 7.4 was treated with 10–100 μM HOCl for 30 min at 20 °C. Native gel electrophoresis was performed using 0.8% agarose gels in 20 mM Tris, 20 mM glycine, 2 mM EDTA pH 9.5 to cast the gels and as the running buffer. Gels were run for 45 min at 90 V. LDH-A activity stain (20 mL) contained 0.75 mM NAD+, 25 mM lithium lactate, 8–10 mg NBT and 1–2 mg PMS in 100 mM Tris pH 8.6. The gel was incubated with activity stain for 10–20 min to allow LDH-A bands to develop. (B) LDH-A samples were treated with HOCl for 30 min at 20 °C. HOCl was quenched with 0.5 mM S-methyl cysteine or with 2 mM DTT for 10 min at 20 °C. Electrophoresis and staining conditions were identical to (A). (C) LDH-A samples were treated with HOCl for 30 min at 20 °C. HOCl was quenched with 0.2 mM S-methyl cysteine or with 2 mM DTT for 10 min at 20 °C. Samples were diluted in 20 mM Tris pH 8.6. Assays (200 μL) contained 20 mM Tris pH 8.6, 25 nM LDH-A, 0.5 mM sodium pyruvate and 0.5 mM NADH. NADH oxidation was monitored at 340 nm in a 96-well plate for 4 min at 30 °C. Rates were determined from the initial linear portion of the reaction. These data represent the average of three independent experiments ± standard error.
Biochem 04 00002 g004
Figure 5. Tryptophan fluorescence of HOCl-treated LDH-A (A) LDH-A (10 μM) in 10 mM PB pH 7.4 was treated with 25, 50 and 100 μM HOCl in a total volume of 60 μL for 30 min at 20 °C. S-methyl-cys (0.2 mM) was added to scavenge excess HOCl. Following dilution with 10 mM PB pH 7.4 to 600 μL, samples were excited with a 290 nm LED lamp, and emission was captured with an Ocean Optics Flame detector. The scan speed was 1000 ms, and 25 scans were averaged to yield emission spectra. (B) LDH-A (10 μM) was treated with 100 μM HOCl as described in (A). Either S-methyl-cys (0.2 mM) or DTT (2mM) was added for 10 min. Samples were diluted, and spectra were collected as described in (A). (C) HOCl (100 μM) was added to LDH-A (10 μM, 80 μL) and immediately transferred to a fluorescence microcuvette. Spectra were saved at the indicated times. An LDH-A control without HOCl was also scanned over the 30 min time interval to monitor any fluctuations.
Biochem 04 00002 g005
Figure 6. Evidence for HOCl-induced dityrosine in LDH-A (A) LDH-A (10 μM) in 10 mM PB pH 7.4 was treated with HOCl for 30 min at 20 °C (20 μL reactions). Unreacted HOCl was quenched with 0.2 mM S-methyl-cys. Following treatment with 500 μM M5F for 30 min at 37 °C, samples were analyzed by SDS-PAGE under reducing conditions on 10% polyacrylamide gels. Gel images were captured using the Bio-Rad Chemi-doc XRS imaging system. Gels were stained with Coomassie blue. (B) LDH-A was treated with HOCl as described in (A), except the total volume was 60 μL. Unreacted HOCl was quenched with 0.2 mM S-methyl-cys. NaOH (0.1 M, 40 μL) was added, and the entire volume was transferred to a black plate and photographed on a UV transilluminator. Emission was quantitated using Image Lab software. Any emission of the LDH-A control was subtracted from that of the HOCl-treated samples and the values normalized.
Biochem 04 00002 g006
Figure 7. Enhanced NADH oxidation by LDH-A: activation by 1O2 (A) All reactions (100 μL) contained 200 μM NADH in 50 mM PB pH 7.1 in a 96-well plate. 1O2 formation was initiated with 2.5 μM MB and 10 s of red light. Additions included LDH-A (10 μM) and SOD (10 U/100 μL). Absorbance at 340 nm was measured prior to and immediately after light exposure. These data represent the average of three independent experiments ± standard error. (B) LDH-A (10 μM) was treated with 25 μM “low HOCl” or 150 μM HOCl “high HOCl” prior to addition of MB and NADH. For “MB/red light”, LDH-A (10 μM) was irradiated for 60 s prior to NADH addition. The total change in [NADH] was measured for 60 min. These data represent the average of three independent experiments performed in duplicate.
Biochem 04 00002 g007
Table 1. Detection of LDH-A cysteines using fluorescein labeling reagents—precipitation and densitometry of protein bands.
[HOCl] μMMol Cys/Mol LDH-A% Control Labeling (Integration of Gel Bands)
02.7 ± 0.2M5FIAF
102.6 ± 0.285 ± 386 ± 4
252.3 ± 0.167 ± 466 ± 3
502.0 ± 0.156 ± 448 ± 5
1001.4 ± 0.246 ± 436 ± 3
For integration of gel bands, the intensity of the LDH monomer band and the high-molecular-weight crosslink were added. These data represent the average of three independent experiments ± standard error.
Table 2. LDH-A protection from HOCl by GSH, NO2 and S-methyl-cys.
HOCl ScavengerLDH-A Activity (% of Control)Rate Constant (M−1 s−1)
none100
+HOCl62 ± 4
+HOCl + 50 μM GSH88 ± 2
+HOCl + 100 μM GSH97 ± 31.2 × 10⁸ [33]
+HOCl + 500 μM NO270 ± 5
+HOCl + 1 mM NO292 ± 47.3 × 10³ [42]
+HOCl + 50 μM S-methyl-cys77 ± 5
+HOCl + 100 μM S-methyl-cys88 ± 4
+HOCl + 200 μM S-methyl-cys95 ± 33.1 × 10⁷ [33] *
LDH-A (10 μM) in 10 mM PB pH 7.4 was treated with 100 μM HOCl for 10 min at 20 °C. All scavengers were premixed with LDH-A prior to addition of HOCl. Activity assays were performed as described in Figure 2D. Reactions of scavengers with HOCl scavengers occur in seconds, whereas up to 30 min with HOCl is required to observe increased LDH-A inhibition (Figure 3B). * This is for the reaction of HOCl with methionine. S-methyl-cys is a thioether like methionine.
Disclaimer/Publisher’s Note: The statements, opinions and data contained in all publications are solely those of the individual author(s) and contributor(s) and not of MDPI and/or the editor(s). MDPI and/or the editor(s) disclaim responsibility for any injury to people or property resulting from any ideas, methods, instructions or products referred to in the content.

