Article

Sustainable Food Packaging with Chitosan Biofilm Reinforced with Nanocellulose and Essential Oils

1
Departamento de Química, Universidade da Beira Interior, Rua Marquês d’Ávila e Bolama, 6200-001 Covilhã, Portugal
2
FibEnTech, Materiais Fibrosos e Tecnologias Ambientais, Universidade da Beira Interior, Rua Marquês d’Ávila e Bolama, 6201-001 Covilhã, Portugal
3
MEtRICs, Departamento de Química, NOVA School of Science and Technology, FCT NOVA, Universidade NOVA de Lisboa, Campus de Caparica, 2829-516 Caparica, Portugal
*
Author to whom correspondence should be addressed.
Macromol 2023, 3(4), 704-722; https://doi.org/10.3390/macromol3040040
Submission received: 15 June 2023 / Revised: 11 September 2023 / Accepted: 26 September 2023 / Published: 10 October 2023
(This article belongs to the Special Issue Functional Polymer-Based Materials)

Abstract

:
Active packaging with biobased polymers aim to extend the shelf life of food and to improve the environmental sustainability of the food industry. This new concept was tested with samples of fresh poultry meat wrapped with chitosan reinforced with 2.5% of commercial nanocellulose (NC) incorporating 1% of essential oils (EO) from Aloysia citrodora (ACEO) and Cymbopogon citratus (CCEO). The performance of the bionanocomposites containing EOs was assessed and compared with unwrapped meat samples and samples wrapped with chitosan/NC, during a 13 day period of refrigerated storage for several physicochemical parameters related to food deterioration and microbial growth. Wrapping the meat with the chitosan/NC polymer helped to increase the shelf life of the meat. The incorporation of EOs added extra activity to the biocomposites, further delaying the meat deterioration process, by halting the lipid oxidation and the Enterobactereaceae growth until the 9th day. The composition of both EOs was similar, with the main components contributing to the increased activity of the biopolymers being geranial and neral. The performance of ACEO surpassed that of CCEO, namely on the Enterobactereaceae growth. This trend may be associated with ACEO’s higher phenolic content and the higher antioxidant activity of the compounds released by the ACEO biopolymers.

Graphical Abstract

1. Introduction

Until recently, consumers accepted the use of synthetic preservatives in food as an inevitability to ensure the safety and long shelf life of products [1]. The use of preservatives by the food industry is necessary to increase the shelf life and to maintain the quality and safety of the product, by delaying the microbial growth, fermentation and acidification reactions leading to its decomposition and alteration. However, consumers are increasingly aware of the hazards of synthetic preservatives, namely, those reported or associated with potentially life-threatening effects, such as allergic effects, intoxication and even cancer and other degenerative diseases [2,3]. Thus, consumers are changing their preference to natural and healthier options, free from synthetic chemicals, to extend products shelf life, e.g., essential oils or extracts obtained from different plants and herbs that are rich in active compounds [4,5].
Essential oils (EO) have been used by the food industry for preservation [1], production of sanitary products and in agriculture [6]. Essential oils seem to be a promising substitute for synthetic food preservatives, since their composition is rich in bioactive chemical components like terpenes, terpenoids and polyphenols. These compounds are recognized worldwide for their biological activities, namely their antioxidant, anti-bacterial and anti-fungal properties. The capacity to inhibit pathogenic microorganism growth contributes to the microbial safety of the products [7]. Since the composition of EOs varies among plants, it is important to analyze different species and have extensive data on the compounds’ concentration, identification and properties.
The food industry is also being increasingly challenged by the way products are packaged and delivered. Active food packaging is a new concept and is a key element to obtaining the optimal compromise between the sustainable management of the food wastes produced and the expectation of consumers for fresher and safer products. This new packaging concept includes the incorporation of active agents on the surface of the packaging film or integrated in the polymeric matrix, or added to a sachet that is inserted in the packaging. The migration of the active compounds to the food products can be achieved via direct contact between food and packaging or through gas phase diffusion from the inner packing layer to the food surface [8,9]. Those compounds that migrate from the packaging to the food, interacting with the food products, may contribute to reduced contamination, maintain or even enhance the nutritional value, and extend the product shelf-life. Among the active packaging materials, bioplastics made of chitosan, alginates or proteins [10] are considered promising environmentally friendly options, and good alternatives to non-biodegradable materials made from non-renewable resources (fossil-based plastics). Chitosan (Ch) is the second most abundant polysaccharide in nature. It is a biodegradable and cationic hydrocolloidal with antimicrobial activity and film-forming capacity obtained from the deacetylation of chitin from the exoskeletons of crustaceans and insects and the cell walls of fungi and microorganisms [10]. This biopolymer, incorporated with different EOs, has been tested as an active packaging to many different food matrices. One successful example of this application was reported for the packing of sliced sausages using chitosan films containing Eucalyptus globulus EOs, which contributed for the reduction of the microbial activity and control of the food-borne contaminations in the food system [11]. Rosemary EO/Ch [12] and ginger EO/Ch [13] biobased films have been applied to fresh poultry meat, and Cinnamodendron dinisii Schwanke EO/Ch films have been applied to beef [14] in some other studies that show the applicability of chitosan loaded with active compounds to stabilize food deterioration reactions. Moreover, incorporating EOs in the polymer instead of directly in the food reduces the EO’s risk of chemical instability and rapid oxidation and slows down their release into the food [15,16]. It also reduces the cost associated with the use of EOs as food preservatives and the negative impact on the sensory perception of the food where the EO was applied [17].
Nonetheless, more research and studies are needed to understand the potential of other EOs in active food packaging. Therefore, this study aimed to assess the use of two EOs from the plant species Aloysia citrodora (ACEO) and Cymbopogon citratus (CCEO) as food preservatives incorporated in chitosan. As pristine chitosan’s hydrophilicity and weak mechanical properties restrict its market application, nanocellulose (NC) was added to Ch to improve its mechanical and barrier properties, as has been observed in different works [18,19]. Both of the studied EOs have been shown to contain phytochemicals with active properties, e.g., antioxidant properties, as in the case of ACEO [20], or antimicrobial properties, as in the case of CCEO [21]. Coatings of chitosan with these EOs have been tested on some different food products. For example, Ch enriched with lemon verbena EO (ACEO) had been previously tested as an edible coating for rainbow trout [22], and a composite of Ch and lemongrass EO (CCEO) was used as a coating for guava [17], and the results of both studies showed a delay in food spoilage processes. However, to our knowledge, the application of Ch/ACEO or Ch/CCEO to fresh poultry meat has not yet been tested. Thus, Ch-NC/ACEO and Ch-NC/CCEO were tested as coatings for fresh poultry meat, and the potential of both types of active packaging was evaluated along the product’s shelf life. This study is also in line with the United Nations Sustainable Development Goals, namely Goal 12 (Responsible Consumption and Reduction), and specifically, this study aims to contribute to a reduction in food waste and food losses [23].

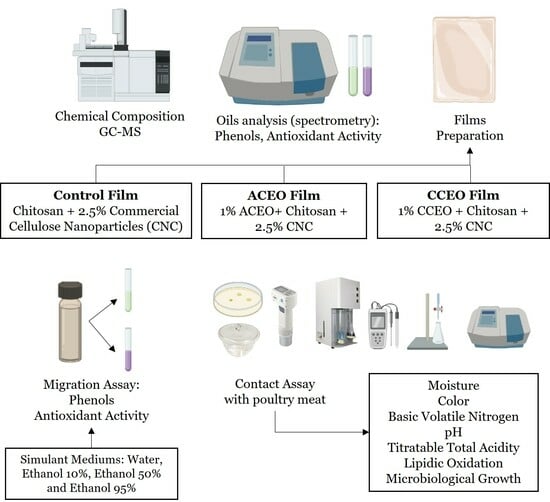
2. Materials and Methods

2.1. Materials and Reagents

Essential oils obtained via steam distillation from the aerial parts of A. citrodora and C. citratus were supplied by the company Biomater—Soulful Farming Company (Alentejo, Portugal) and were stored at 4 °C and protected from light until use. Chitosan (Poly(D-glucosamine)) with 75% deacetylation and high molecular weight (31–37 kDa) was used as a polymeric matrix and purchased from Sigma Aldrich (Darmstadt, Germany). Commercial Nanocellulose was kindly supplied by Nanocrystacell (Podcerkev, Slovenia).
All reagents used were of analytical reagent grade and were used as purchased. Glacial acetic acid, glycerol, tween 80 (polyethylene glycol sorbitan monolaurate) and sodium hydroxide (NaOH) were purchased from Alfa Aesar (Kandel, Germany). Ethanol absolute, 2,2-diphenyl-1-picrylhydrazyl (DPPH) and 1,1,3,3-tetraethoxypropane (TEP) were acquired from Sigma-Aldrich (Steinheim, Germany). Sodium chloride (NaCl), Folin–Ciocalteu reagent, trichloroacetic acid (TCA), 2-thiobarbituric acid (TBA) and sodium carbonate anhydrous were obtained from PanReac (Barcelona, Spain). Plate count agar (PCA), violet red bile glucose (VRBG) and tryptone were purchased from Biokar (Allonne, Beauvais, France). The water used during the experiment was purified using a Milli-Q system (Millipore, Bedford, MA, USA).

2.2. Essential Oils Characterization

2.2.1. GC-MS Analysis

Analysis of chemical composition was conducted using Gas Chromatography coupled with Mass Spectrometry (GC-MS), using an Agilent 7890A GC coupled with an Agilent 5975C, inert XL with triple-axis mass selective detector and data processing system GC/MSD Chemstation. For the separation of the volatile compounds, a DB-5 J&W GC capillary column (5% phenylmethylpolysiloxane, 30 m length, 0.25 mm diameter and 0.25 μm film) was used, with helium as the mobile phase, at 1 mL/min. Temperature profile: injector temperature, 250 °C; oven initial temperature, 60 °C for 5 min; temperature rise, 10 °C/min until 250 °C. The GC operated with an injection volume of 1 mL and a split ratio of 1:50. The components were identified based on comparison of their mass spectra with those of NIST and Wiley mass spectral library, as well as in relation to a homologous series of n-alkanes (C7–C25) under the same operating conditions.

2.2.2. Total Phenolic Content

The total phenolic content (TPC) of the ACEO and CCEO was analyzed diluted in four simulant media: water, ethanol 10%, ethanol 50%, ethanol 95%. Those four different simulant media can mimic a more or less hydrophilic substrate. To quantify the total phenolic content, the procedure of Singleton and collaborators was followed [24]. In the procedure, 3 mL of water Mili Q and 0.25 mL of Folin–Ciocalteu reagent were added to 1 mL of the sample diluted in each simulant. The mixtures were incubated for 5 min in the dark at room temperature, and after, 0.75 mL of sodium carbonate solution 5% (w/v) was added to the tubes. Then, the mixtures were stored again for 60 min in the dark, at room temperature. After the incubation period, the absorbance of the solutions was measured at 760 nm using a UV–Vis spectrophotometer (SPEKOL 1500, Analytik Jena, Jena, Germany). Different calibration curves were constructed using gallic acid solutions from 0 to 100 mg·L–1. The TPC of the different EOs in the different simulant media were calculated using those calibration curves. Results were expressed in mg gallic acid equivalent (GAE)·L–1 of EO.

2.2.3. Antioxidant Activity

For the determination of the antioxidant activity, the ability to scavenge free radicals by EOs was determined using the DPPH assay [25]. The EOs were diluted (1:20) in the different simulant media (water, ethanol 10%, ethanol 50%, ethanol 95%). A diluted aliquot of 1 mL of each EO in each simulant media was added to 3 mL of DPPH solution (60 μmol·L−1). The mixtures were incubated for 20 min at room temperature in the dark. The absorbance of the mixtures was read at 517 nm (UV-VIS spectrophotometer, SPEKOL 1500), before and after the incubation. The radical form of DPPH is purple, and upon the activity of antioxidant, the compound is reduced (losing the purple color) and its absorption decreases. The percentage radical scavenging can be calculated with Equation (1):
R a d i c a l   s c a v e n g i n g   % = I n i t i a l   a b s o r b a n c e a b s o r b a n c e   a f t e r   i n c u b a t i o n I n i t i a l   a b s o r b a n c e × 100

2.3. Bionanocomposites Preparation

The bionanocomposites films were prepared according to Siripatrawan and Harte [26] and Dias et al. [27], with minor adjustments. First, the filmogenic solution (FS) was prepared by dissolving 1.5% (w/v) of chitosan in a 1% (v/v) solution of glacial acetic acid, with constant agitation for 24 h, at room temperature. Glycerol was added to all the samples (30% w/w of chitosan) as a plasticizer, and the commercial NC (2.5% w/w of chitosan) was added as a nanofiller to reinforce the chitosan films. Previous works helped to define the proportion of glycerol [12] and NC added [19]. For the control films (Ch-NC), after the addition of glycerol and before adding NC, the FS was submitted to 5 min agitation with ultraturrax (15,000 rpm, IKA® T18, IKA, Bitterfeld-Wolfen, Germany), followed by 15 min degasification in an ultrasound bath (360 W, Selecta, Barcelona, Spain). Afterwards, the NC was incorporated and two more cycles of ultraturrax and ultrasound in the same conditions were performed to guarantee the correct exfoliation and dispersion of all components into the polymeric chain. The finished solution was cast in glass molds (18 × 25 cm) and dried with the aid of a circulatory hot fan (30 °C) for 24 h to 48 h. When dried, the bionanocomposites were peeled and stored to be protected from light at 25 °C and 50% relative humidity, until application. For the films with ACEO (Ch-NC/ACEO) and CCEO (Ch-NC/CCEO), the procedure was the same as for the control films, except the EO (1% (v/v FS) and tween 80 (0.2% v/v in EO) were incorporated before the last cycle. The EO was applied at the rate of 1% (v/v) because, in previous works, it was verified that the range of 1–2% was optimal [12,28,29]. Each type of film was made in triplicate.

2.4. In Vitro Bioactivity Study

A migration assay was performed to study the in vitro bioactivity of the bionanocomposites produced. To test the antioxidant activity of the films, diffusion tests were performed at 40 ± 2 °C for 10 days [13,30]. In these tests, four different food simulant solutions were chosen: 95% ethanol solution, 50% ethanol solution, 10% ethanol solution and 100% distilled water. Those solutions mimic different types of food products, from more lipidic (95% ethanol solution) to more hydrophilic (100% water). Square samples of 2.4 cm2 of each treatment were placed inside amber vials, and 4 mL of the simulant to be tested was added, achieving an area-to-volume ratio of 6 dm2·L–1. Periodically, in the simulant, TPC and the antioxidant activities of the compounds diffused from the films were quantified with the Folin–Ciocalteu method and DPPH assays, respectively. The migration assay was carried out in triplicate for each film and food simulant solution.

2.5. Packaging of Fresh Poultry Meat

Fresh poultry meat was acquired at a local market and was ground. Portions of 30 g were wrapped in the previously made films (5 × 18 cm2). Unwrapped meat acted as the control and the experiment was carried out in triplicate. The poultry meat samples were stocked inside plastic boxes with a screw cap and placed under refrigeration (4 ± 2 °C) for 13 days. Each set was indiscriminately collected and characterized at 0, 3, 6, 9 and 13 days of storage. Even though the normal shelf life of fresh poultry meat stored under refrigeration is less than 7 days, in this work, we chose to evaluate the samples until the 13th day of storage to verify the shelf life extension capacity of the active packaging.

2.6. Poultry Meat Characterization

2.6.1. Moisture Content

For moisture determination, based on the AOAC method [31], 1 g of poultry meat was weighed in a previously weighed crucible. Samples were placed in an oven at 103 ± 2 °C until constant weight. For moisture content calculation, Equation (2) was applied, where P1 represents the weight of the crucible + meat before oven, P2 the weight of crucible + meat after oven and PF the weight of the crucible alone.
M o i s t u r e   % = P 1 P 2 P 1 P F × 100

2.6.2. pH and Titratable Acidity

The pH analysis is based on the determination of hydrogen ion activity. The methodology was performed according to the AOAC [31], where 5 g of poultry meat was weighted and 50 mL of deionized water at 40 °C added. The mixture was agitated for 15 min. After filtration using qualitative filter paper, pH was determined in the solution with a pH digital meter (CRISON micropH 2001, Barcelona, Spain), previously calibrated with pH 4 and pH 7 buffer solutions.
For titratable acidity analysis, based on the AOAC method [31], the previously filtrated extract from the pH analysis was used. The titratable total acidity was determined with a titration using a standardize solution of NaOH 0.1 N. The results are expressed in g of oleic acid equivalent per 100 g of poultry meat. For this calculation, Equation (3) was used, where V corresponds to the NaOH volume and M to the poultry meat mass:
T i t r a t a b l e   a c i d i t y   ( g   o l e i c   a c i d   e q u i v a l e n t   p e r   100   g   p o u l t r y   m e a t )   = V × 0.1 × 28.2 M

2.6.3. Lipid Oxidation

To monitor the lipid oxidation of the samples, the thiobarbituric acid reactive substances (TBARS) method was used [32]. The samples were homogenized with 7.5% trichloroacetic acid and then filtered through a Whatman No.1 filter paper. The filtrate was combined with 5 mL of TBA (thiobarbituric acid) 0.02 M and heated (95 °C/30 min) in a water bath (Memmert, Schwabach, Germany). After cooling, the absorbance of the samples was measured at 530 nm in a UV/VIS spectrophotometer (Spekol 1500, Analytikjena, Germany). A calibration curve was constructed with solutions of 1,1,3,3-tetraethoxypropane (TEP) with different concentrations, to quantify the malonaldehyde (MDA) [31]. To calculate the TBARS Index, results were expressed as mg of MDA/kg of meat, and Equation (4) was used, where C corresponds to the value of MDA obtained from the calibration curve upon the application of the absorbance readings (μmol), M is the poultry meat mass in g, H is the moisture content (g/g poultry meat) and V is the volume of filtered extract, added to TBA:
T B A R S   I n d e x   m g   M D A K g   s a m p l e = 72.06 × C × 30 + M × H M × V

2.6.4. Total Volatile Basic Nitrogen

Total volatile basic nitrogen (TVB-N) determinations were based on the Malle and Poumeyrol method [33]. To extract the TVB-N, the same extract obtained for the determination of TBARS was used. After the filtration process, a certain volume of filtered sample was neutralized with NaOH 6 N. Afterwards, the sample was distilled to a 2% boric acid solution containing an indicator. The distillate solution was titrated with hydrochloric acid (HCl 0.02 N). Calculation was made using Equation (5) and results were expressed as grams of nitrogen per 100 g of poultry meat.
V o l a t i l e   B a s i c   N i t r o g e n   g   N 100   g   m e a t = V T × 0.02 × 1.401 m × 100 V E
where VT corresponds to the HCl solution volume (mL) used, m to the mass of poultry meat and VE to the volume of extract used.

2.6.5. Color

Color measurements of the poultry meat samples were determined with CIE-L*a*b* coordinates, using a colorimeter CR410 (Minolta Co., Tokyo, Japan) with a D65 light source and a visual angle of 10°. The coordinate L* corresponds to the luminosity, going from 0 (black) to 100 (white); a* corresponds to the chromaticity of green, going from green to red, and b* the chromaticity of blue, going from blue to yellow. Samples were placed in a Petri plaque and measured three times to evaluate the Hue angle (Equations (6) and (7)) [16] and color variation (Equation (8)) [28]:
H u e   a n g l e = arctan b * a *   ( i f   a *   >   0 )    o r
H u e   a n g l e = arctan b * a * + 180 °   ( i f   a *   <   0 )
Δ E = L 0 L * 2 + a 0 a * 2 + b 0 b * 2
where L0*, a0* and b0* are the coordinates measured at the beginning of the essay, while L*, a* and b* are the coordinates measured at each sampling day.

2.6.6. Microbiological Analysis

The assessment of the microbiological growth in the poultry meat was made using three parameters: total aerobic mesophilic microorganisms (TAMM) [34], total aerobic psychotropic microorganisms (TAPM) [35] and Enterobacteriaceae [36]. During the analysis, all the procedures were carried out in a laminar flow chamber (Steril-Helios, Angelantoni Life Science Srl., Massa Martana, Italy) to prevent possible contaminations. Appropriate dilutions were made for each meat sample and applied to Petri dishes (1 mL) with a suitable medium. Plate Count Agar (PCA) was used to test the first two types of microorganism, while Violet Red Bile Glucose (VRBG) agar was used for Enterobacteriaceae. The seeded Petri dishes were incubated at 30 °C for 72 h (TAMM), 7 °C for 168 h (TAPM) and 37 °C for 24 h (Enterobacteriaceae). The results are expressed as log CFU (colony forming units)/g poultry meat.

3. Results and Discussion

3.1. Essential Oils Characterization

3.1.1. Chemical Characterization by GC-MS

The GC-MS analysis of the EOs allowed the identification of 38 compounds for A. citrodora and 28 compounds for C. citratus, accounting for 88.0% and 97.7% of the total oils, respectively. The major constituent in both oils was geranial, with a percentage of 21.2% for A. citrodora and 36.3% for C. citratus, followed by neral, with percentages of 16.5% and 26.1%, respectively. The third major constituent of these oils was different, being limonene, at 9.9% for A. citrodora and β-myrcene at 17.1% for C. citratus. The complete chemical composition of the oils is presented in Table S1 (Supplementary Materials). Results obtained from those two essential oils produced in Portugal are in agreement with data presented by other studies, which also show that the main components in those EOs are geranial and neral, and that C. citratus is richer in those two compounds than A. citrodora [37,38,39]

3.1.2. Total Phenolic Content and Antioxidant Activity

Table 1 presents the total phenolic content and the antioxidant activity of both EOs, dissolved in an array of ethanolic/water solutions.
Both EOs presented an increment in total phenolic content from the water (H2O) to the more ethanolic solution (ethanol 95%) (Table 1), being always higher in ACEO. The high levels of turbidity for the ACEO with ethanol 95% medium restrained the determination up to ethanol solvent at 50%. These results might indicate that, in more alcoholic solutions (with less polarity), there is a higher concentration of phenolics. This would be in agreement with the literature, since increasing the water content in a solvent causes a decrease in the total phenolic content [40]. As reported in Table 1, both ACEO and CCEO presented high percentages of radical scavenging, with CCEO presenting higher values than ACEO. No differences were observed in the antioxidant activity with the different ethanol/water solutions used for preparing the solutions. The antioxidant activity was correlated with the stabilization of free radical and reactive oxygen species [16].
The presence of three main components in CCEO—geranial, neral and myrcene—contributes to the antibacterial properties associated with this EO [41]. Geranial and neral individually elicit antibacterial action on Gram-negative and Gram-positive organisms, while myrcene does not show observable antibacterial activity on its own. However, myrcene showed enhanced bioactivity when it was mixed with either geranial or neral or both [42,43]. The presence of geranial and neral in ACEO may also add antibacterial properties to this EO, which still need to be evaluated. The antioxidant activity of CCEO is due to the synergistic effect of all its constituents [44]. However, other studies have indicated that geranial and neral show antioxidant activity as well, which is a result of co-oxidation with the target substrate and cross-termination of the oxidative chain [45]. The presence of higher amounts of geranial and neral in CCEO may explain why this EO presented a higher radical scavenging activity then ACEO.

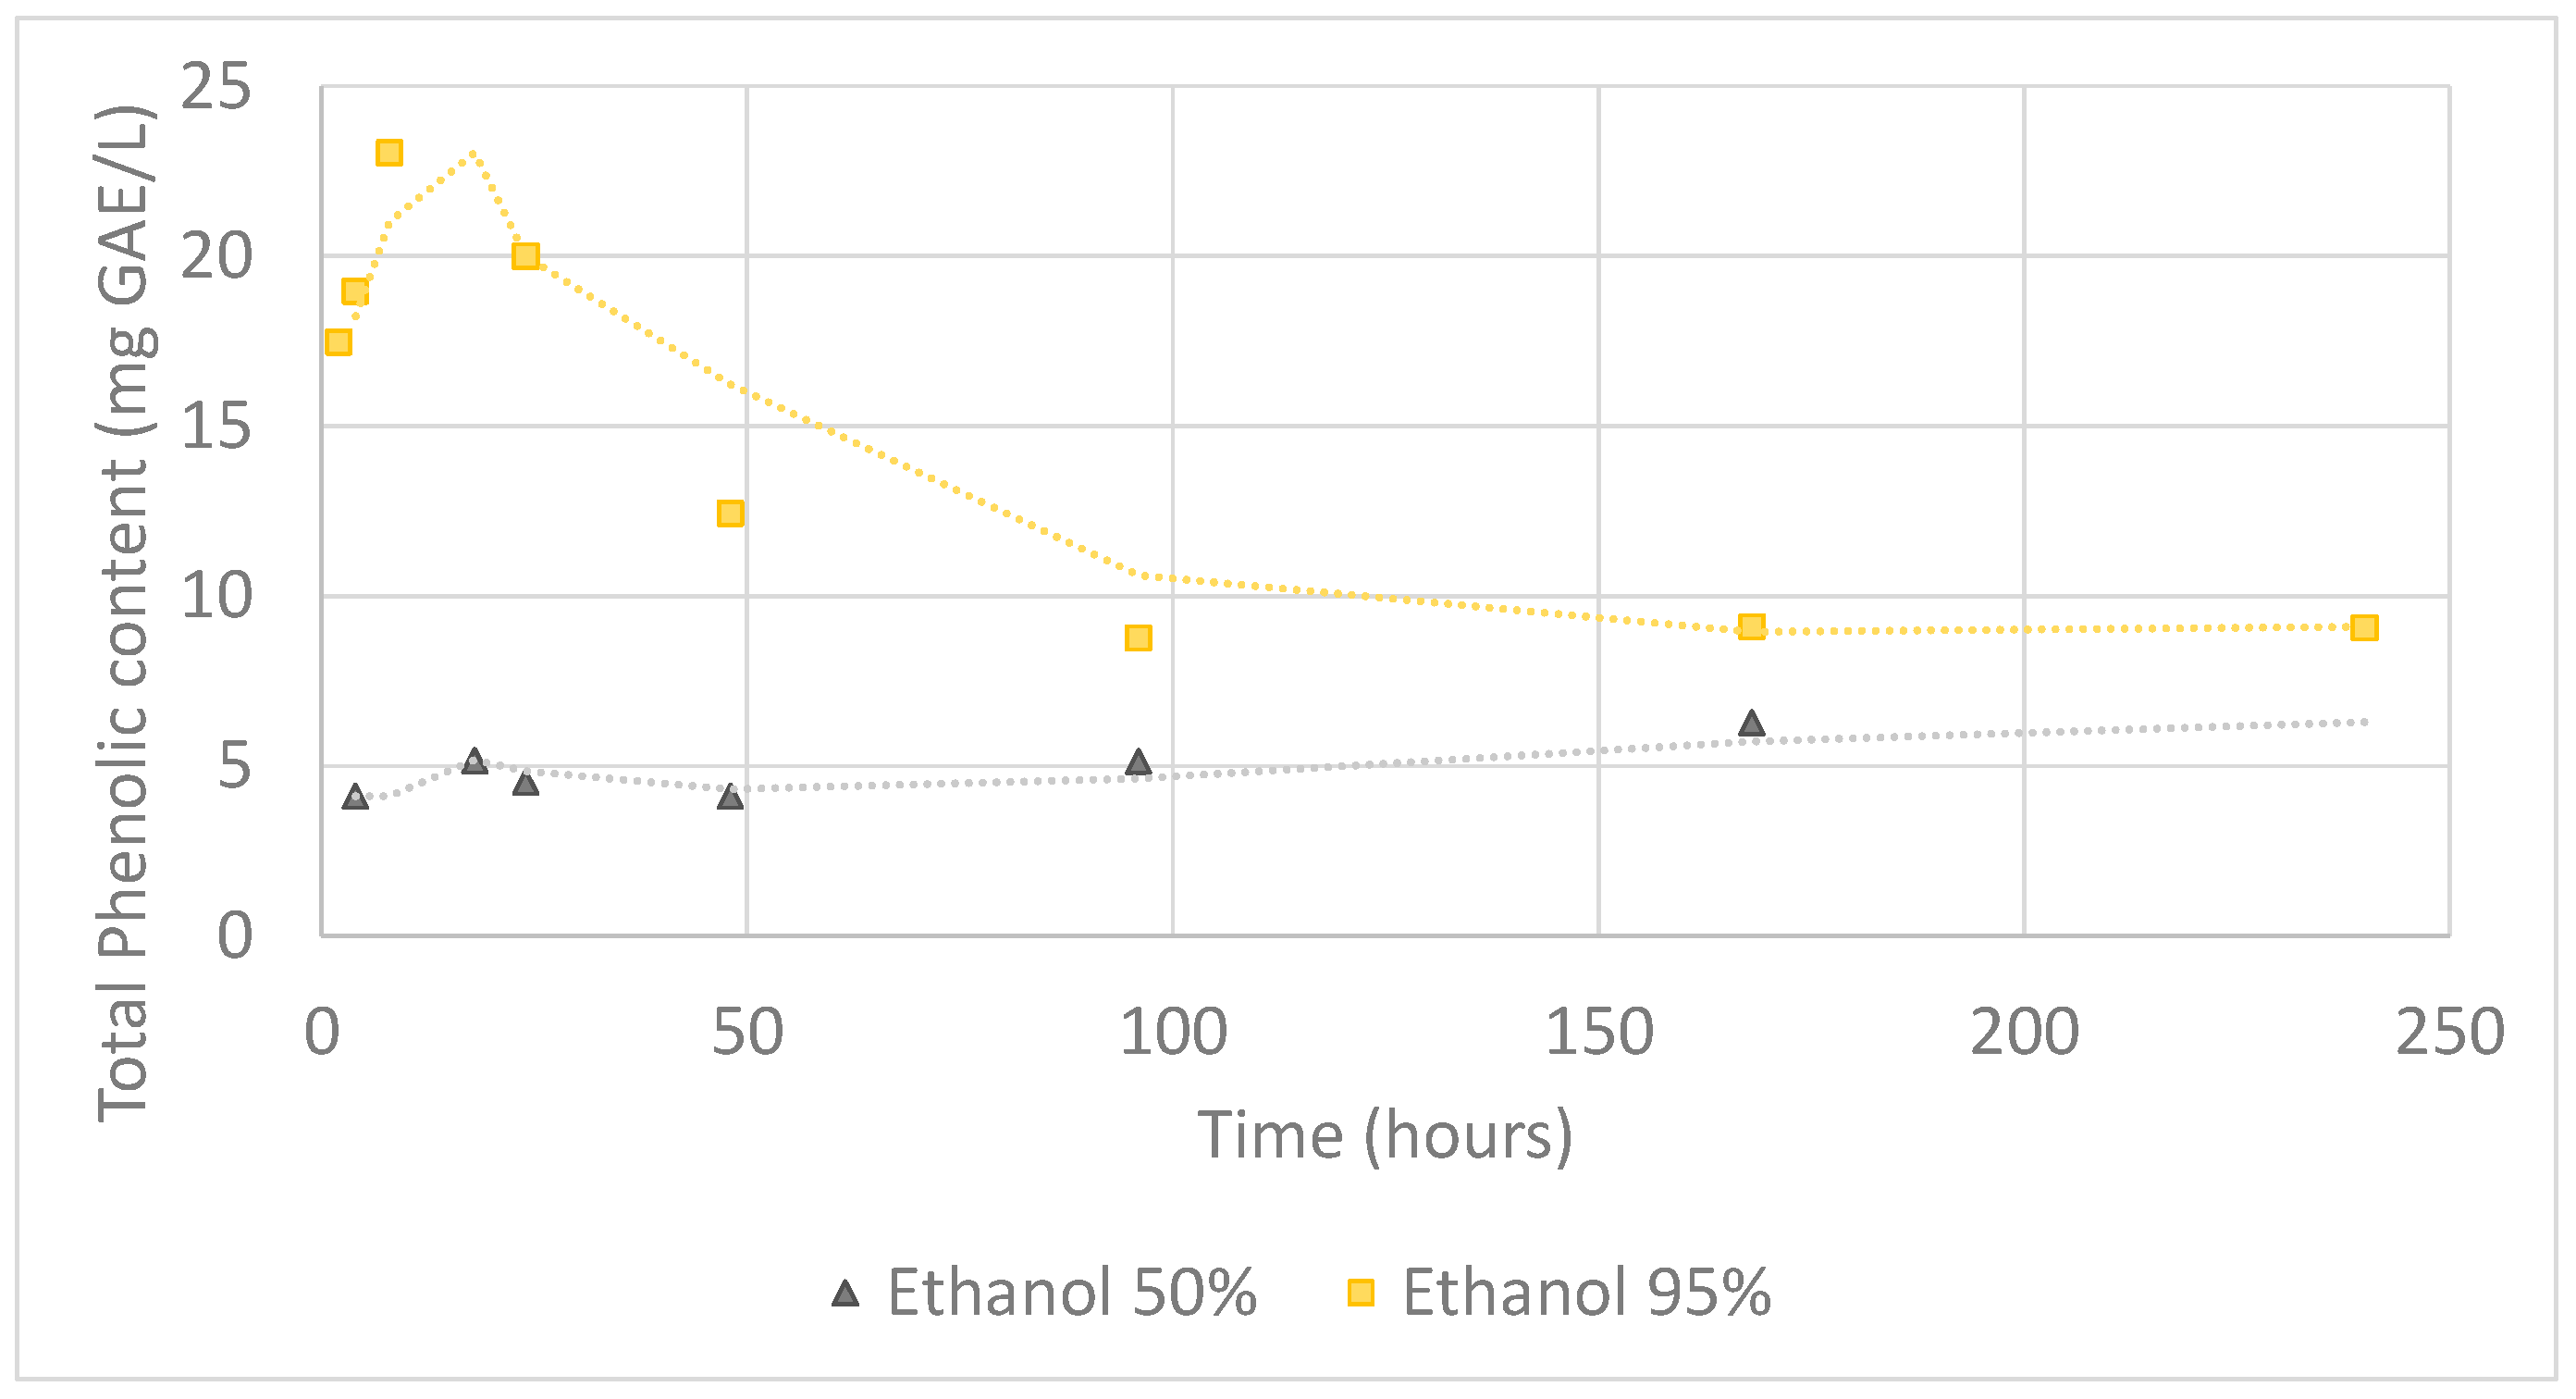
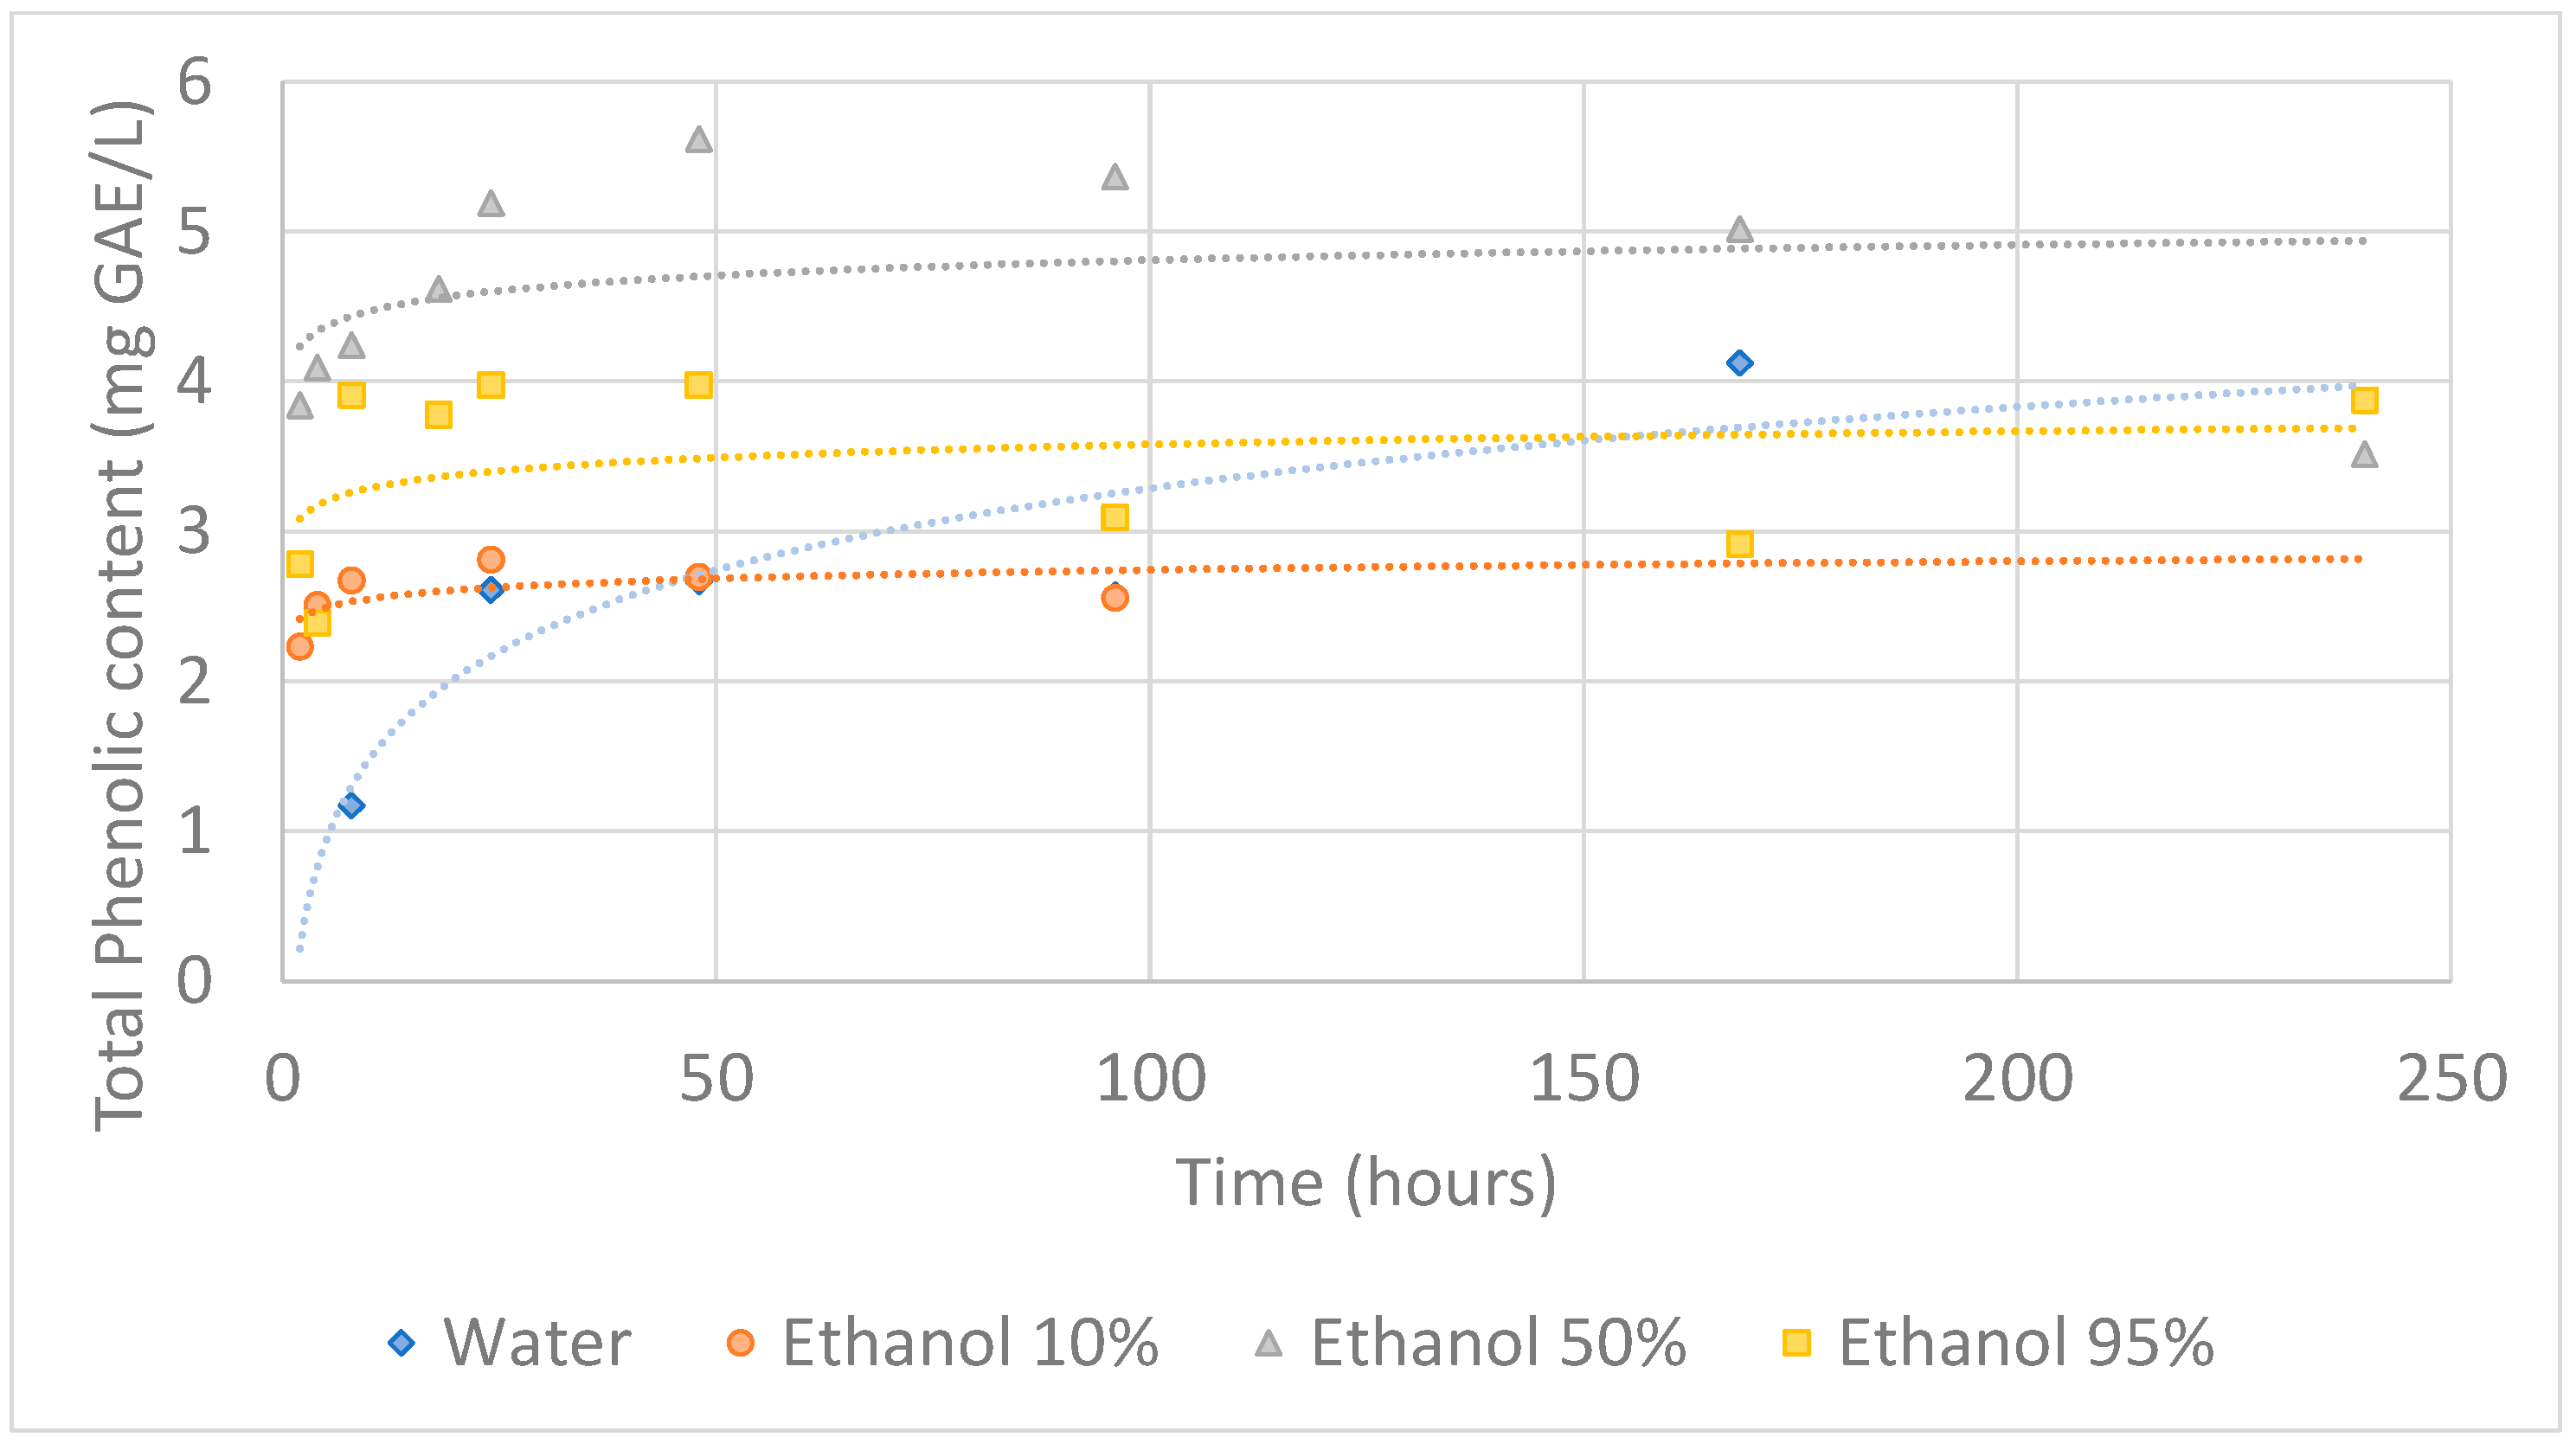
3.2. Migration Assay

Migration assays from coatings/packaging to food should follow well-established procedures that allow users to identify if there is a significant migration to food of a toxic compound or if the active compounds of the packaging/coating are migrating to the food. In this work, four different ethanolic/water solutions were tested, each of them representing a food simulant: water (for water-based products); 10% (v/v) ethanol in water (for alcoholic products); 50% (v/v) ethanol in water (for dairy products); and 95% (v/v) ethanol in water (for fatty products) [46,47]. For the migration assay, the total phenolic content and antioxidant activity were analyzed in the different food simulants over time.

3.2.1. Total Phenolic Content

With the TPC of the migration assay, it was possible to identify the quantity of phenolic content that migrates from the film to the medium (Figure 1 and Figure 2).
Results presented some irregularities, due to chitosan’s low water resistance and hydrophilic nature [28]. It was more difficult for ACEO films to migrate in aqueous and ethanol 10% mediums without the film being dissolved in the medium (which inhibited the determination of TPC due to turbidity of the samples); however, they presented very significant levels of phenolic migration for ethanol 50% (from around 4 to 9 mg GAE/L), in a slow grade of migration, but even higher for ethanol 95% (from 8 to 23 mg GAE/L), with high phenolic liberation in the first 8 h. It can be observed a higher affinity to the solutions with high content in ethanol. CCEO films presented a more consistent migration throughout the mediums, even in water and ethanol 10%, with low degradation of the film. The films with this oil showed a slow and consistent migration of phenolic compounds throughout the experiment. In this case, after an initial higher rate of migration, the amount of phenolic compounds in the simulant media remained constant over time. These results suggest that CCEO was well entrapped in the chitosan matrix with NC, although with a steady and constant migration of its phenolic content to the different simulants. CCEO presents a high content in oxygenated monoterpenes (81%) and a lower content in sesquiterpenes (3.7%) and monoterpene hydrocarbons (10%) [38]. Therefore, the oxygenated character of its composition may contribute to the formation of bonds with chitosan (hydrophilic character) and NC, reducing its release to the simulants. This entrapment also restrains the dissolution of chitosan in the more hydrophilic simulants (water and 10% ethanol). Contrary to this, ACEO presents a lower content in oxygenated monoterpenes (60–69%) and a higher content in sesquiterpenes (16–24%) and monoterpene hydrocarbons (15–17%) [37]. The composition of this EO, which is more lipophilic, and with compounds that occupy a higher volume in the chitosan matrix (sesquiterpenes), suggests higher free volume in the polymeric matrix and lower affinity to the chitosan/NC, and thus higher relaxation of the matrix and higher release of active compounds, which explains the higher release of TPC to the 95% ethanol simulant, compared with CCEO. The composition of ACEO also explains why the chitosan polymer was easily dissolved in the water and 10% ethanol simulants, once the ACEO was not trapped in the polymeric matrix. Both films reached equilibrium during the first 48 h of assay, as previously reported in the literature [13,46]. These results indicate that ACEO films would be more adequate for more hydrophobic and fatty foods, once chitosan–ACEO films dissolved easily in water (water-based products) and 10% (v/v) ethanol in water (alcoholic products). CCEO films can be applied to different types of food, from water-based products, alcoholic products, dairy products, fatty products, indicating that the interaction between CCEO and chitosan remained the same whether the simulants were more hydrophilic (water) or less hydrophilic (95% ethanol). Little or no dissolution of the films was observed in the different simulants. The interaction between the EOs and the chitosan polymer is important. The type of interaction will contribute to a higher migration rate of the active substances to the simulant/food or a lower rate of migration. The existing interaction may play different roles against food oxidation: the migration of compounds with antioxidant properties will enhance the protective action against food oxidation; however, the barrier properties provided by the film containing the EO may also delay the contact of the food with water, oxygen and light, acting also as a shield to protect the product [48]. Comparing both EOs, the release of phenolic compounds to the simulants is higher in ACEO films, which follows a correlation with the higher amount of total phenolic content presented by ACEO compared to CCEO (Table 1). The same was also observed in the study reported by Souza et al. [13].

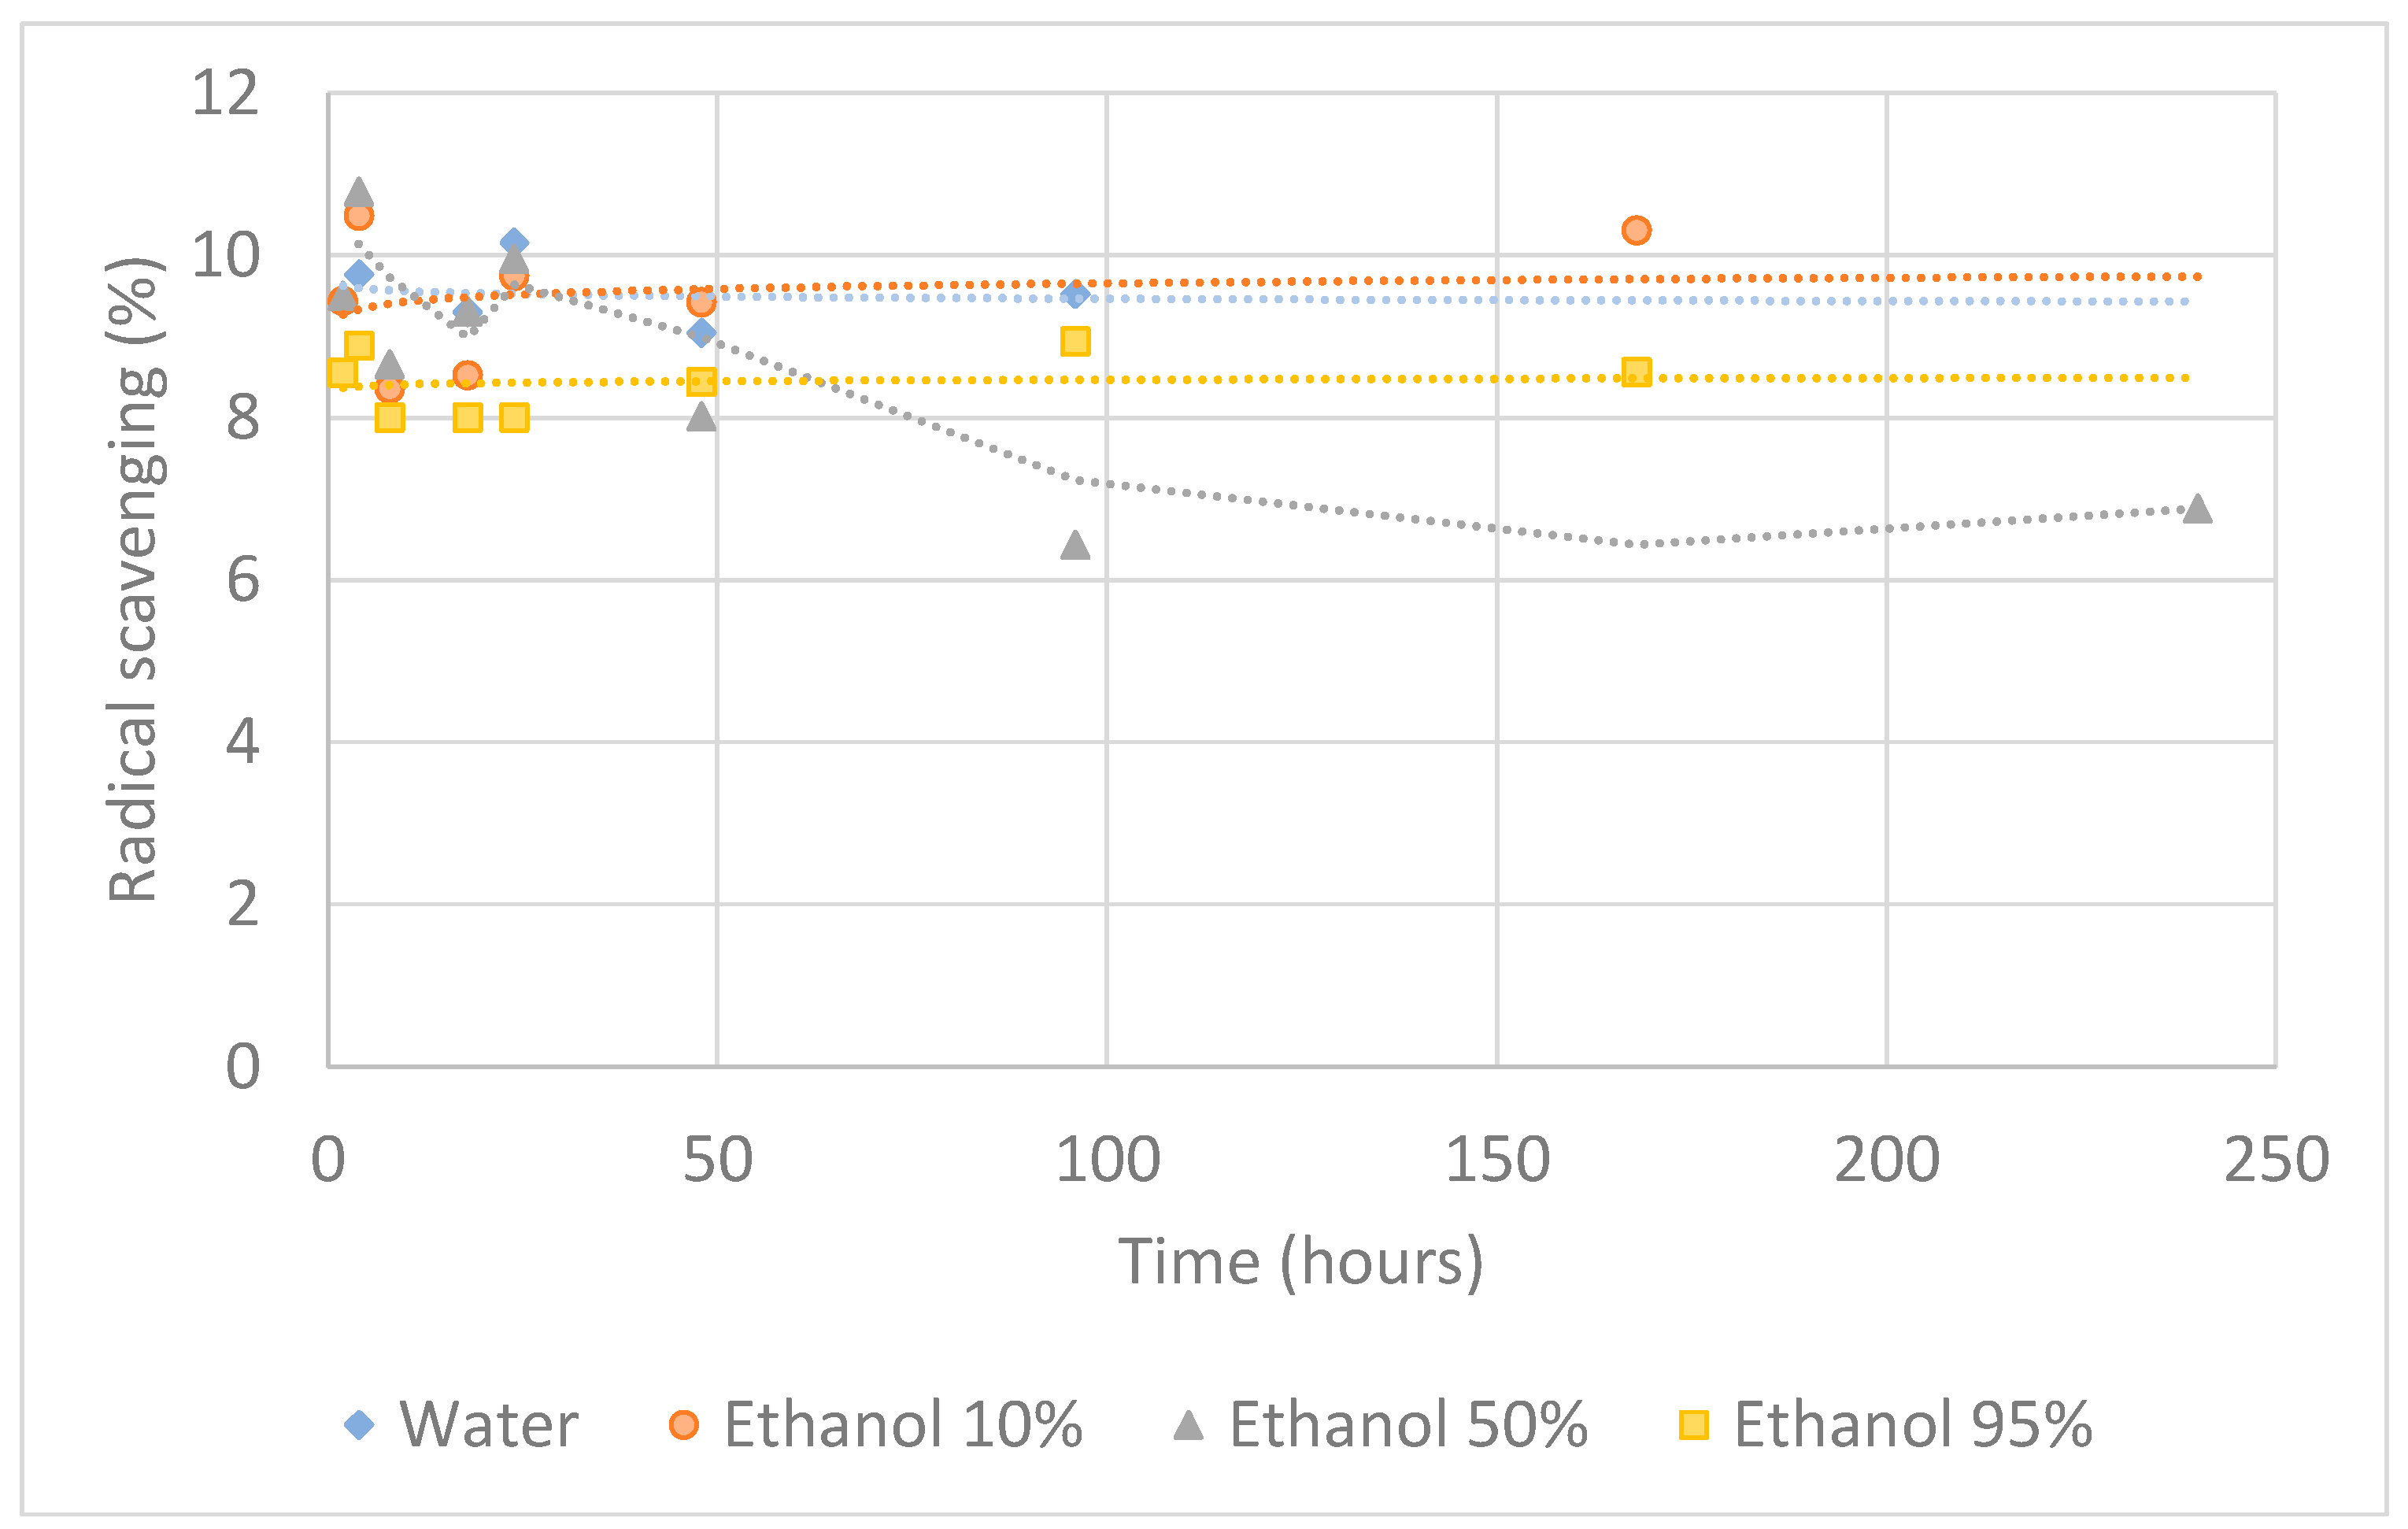
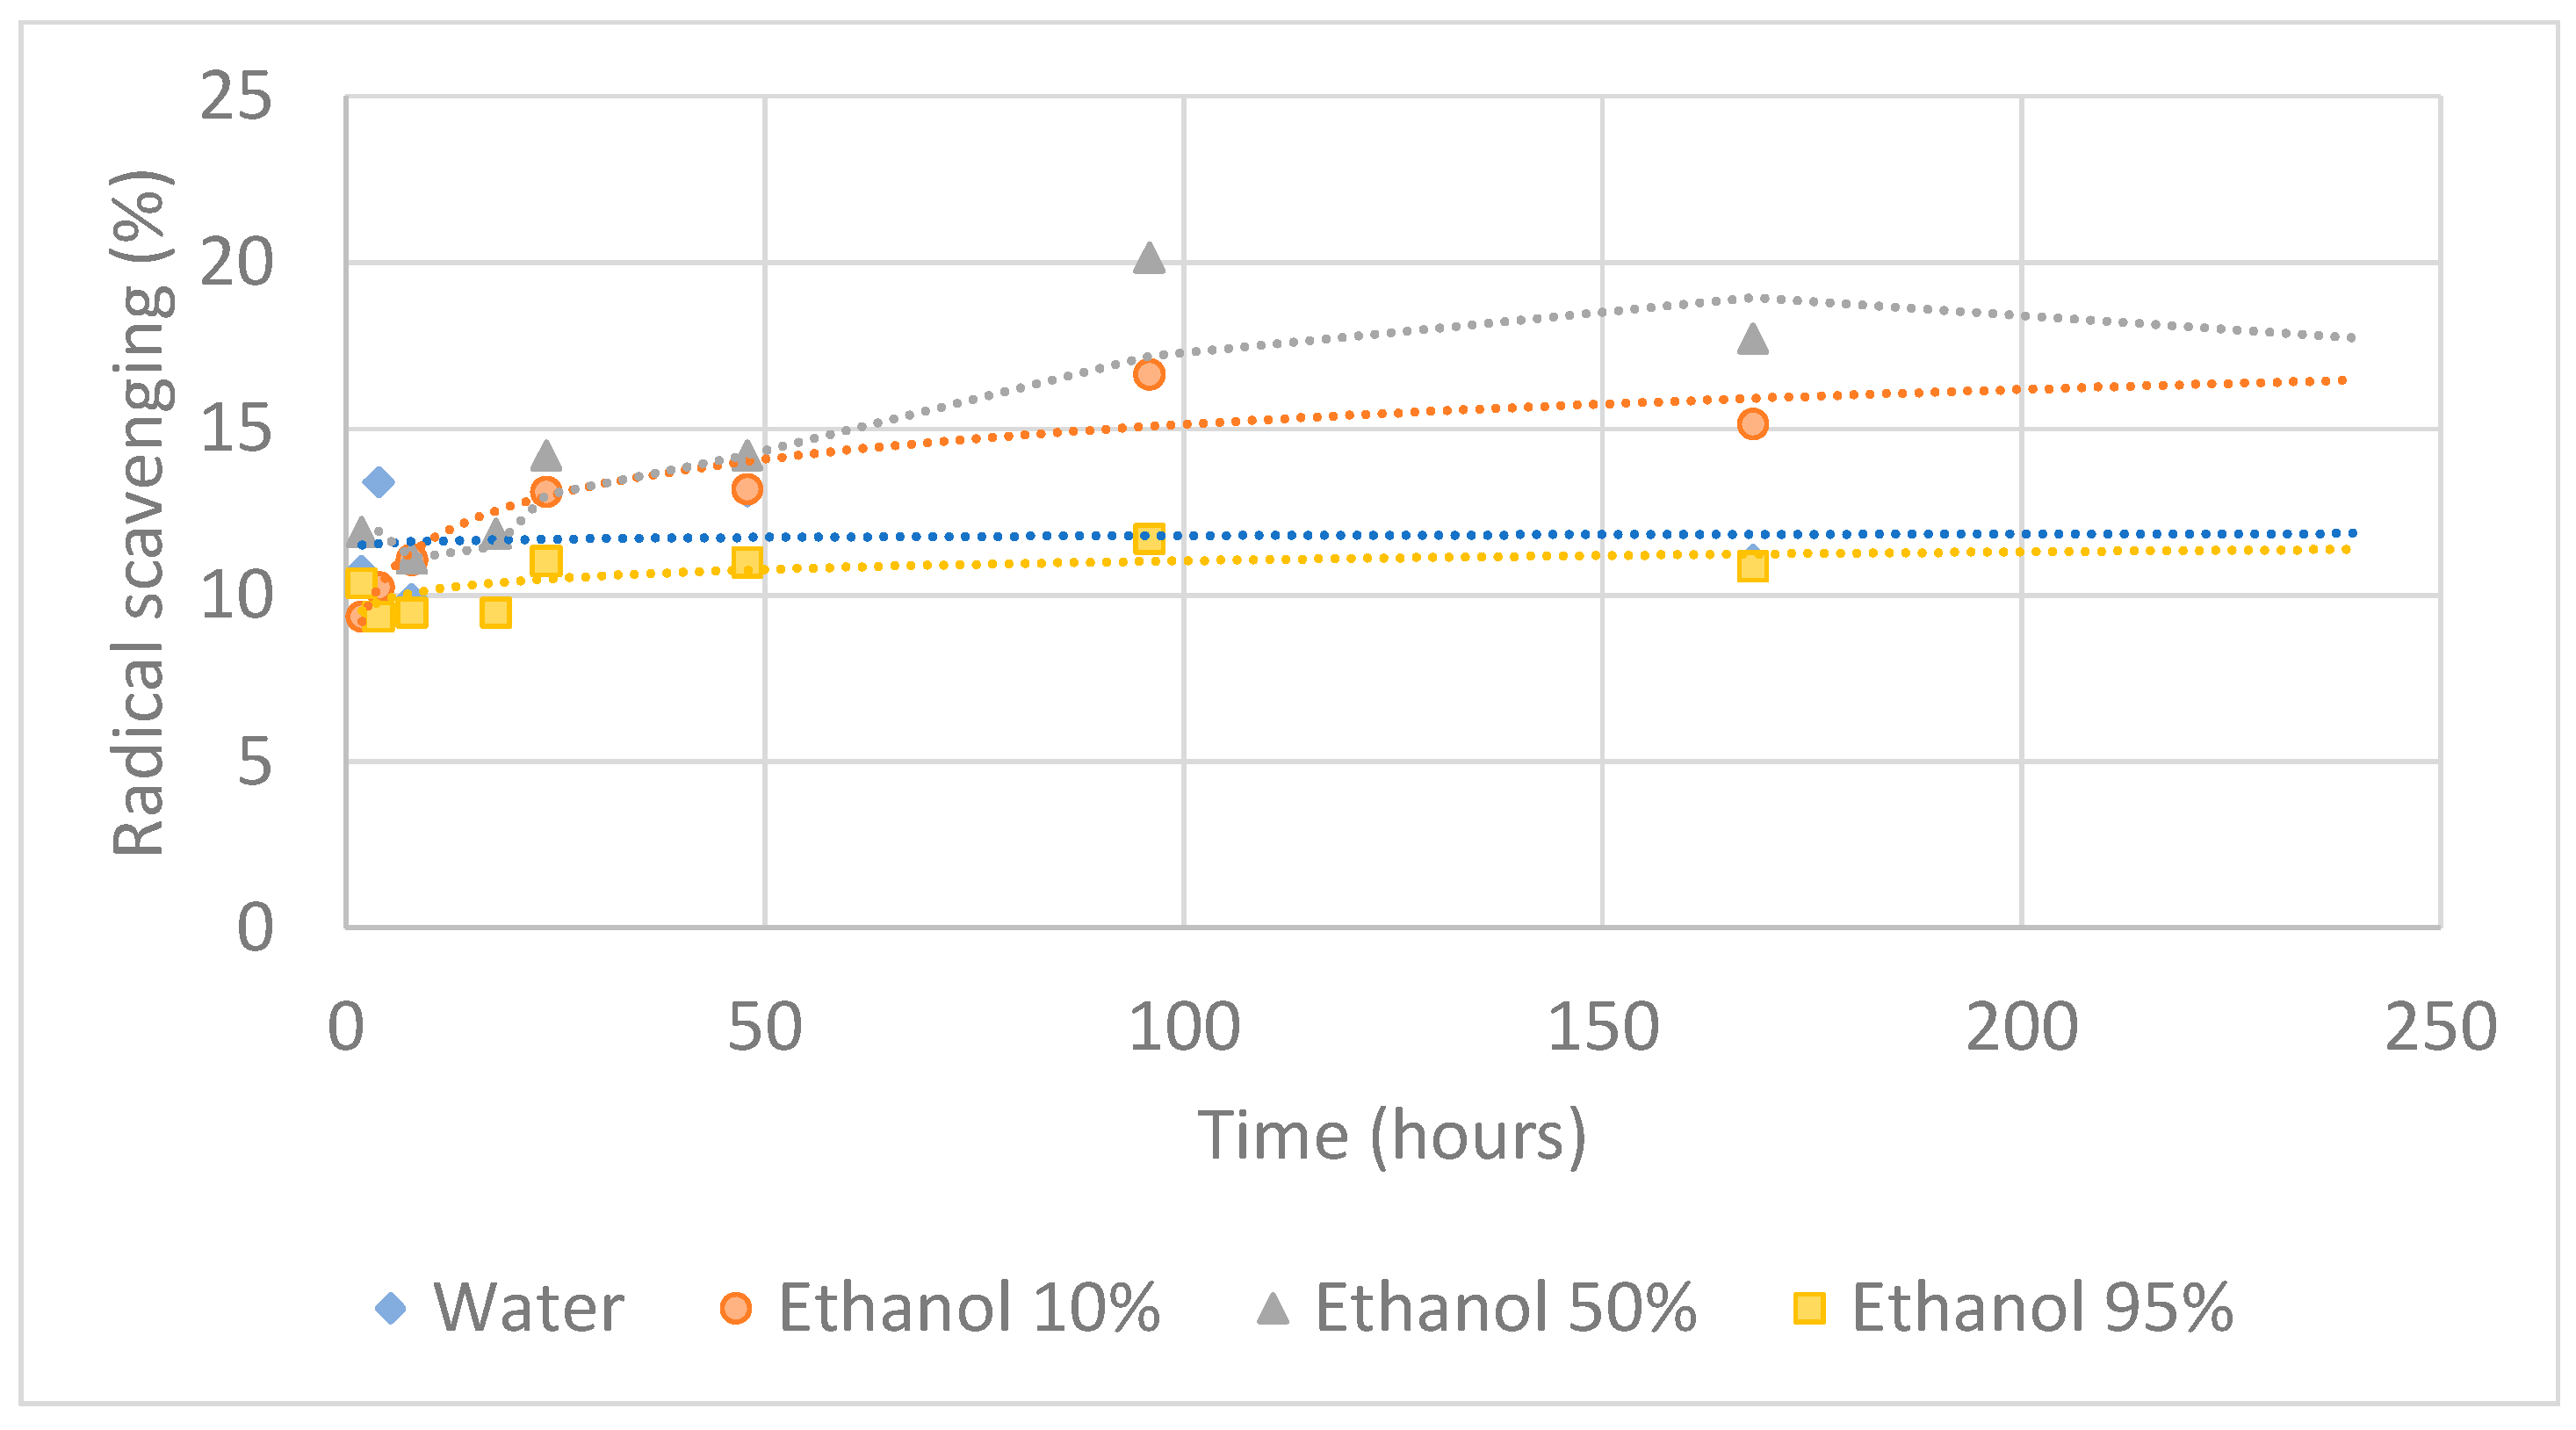
3.2.2. Antioxidant Activity

The antioxidant activity study of the migration assay allows us to identify the capacity of the migrated compounds to the medium to inhibit the oxidation procedure. Results showed values below 20% radical scavenging in all the sample trials.
The CCEO film (Figure 3) presented around 8–10% percentage of inhibition over time in all the simulant mediums, with the exception of the ethanol 50%, which showed a decrease in the radical scavenging results over time. In this case, it seems that the amount of compounds with antioxidant activity that migrated to the simulant media either decreased over time or reacted, loosing the capacity to scavenge DPPH. It may also indicate that compounds with antioxidant activity remained trapped in the polymeric matrix, not being released to the simulant media. The composition of CCEO, rich in oxygenated monoterpenes, may explain the entrapment in the polymeric matrix as discussed in Section 3.2.1. Higher antioxidant activity in the simulant media was observed in the first 8 h of the migration assay, with ethanol 50% having the highest maximum activity, at 8 h, followed by ethanol 10%. These results indicate that the active compounds migrated at a fast rate from the films to all simulant media. The highest activity observed in the ethanol 50% media indicates that most of the active compounds incorporated in the films were released to the media in the first 8 h. This also may explain why, over time, the antioxidant activity in this simulant decreased; perhaps because the amount of antioxidant compounds released by the film was reduced after 8 h. When designing an active packaging, the migration of active compounds should occur gradually during the shelf life of the product packaged [10]. Additionally, this was observed for all the simulant media with the CCEO film, except with the ethanol 50% simulant, where most of the active compounds migrated to the media in the first 8 h. In this case, the lack of stability of phenolic compounds might affect their final concentration after release studies, in the polymer and in the simulant, which explains the decrease in the antioxidant activity observed for the ethanol 50% simulant. This justification was presented in some works that also showed a decrease in the antioxidant activity over time, measured in simulants [10]. In the other simulants, the amount of active compounds was released gradually, and therefore the degradation rate of the compounds being released was counterbalanced by the constant release of active compounds, which helped to maintain constant the antioxidant capacity identified in those simulants.
The results for ACEO biobased films (Figure 4) presented a higher radical scavenging capacity, going from 9 to values up to 20%. Migration results showed that the highest percentage of radical scavenging occurred later for the ethanol 10% and 50%, with the maximum being around 96 h, showing an increased liberation of compounds with antioxidant activity compared to the CCEO. For water and 95% ethanol, the release of compounds with antioxidant activity started already at the beginning of the essay, and was steady throughout the study. The fact that this trend was observed for the ACEO biobased films indicates that the release was gradual, which helped to maintain and increase the antioxidant activity observed in the different simulant media, particularly in the ethanolic solutions. This characteristic is important to increase the shelf life of products. A higher affinity of the CCEO to the polymeric matrix compared with the affinity of ACEO, given the composition of both oils (as discussed previously in Section 3.2.1) may explain the higher antioxidant activity observed in the simulants obtained after the migration of ACEO from chitosan films.
The antioxidant activity present in the simulants due to the release of EO from the biobased films may be attributed to the release of the phenolic compounds and terpenoids that demonstrate their antioxidant properties according to different mechanisms, such as hydrogen donation, free radical scavenging activity, among others [48].

3.3. Contact Assay

3.3.1. Moisture Content

The moisture present in food can influence both the sensorial quality and the stability of the product, since the deterioration process can correlate with the content of water [49]. The results (Table 2) show that the unwrapped meat (without biofilm) presented an increase of up to 3% in moisture content during the 13 days of storage. Interestingly, all the meat wrapped in biofilms presented a decrease in the moisture because chitosan has hydrophilic properties; it is possible that the film absorbed some of the meat water, explaining the decrease [50]. Comparing the biofilm of chitosan with Eos, it was observed that the ACEO film presented a similar decrease in terms of moisture, in contrast to CCEO film, which presented a lower decrease in terms of moisture, having values after the 13th day between those of the unwrapped sample and samples wrapped with chitosan biofilm and the biofilm with ACEO. The behavior of CCEO can be explained by the higher degree of hydrophobicity given to the chitosan film, that reduced its water absorption, but that should be confirmed with physical tests on the biofilms, such as swelling and water permeability [48].
Previous studies have reported that biofilm water absorption can increase with the thickness of the meat, which can alter the experience of the consumer in terms of taste and texture; however, the reduction in water content is helpful to delay microbial growth [29].

3.3.2. pH and Titratable Acidity

The pH value regulates the reactions that follow the food production and deterioration process; therefore, it is relevant to keep track of this value to maintain a safe and well-preserved product. The muscle pH after the animal is slaughtered and converted into meat can drop from around 7.2 to values of around 5, since the glycogen is converted to lactic acid. pH values normally range from 5 to 7, being in between 5.7 and 6 for higher quality products [28,51].
The initial pH value for the sample meat was 5.95, achieving a 7.51 pH at the 13th day wrapped (Table 3). The deterioration of the meat increased the pH, as expected. The increase in pH values may be attributed to the growth of microorganisms that produce volatile basic components [13]. Different results were presented by the wrapped meat, which maintained values similar to the initial day, while the CCEO-wrapped sample produced more stable results.
A previous study by Rezaeifar et al. 2020 [22] reported using 1% ACEO in edible coatings for trout and observed pH values similar to the control chitosan, although slightly more acidic, as our results also show. However, in this study, the application of ACEO also slightly reduced the pH of the meat, which was attributed to the migration of the oil to the meat. As to coatings with 0.2% sodium alginate and 0.5% ACEO in chicken breast, as presented by [52], no significant difference was reported in comparison with the chitosan control. Regarding CCEO, a previous study reported that minced meat wrapped in films with 0.5% and 1.5% CCEO presented a pH reduction of 0.17 and 0.22, respectively, compared to the chitosan control [53]. A similar reduction in pH was also observed in this study, which was attributed to the migration of the EO to the meat. Wrapping the meat in pristine chitosan also maintained the pH, although there was a small reduction in pH with the time, which can be attributed to the chelation of some free fatty acids released from the meat to the chitosan (to the amine groups). Therefore, the maintenance of the pH indicates the efficiency of the films in the extension of the shelf life of the products.
Titratable acidity measures the total acid concentration present in food. It is determined by titration of intrinsic acids with a standard base, and can be used as a complement to the pH analysis since it is a better indicator of the microbiological stability of certain foods [28,54].
The unwrapped meat presented the highest decrease in oleic acid equivalents, which is in accordance with the pH values observed, since they became less acidic (Table 3). The wrapped meat presented a smaller increase in value, which was also in accordance with the pH values.

3.3.3. Color Variation

Since one of the first things the consumer notices when searching for food is their appearance, it is important to find a package that maintains the common color of the product. In this case, the “reddish”/pink and bright color of the meat is an indicator that it is fresh, and is one of the factors that can cause the consumer to exclude other pieces if it is not present [55]. The color of the poultry meat depends on numerous factors, for instance, age, sex, genetics, diet, intramuscular fat, moisture, among others [55].
The initial Hue angle from the meat without the film was 40 and increased to 48 by the end of the 13 days (Table 4). The wrapped meat with EO films were those that presented a higher Hue angle change for a long time, to a more yellowish tone, especially ACEO. Meat with EOs also presented a higher Hue angle than the chitosan film, which maintained a similar variation with the unwrapped meat. This is contrary to what has been shown by other essential oils studies; for example, Souza et al. 2018 [29] showed the Hue angle of unwrapped meat (70°) was 15° higher than meat wrapped with ginger EO, and Pires et al. 2018 [28] showed 15° lower values for the meat wrapped with rosemary EO (69°), as well as 10° lower for ginger EO [28]. These results indicate that the Hue angle of the unwrapped meat was lower in our study than the ones reported by the literature, but also that the EO provided an increase in the Hue values; nonetheless, this color variation might be due to the natural color of the essential oil that migrated to the meat [56]. Variations in color (Table 5) of unwrapped meat increase with time, and were more pronounced with chitosan and CCEO. In this case, the changes in the color of the meat due to ACEO were less pronounced and compared with unwrapped meat at day 0.

3.3.4. Lipid Oxidation (TBARS Assays)

The TBARS assay is used to quantify the malonaldehyde (MDA) present in the sample and indicates the lipid rancidity of meat products [16]. In terms of results, in all the samples, an increase in the malonaldehyde concentration was observed, being the highest in the unwrapped meat, but also very similar to the meat wrapped with pristine chitosan at day 9 (Figure 5). Until day 9, the application of EOs to the film prevented the lipidic oxidation of the meat, at which point the lower values can be observed, both in CCEO or in ACEO. The CCEO-wrapped samples presented a slightly lower MDA concentration, with the lowest being observed in the sample wrapped with film without EOs at day 13. Rezaeifar et al. 2020 [22] studied the edible coating of trout and its chitosan control and showed that ACEO presented a good effect on the antioxidant activity of the coating, reducing the TBARS value from 2.78 to 1.67 mg MDA/Kg meat. Hosseini et al., 2021 [52] also showed effective results from the application of ACEO to the coating, due to the presence of geranial, neral and limonene as antioxidants [52]. Olorunsanya et al., 2010 [57] reported that, in various concentrations (0.5, 1 and 1.5% in films), CCEO always showed an effective improvement of the lipidic stability during storage [57]. In this study, both essential oils were effective until day 9, but at day 13, the difference with chitosan was neglectable, probably due to the oxidation of the EOs themselves.

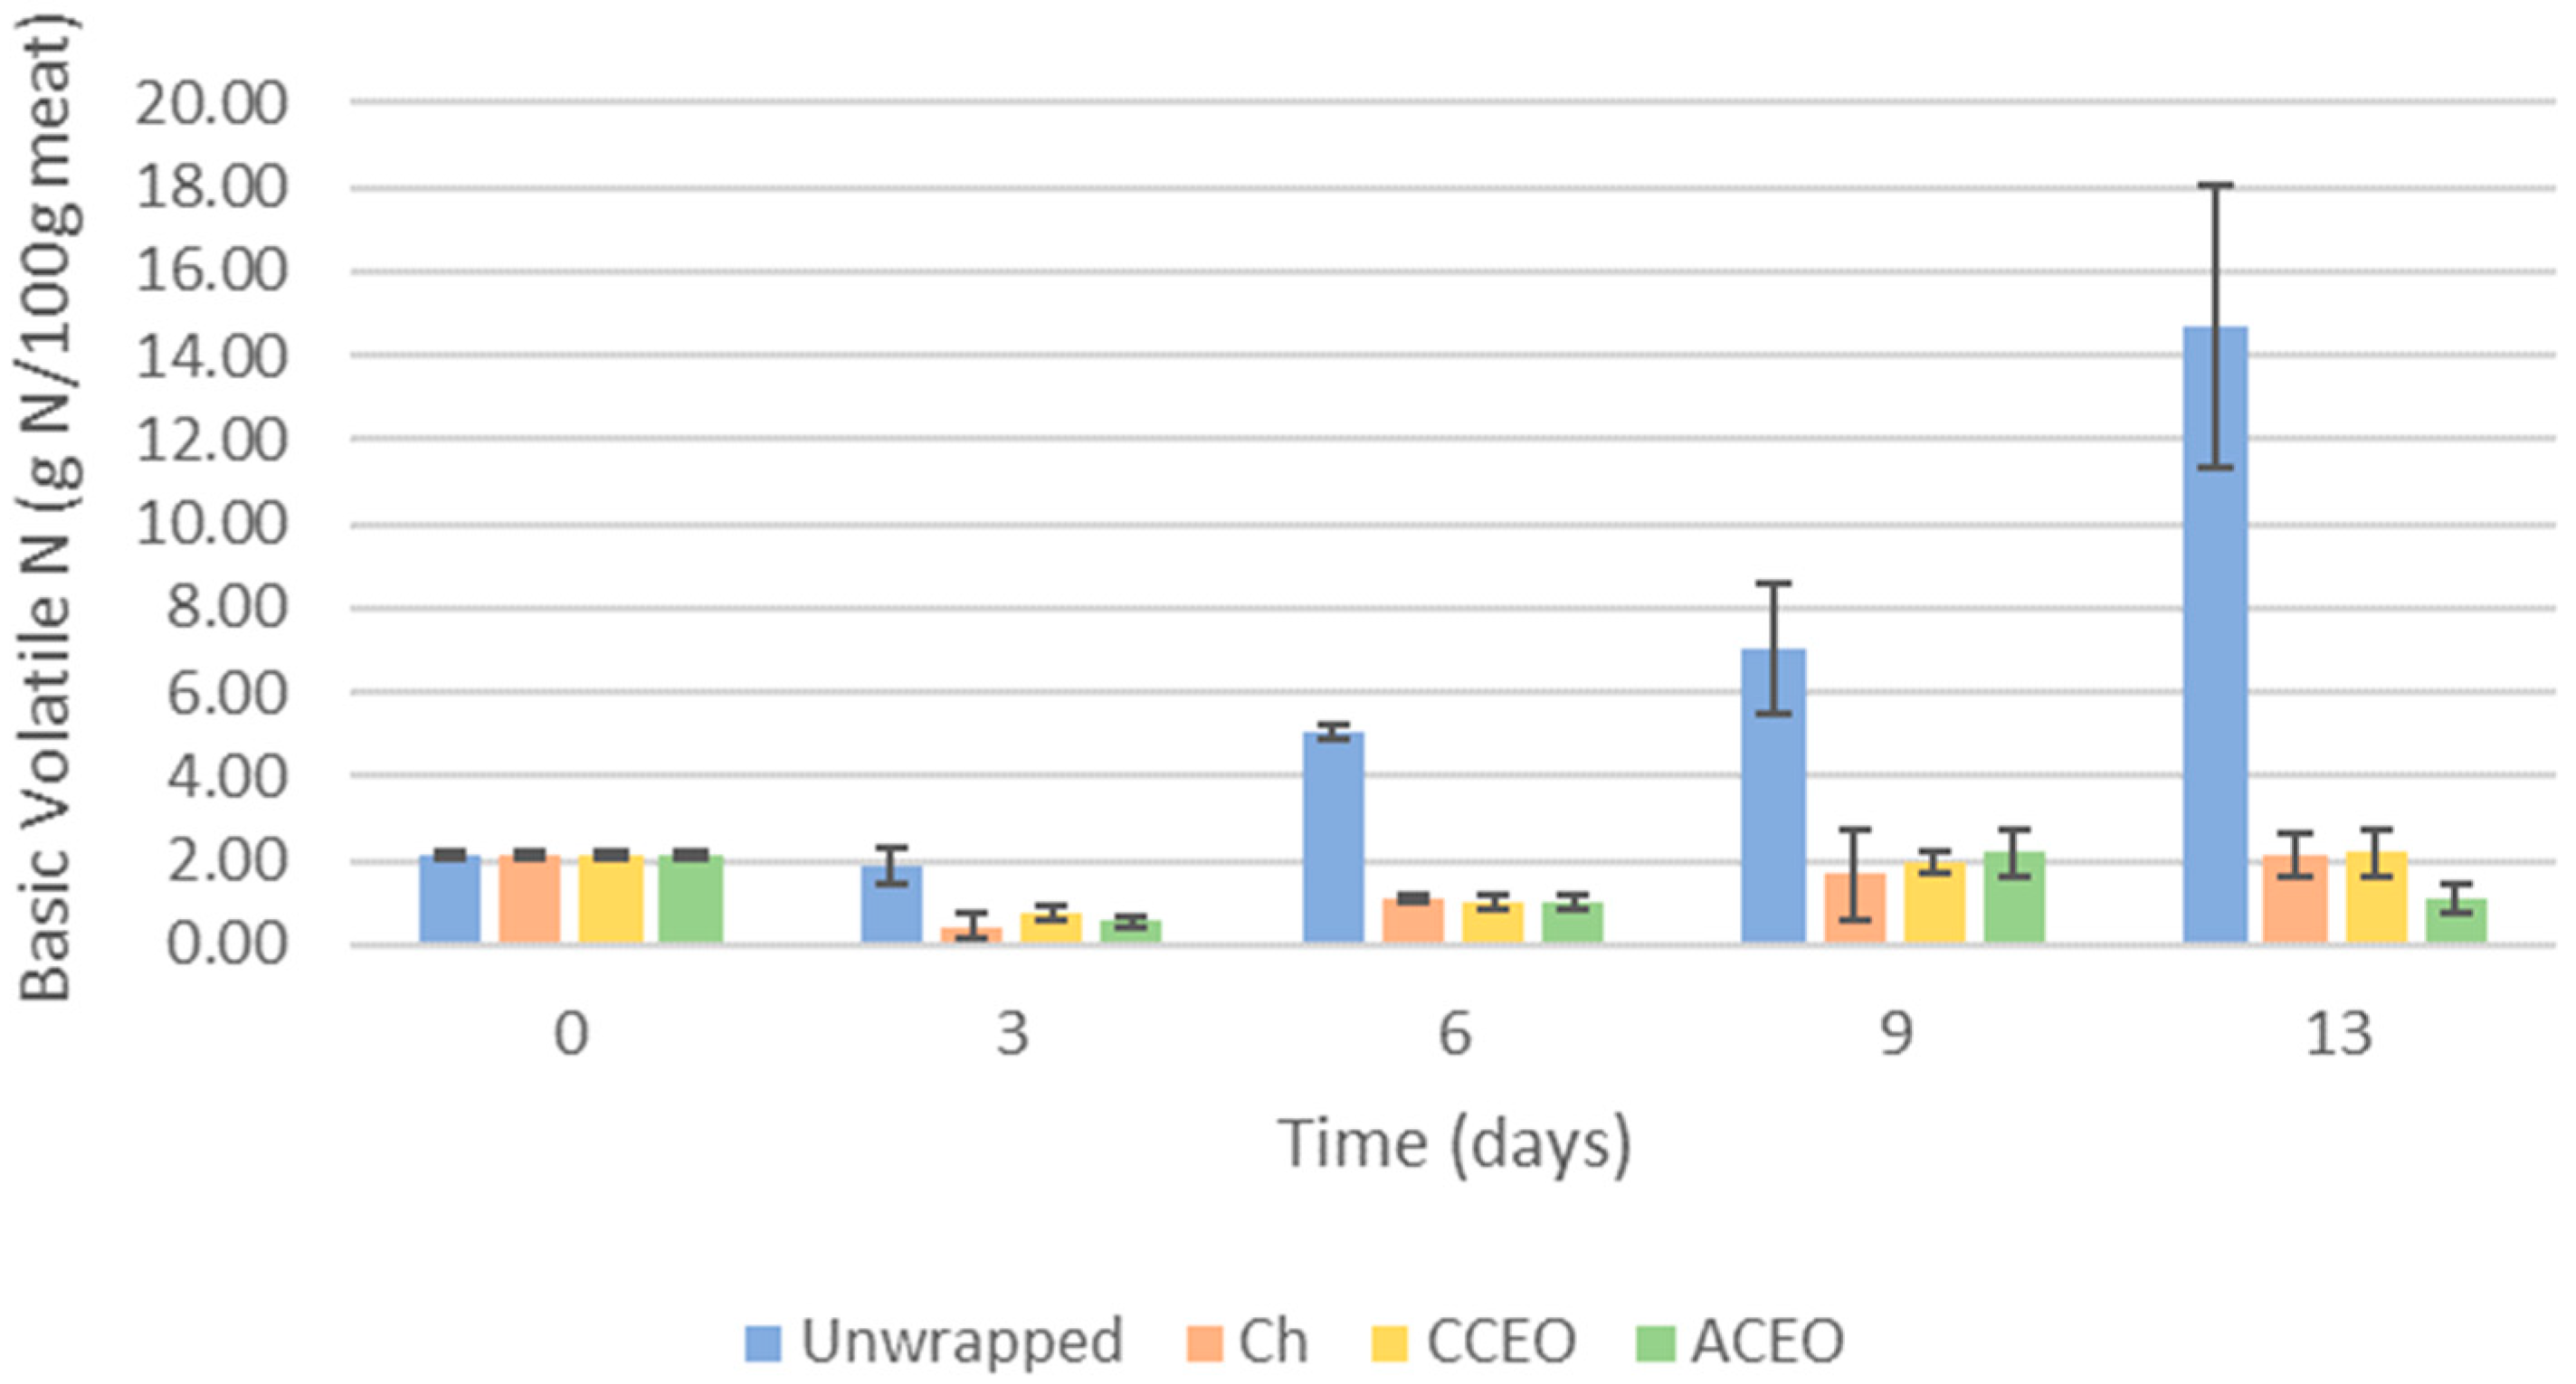
3.3.5. Basic Volatile Nitrogen

One of the ways to identify the stage of degradation of a product is by their spoilage mechanisms, one of which is the degradation of proteins and other compounds that produce nitrogen. This mechanism causes the accumulation of organic amines that can be identified by the total volatile basic nitrogen. Basic volatile nitrogen will not only cause changes in color and flavor, but can also be toxic in elevated quantities, affecting the safety of the product [58].
The unwrapped meat presented the highest increase in BVN, which went from 2.1 to 14.7 g of N per 100 g of meat (Figure 6). Contrary to this, all the wrapped meat presented similar nitrogen values to the initial ones, which is probably significant in terms of slower times of the degradation of the proteins and amines, increasing the shelf life. In a way similar to our samples, [22] presented results with a significant increase in the control with no film, with levels of BVN in samples wrapped in chitosan and ACEO being lower by around 80%, reporting a possibility of the phenolic compounds decreasing the growth of microorganisms and consequently preventing the spoilage and breakdown of the proteins. For CCEO, the change in BNV presented by Hosseinzadeh et al., 2020 [53] was similar to the results presented in this study for 0.5% and 1.5% CCEO films, but BNV data were smaller than those from this study because it was a study with minced meat.

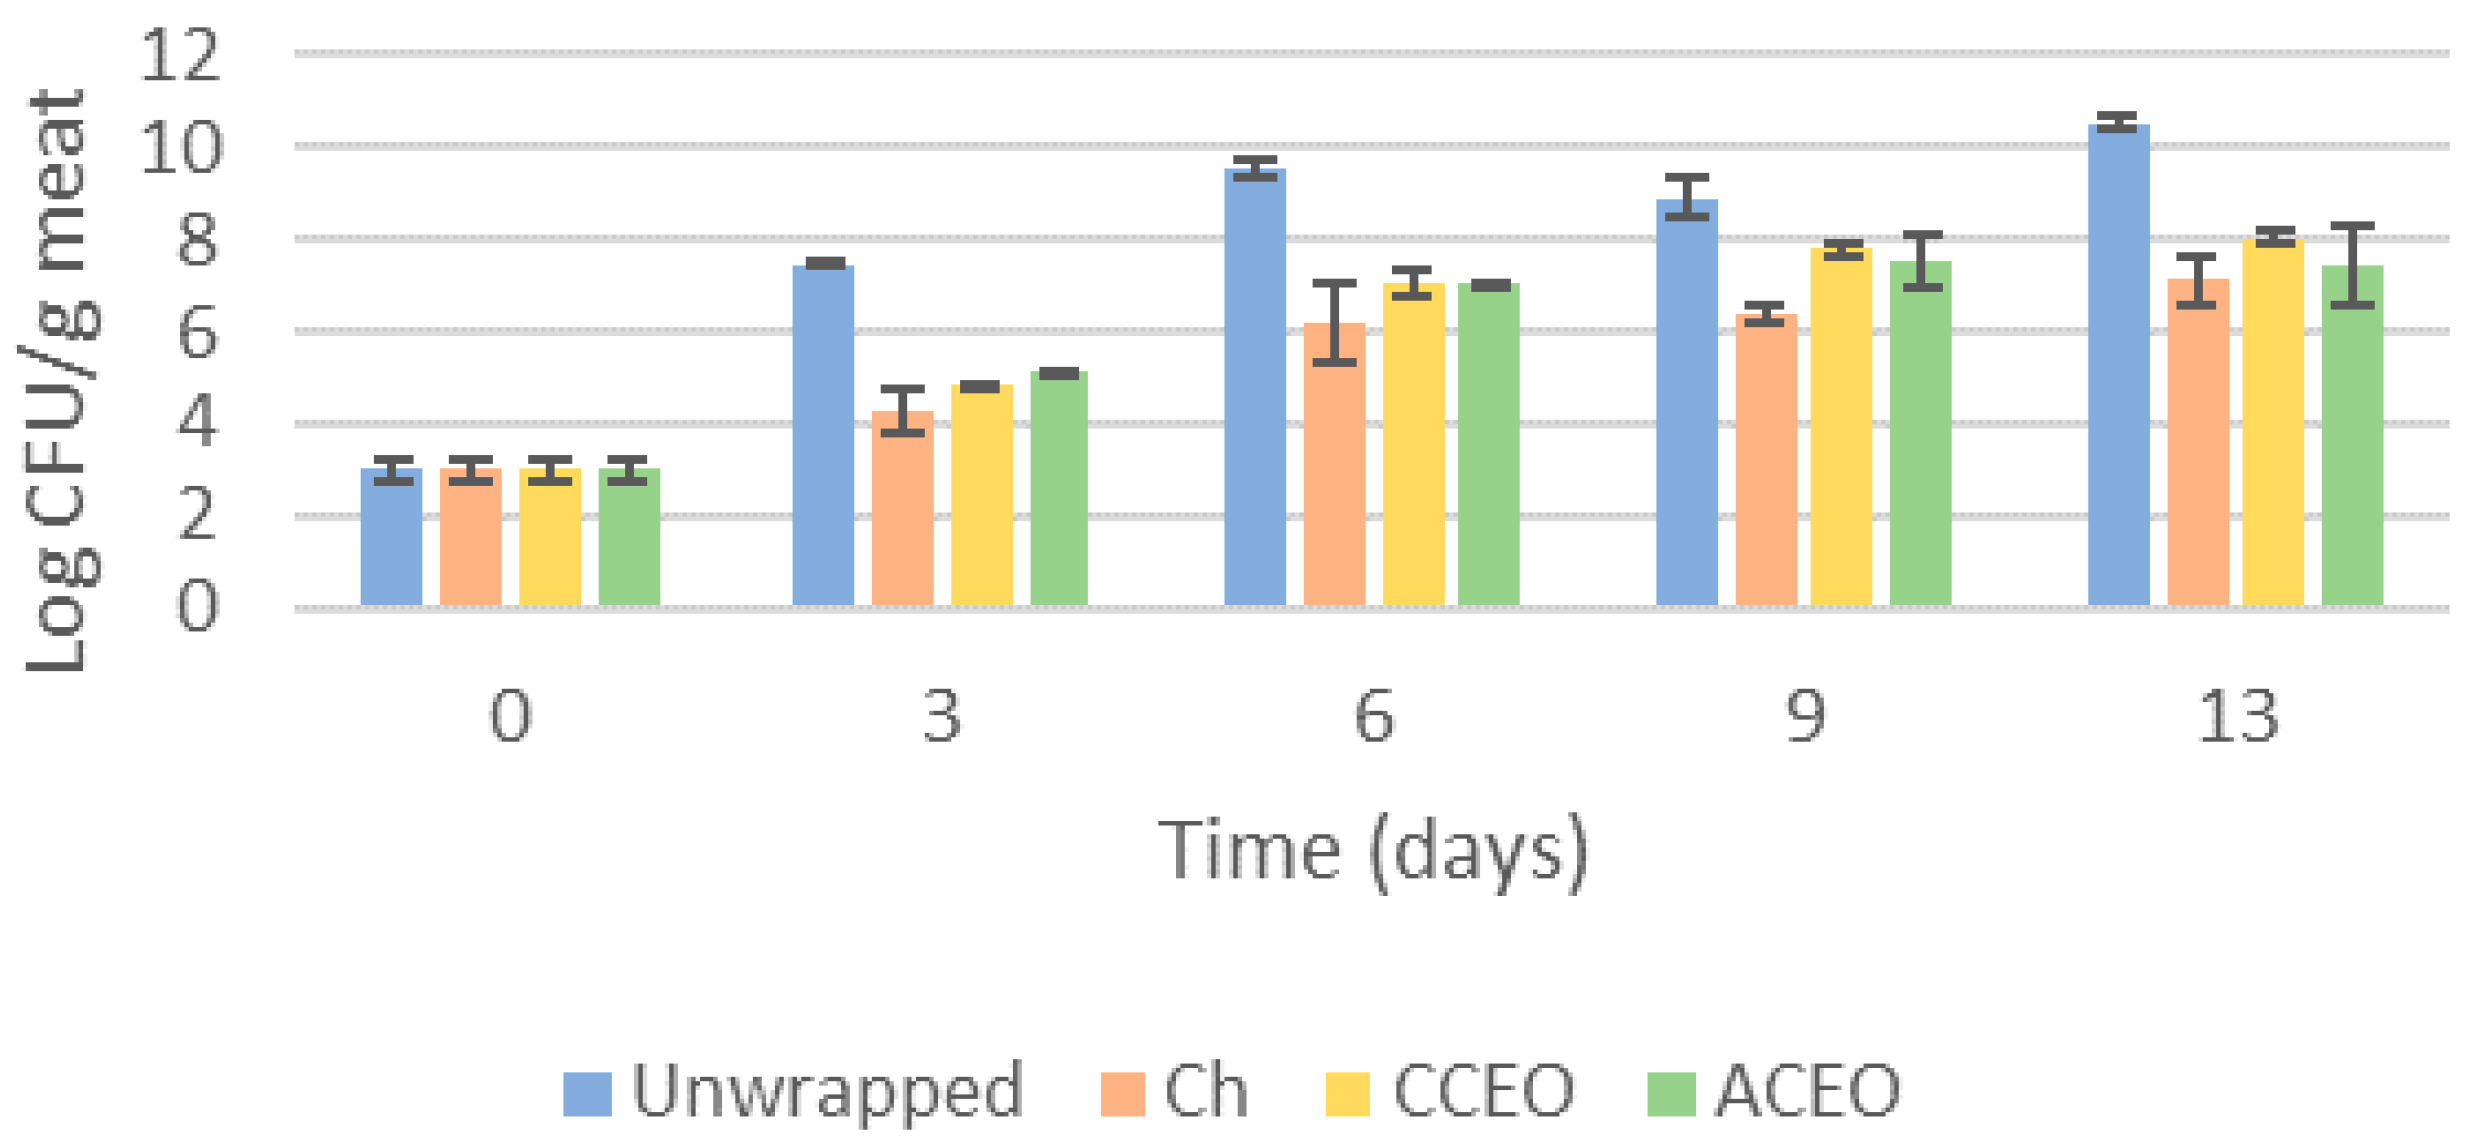
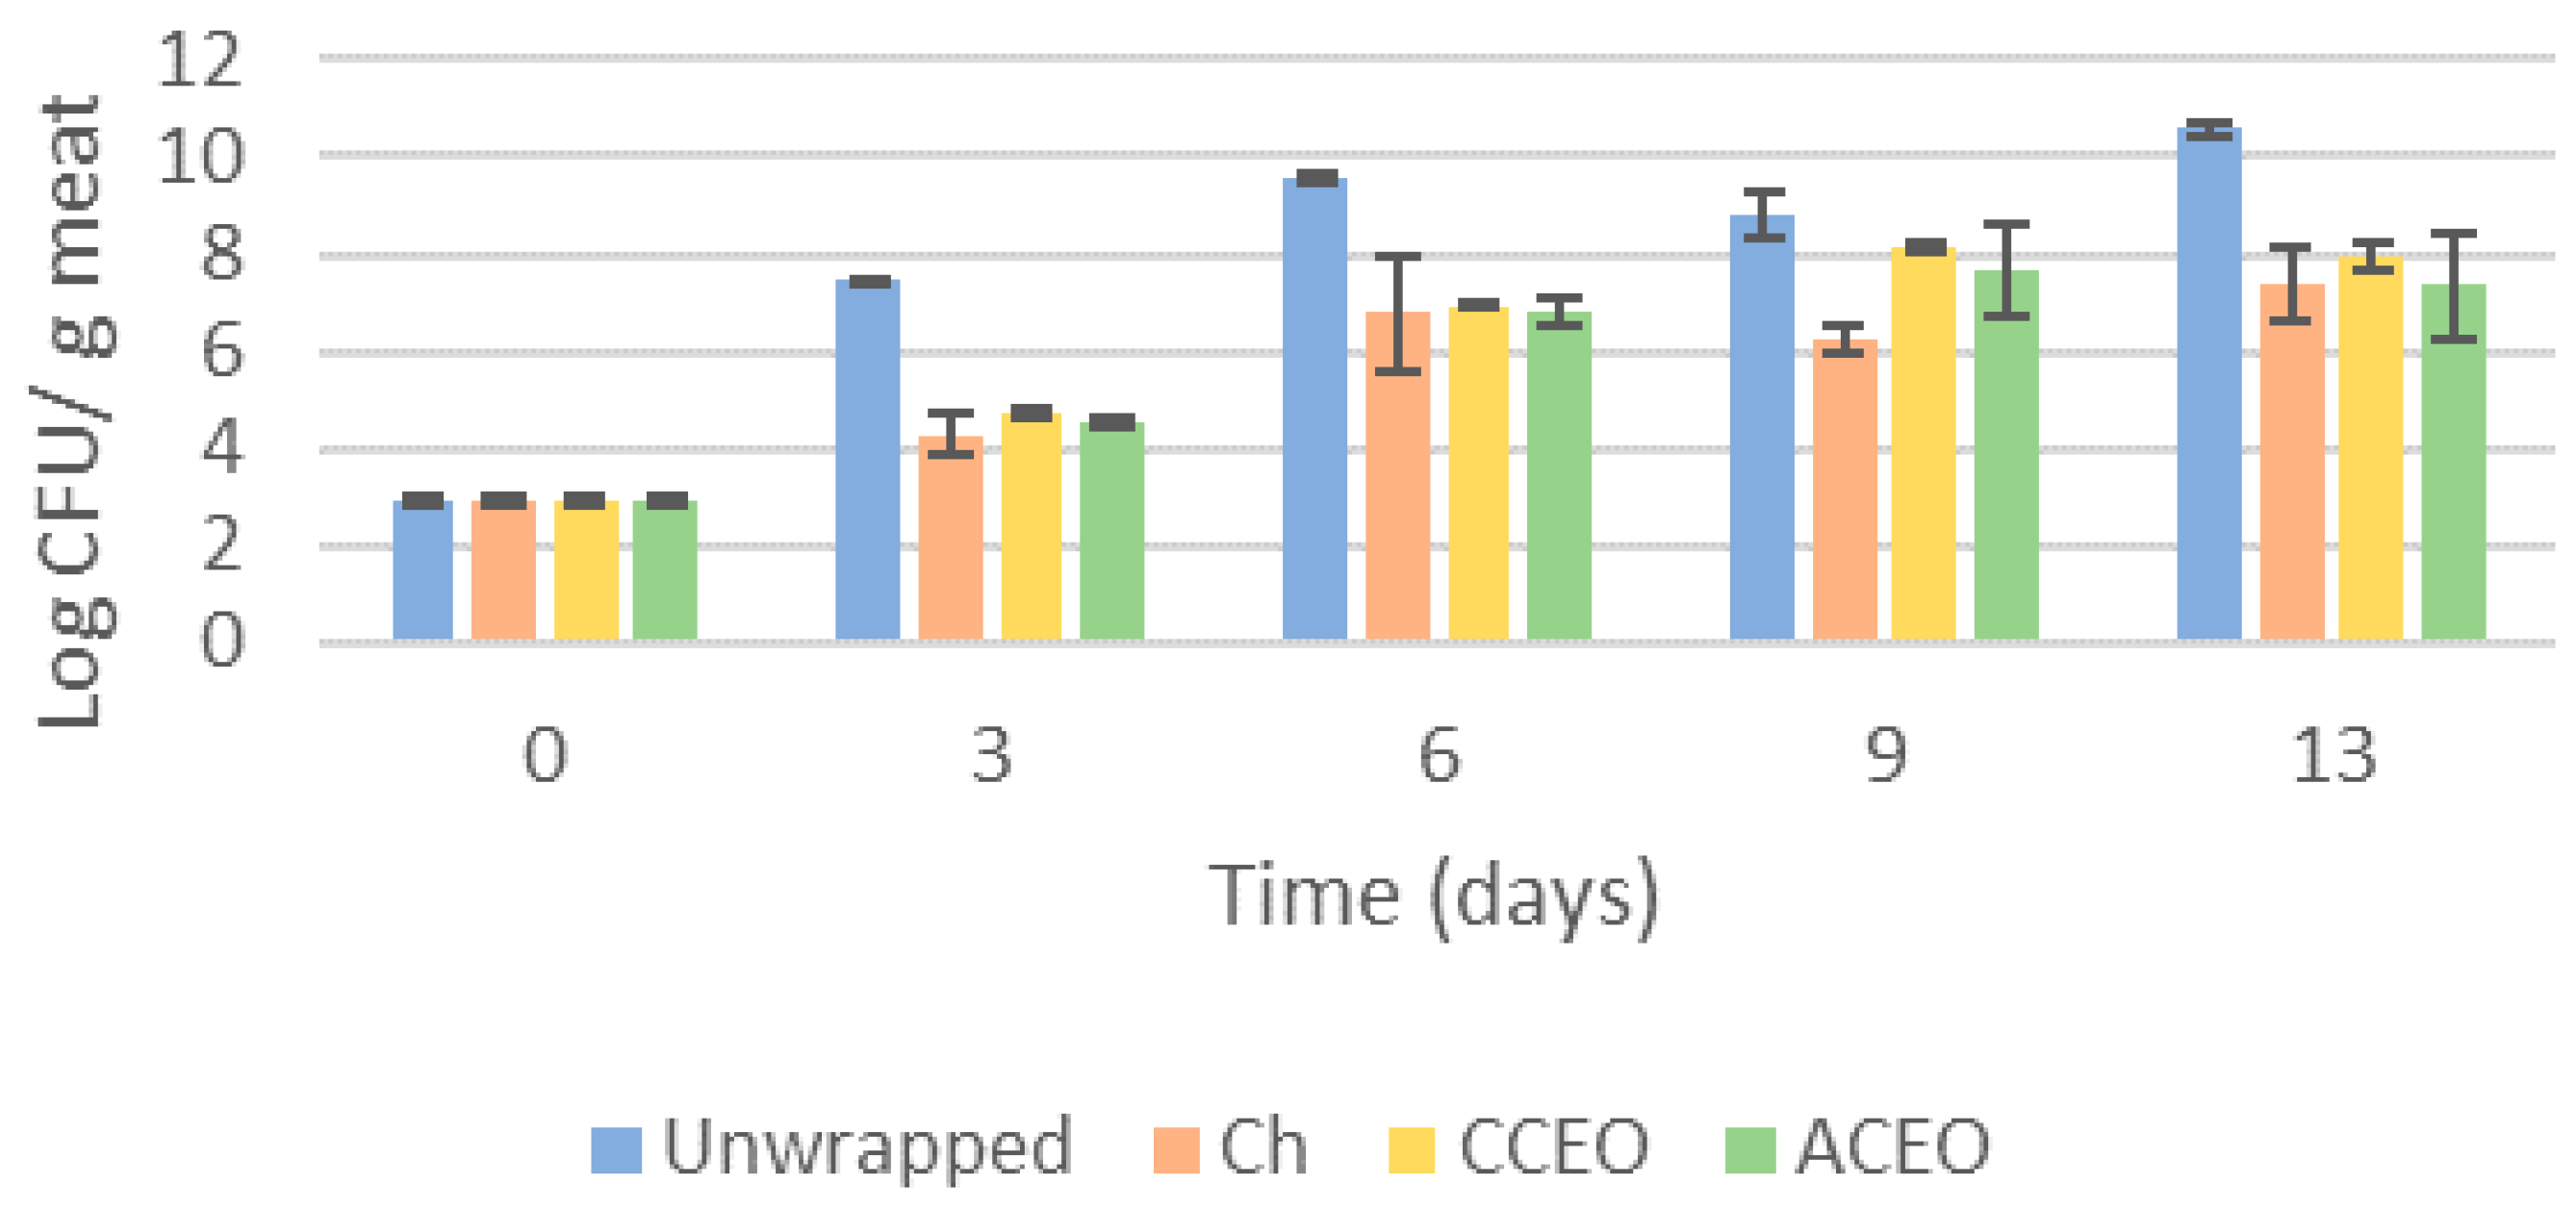
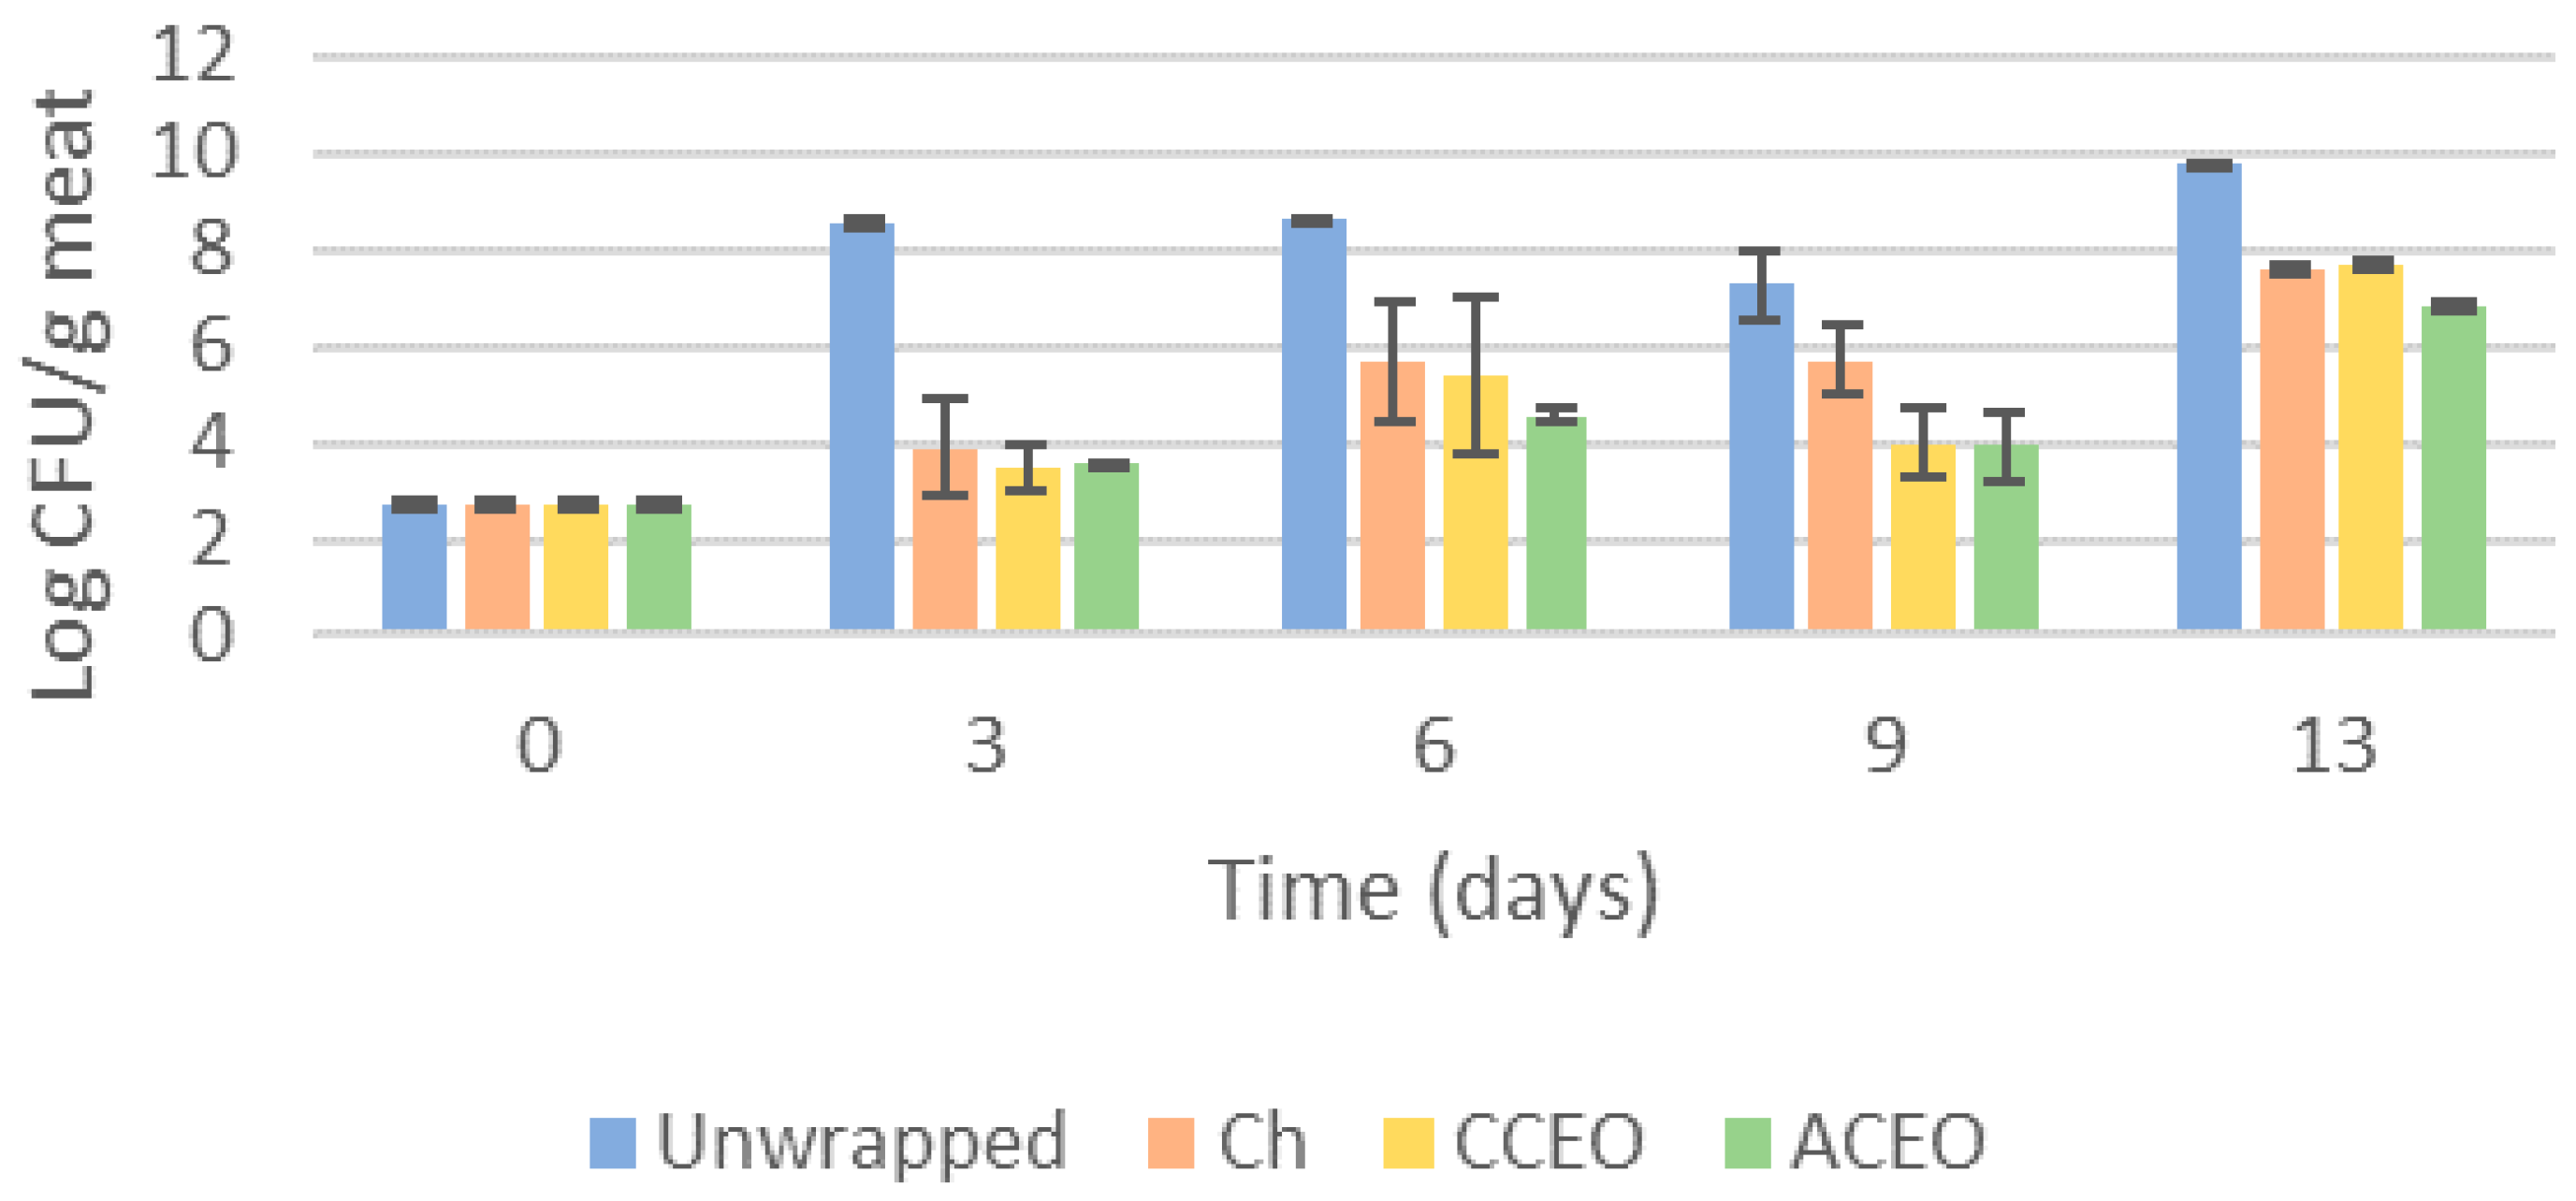
3.3.6. Microbial Growth

The use of refrigeration has long been known to have an unfavorable effect on bacteria. This is a common way of storing food using low temperatures, due to the delay of development and spoilage of bacteria. Since meat is considered one of the most perishable foods, refrigeration is used for storage after slaughter, distribution and then at retail [59]. Spoilage of meat is associated with microbial growth as well as biochemical and enzymatic deterioration [28]. In this assay, psychotropic microorganisms were analyzed that grow at temperatures around 7 °C or less and include both Gram-positive (lactic acid bacteria) and Gram-negative bacteria (Pseudomonas spp., Enterobacteriaceae) [28,59], but also mesophilic microorganisms, with optimum growth between 30 and 39 °C, which is a group containing some pathogens like Streptococcus aureus, Salmonella spp. and Escherichia coli [59].
The results show that both mesophilic (Figure 7) and psychotropic (Figure 8) microorganisms grew throughout the 13 days, and that in the wrapped meat the growth was slower compared to the unwrapped meat, as expected. All the wrapped samples presented throughout the 13 days similar behavior, with no differences among films with and without EOs. This reduced growth of microorganisms wrapped in chitosan is attribute to the intrinsic antimicrobial activity of the chitosan [10].
In terms of Enterobacteriaceae, the behavior presented a small variation, with ACEO presenting lower growth values (6.8 log (CFU/g)) on the 13th day compared to the chitosan film and the CCEO film, which presented 7.6 and 7.7 log (CFU/g), respectively (Figure 9). Indeed, ACEO presented lower microbial growth than CCEO and pristine chitosan, although it was not statistically significant. Moreover, at day 9, films with both EOs showed a significantly lower Enterobacteriaceae growth, compared with chitosan, thus indicating the beneficial effect of adding those EOs to improve the activity of the films.
In general, all the wrappers were effective in controlling the microbial growth of the analyzed microorganisms, showing the capacity to increase shelf life. Previous investigations also reported similar behavior of essential oils as that seen in this study, reporting around 6 log(CFU/g) for mesophilic bacteria in poultry wrapped with ACEO, near 7 log(CFU/g) for psychotropic bacteria and around 4 log(CFU/g) for Enterobacteriaceae, although it was not possible to compare to a chitosan film without oil [53]. Trout samples wrapped with edible ACEO presented levels of 4.56 log (CFU/g) compared to a control chitosan (6.19 log (CFU/g)) at 12 days of storage for the total volatile countable microorganisms, and 4.89 log(CFU/g) for Enterobacteriaceae with ACEO, which is 1.3 lower than the chitosan control [27]. CCEO in minced meat presented values for total bacteria a little below 8 log(CFU/g) for 0.5 and 1.5% EO, compared to chitosan and unwrapped meat, which almost reached 9 log(CFU/g). Psychotropic bacteria presented similar values for the EO, but with chitosan and unwrapped meat at around 8.5 log(CFU/g), followed by Enterobacteriaceae with a 8.5 to 9.5 log(CFU/g) difference between them [55].

4. Conclusions

Chemical composition of both EOs was very similar to those from other countries, with geranial and neral being the main compounds, followed by limonene for ACEO and β-myrcene for CCEO. In terms of phenolic content and antioxidant activity of the EOs, the contact assays showed their contribution to slowing down the deterioration speed of the poultry meat, since they decrease the pH values and delay the degradation and microbial growth processes. Although differences were not significant, ACEO had a stronger contribution to reduce Enterobactereacea growth in the poultry meat. Up to the 9th day of storage, the EOs contribute to preserve the lipidic oxidation. The reduction in moisture content in the meat samples, turning the meat more dry and less conditional for bacterial growth, was more significant with the wrapped samples than unwrapped samples. Wrapping the poultry meat with biofilms also contributed to maintaining the pH levels and a decrease in the nitrogen levels of 62% compared to the unwrapped meat was observed. The wrapping with chitosan also helped to lower lipidic oxidation and microbial growth. The study provided the information that fresh poultry meat protected by bioplastics can improve the shelf life time, and the incorporation of the essential oils facilitated the delay of the oxidation process compared with the chitosan + NC control.

Supplementary Materials

The following supporting information can be downloaded at: https://www.mdpi.com/article/10.3390/macromol3040040/s1, Table S1: Relative chemical composition (%) of essential oils from A. citrodora and C. citratus.

Author Contributions

Conceptualization, J.C., A.G., A.L.F. and L.S.; methodology, S.J.S., J.R.A.P. and C.R.; software, J.M. and S.J.S.; validation, J.M. and S.J.S.; formal analysis, S.J.S. and N.S.; investigation, S.J.S., N.S. and J.M.; writing—original draft preparation, S.J.S. and N.S.; writing—review and editing, J.C., A.G., A.L.F. and L.S.; supervision, A.L.F. and L.S. All authors have read and agreed to the published version of the manuscript.

Funding

Nsewolo Samba would like to thank for grant number BIU114-M and the financial support received from Fundação para a Ciência e Tecnologia for the funding of the FibEnTech-UBI Research Unit, project UIDB/00195/2020. This research was funded by national funding by the FCT, Foundation for Science and Technology, through the individual research grants of Carolina Rodrigues (2020.04441.BD) and João R.A. Pires (SFRH/BD/144346/2019). This work was also supported by the Mechanical Engineering and Resource Sustainability Center—MEtRICs, which is financed by national funds from FCT/MCTES (UIDB/04077/2020 and UIDP/04077/2020).

Data Availability Statement

The data presented in this study are available on request from the corresponding author.

Conflicts of Interest

The authors declare no conflict of interest.

References

  1. Bhavaniramya, S.; Vishnupriya, S.; Al-Aboody, M.S.; Vijayakumar, R.; Baskaran, D. Role of essential oils in food safety: Antimicrobial and antioxidant applications. Grain Oil Sci. Technol. 2019, 2, 49–55. [Google Scholar] [CrossRef]
  2. Cuicui, L.; Lixia, H. Review on Volatile Flavor Components of Roasted Oilseeds and Their Products. Grain Oil Sci. Technol. 2018, 1, 151–156. [Google Scholar] [CrossRef]
  3. Kamala Kumari, P.V.; Akhila, S.; Srinivasa Rao, Y.; Rama Devi, B. Alternative to Artificial Preservatives. Syst. Rev. Pharm. 2019, 10, 99–102. [Google Scholar]
  4. Pires, J.R.A.; Almeida, K.M.; Augusto, A.S.; Vieira, É.T.; Fernando, A.L.; Souza, V.G.L. Application of Biocomposite Films of Chitosan/Natural Active Compounds for Shelf Life Extension of Fresh Poultry Meat. J. Compos. Sci. 2022, 6, 342. [Google Scholar] [CrossRef]
  5. Rodrigues, C.; Paula, C.D.D.; Lahbouki, S.; Meddich, A.; Outzourhit, A.; Rashad, M.; Pari, L.; Coelhoso, I.; Fernando, A.L.; Souza, V.G.L. Opuntia spp.: An Overview of the Bioactive Profile and Food Applications of This Versatile Crop Adapted to Arid Lands. Foods 2023, 12, 1465. [Google Scholar] [CrossRef]
  6. Falleh, H.; Ben Jemaa, M.; Saada, M.; Ksouri, R. Essential oils: A promising eco-friendly food preservative. Food Chem. 2020, 330, 127268. [Google Scholar] [CrossRef]
  7. Mihai, A.L.; Popa, M.E. Essential oils utilization in food industry—A literature review. Sci. Bulletin. Ser. F Biotechnol. 2013, 17, 187–192. Available online: https://biotechnologyjournal.usamv.ro/pdf/vol.LVI/Art33.pdf (accessed on 1 July 2022).
  8. Macwan, S.R.; Dabhi, B.K.; Aparnathi, K.D.; Prajapati, J.B. Essential Oils of Herbs and Spices: Their Antimicrobial Activity and Application in Preservation of Food. Int. J. Curr. Microbiol. Appl. Sci. 2016, 5, 885–901. [Google Scholar] [CrossRef]
  9. Ramos, M.; Beltrán, A.; Valdes, A.; Peltzer, M.A.; Jiménez, A.; Garrigós, M.C.; Zaikov, G.E. Carvacrol and Thymol for Fresh Food Packaging. J. Bioequiv. Bioavailab. 2013, 5, 154–160. [Google Scholar] [CrossRef]
  10. Souza, V.G.L.; Rodrigues, C.; Ferreira, L.; Pires, J.R.A.; Duarte, M.P.; Coelhoso, I.; Fernando, A.L. In vitro bioactivity of novel chitosan bionanocomposites incorporated with different essential oils. Ind. Crops Prod. 2019, 140, 111563. [Google Scholar] [CrossRef]
  11. Sharma, S.; Barkauskaite, S.; Jaiswal, A.K.; Jaiswal, S. Essential oils as additives in active food packaging. Food Chem. 2021, 343, 128403. [Google Scholar] [CrossRef]
  12. Souza, V.G.L.; Pires, J.R.A.; Vieira, É.T.; Coelhoso, I.M.; Duarte, M.P.; Fernando, A.L. Activity of chitosan-montmorillonite bionanocomposites incorporated with rosemary essential oil: From in vitro assays to application in fresh poultry meat. Food Hydrocoll. 2019, 89, 241–252. [Google Scholar] [CrossRef]
  13. Souza, V.G.L.; Rodrigues, P.F.; Duarte, M.P.; Fernando, A.L. Antioxidant migration studies in chitosan films incorporated with plant extracts. J. Renew. Mater. 2018, 6, 548–558. [Google Scholar] [CrossRef]
  14. Xavier, L.O.; Sganzerla, W.G.; Rosa, G.B.; da Rosa, C.G.; Agostinetto, L.; de Lima Veeck, A.P.; Bertoldi, F.C. Chitosan packaging functionalized with Cinnamodendron dinisii essential oil loaded zein: A proposal for meat conservation. Int. J. Biol. Macromol. 2021, 169, 183–193. [Google Scholar] [CrossRef]
  15. Pires, J.R.A.; Rodrigues, C.; Coelhoso, I.; Fernando, A.L.; Souza, V.G.L. Current Applications of Bionanocomposites in FoodProcessing and Packaging. Polymers 2023, 15, 2336. [Google Scholar] [CrossRef]
  16. Souza, V.G.L.; Pires, J.R.A.; Rodrigues, P.F.; Lopes, A.A.S.; Fernandes, F.M.B.; Duarte, M.P.; Coelhoso, I.; Fernando, A.L. Bionanocomposites of chitosan/montmorillonite incorporated with Rosmarinus officinalis essential oil: Development and physical characterization. Food Packag. Shelf Life 2018, 16, 148–156. [Google Scholar] [CrossRef]
  17. Oliveira, L.I.G.; Oliveira, K.A.R.; Medeiros, E.S.; Batista, A.U.D.; Madruga, M.S.; Lima, M.S.; Souza, E.L.; Magnani, M. Characterization and efficacy of a composite coating containing chitosan and lemongrass essential oil on postharvest quality of guava. Innov. Food Sci. Emerg. Technol. 2020, 66, 102506. [Google Scholar] [CrossRef]
  18. Pires, J.; Paula, C.D.D.; Souza, V.G.L.; Fernando, A.L.; Coelhoso, I. Understanding the Barrier and Mechanical Behavior of Different Nanofillers in Chitosan Films for Food Packaging. Polymers 2021, 13, 721. [Google Scholar] [CrossRef] [PubMed]
  19. Pires, J.R.A.; Souza, V.G.L.; Gomes, L.A.; Coelhoso, I.M.; Godinho, M.H.; Fernando, A.L. Micro and nanocellulose extracted from energy crops as reinforcement agents in chitosan films. Ind. Crops Prod. 2022, 186, 115247. [Google Scholar] [CrossRef]
  20. Farahmandfar, R.; Asnaashari, M.; Pourshayegan, M.; Maghsoudi, S.; Moniri, H. Evaluation of antioxidant properties of lemon verbena (Lippia citriodora) essential oil and its capacity in sunflower oil stabilization during storage time. Food Sci. Nutr. 2018, 6, 983–990. [Google Scholar] [CrossRef]
  21. Elchaghaby, M.A.; El-Kader, S.F.A.; Aly, M.M. Bioactive composition and antibacterial activity of three herbal extracts (lemongrass, sage, and guava leaf) against oral bacteria: An in vitro study. J. Oral. Biosci. 2022, 64, 114–119. [Google Scholar] [CrossRef]
  22. Rezaeifar, M.; Mehdizadeh, T.; Mojaddar Langroodi, A.; Rezaei, F. Effect of chitosan edible coating enriched with lemon verbena extract and essential oil on the shelf life of vacuum rainbow trout (Oncorhynchus mykiss). J. Food Saf. 2020, 40, e12781. [Google Scholar] [CrossRef]
  23. United Nations. Sustainable Development Goals. 2023. Available online: https://sdgs.un.org/ (accessed on 1 April 2023).
  24. Singleton, V.L.; Orthofer, R.; Lamuela-Raventós, R.M. Analysis of total phenols and other oxidation substrates and antioxidants by means of folin-ciocalteu reagent. Methods Enzymol. 1999, 299, 152–178. [Google Scholar] [CrossRef]
  25. Brand-Williams, W.; Cuvelier, M.E.; Berset, C. Use of a free radical method to evaluate antioxidant activity. LWT-Food Sci. Technol. 1995, 28, 25–30. [Google Scholar] [CrossRef]
  26. Siripatrawan, U.; Harte, B.R. Physical properties and antioxidant activity of an active film from chitosan incorporated with green tea extract. Food Hydrocoll. 2010, 24, 770–775. [Google Scholar] [CrossRef]
  27. Dias, M.V.; Machado Azevedo, V.; Borges, S.V.; Soares, N.F.; de Barros Fernandes, R.V.; Marques, J.J.; Medeiros, E.A. Development of chitosan/montmorillonite nanocomposites with encapsulated α-tocopherol. Food Chem. 2014, 165, 323–329. [Google Scholar] [CrossRef]
  28. Pires, J.R.A.; de Souza, V.G.L.; Fernando, A.L. Chitosan/montmorillonite bionanocomposites incorporated with rosemary and ginger essential oil as packaging for fresh poultry meat. Food Packag. Shelf Life 2018, 17, 142–149. [Google Scholar] [CrossRef]
  29. Souza, V.G.L.; Pires, J.R.A.; Vieira, É.T.; Coelhoso, I.M.; Duarte, M.P.; Fernando, A.L. Shelf life assessment of fresh poultry meat packaged in novel bionanocomposite of chitosan/montmorillonite incorporated with ginger essential oil. Coatings 2018, 8, 177. [Google Scholar] [CrossRef]
  30. European Commission. Regulation (EU) No 10/2011 of 14 January 2011 on Plastic Materials and Articles Intended to Come into Contact with Food; European Commission: Brussels, Belgium, 2011. [Google Scholar]
  31. Association of the Official Analytical Chemists (AOAC). Official Methods of Analysis of the Association of Official Analytical Chemists, 20th ed.; AOAC: Gaithersburg, MD, USA, 2016. [Google Scholar]
  32. Rosmini, M.R.; Perlo, F.; Pérez-Alvarez, J.A.; Pagán-Moreno, M.J.; Gago-Gago, A.; López-Santoveña, F.; Aranda-Catalá, V. TBA test by an extractive method applied to ‘paté’. Meat Sci. 1996, 42, 103–110. [Google Scholar] [CrossRef] [PubMed]
  33. Malle, P.; Poumeyrol, M. A New Chemical Criterion for the Quality Control of Fish: Trimethylamine/Total Volatile Basic Nitrogen (%). J. Food Prot. 1989, 52, 419–423. [Google Scholar] [CrossRef] [PubMed]
  34. ISO 4833-1:2013; Microbiology of the Food Chain—Horizontal Method for the Enumeration of Microorganisms—Part 1: Colony Count at 30 Degrees C by the Pour Plate Technique. ISO: Geneva, Switzerland, 2013.
  35. ISO 17410:2019; Microbiology of the Food Chain—Horizontal Method for the Enumeration of Psychrotrophic Microorganisms. ISO: Geneva, Switzerland, 2001.
  36. ISO 21528-2:2017; Microbiology of the Food Chain—Horizontal Method for the Detection and Enumeration of Enterobacteriaceae—Part 2: Colony-Count Technique. ISO: Geneva, Switzerland, 2017.
  37. Golmakani, M.-T.; Farahmand, M.; Ghassemi, A.; Eskandari, M.H.; Niakousari, M. Enrichment of citral isomers in different microwave-assisted extraction of essential oil from fresh and dried lemon verbena (Aloysia citridora) leaves. J. Food Process Preserv. 2017, 41, e13215. [Google Scholar] [CrossRef]
  38. Hadjilouka, A.; Mavrogiannis, G.; Mallouchos, A.; Paramithiotis, S.; Mataragas, M.; Drosinos, E.H. Effect of lemon grass essential oil on Listeria monocytogenes gene expression. LWT-Food Sci. Technol. 2017, 77, 510–516. [Google Scholar] [CrossRef]
  39. Matasyoh, J.C.; Wagara, I.N.; Nakavuma, J.L.; Kiburai, A.M. Chemical composition of Cymbopogon citratus essential oil and its effect on mycotoxigenic Aspergillus species. Afr. J. Food Sci. 2011, 5, 138–142. Available online: http://www.academicjournals.org/ajfs (accessed on 1 April 2023).
  40. Lohvina, H.; Sándor, M.; Wink, M. Effect of Ethanol Solvents on Total Phenolic Content and Antioxidant Properties of Seed Extracts of Fenugreek (Trigonella foenum-graecum L.) Varieties and Determination of Phenolic Composition by HPLC-ESI-MS. Diversity 2022, 14, 7. [Google Scholar] [CrossRef]
  41. Onawunmi, G.O.; Yisak, W.A.; Ogunlana, E.O. Anti bacterial constituents in the essential oil of Cymbopogon citratus (D.C) Stapf. J. Ethnopharmacol. 1984, 12, 279–286. [Google Scholar] [CrossRef] [PubMed]
  42. Naik, M.I.; Fomda, B.A.; Jaykumar, E.; Bhat, J.A. Antibacterial activity of lemongrass (Cymbopogon citratus) oil against some selected pathogenic bacterias. Asian Pac. J. Trop. Med. 2010, 3, 535–538. [Google Scholar] [CrossRef]
  43. Falcao, M.A.; Fianco, A.L.B.; Lucas, A.M.; Pereira, M.A.A.; Torres, F.C.; Vargas, R.M.F.; Cassel, F. Determination of antibacterial activity of vacuum distillation fractions of lemongrass essential oil. Phytochem. Rev. 2012, 11, 405–412. [Google Scholar] [CrossRef]
  44. Guimarães de Lima, L.G.; Cardoso das Graças, M.; de Sousa, P.E.; de Andrade, J.; Vieira, S.S. Antioxidant and fungitoxic activities of the lemongrass essential oil and citral. Rev. Ciência Agronômica 2011, 42, 464–472. [Google Scholar] [CrossRef]
  45. Baschieri, A.; Ajvazi, M.D.; Tonfack, J.L.F.; Valgimigli, L.; Amorati, R. Explaining the antioxidant activity of some common non-phenolic components of essential oils. Food Chem. 2017, 232, 656–663. [Google Scholar] [CrossRef]
  46. López-De-Dicastillo, C.; Gómez-Estaca, J.; Catalá, R.; Gavara, R.; Hernández-Muñoz, P. Active antioxidant packaging films: Development and effect on lipid stability of brined sardines. Food Chem. 2012, 131, 1376–1384. [Google Scholar] [CrossRef]
  47. Souza, V.G.L. Desenvolvimento de Bio-Nanocompósitos de Quitosano/Montmorilonite Incorporados com Extratos Naturais como Embalagens Ativas para Alimentos; Faculdade de Ciências e Tecnologia, Universidade Nova de Lisboa: Lisbon, Portugal, 2018. [Google Scholar]
  48. Majewska, E.; Kozlowska, M.; Gruczynska-Sekowska, E.; Kowalska, D.; Tarnowska, K. Lemongrass (Cymbopogon citratus) essential oil: Extraction, composition, bioactivity and uses for food preservation—A review. Polish J. Food Nutr. Sci. 2019, 69, 327–341. [Google Scholar] [CrossRef]
  49. Pastor, C.; Sánchez-González, L.; Chiralt, A.; Cháfer, M.; González-Martínez, C. Physical and antioxidant properties of chitosan and methylcellulose based films containing resveratrol. Food Hydrocoll. 2013, 30, 272–280. [Google Scholar] [CrossRef]
  50. Osman, Z.; Arof, A.K. Chitosan and Phthaloylated Chitosan in Electrochemical Devices. In Biological Activities and Application of Marine Polysaccharides; Shalaby, E.A., Ed.; InTech.: Cairo, Egypt, 2017; Available online: https://www.intechopen.com/chapters/52586 (accessed on 1 July 2022). [CrossRef]
  51. Barbut, S. Pale, soft, and exudative poultry meat—Reviewing ways to manage at the processing plant. Poult. Sci. 2009, 88, 1506–1512. [Google Scholar] [CrossRef] [PubMed]
  52. Hosseini, M.; Jamshidi, A.; Raeisi, M.; Azizzadeh, M. Effect of sodium alginate coating containing clove (Syzygium aromaticum) and lemon verbena (Aloysia citriodora) essential oils and different packaging treatments on shelf life extension of refrigerated chicken breast. J. Food Process. Preserv. 2021, 45, e14946. [Google Scholar] [CrossRef]
  53. Hosseinzadeh, M.H.; Ebrahimzadeh, M.A. Protective effects of ethanolic extract of Lemon Beebrush (Aloysia citrodora) leaf against hypoxia-induced lethality in mice. Tabari Biomed. Stud. Res. J. 2020, 1, 1–7. [Google Scholar] [CrossRef]
  54. Tyl, C.; Sadler, G.D. pH and Titratable Acidity. In Food Analysis; Food Science Text Series; Nielsen, S.S., Ed.; Springer: Cham, Switzerland, 2017. [Google Scholar] [CrossRef]
  55. Hunt, M.C.; King, A.; Barburt, S.; Clause, J.; Cornforth, D.; Hanson, D. AMSA Meat Color Measurement Guidelines; American Meat Science Association: Savoy, IL, USA, 2012; Volume 61820. [Google Scholar]
  56. Carvalho, R.; Shimokomaki, M.; Estévez, M. Poultry Meat Color and Oxidation. In Poultry Quality Evaluation Quality Attributes and Consumer Values; Petracci, M., Berri, C., Eds.; Woodhead Publishing: Sawston, UK, 2017; pp. 133–157. [Google Scholar] [CrossRef]
  57. Olorunsanya, A.O.; Olorunsanya, E.O.; Bolu, S.A.O.; Adejumobi, C.T.; Kayode, R.M.O. Effect of Graded Levels of Lemongrass (Cymbopogon citratus) on Oxidative Stability of Raw or Cooked Pork Patties. Pak. J. Nutr. 2010, 9, 1680–5194. [Google Scholar] [CrossRef]
  58. Bekhit, A.E.D.A.; Holman, B.W.B.; Giteru, S.G.; Hopkins, D.L. Total volatile basic nitrogen (TVB-N) and its role in meat spoilage: A review. Trends Food Sci. Technol. 2021, 109, 280–302. [Google Scholar] [CrossRef]
  59. Ercolini, D.; Russo, F.; Nasi, A.; Ferranti, P.; Villani, F. Mesophilic and psychrotrophic bacteria from meat and their spoilage potential in vitro and in beef. Appl. Environ. Microbiol. 2009, 75, 1990–2001. [Google Scholar] [CrossRef]
Figure 1. Total phenolic content (mg GAE/L) obtained in the different simulant media when chitosan films were incorporated with ACEO.
Macromol 03 00040 g001
Figure 2. Total phenolic content (mg GAE/L) obtained in the different simulant media when chitosan films were incorporated with CCEO.
Macromol 03 00040 g002
Figure 3. Radical scavenging (%) results obtained in the different simulant media when chitosan films were incorporated with CCEO.
Macromol 03 00040 g003
Figure 4. Radical scavenging (%) results obtained in the different simulant media when chitosan films were incorporated with ACEO.
Macromol 03 00040 g004
Figure 5. TBARS Index values (mg MDA/Kg meat) of the wrapped and unwrapped poultry meat along storage time.
Macromol 03 00040 g005
Figure 6. Basic Volatile Nitrogen values (g N/100 g meat) of the wrapped and un-wrapped poultry meat throughout storage time.
Macromol 03 00040 g006
Figure 7. Total mesophilic aerobic microorganisms (Log CFU/g meat) of the wrapped and unwrapped poultry meat along storage time.
Macromol 03 00040 g007
Figure 8. Total psychotropic aerobic microorganisms (Log CFU/g meat) of the wrapped and unwrapped poultry meat along storage time.
Macromol 03 00040 g008
Figure 9. Enterobactereaceae (Log CFU/g meat) of the poultry meat wrapped and unwrapped along storage time.
Macromol 03 00040 g009
Table 1. Total phenolic content of the EOs (mg GAE/L) and Antioxidant activity (% Radical Scavenging) measured in a proportion 1:20 of the EO in different solutions.
SampleWaterEthanol 10%Ethanol 50%Ethanol 95%
Total phenolic content (mg/L)ACEO216.0 ± 5.0255.0 ± 34.0288 ± 59.0-
CCEO109.0 ± 18.0110.0 ± 6.0133.0 ± 5.0268.0 ± 11.0
Antioxidant activity (% radical scavenging)ACEO77.0 ± 12.078.0 ± 1.077.0 ± 0.460.0 ± 3.0
CCEO83.0 ± 2.085.0 ± 15.087.0 ± 7.089.0 ± 5.0
ACEO—A. citrodora Essential oil; CCEO—C. citratus Essential oil.
Table 2. Moisture content (%) of the poultry meat wrapped and unwrapped throughout storage time.
Time (Days)UnwrappedChitosanCCEOACEO
073.9 ± 0.173.9 ± 0.173.9 ± 0.173.9 ± 0.1
375.3 ± 0.871.0 ± 0.272.6 ± 0.670.0 ± 3.6
675.2 ± 0.771.3 ± 0.671.0 ± 0.369.7 ± 0.1
975.9 ± 0.968.9 ± 0.769.4 ± 0.967.1 ± 3.8
1376.6 ± 0.967.7 ± 0.770.4 ± 0.767.1 ± 0.7
Values are mean ± SD (n = 3).
Table 3. pH and total titratable acidity (g oleic acid/100 g meat) of the wrapped and unwrapped poultry meat throughout storage time.
Time (Days)UnwrappedChitosanCCEOACEO
pH05.95 ± 0.045.95 ± 0.045.95 ± 0.045.95 ± 0.04
36.30 ± 0.066.26 ± 0.016.40 ± 0.066.33 ± 0.02
66.78 ± 0.195.63 ± 0.015.78 ± 0.015.51 ± 0.07
96.73 ± 0.355.49 ± 0.045.77 ± 0.015.44 ± 0.03
137.51 ± 0.165.58 ± 0.045.72 ± 0.015.39 ± 0.01
Total Titratable Acidity (g oleic acid/100 g meat)01.06 ± 0.071.06 ± 0.071.06 ± 0.071.06 ± 0.07
31.58 ± 0.160.98 ± 0.100.84 ± 0.170.89 ± 0.23
60.62 ± 0.010.83 ± 0.150.91 ± 0.160.87 ± 0.06
90.82 ± 0.590.90 ± 0.161.05 ± 0.211.11 ± 0.12
130.38 ± 0.071.40 ± 0.071.13 ± 0.251.39 ± 0.08
Values are mean ± SD (n = 3).
Table 4. Hue Angle of the poultry meat wrapped and unwrapped along storage time.
Time (Days)UnwrappedChitosanCCEOACEO
040 ± 540 ± 540 ± 540 ± 5
346 ± 346 ± 146 ± 448 ± 1
641 ± 646 ± 149 ± 252 ± 0
947 ± 349 ± 252 ± 161 ± 1
1348 ± 250 ± 153 ± 661 ± 0
Values are mean ± SD (n = 3).
Table 5. Color variation (ΔE) of the poultry meat wrapped and unwrapped along storage time.
Time (Days)UnwrappedChitosanCCEOACEO
02.10 ± 1.497.54 ± 1.688.55 ± 2.255.58 ± 0.15
35.42 ± 2.277.74 ± 3.049.19 ± 1.866.47 ± 0.13
64.52 ± 0.547.92 ± 0.779.53 ± 1.195.84 ± 0.63
94.77 ± 0.837.87 ± 2.028.92 ± 1.056.18 ± 1.23
132.10 ± 1.497.54 ± 1.688.55 ± 2.255.58 ± 0.15
Values are mean ± SD (n = 3).
Disclaimer/Publisher’s Note: The statements, opinions and data contained in all publications are solely those of the individual author(s) and contributor(s) and not of MDPI and/or the editor(s). MDPI and/or the editor(s) disclaim responsibility for any injury to people or property resulting from any ideas, methods, instructions or products referred to in the content.

