Article

Molecular Dynamics Calculations for the Temperature Response of Poly(alkylated tri(ethylene oxide)isocyanate) Aqueous Solution

1
Graduate School of Chemical Sciences and Engineering, Hokkaido University, Sapporo 060-8628, Japan
2
Division of Applied Chemistry, Faculty of Engineering, Hokkaido University, Sapporo 060-8628, Japan
3
Faculty of Materials Science and Ceramics, AGH University of Science and Technology, 30 Mickiewicza Av., 30-059 Krakow, Poland
4
Research Center for Polymer Materials, School of Materials Science and Engineering, Changchun University of Science and Technology (CUST), Changchun 130022, China
*
Author to whom correspondence should be addressed.
Macromol 2023, 3(3), 653-664; https://doi.org/10.3390/macromol3030036
Submission received: 12 July 2023 / Revised: 19 August 2023 / Accepted: 4 September 2023 / Published: 8 September 2023

Abstract

:
Aqueous solutions of conventional temperature-responsive amphiphilic polymers undergo a coil–globule conformational transition around the lower critical solution temperature (LCST) that causes the polymer surfaces to become hydrophobic and the polymers to aggregate together. Isocyanate polymers with alkylated oligo(ethylene oxide) side chains are expected to have rigid main chains and, thus, do not undergo the coil–globule structural transition, but they have recently been reported to exhibit temperature-responsive properties. In this study, molecular dynamics was used to calculate the agglomeration tendencies of two chains of poly(alkylated tri(ethylene oxide)isocyanate) (PRTEOIC, where R = methyl (Me) or ethyl (Et)) in aqueous solution to elucidate the LCST phenomenon in the absence of coil–globule conformational transition. Our MD simulations showed that aggregation also occurs in rod polymers. Furthermore, we found that both (PMeTEOIC)2 and (PEtTEOIC)2 showed parallel agglomeration of the two molecular chains with increasing temperature, but only (PMeTEOIC)2 showed a metastable T-shaped agglomeration in the middle temperature range. The crossing-point temperature (TCRP) at which the density of the first hydrophobic hydration shell around the sidechain alkyl group equals the bulk water density is a useful indicator for predicting the LCST of rod polymers with dense side chains terminated by alkyl groups.

1. Introduction

Aqueous solutions of amphiphilic polymers possessing a flexible main chain exhibit a phase transition at the lower critical solution temperature (LCST) [1]. Such polymers become soluble below the LCST and insoluble above it. A representative example is poly(N-isopropylacrylamide) (PNIPAM), which has been extensively studied both experimentally [2,3] and theoretically [4]. Below the LCST, the side-chain amide group is hydrogen bonded to water molecules, which results in a “coil” state in which the polymer chain expands. Above the LCST, the side-chain amide group forms hydrogen bonds within the polymer, and the polymer chain adopts a collapsed “globule” state. Therefore, a coil–globule structural transition is considered a necessary driving force for LCST-type phase transitions to occur. Experimentally, the coil–globule transition at the LCST has been observed by fluorescence measurements [5,6,7], dynamic light scattering (DLS) measurements [8,9,10], small-angle X-ray scattering [11], and small-angle neutron scattering [12]. Molecular dynamics (MD) can be used to explain the correlation between the phase transition and coil–globule transition. Deshmukh and Mancini et al. reported that 30 mer PNIPAM in water undergoes the coil–globule structural transition in 3 ns at 310 K, which is higher than the LCST of 305 K [13]. Tavagnacco and Chiessi et al. performed MD calculations for 30 mer PNIPAM in solution and showed that a decrease in the first hydration shell around the isopropyl groups was accompanied by an increase in hydrogen bonding between the polymer and water molecules, indicating that the coil–globule structural transition leads to a significant rearrangement of the hydrogen-bonding pattern [14].
Our group recently reported a novel temperature-responsive water-soluble isocyanate polymer called poly(alkylated tri(ethylene oxide)isocyanate) (PRTEOIC, where R = methyl (Me) or ethyl (Et)), with a degree of polymerization of approximately 20 and polydispersity index of 1.1, that is expected to undergo a LCST phase transition without a coil–globule structural transition [15]. Increasing the bulkiness of the alkyl groups at the end of the side chains should lower the LCST of isocyanate polymers. DLS, dipole moment measurements, and quantum chemical calculations have indicated that polyisocyanates with bulky alkyl side chains generally have rigid helical rod structures [16,17,18,19,20]. In particular, poly(hexyl isocyanate) (PHIC) becomes a liquid crystal material because of its stiff and helical structure with chirality [21]. DLS has shown that PHIC with a degree of polymerization of ~1600 has the relatively long persistence length of 20–40 nm in solvents such as hexane and chloroform [22,23,24,25]. The change in the persistence length with solvent polarity can be attributed to changes in the torsional oscillation around the main chain with polar solvents, as shown by Cook et al., who took linewidth measurements of nuclear magnetic resonance (NMR) spectra [26].
Interestingly, PROEOIC, which has a small polymerization degree of 20, also undergoes a LCST-type phase transition, even though it should have a rigid structure, unlike PNIPAM. Turbidity measurements have shown that the cloud point temperature ( T C L P ) is strongly dependent on the hydrophobicity of the end group of the side chain. For example, PEtTEOIC showed off TCLP = 308 K, while PMeTEOIC TCLP = 353 K (Supplementary Figure S1).
In the present study, we performed all-atom classical MD calculations on the temperature response for the agglomeration tendencies of two chains of PRTEOIC in aqueous solution. It has been reported that the solvent exclusion volume effect could be an indicator of LCST phase transition [27,28]. Herein, we investigated the mechanism for the LCST-type phase transition of rod-type polymers with a small degree of polymerization and found that the hydrophobic hydration shell strength at the end of side chain could be an indicator of the phase-transition temperature in the absence of the coil–globule structural transition.

2. Methodology

2.1. Simulation Details

The Amber (ver.14 or 20) software package [29] was used to carry out all-atom MD simulations for aqueous solutions of one or two chains of PMeTEOIC and PEtTEOIC at six temperatures from 288 K to 370 K. The degree of polymerization was set to 20 to be close to the experimental molecular weight reported by Sakai and Kakuchi et al. [30]. MD simulations were also performed for two molecules of alkyl tri(ethylene oxide) (MeTEO, EtTEO) in aqueous solution for comparison with their combined state when attached to the isocyanate polymer (Scheme 1).
These molecules were structurally optimized by the semi-empirical molecular orbital method (AM1), and their atomic charges were determined by the AM1-BCC method [31] by using the Antechamber tool of the AMBER package. The general AMBER force field (GAFF) was employed as the molecular force field [32,33]. The two polymer chains were placed 12 Å apart as an initial arrangement by using the XLeap tool of the AMBER package. The TIP3P water model was used as a solvent molecule, and the basic simulation cell was solvated to form a cleaved octahedron under the periodic boundary condition. Approximately, 7000 water units were placed in the cell. The concentrations were about 60 g/L for the double polymer solutions (Supplementary Materials Table S1). Energy minimization of the whole system consisting of polymers and solvent water molecules was carried out in two stages, at 0 K. The first energy optimization was carried out in 1000 steps by the steepest descent method, in which two solvated polymer molecules were constrained by a force of 500 kcal/mol Å2. The structure was then allowed to move slightly in the direction of the greatest change on the energy surface. In the second energy optimization, the constraint was removed, and 1000 steps of the steepest descent method were carried out, followed by 1500 steps of the conjugate gradient method. The latter method efficiently found the minimum point by determining the vector through which the structure moves to satisfy the conjugacy property. For temperature elevation followed by equilibration, MD calculations were performed under a weak constraint of 10 kcal/mol Å2 during the first 40 ps. Subsequently, the system temperature was raised from 0 K to the target temperature (i.e., 288 K, 323 K, 333 K, 343 K, 363 K, or 370 K). The system was then given an additional 100 ps for equilibration, which was a total equilibration time of 140 ps. The temperature of the system was equilibrated by using the Langevin temperature control method. A 20 ns simulation was performed for the PRTEOIC dimer. The calculations were carried out 10 times, and the average value at each temperature was taken. A 200 ns simulation was performed for the evaluation of the coil–globule structural transition of PRTEOIC, and 40 ns was performed for the alkylated tri(ethylene oxide) (RTEO) dimer. The analysis used the last 30 ns. All calculations used a time step of 2 fs.
The hydrogen atoms were constrained by the SHAKE method. The NPT ensemble (constant pressure periodic boundary condition) was used, where the number of molecules, temperature, and pressure were kept constant. The temperature and pressure were controlled by using the Langevin temperature control method and Berendsen method, with a mean pressure of 1 atom and relaxation time of 2 ps. Long-range electrostatic interactions were calculated by using the particle mesh Ewald method [34], with a cutoff distance of 9 Å. Trajectories were plotted every 2.0 ps. The collision frequency was set to 1.0 ps−1.

2.2. Analysis

The radius of gyration, Rg, represents the extension degree of the molecular chain from the center of gravity. Rg was employed to investigate the agglomeration degree of two polymer chains, as well as the chain extension of a single polymer chain. Rg is expressed as follows:
R g t = 1 N i = 1 N r i t r c 2
where N is the total number of atoms, r i ( t ) is the atomic coordinate vector, and r c ( t ) is the center of gravity. Considering the time at which the double polymer chains reaches the thermal equilibrium state, the distribution function of R g ( t ) was obtained by excluding the first 10 ns of the simulation.
To analyze the structure of the hydrated shell around the polymer, we obtained a radial distribution function (RDF) for the terminal carbon atoms of the alkylated tri(ethylene oxide) side chain to the oxygen atoms of water molecules. During the hydration of nonpolar molecules, hydrogen bonds do not occur between the solute and solvent. However, the water molecules surrounding the nonpolar solute stabilize into a network structure, which is called a hydrophobic hydrated shell. The RDF can be calculated as follows:
g r = n r 4 π r 2 d r ρ a v e r a g e
where n ( r ) is the number of particles between spherical shells at distances r and d r from a certain particle, and ρ a v e r a g e is the average density of the system. When the inter-particle distance, r, is very small, the particle cannot exist because of the repulsion between particles, so g r = 0 . When r , the relation of g C e O w ( r ) = 1 holds because water molecules exist at the average density. After the RDF was obtained, the peak intensity of g C e O w ( r ) for the first hydrated shell was extracted and was plotted against the temperature. Then, the crossing-point temperature ( T C R P ), which is defined as the temperature at which the average density of bulk water ( g C e O w ( r ) = 1 ) and peak intensity of the RDF intersect, was determined for comparison with the T C L P .

3. Results and Discussion

3.1. Rigidity of the Main Chain

Isocyanates with bulky alkyl side chains are expected to be rigid. Figure 1a shows the change in Rg over time at three temperatures selected according to the experimental turbidity measurements (Supplementary Materials Figure S1) [30]—288 K (at which both PMeTEOIC and PEtTEOIC dissolve), 343 K (at which PMeTEOIC dissolves and PEtTEOIC aggregates), and 370 K (at which both PMeTEOIC and PEtTEOIC aggregate). No significant changes in Rg over time were observed for either PMeTEOIC or PEtTEOIC at any temperature (Figure 1b). These Rg results suggest that PRTEOIC’s are rigid.
To further examine the rigidity of PRTEOIC during the MD simulations, the distributions of the dihedral angles formed by C–N–C–O in the main chain at 363 K were investigated based on the obtained trajectories (Supplementary Materials Figures S2–S4). For the dihedral angle distributions, most (85%) had only one peak. Therefore, little isomerization occurred between the cisoids and transoids. This means that the structure of the main chain was mostly maintained even at high temperatures. The proportions of cisoids and transoids remained at 32% and 68%, respectively. The C–N–C–O bond near the H end of the main chain underwent almost no cisoid–transoid isomerization, while the C–N–C–O bond near the OC4H9 end of the main chain was more likely to undergo cisoid–transoid isomerization. Therefore, the hydrophilic H end of the main chain was less likely to isomerize, while the hydrophobic OC4H9 end was more likely to isomerize.
The MD simulations with the GAFF indicated that the degree of chain extension of PRTEOIC is independent of the temperature and that there is no coil–globule transition above and below the experimentally obtained LCST.
An analysis of the side-chain parts indicated that the averaged side-chain end-to-end distances also remained constant regardless of the temperature (Supplementary Materials Figure S5). This suggests that the folding of the PRTEOIC side chain is not related to its LCST phase transition. This result is consistent with the calculations of Dalgakiran et al. for polymers with methacrylate main chains and OEG side chains [35,36]. To confirm the rigidity of the PRTEOIC main chain, the rotational barrier was estimated by applying the density functional theory (DFT) B3LYP/6-31G(d) for MeTEOIC3 (Supplementary Materials Figure S6), using Gaussian 16 [37]. The rotational barrier obtained by subtracting the energy of the stable structure from the energy of the transition structure was at least 0.664 eV, which is about 26 times higher than the kinetic energy at room temperature (i.e., 0.0257 eV at 298 K).
Ute and Green et al. performed temperature-dependent NMR and experimentally obtained a free-energy activation barrier of 0.85 eV for poly(2-butylhexyl isocyanate) (PBHIC) [20]. Young and Cook performed MD calculations by using the Merck molecular force field and obtained a rotational barrier of 0.76 eV at maximum for 21 mer poly(methyl isocyanate) [18]. Our calculation results are comparable with these values in the literature. These quantum calculations also revealed that the main chain of PRTEOIC is rigid and that the LCST phase transition is not coupled with the structural transition of the isocyanate main chain.

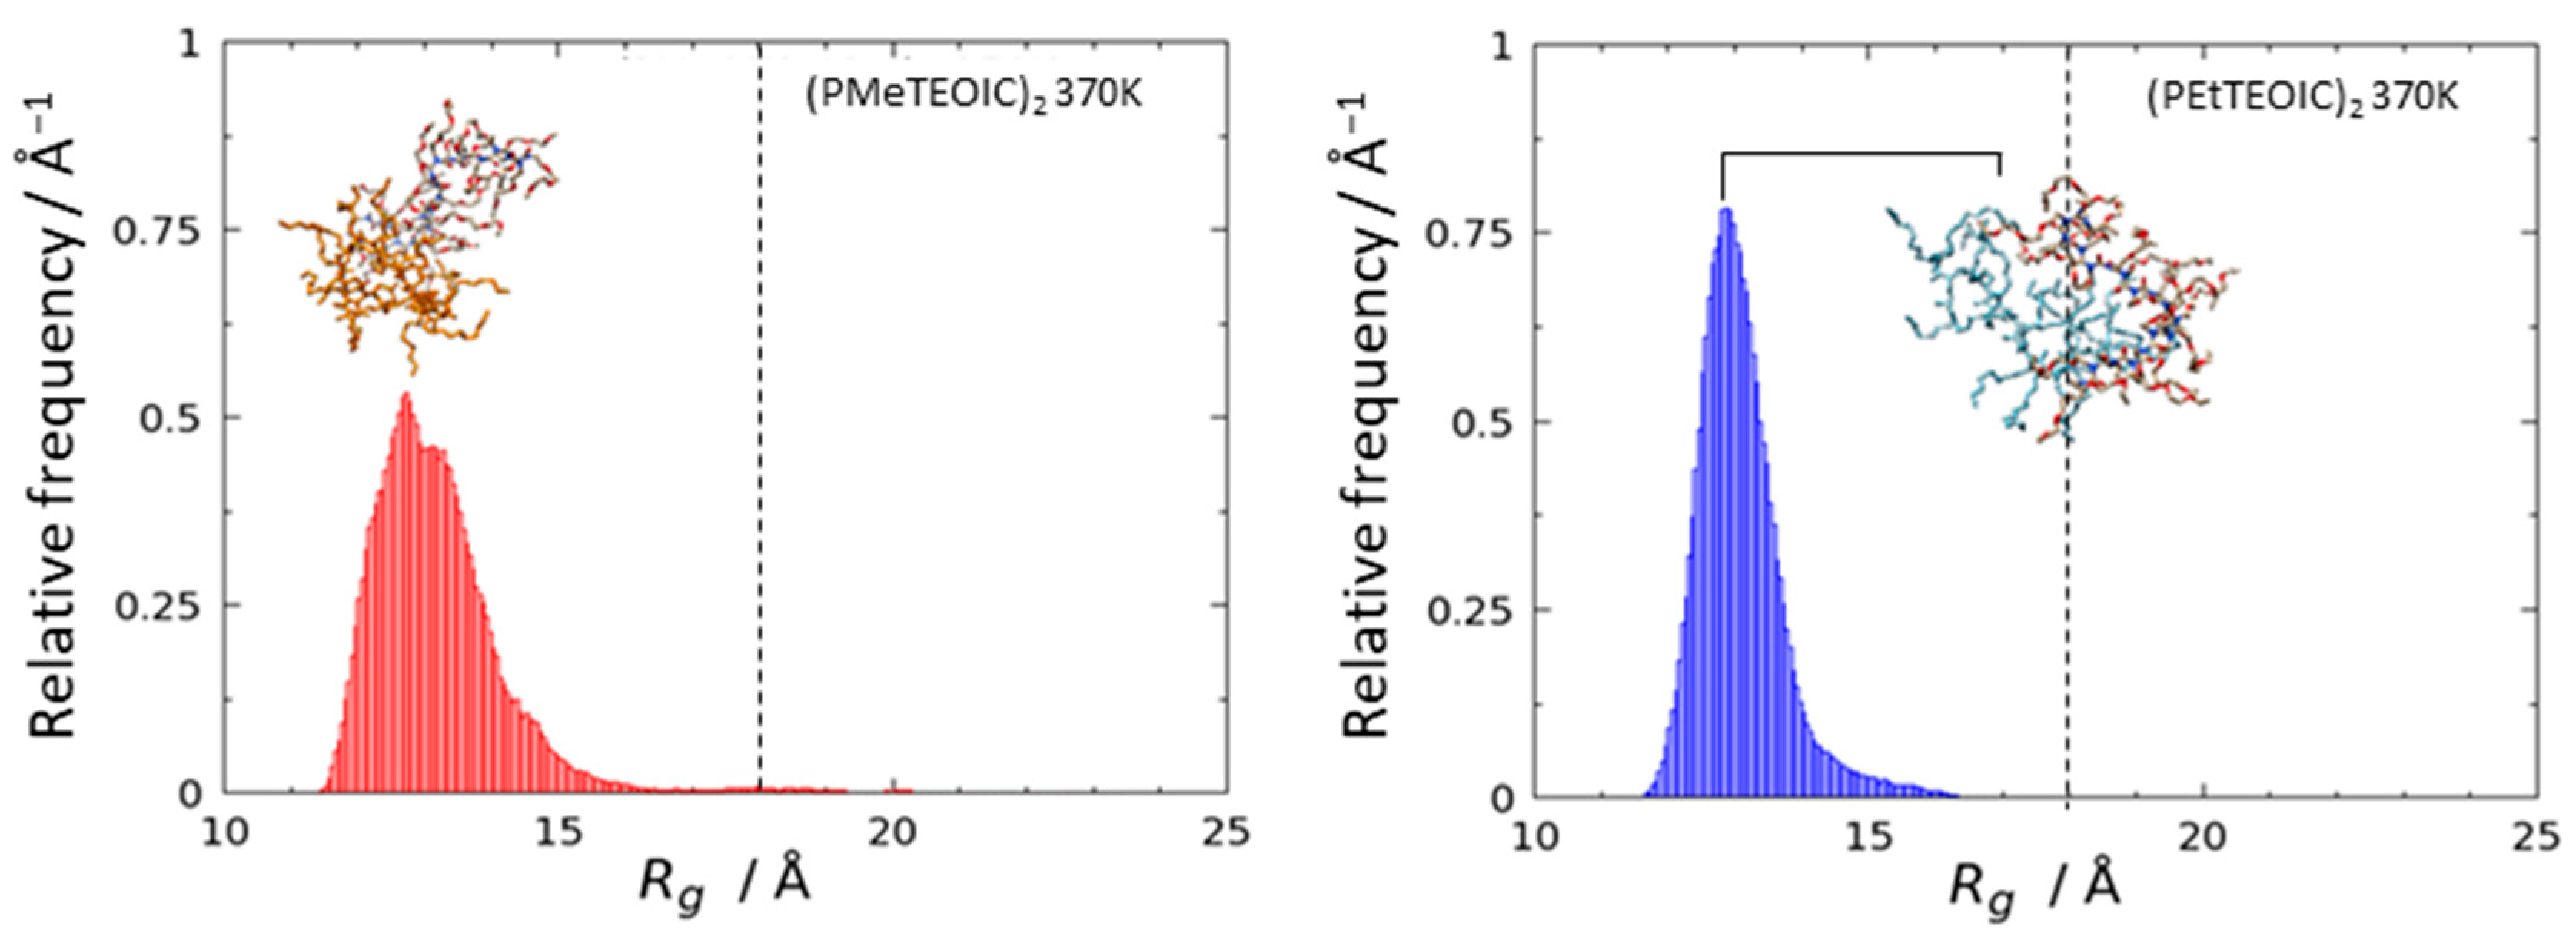
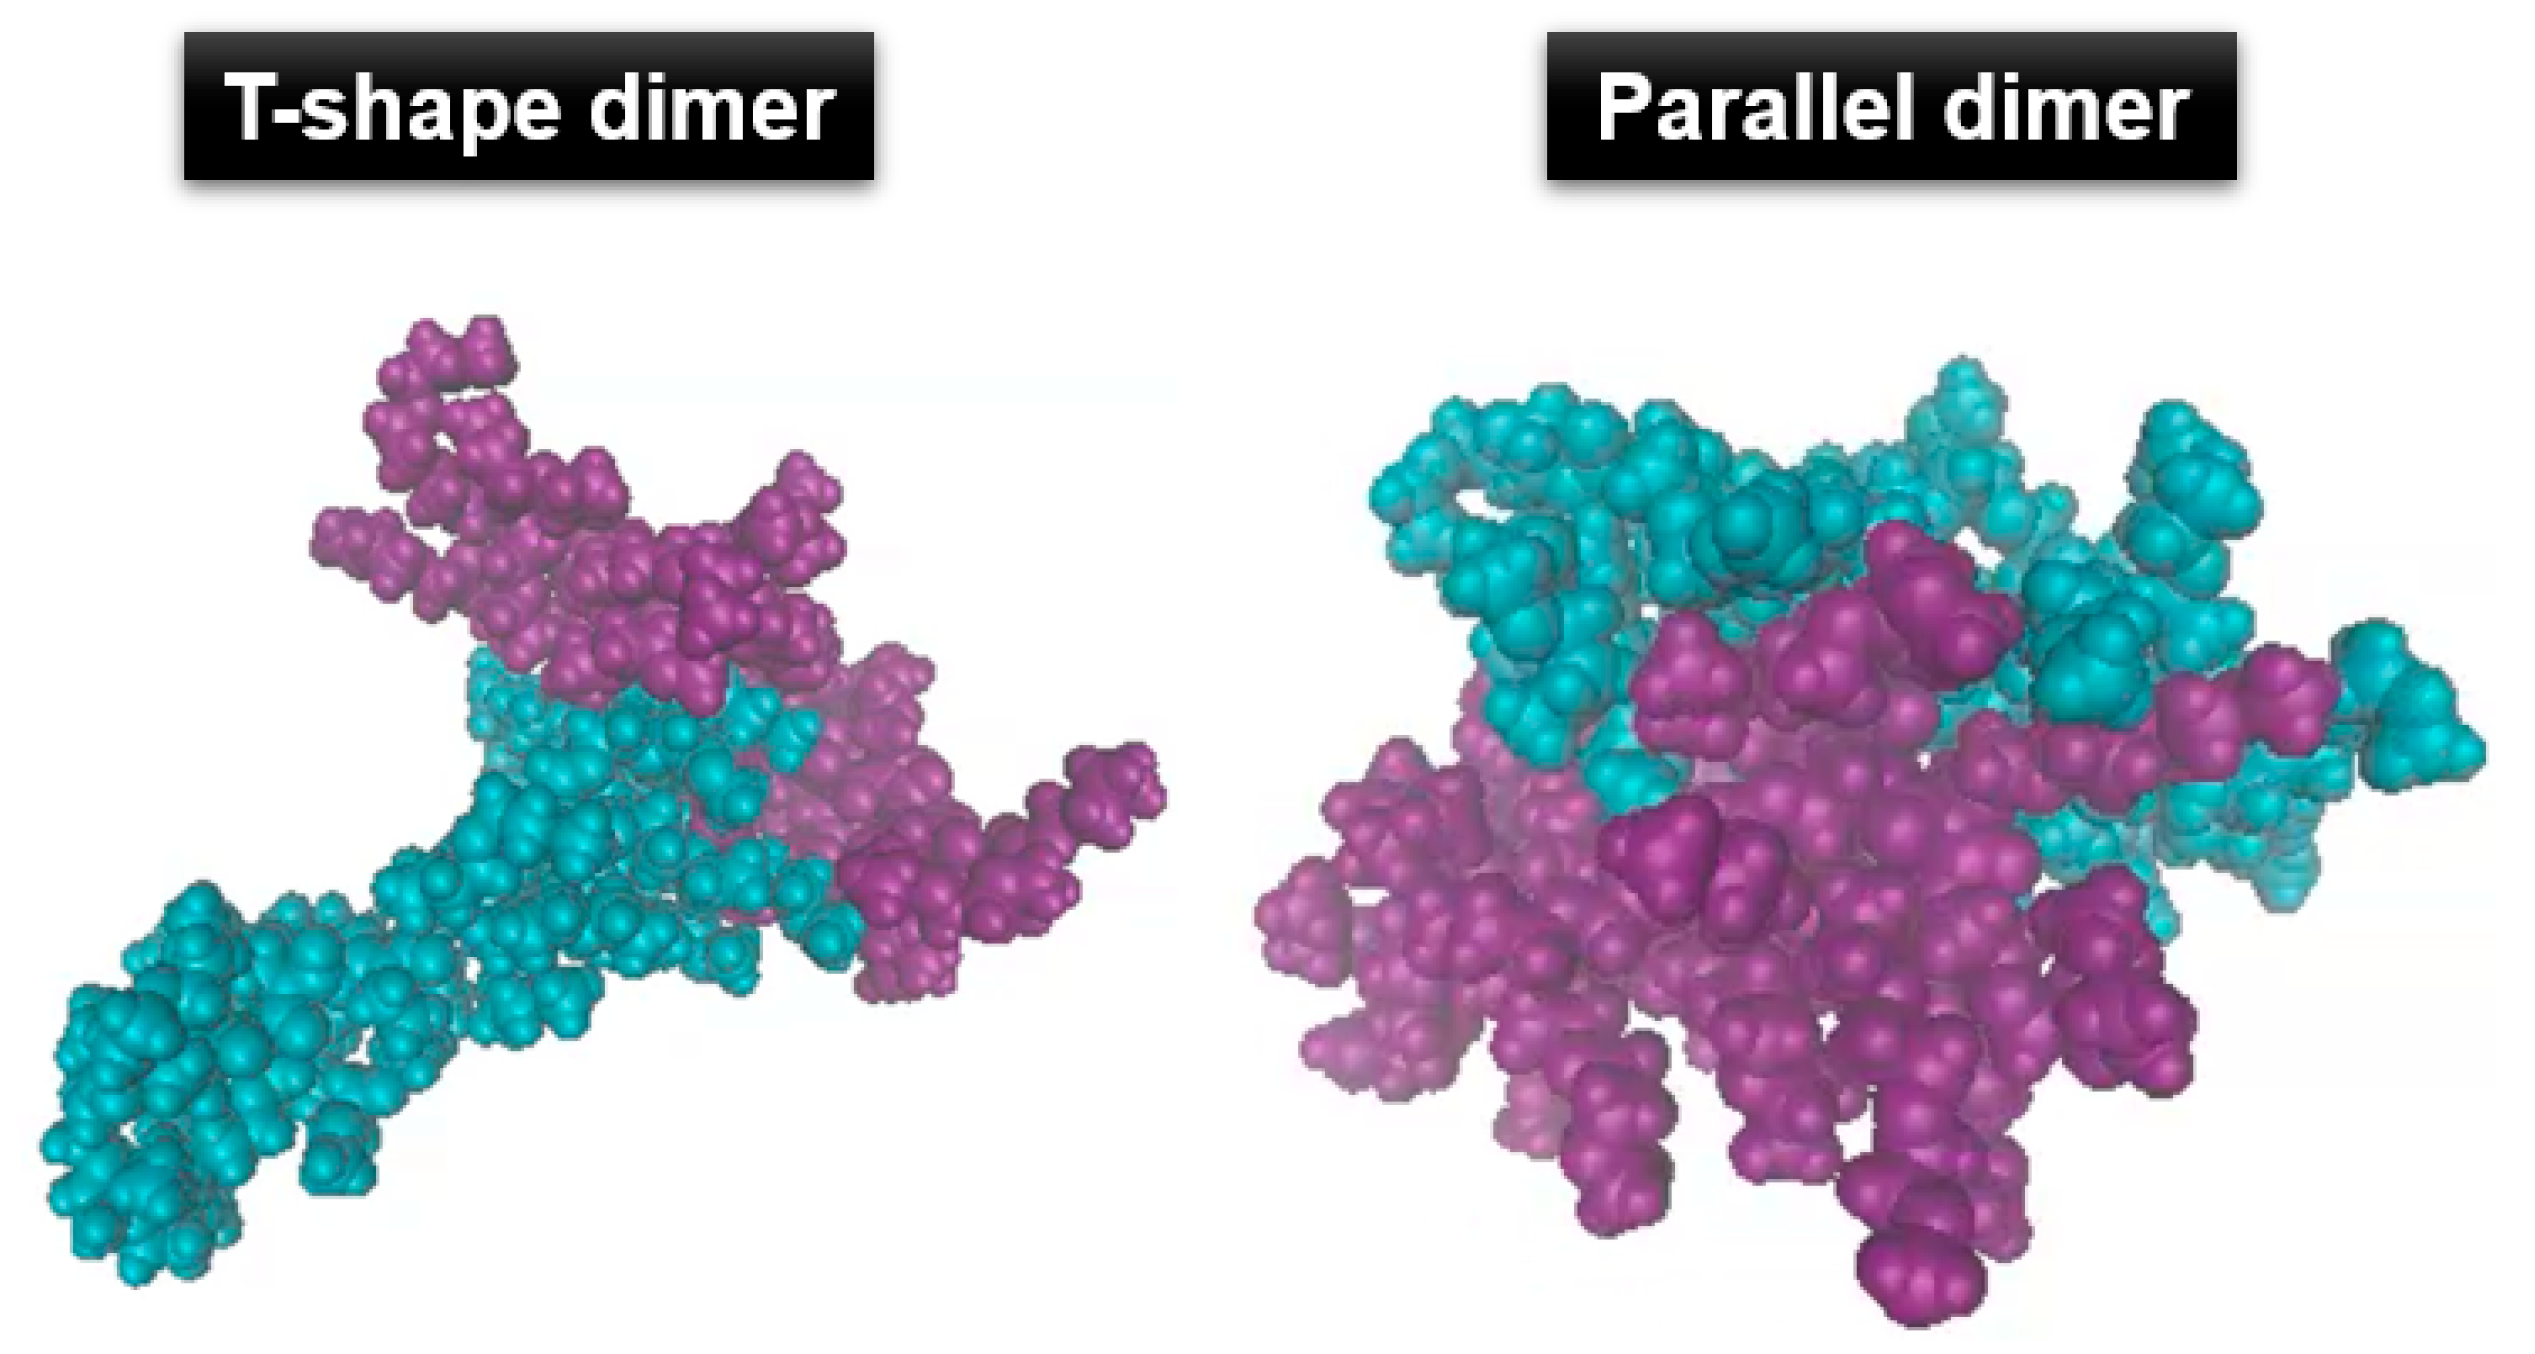
3.2. Agglomeration of (PRTEOIC)2

To investigate the agglomeration behavior of the bimolecular polymer chains, MD simulations were performed to determine the change in Rg over time from the center of gravity of (PRTEOIC)2, which was used to calculate the Rg distribution, as shown in Figure 2, Figure 3 and Figure 4. Snapshots of the bimolecular chains corresponding to each peak are also shown in these figures. Figure 2 shows the Rg distributions at 288 K, at which the two polyisocyanates are both soluble in water. The Rg distribution was broad, with several peaks for both (PMeTEOIC)2 and (PEtTEOIC)2. The peaks below 13 Å can be attributed to the bimolecular chains in bound states, while the peaks above 18 Å can be attributed to the bimolecular chains in dissociated states. Both polymers were in bond–dissociation equilibrium. Furthermore, (PMeTEOIC)2 had an Rg peak at about 20 Å that was absent in (PEtTEOIC)2, thus indicating that the polymers separated more in (PMeTEOIC)2 than in (PEtTEOIC)2.
Figure 3 shows the Rg distributions at 343 K, at which (PMeTEOIC)2 is soluble and (PEtTEOIC)2 is insoluble in water. Both distributions had a peak around 13 Å, but (PMeTEOIC)2 had a broad peak, whereas (PEtTEOIC)2 had a sharp peak. In addition, the distribution for (PMeTEOIC)2 had a tail around 17 Å. The agglomeration structures of (PMeTEOIC)2 and (PEtTEOIC)2 were parallel around 13 Å, while that of (PMeTEOIC)2 was T-shaped around 17 Å.
Figure 4 shows the Rg distributions at 370 K, at which both (PMeTEOIC)2 and (PEtTEOIC)2 are insoluble. The tail due to the T-shaped agglomeration of (PMeTEOIC)2 that was observed at 343 K disappeared, while the distribution of (PEtTEOIC)2 remained similar to that at 343 K. The snapshots show that both agglomerations had parallel shapes.
In summary, the Rg distributions were broad with multiple peaks; this suggests that the two molecules moved freely below the LCST and that the peaks sharpened near the LCST. Above the LCST, the peaks remained sharp, which suggests that the agglomeration of (PRTEOIC)2 stabilized. The temperature responses of these Rg distributions are consistent with an LCST-type temperature response in which a polymer aggregates and the solution becomes cloudy at high temperatures.
Figure 5 shows the T-shaped aggregates observed only in (PMeTEOIC)2 at 343 K. At this temperature, PMeTEOIC was dispersed in the aqueous solution and formed small aggregates that scattered light, which reduced the transmittance. The T-shaped dimer may be the basic structure of this small metastable aggregate. This raises the question of why the metastable T-shaped dimer was only observed in (PMeTEOIC)2. An interesting study on the structure of the benzene dimer may help answer this question. Miyazaki and Fujii et al. performed detailed spectroscopic measurements of supersonic jets and showed that benzene dimers have a T-shaped structure in the ground electronic state and a parallel sandwich structure in the excimer state [38]. The main difference between the ground state and excimer state is the charge distribution on each atom. These results suggest that a change in charge distribution affects the balance between the Coulomb force and London dispersion force, which changes the dimer structure. In this study, we used the MD simulation data to analyze the electrostatic energy and van der Waals energy, which are related to intermolecular interactions between polymer chains. The distributions of the electrostatic and van der Waals energies calculated for two polymer chains are shown in Supplementary Materials Figures S7 and S8.
At 283 K, the electrostatic energy (Eelec) was about 1280 kcal/mol for (PMeTEOIC)2 and about 1320 kcal/mol for (PEtTEOIC)2. The van der Waals energy (EvdW) was about −370 kcal/mol for (PMeTEOIC)2 and about −440 kcal/mol for (PEtTEOIC)2 (Supplementary Materials Tables S2 and S3). The absolute values of Eelec and EvdW were larger for (PEtTEOIC)2 than for (PMeTEOIC)2, and this trend remained unchanged with the increasing temperature. Even at lower temperatures, (PEtTEOIC)2 had greater intermolecular interactions than (PMeTEOIC)2, suggesting that it is more prone to agglomeration.
Table 1 summarizes the ratio of the electrostatic energy to the van der Waals energy (|Eelec/EvdW|). Errors were estimated from the full width at half maximum for each energy distribution. The ratios of (PMeTEOIC)2 and (PEtTEOIC)2 were significantly different, which may explain why the metastable T-shaped agglomeration pair was only observed in (PMeTEOIC)2.

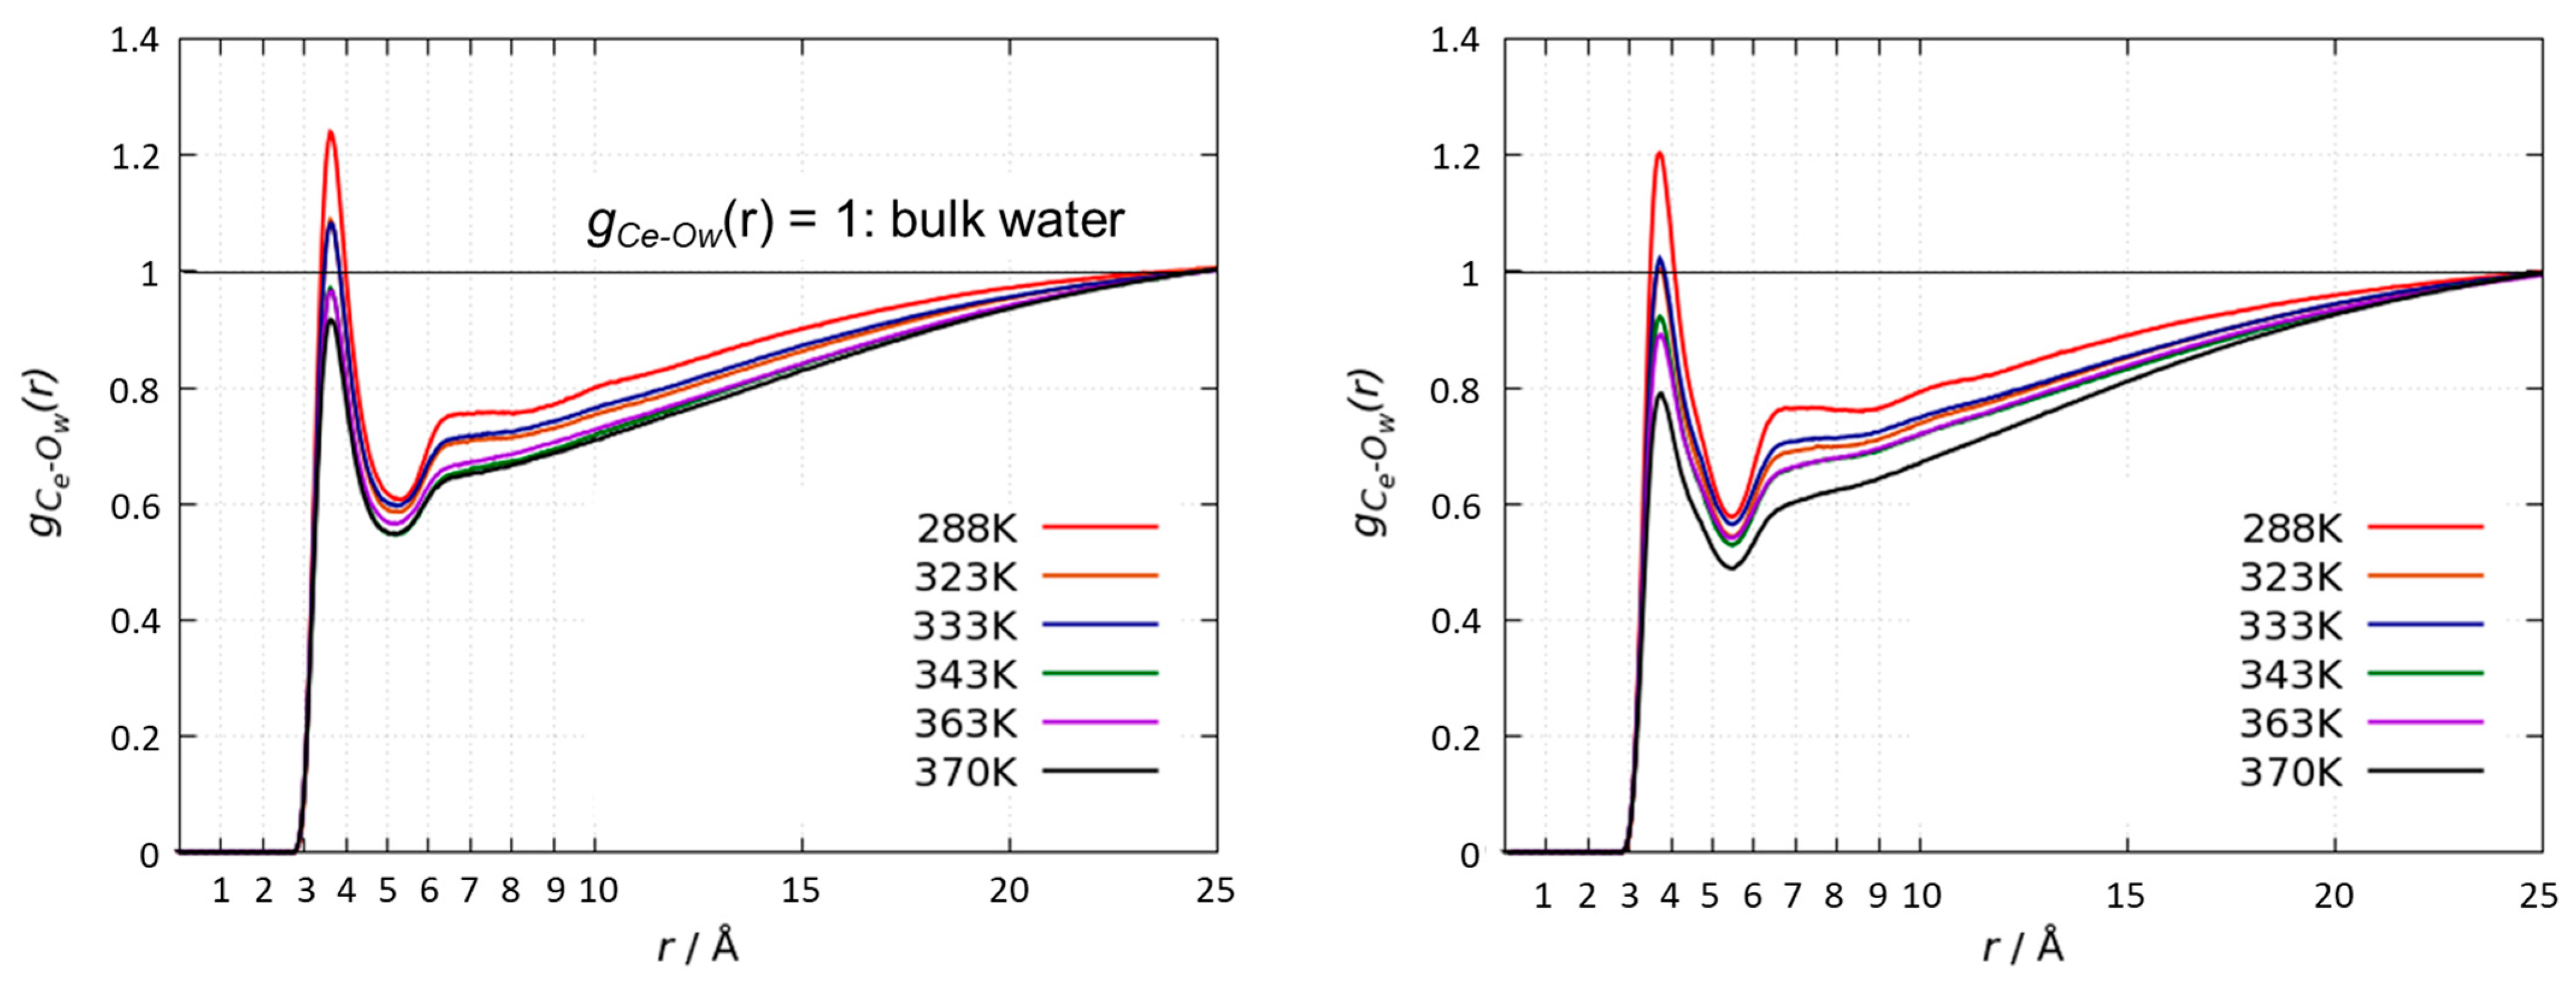
3.3. Radial Distribution Functions of Water Molecules around the PRTEOIC Dimer

To investigate the effect of temperature on the water molecules surrounding the polymer chains, we analyzed the RDF of the water oxygen atoms from the terminal carbon atoms of the side chain of PRTEOIC ( g C e O w ( r ) ), which we used to estimate the peak intensity of the first hydrophobic hydration shell, as shown in Figure 6. This analysis was normalized to g C e O w ( r ) = 1 at 25 Å, where the presence of the polymer had a negligible effect on the density of water. Around the terminal carbon atoms of the polymer side chains, the first hydration shells formed at around 3.6 Å. At even longer distances, the multiple tri(ethylene oxide) side chains were densely attached to the main chain, which prevented water molecules from entering the periphery of the side chain and resulted in a density of less than unity. For the peaks of the first hydrophobic hydration shell of (PMeTEOIC)2 and (PEtTEOIC)2, both peak intensities decreased with the increasing temperature and fell below g C e O w ( r ) = 1 (corresponding to the bulk water density) at different temperatures. At all temperatures, the hydrophobic hydration shell of (PEtTEOIC)2 had a lower peak intensity than that of (PMeTEOIC)2. Figure 7 plots the peak intensities for the first hydrophobic hydration shells of (PRTEOIC)2 and (RTEO)2 against the temperature. TCRP (i.e., the temperature at which the peak intensity intersected the bulk water value of g C e O w ( r ) = 1 ) was 358 K for (PMeTEOIC)2 and 322 K for (PEtTEOIC)2. These temperatures are close to the cloud point temperatures of 353 K for PMeTEOIC and 308 K for PEtTEOIC.
For (RTEO)2, which showed no agglomeration in the turbidity measurements, the peak intensity of the first hydrophobic hydration shell was much higher than g C e O w ( r ) = 1 at all temperatures because more water molecules were involved in the solvation around the solute. The Rg distributions of (RTEO)2 in aqueous solution at 288, 343, and 370 K are presented in Supplementary Materials Figure S1. For both (MeTEO)2 and (EtTEO)2, the broad shape of the Rg distribution was almost the same at all temperatures. There was a small peak near 5 Å, which means that the two molecules were temporarily close to each other. However, because the main peak was around 14 Å, the two molecules mostly remained apart. Therefore, no stable dimer structure formed in the (RTEO)2 bimolecular system at any temperature, thus indicating that RTEO is not temperature-responsive.
Aqueous solutions of poly(ethylene oxide) with a high molecular weight are known to exhibit an LCST around 373 K [39], whereas aqueous solutions of oligo(ethylene oxide) with a low molecular weight do not exhibit an LCST-type phase transition. In our MD simulations, the RTEO bimolecular chain did not form a stable dimer. This is because RTEO chains with low molecular weights form a strong hydrophobic hydration shell around their alkyl groups, and the density of this strong hydrophobic shell did not fall below the density of bulk water even at higher temperatures. Therefore, the peak intensity of the first hydrophobic hydration shells did not fall below g C e O w ( r ) = 1 even at higher temperatures. This result further explains why the RTEO bimolecular system did not exhibit an LCST-type phase transition.
For comb-type polymers with many tri(ethylene oxide) side chains attached to the main polymer chain, water molecules were excluded from the RTEO periphery because the space around the side chains where water molecules can enter was reduced. This weakened the hydrophobic hydration shell around the terminal alkyl group of the side chain. With increasing temperature, this weakened hydration shell was further degraded by dehydration and became more hydrophobic than the bulk water. At this point, the LCST phase transition occurred.
These results indicate that, for comb-type amphiphilic polymers with terminal alkyl groups on the side chains, the LCST can generally be predicted by determining the crossing point where the density of water molecules in the hydrophobic hydration shell intersects the density of bulk water (i.e., g C e O w ( r ) = 1 ).

4. Conclusions

The analysis of Rg for the main and side chains of PRTEOIC monomers revealed no temperature dependence. Therefore, the coil–globule structural transition does not take place and does not contribute to the LCST phase transition in PRTEOIC, as expected. The analysis of Rg for the bimolecular chains showed that (PRTEOIC)2 showed a tendency for the molecular chains to aggregate with increasing temperature, which reproduced the experimental results of the turbidity measurements. At 343 K, which was slightly below the LCST for (PMeTEOIC)2, (PEtTEOIC)2 formed only stable parallel dimers, whereas (PMeTEOIC)2 formed parallel dimers and metastable T-shape dimers. This metastable T-shape dimer may be the reason why the transmittance was not 100% but ca. 95% at 343 K in the turbidity measurements for (PMeTEOIC)2. The hydrophobic hydration shells around the alkyl groups at the ends of the side chains were analyzed. We found that the crossing temperature (TCRP) at which the first hydrophobic hydration shell around the alkyl group at the side chain end is equal to the bulk water density correlates well with the cloud point temperature (TCLP). This result indicates that the hydrophobicity around the terminal alkyl groups of the side chain is close to the hydrophobicity of the whole polymer surface. Our results for the MD simulations provide the basis for the understanding of rod-type temperature-responsive polymers and design guidelines.

Supplementary Materials

The following supporting information can be downloaded at https://www.mdpi.com/article/10.3390/macromol3030036/s1, Figure S1: Transmittance versus temperature plots of 40 g L−1 aqueous PMeTEOIC and PEtTEOIC solutions. The data were recorded at 400 nm, at a heating rate of 1 K, reproduced from Reference [30] in the main text; Table S1: Water numbers, molecular weight of polymers, and the concentrations of polymers; Figure S2: The chemical structure of PRTEOIC, with the numbering of atoms which compose the dihedral angles in the polymer main chain; Figure S3: Distributions of dihedral angles ( δ C1-N1-C2-O1 δ O10-C20-N11-C21) in the main chain of PMeTEOIC at 363 K; Figure S4: Distributions of dihedral angles ( δ C21-N11-C22-O11 δ C39-N20-C40-O20) in the main chain of PMeTEOIC at 363 K; Figure S5: The side-chain end-to-end distances for PMeTEOIC (left) and PEtTEOIC (right) at 288 K, 343 K, and 370 K for 200 ns; Figure S6: Potential Energy Surface (PES), along with the rotation of MeTEOIC3 main chain, was shown. Horizonal axis is the dihedral angle ( δ c-n-c-o), which consists of four atoms in trimer backbone. The calculations were conducted at B3LYP/6-31G(d) level; Figure S7: Distributions of Van der Waals energy (EVDW) for (PMeTEOIC)2 (left) and (PEtTEOIC)2 (Right) at six temperatures from 288 K to 370 K; Figure S8: Distributions of electrostatic energy (EELEC) for (PMeTEOIC)2 (left) and (PEtTEOIC)2 (Right) at six temperatures from 288 K to 370 K; Figure S9: Rg distributions of (MeTEO)2 (left) and (EtTEO)2 (right) in water at 288, 343, and 370K; Table S2: Electrostatic energy for (PRTEOIC)2 at six temperatures; Table S3: Van der Waals energy for (PRTEOIC)2 at six temperatures. Reference [30] is cited in the Supplementary Materials.

Author Contributions

Conceptualization, S.M. and S.-i.S.; validation, S.M. and S.-i.S.; formal analysis, S.M. and S.K.; investigation, S.M.; resources, N.S.; data curation, S.M. and S.K.; writing—original draft preparation, S.M.; writing—review and editing, T.Y., A.K., T.K. and S.-i.S. All authors have read and agreed to the published version of the manuscript.

Funding

The authors are grateful for the financial support from Grants-in-Aid for Scientific Research C (17K05025).

Institutional Review Board Statement

Not applicable.

Informed Consent Statement

Not applicable.

Data Availability Statement

The data presented in this study are available on request from the corresponding author.

Acknowledgments

The authors thank Takuya Uto and Toshifumi Yui at Miyazaki University for their kind help and technical advice regarding the MD simulations. The computations were partly performed at the Research Center for Computational Science, Okazaki, Japan; and by using the Intercloud system at the Information Initiative Center of Hokkaido University, Sapporo, Japan.

Conflicts of Interest

The authors declare no conflict of interest.

References

  1. Crespy, D.; Rossi, R.M. Temperature-Responsive Polymers with LCST in the Physiological Range and Their Applications in Textiles. Polym. Int. 2007, 56, 1461–1468. [Google Scholar] [CrossRef]
  2. Baba, S.; Enomoto, Y.; Duan, Q.; Kiba, T.; Kakuchi, T.; Sato, S.-I. Temperature-Sensitive Association Properties of End-Functionalized Poly(N-Isopropylacrylamide) in Dilute Aqueous Solutions. Mol. Cryst. Liq. Cryst. 2009, 505, 247–256. [Google Scholar] [CrossRef]
  3. Duan, Q.; Narumi, A.; Miura, Y.; Shen, X.; Sato, S.-I.; Satoh, T.; Kakuchi, T. Thermoresponsive Property Controlled by End-Functionalization of Poly(N-Isopropylacrylamide) with Phenyl, Biphenyl, and Triphenyl Groups. Polym. J. 2006, 38, 306–310. [Google Scholar] [CrossRef]
  4. Chiessi, E.; Paradossi, G. Influence of Tacticity on Hydrophobicity of Poly(N-Isopropylacrylamide): A Single Chain Molecular Dynamics Simulation Study. J. Phys. Chem. B 2016, 120, 3765–3776. [Google Scholar] [CrossRef] [PubMed]
  5. Winnik, F.M. Fluorescence Studies of Aqueous Solutions of Poly(N-Isopropylacrylamide) below and above Their LCST. Macromolecules 1990, 23, 233–242. [Google Scholar] [CrossRef]
  6. Farinha, J.P.S.; Piçarra, S.; Miesel, K.; Martinho, J.M.G. Fluorescence Study of the Coil-Globule Transition of a PEO Chain in Toluene. J. Phys. Chem. B 2001, 105, 10536–10545. [Google Scholar] [CrossRef]
  7. Susana Piçarra, P.R.; Afonso, C.A.M.; Martinho, J.M.G.; Farinha, J.P.S. Coil-Globule Transition of Poly(Dimethylacrylamide): Fluorescence and Light Scattering Study. Macromolecules 2003, 36, 8119–8129. [Google Scholar] [CrossRef]
  8. Kubota, K.; Fujishige, S.; Ando, I. Single-Chain Transition of Poly(N-Isopropylacrylamide) in Water. J. Phys. Chem. 1990, 94, 5154–5158. [Google Scholar] [CrossRef]
  9. Wang, X.; Wu, C. Light-Scattering Study of Coil-to-Globule Transition of a Poly(N-Isopropylacrylamide) Chain in Deuterated Water. Macromolecules 1999, 32, 4299–4301. [Google Scholar] [CrossRef]
  10. Lessard, D.G.; Ousalem, M.; Zhu, X.X.; Eisenberg, A.; Carreau, P.J. Study of the Phase Transition of Poly(N,N-Diethylacrylamide) in Water by Rheology and Dynamic Light Scattering. J. Polym. Sci. Part B Polym. Phys. 2003, 41, 1627–1637. [Google Scholar] [CrossRef]
  11. Yanase, K.; Buchner, R.; Sato, T. Microglobule Formation and a Microscopic Order Parameter Monitoring the Phase Transition of Aqueous Poly(N-Isopropylacrylamide) Solution. Phys. Rev. Mater. 2018, 2, 85601. [Google Scholar] [CrossRef]
  12. Lerch, A.; Käfer, F.; Prévost, S.; Agarwal, S.; Karg, M. Structural Insights into Polymethacrylamide-Based LCST Polymers in Solution: A Small-Angle Neutron Scattering Study. Macromolecules 2021, 54, 7632–7641. [Google Scholar] [CrossRef]
  13. Deshmukh, S.A.; Sankaranarayanan, S.K.R.S.; Suthar, K.; Mancini, D.C. Role of Solvation Dynamics and Local Ordering of Water in Inducing Conformational Transitions in Poly(N-Isopropylacrylamide) Oligomers through the LCST. J. Phys. Chem. B 2012, 116, 2651–2663. [Google Scholar] [CrossRef] [PubMed]
  14. Tavagnacco, L.; Zaccarelli, E.; Chiessi, E. On the Molecular Origin of the Cooperative Coil-to-Globule Transition of Poly(N-Isopropylacrylamide) in Water. Phys. Chem. Chem. Phys 2018, 20, 9997–10010. [Google Scholar] [CrossRef]
  15. Futscher, M.H.; Philipp, M.; Müller-Buschbaum, P.; Schulte, A. The Role of Backbone Hydration of Poly(N-Isopropyl Acrylamide) Across the Volume Phase Transition Compared to Its Monomer. Sci. Rep. 2017, 7, 17012. [Google Scholar] [CrossRef]
  16. Tonelli, A.E. Conformational Characteristics of the Poly(n-Alkyl Isocyanates). Macromolecules 1974, 7, 628–631. [Google Scholar] [CrossRef]
  17. Cook, R. Flexibility in Rigid Rod Poly(n-Alkyl Isocyanates). Macromolecules 1987, 20, 1961–1964. [Google Scholar] [CrossRef]
  18. Young, J.A.; Cook, R.C. Helix Reversal Motion in Polyisocyanates. Macromolecules 2001, 34, 3646–3653. [Google Scholar] [CrossRef]
  19. Mayer, S.; Zentel, R. Chiral Polyisocyanates, a Special Class of Helical Polymers. Prog. Polym. Sci. 2001, 26, 1973–2013. [Google Scholar] [CrossRef]
  20. Ute, K.; Fukunishi, Y.; Jha, S.K.; Cheon, K.-S.; Muñ Oz, B.; Hatada, K.; Green, M.M. Dynamic NMR Determination of the Barrier for Interconversion of the Left-and Right-Handed Helical Conformations in a Polyisocyanate. Macromolecules 1999, 32, 1304–1307. [Google Scholar] [CrossRef]
  21. Green, M.M.; Peterson, N.C.; Sato, T.; Teramoto, A.; Cook, R.; Shneior, L. A Helical Polymer with a Cooperative Response to Chiral Information. Science 1995, 268, 1860–1866. [Google Scholar] [CrossRef]
  22. Green, M.M.; Gross, R.A.; Crosby, C., III; Schilling, F.C. Macromolecular Stereochemistry: The Effect of Pendant Group Structure on the Axial Dimension of Polyisocyanates. Macromolecules 1987, 20, 992–999. [Google Scholar] [CrossRef]
  23. Berger, M.N.; Tidswell, B.M. Dilute Solution Viscosity and Conformation of Poly-n-Hexyl Isocyanate. J. Polym. Sci. Polym. Symp. 1973, 42, 1063–1075. [Google Scholar] [CrossRef]
  24. Murakami, H.; Norisuye, T.; Fujita, H. Dimensional and Hydrodynamic Properties of Poly(Hexyl Isocyanate) in Hexane. Macromolecules 1980, 13, 345–352. [Google Scholar] [CrossRef]
  25. Conio, G.; Bianchi, E.; Ciferri, A.; Krigbaum, W.R. Mesophase Formation by Semirigid Polymers: Poly(n-Hexyl Isocyanate) in Dichloromethane and Toluene. Macromolecules 1984, 17, 856–861. [Google Scholar] [CrossRef]
  26. Cook, R.; Johnson, R.D.; Wade, C.G.; O’Leary, D.J.; Munoz, B.; Green, M.M. Solvent Dependence of the Chain Dimensions of Poly(n-Hexyl Isocyanate). Macromolecules 1990, 23, 3454–3458. [Google Scholar] [CrossRef]
  27. Pica, A.; Graziano, G. On the Effect of Sodium Salts on the Coil-to-Globule Transition of Poly(N-Isopropylacrylamide). Phys. Chem. Chem. Phys. 2015, 17, 27750–27757. [Google Scholar] [CrossRef]
  28. Pica, A.; Graziano, G. Effect of Sodium Thiocyanate and Sodium Perchlorate on Poly(: N -Isopropylacrylamide) Collapse. Phys. Chem. Chem. Phys. 2019, 22, 189–195. [Google Scholar] [CrossRef]
  29. Case, D.A.; Babin, V.; Berryman, J.T.; Betz, R.M.; Cai, Q.; Cerutti, D.S.; Cheatham, T.E., III; Darden, T.A.; Duke, R.E.; Gohlke, H.; et al. Amber14 2014, AMBER 14; University of California: San Francisco, CA, USA, 2014. [Google Scholar]
  30. Sakai, N.; Jin, M.; Sato, S.I.; Satoh, T.; Kakuchi, T. Synthesis of Water-Soluble Polyisocyanates with the Oligo(Ethylene Glycol) Side-Chain as New Thermoresponsive Polymers. Polym. Chem. 2014, 5, 1057–1062. [Google Scholar] [CrossRef]
  31. Jakalian, A.; Bruce, L.; Bush, D.B.; Jack, C.I.B. Fast, Efficient Generation of High-Quality Atomic Charges. AM1-BCC Model: I. Method. Comput. Chem. 2000, 21, 132–146. [Google Scholar] [CrossRef]
  32. Wang, J.; Wang, W.; Kollman, P.A.; Case, D.A. Automatic Atom Type and Bond Type Perception in Molecular Mechanical Calculations. J. Mol. Graph. Model. 2006, 25, 247–260. [Google Scholar] [CrossRef] [PubMed]
  33. Wang, J.; Wolf, R.M.; Caldwell, J.W.; Kollman, P.A.; Case, D.A. Development and Testing of a General AMBER Force Field. J. Comput. Chem. 2004, 25, 1157–1174. [Google Scholar] [CrossRef] [PubMed]
  34. Darden, T.; York, D.; Pedersen, L. Particle Mesh Ewald: An N⋅Log(N) Method for Ewald Sums in Large Systems. J. Chem. Phys. 1993, 98, 10089. [Google Scholar] [CrossRef]
  35. Dalgakiran, E.; Tatlipinar, H. The Role of Hydrophobic Hydration in the LCST Behaviour of POEGMA300by All-Atom Molecular Dynamics Simulations. Phys. Chem. Chem. Phys. 2018, 20, 15389–15399. [Google Scholar] [CrossRef]
  36. Dalgakiran, E.; Tatlipinar, H. Atomistic Insights on the LCST Behavior of PMEO2MA in Water by Molecular Dynamics Simulations. J. Polym. Sci. Part B Polym. Phys. 2018, 56, 429–441. [Google Scholar] [CrossRef]
  37. Frisch, M.J.; Trucks, G.W.; Schlegel, H.B.; Scuseria, G.E.; Robb, M.A.; Cheeseman, J.R.; Scalmani, G.; Barone, V.; Petersson, G.A.; Nakatsuji, H.; et al. Gaussian 16, Revision, C.01; Gaussian, Inc.: Wallingford, CT, USA, 2016. [Google Scholar]
  38. Miyazaki, M.; Fujii, M. Real Time Observation of the Excimer Formation Dynamics of a Gas Phase Benzene Dimer by Picosecond Pump-Probe Spectroscopy. Phys. Chem. Chem. Phys. 2015, 17, 25989–25997. [Google Scholar] [CrossRef]
  39. Matsuyama, A.; Tanaka, F. Theory of Solvation-Induced Reentrant Phase Separation in Polymer Solutions. Phys. Rev. Lett. 1990, 65, 341–344. [Google Scholar] [CrossRef]
Scheme 1. Chemical structures of PRTEOIC and RTEO (R = CH3, C2H5).
Macromol 03 00036 sch001
Figure 1. (a) Rg changes up to 200 ns of simulation time for the whole single polymer chain of PMeTEOIC (left) and PEtTEOIC (right) at 288 K, 343 K, and 370 K. (b) Rg values for the whole single polymer chain of PMeTEOIC (red) and PEtTEOIC (blue) vs. temperature.
Macromol 03 00036 g001
Figure 2. Rg distributions of (PMeTEOIC)2 (left) and (PEtTEOIC)2 (right) in water at 288 K. The dashed line shows the borderline of the agglomerated state and the dissociated state.
Macromol 03 00036 g002
Figure 3. Rg distributions of (PMeTEOIC)2 (left) and (PEtTEOIC)2 (right) in water at 343 K. The dashed line shows the borderline of the agglomerated state and the dissociated state.
Macromol 03 00036 g003
Figure 4. Rg distributions of (PMeTEOIC)2 (left) and (PEtTEOIC)2 (right) in water at 370 K. The dashed line shows the borderline of the agglomerated state and the dissociated state.
Macromol 03 00036 g004
Figure 5. Snapshots of the T-shaped (left) and parallel (right) (PMeTEOIC)2 aggregates at 343 K.
Macromol 03 00036 g005
Figure 6. Radial distribution functions of water oxygen atoms measured from carbon atoms at the side-chain ends: (left), (PMeTEOIC)2; and (right), (PEtTEOIC)2.
Macromol 03 00036 g006
Figure 7. Intensities of the first hydrophobic hydrated shell against temperature—(PEtTEOIC)2 = blue, (PMeTEOIC)2 = red, (MeTEO)2 = pink, and (EtTEO)2 = green.
Macromol 03 00036 g007
Table 1. Ratio of electrostatic energy to van der Waals energy (|Eelec/EvdW|) at six temperatures.
Polymer Chains|Eelec/EvdW| μ  1 σ  2
283 K323 K333 K343 K363 K370 K
(PMeTEOIC)23.45 ± 0.273.17 ± 0.283.31 ± 0.293.24 ± 0.313.23 ± 0.283.15 ± 0.033.260.10
(PEtTEOIC)22.99 ± 0.223.15 ± 0.233.06 ± 0.252.91 ± 0.283.16 ± 0.352.99 ± 0.013.040.09
1 Value of Eelec averaged over six temperatures. 2 Standard deviation of Eelec at six temperatures.
Disclaimer/Publisher’s Note: The statements, opinions and data contained in all publications are solely those of the individual author(s) and contributor(s) and not of MDPI and/or the editor(s). MDPI and/or the editor(s) disclaim responsibility for any injury to people or property resulting from any ideas, methods, instructions or products referred to in the content.

