Article

Reference Intervals and Clinical Utility of Acute Phase Proteins and Serum Proteins Electrophoresis in the Hamadryas Baboon (Papio hamadryas)

by
Megan L. Cabot
1,2,3,*,
Nicholas G. Dannemiller
1,2,3,
Carolyn Cray
4 and
Larry J. Minter
1,2,3
1
Department of Clinical Sciences, North Carolina State University, Raleigh, NC 27606, USA
2
North Carolina Zoo, Asheboro, NC 27205, USA
3
Environment Medicine Consortium, North Carolina State University, Raleigh, NC 27695, USA
4
Division of Comparative Pathology, University of Miami Miller School of Medicine, Miami, FL 33136, USA
*
Author to whom correspondence should be addressed.
J. Zool. Bot. Gard. 2023, 4(1), 108-117; https://doi.org/10.3390/jzbg4010012
Submission received: 28 October 2022 / Revised: 5 January 2023 / Accepted: 26 January 2023 / Published: 3 February 2023
(This article belongs to the Special Issue Innovative Techniques Used to Improve Animal Health and Welfare)

Abstract

:
Measurements of specific acute phase proteins (APP) and protein electrophoresis (EPH) fractions have been widely used to better assess the health of species under managed care across numerous taxa. To date, APP assays have not been validated in the hamadryas baboon (Papio hamadryas), and reference intervals have not yet been established. This information is critical for the interpretation of APP and EPH measurements used in the diagnosis of inflammatory diseases during routine veterinary care of this species. To obtain this information, banked serum samples from hamadryas baboons of various age, sex, and health status, under managed care at the North Carolina Zoo, were analyzed. A small pilot study found significantly higher serum amyloid A (SAA) and C-reactive protein (CRP) but not haptoglobin in baboons with acute inflammation compared to healthy counterparts, so these two APPs were investigated further. Reagents for serum amyloid A (SAA) and C-reactive protein (CRP) were validated, although differences in CRP reagents were observed. Based on the results of this study, SAA and CRP were defined as major APPs that were significantly increased in baboons with active inflammation or infection compared to healthy conspecifics. Baboons with acute inflammation additionally had significantly higher gamma globulins compared to healthy baboons. Although mean albumin concentrations were lower in baboons with acute inflammation, the difference from healthy baboons was not statistically significant. This study identifies SAA, CRP, and EPH as useful tools in the diagnosis of inflammatory disease in the hamadryas baboon and establishes reference intervals to aid in the future veterinary care of this species.

1. Introduction

Native to the Horn of Africa and the southwestern Arabian Peninsula, hamadryas baboons (Papio hamadryas) are a species of Old World monkey, of the family Cercopithecidae, currently classified as least concern by the International Union for Conservation of Nature. Hamadryas baboons are well represented in zoological institutions accredited by the Association of Zoos & Aquariums (AZA) where routine veterinary care includes pre-shipment examinations, quarantine, preventative health assessments, and diagnosis and treatment of diseases [1]. Commonly encountered medical problems in hamadryas baboons under managed care include conspecific wounding, age-related osteoarthritis, and neoplasia [1].
Acute phase proteins (APP) are an integral part of the innate immune system, demonstrating measurable increases (positive APPs) or decreases (negative APPs) in serum concentration in response to many inflammatory processes including trauma, infection, stress, and neoplasia [2]. Changes in APPs are increasingly utilized in domestic and nondomestic species as sensitive indicators of systemic inflammation that often increase prior to appreciable leukogram changes [2]. Positive APPs can be further categorized by the rapidity and magnitude of change in serum concentration, with major APPs having negligible basal levels and a greater than ten-fold increase within 24–48 h, moderate APPs being present in healthy animals and demonstrating a five- to ten-fold increase within 48–72 h, and minor APPs rising less than two-fold at a gradual rate following an insult [3]. Conversely, negative APPs are reduced in production and serum concentrations following an inflammatory stimulus [3].
Serum amyloid A (SAA) and C-reactive protein (CRP) are highly conserved positive acute phase proteins in mammals, secreted from hepatocytes following cytokine stimulation. These proteins have critical pro-inflammatory and anti-inflammatory effects that help to stimulate and regulate the acute phase response. SAA induces further cytokine and chemokine release while enhancing the survival of suppressor cells and the conversion of macrophages to pro-resolving phenotypes [4,5]. CRP is a pattern recognition molecule that enhances opsonization and phagocytosis and activates the complement pathway, while also inducing the expression of anti-inflammatory cytokines and inhibiting chemotaxis [4,6]. Assays to measure these individual acute phase proteins are often species-specific and cross-reactivity must be validated prior to clinical application in a novel species. Protein electrophoresis (EPH) is a useful adjunct or alternative to individual APP assays as species-specific reagents are not required. Furthermore, EPH provides a complete assessment of the acute phase reaction by reporting broad groups of APPs and albumin, a negative APP largely preserved across taxa [4].
APPs have been extensively researched and utilized in human medicine and have been found to be useful tools in veterinary medicine to screen for subclinical disease, monitor disease progression or treatment, assess stress and welfare, and even identify or monitor gestation [5,6,7,8,9,10,11,12,13]. Although a recent evaluation found elevations in SAA and CRP in individual cases of disease in various species of zoo-housed macaques, in Old World species of nonhuman primates these APPs have been evaluated primarily in laboratory populations [14,15,16,17,18]. An evaluation of APPs in response to acute and chronic active inflammation in the rhesus macaque (Macaca mulatta) showed that SAA, CRP, and haptoglobin were positive APPs while albumin and iron were negative APPs, and reference intervals for these APPs were established [16]. In various baboon species, individual APPs have been evaluated in response to inoculation with infectious disease, suggesting the utility of SAA, CRP, and haptoglobin in the baboon [14,17,18]. However, reference intervals for these measures have not been established in any baboon species to the authors’ knowledge.
This study aimed to evaluate the utility of positive APPs in the hamadryas baboon. The first objective was to determine the cross-reactivity of currently available commercial assays for SAA, CRP, and haptoglobin. The next objective was to evaluate measurable APPs and EPH fractions across sex, age class, and health status and, finally, to establish reference intervals in healthy hamadryas baboons.

2. Materials and Methods

In total, 66 banked serum samples from 30 hamadryas baboons under managed care at the North Carolina Zoo (Asheboro, NC, USA) were used in this study. Samples were opportunistically collected under general anesthesia during routine or focused health examinations and frozen at −80 °C from 1995 to 2021. Medical records of all samples were reviewed to identify baboon sex, age, and health status at the time of collection. Baboon age was classified into categories of infant (<two years old), juvenile (two–four years old), subadult (five–seven years old), adult (eight–twenty-five years old), and geriatric (>twenty-five years old). Health status was classified as healthy, acutely ill, chronically ill, or pregnant. Baboons were considered healthy when no clinically relevant abnormalities were found on physical examination, complete blood count, biochemistry analysis, and available radiographic or ultrasonographic imaging reports. Baboons classified as acutely ill had diagnoses of trauma, active localized infection, and postpartum disease (e.g., retained placenta, metritis). Baboons classified as chronically ill had a diagnosis of osteoarthritis with no acute exacerbation. Samples were excluded from the study if the animal was administered an anti-inflammatory medication at any point in the one week prior to sample collection. Pregnancy diagnosis was confirmed by detection of a fetal heartbeat using ultrasound and by a recorded birth less than 180 days after the examination.

2.1. Reagent Validation

Cryopreserved samples were shipped in an insulated container overnight on dry ice to the Comparative Pathology Laboratory at the University of Miami Miller School of Medicine (Miami, FL, USA). SAA and CRP were quantified using immunoassays and all analyses were performed using a Vitros 5600 analyzer (Ortho Clinical Diagnostics, Rochester, NY, USA). The analyzer was maintained according to manufacturer guidelines. A preliminary study to evaluate the cross-reactivity of APP assays included serum samples from five healthy, five acutely ill, and five chronically ill baboons. Two reagents were evaluated for SAA cross-reactivity: SAA-LZ and VET-SAA (Eiken Chemical Co., Tokyo, Japan). Similarly, two reagents were evaluated for CRP: O-CRP (Ortho Clinical Diagnostics, Rochester, NY, USA) and R-CRP (Randox Laboratories, Kearneysville, WV, USA). Haptoglobin was measured using a colorimetric assay (Tridelta Development Ltd., County Kildare, Ireland). A sample pool from clinically abnormal baboons was diluted from 0 to 100% in 10% steps to assess linearity.
Capillary zone electrophoresis was performed according to the manufacturer protocols on a Capillarys 2 Flex Piercing system (Sebia Inc., Norcross, GA, USA). Briefly, samples were diluted 1:8 using urine running buffer as a diluent. Absolute values for each fraction were obtained by multiplying the percentages for each fraction by the total protein concentration as determined using the biuret method and a Vitros 5600 chemistry analyzer (Ortho Clinical Diagnostics, Rochester, NY, USA). The A/G ratio was calculated by dividing the sum of prealbumin and albumin by the sum of alpha, beta, and gamma globulins.

2.2. Cohort Comparison

Results for CRP, SAA, and EPH fractions were compared between (1) male and female baboons, (2) age classes, and (3) healthy and acutely ill baboons. For all comparisons, the distribution of cohorts was evaluated quantitatively using a Shapiro–Wilk test. Similarly, the homogeneity of variances between cohorts was evaluated quantitatively using a Levene’s test. For comparisons between male and female baboons as well as healthy and acutely ill baboons, a t test or Wilcoxon rank sum test was used depending on the distribution and homogeneity of variances. For comparisons between age classes, an ANOVA or Kruskal–Wallis test was used depending on distribution. If an ANOVA or Kruskal–Wallis test found a significant difference, age classes were compared using a Tukey’s test for multiple comparisons or pairwise Wilcoxon rank sum tests. To account for multiple comparisons, p values were adjusted using the Bonferroni correction. For all statistical tests, null hypotheses were rejected when p values were less than an alpha level of 0.05. All calculations and analyses were performed in the statistical software R (R Foundation for Statistical Computing, Vienna, Austria) using the ”boot”, ”car”, ”dplyr”, ”psych”, and ”referenceIntervals” packages and their dependents.

2.3. Reference Intervals

To establish de novo reference intervals in healthy hamadryas baboons for SAA, CRP, and EPH fractions, methods outlined by the American Society for Veterinary Clinical Pathology reference interval guidelines were followed [19]. Only healthy subadult, adult, and geriatric baboon data were included when generating reference intervals. Potential outliers were identified visually using histograms and quantitatively using the Horn’s method of outlier detection using Tukey’s interquartile fences [20]. The distribution of reference data was evaluated visually using histograms and quantitatively using a Shapiro–Wilk test. Given the sample size (n = 23 for SAA; n = 20 for CRP) and non-Gaussian distribution of the CRP and SAA data, robust methods were used to determine the 90% confidence interval of reference limits. Conversely, for EPH data, parametric methods were utilized given the sample size (n = 20) and Gaussian distribution [21]. A 90% confidence interval of reference EPH fraction limits was obtained using bootstrap methods based on 5000 bootstrap replicates. For all parameters, 90% confidence intervals around the upper and lower reference limits were calculated. Finally, mean, median, minimum, and maximum values were calculated for all parameters to allow informed clinical decision-making.

3. Results

3.1. Reagent Validation

In the preliminary study, the VET-SAA reagent but not the SAA-LZ reagent was found to react with baboon samples (Table S1). For VET-SAA, the 95% CI for the slope included 1 (0.96–1.08) and the y-intercept included 0 (−5.21–0.02) and the Runs test indicated a deviation from linearity (p = 0.02); the Pearson r was 0.99 (p < 0.0001). Both CRP reagents were found to cross-react with baboon CRP (Table S1). For O-CRP, the 95% confidence intervals (CI) for the slope included 1 (0.56–1.50) and the y-intercept included 0 (−4.15–31.70) but the Runs test indicated a deviation from linearity (p = 0.02); the Pearson r was 0.86 (p = 0.0008). For R-CRP the 95% CI for the slope included 1 (0.87–1.12) and the y-intercept included 0 (−43.5–20.3) and the Runs test did not indicate a deviation from linearity (p = 0.07); the Pearson r was 0.99 (p < 0.0001). The inter-assay coefficient of variation was between 3.5% and 2.6% for SAA and CRP analyses, respectively. Although haptoglobin values were measurable in the preliminary study, no apparent increase was found in the small sample of acutely ill or chronically ill baboons when visually compared to healthy baboons; therefore, validation of this APP was not pursued further (Table S1).
A Bland–Altman plot demonstrated poor diagnostic agreement between O-CRP and R-CRP in healthy, acutely ill, and chronically ill baboons with an average difference of 84 mg/L (95% CI: −519–689 mg/L) (Figure S1). As VET-SAA and R-CRP provided the most robust measurement of SAA and CRP, respectively, the data provided by these reagents were used accordingly for the following cohort comparisons and reference interval calculations.

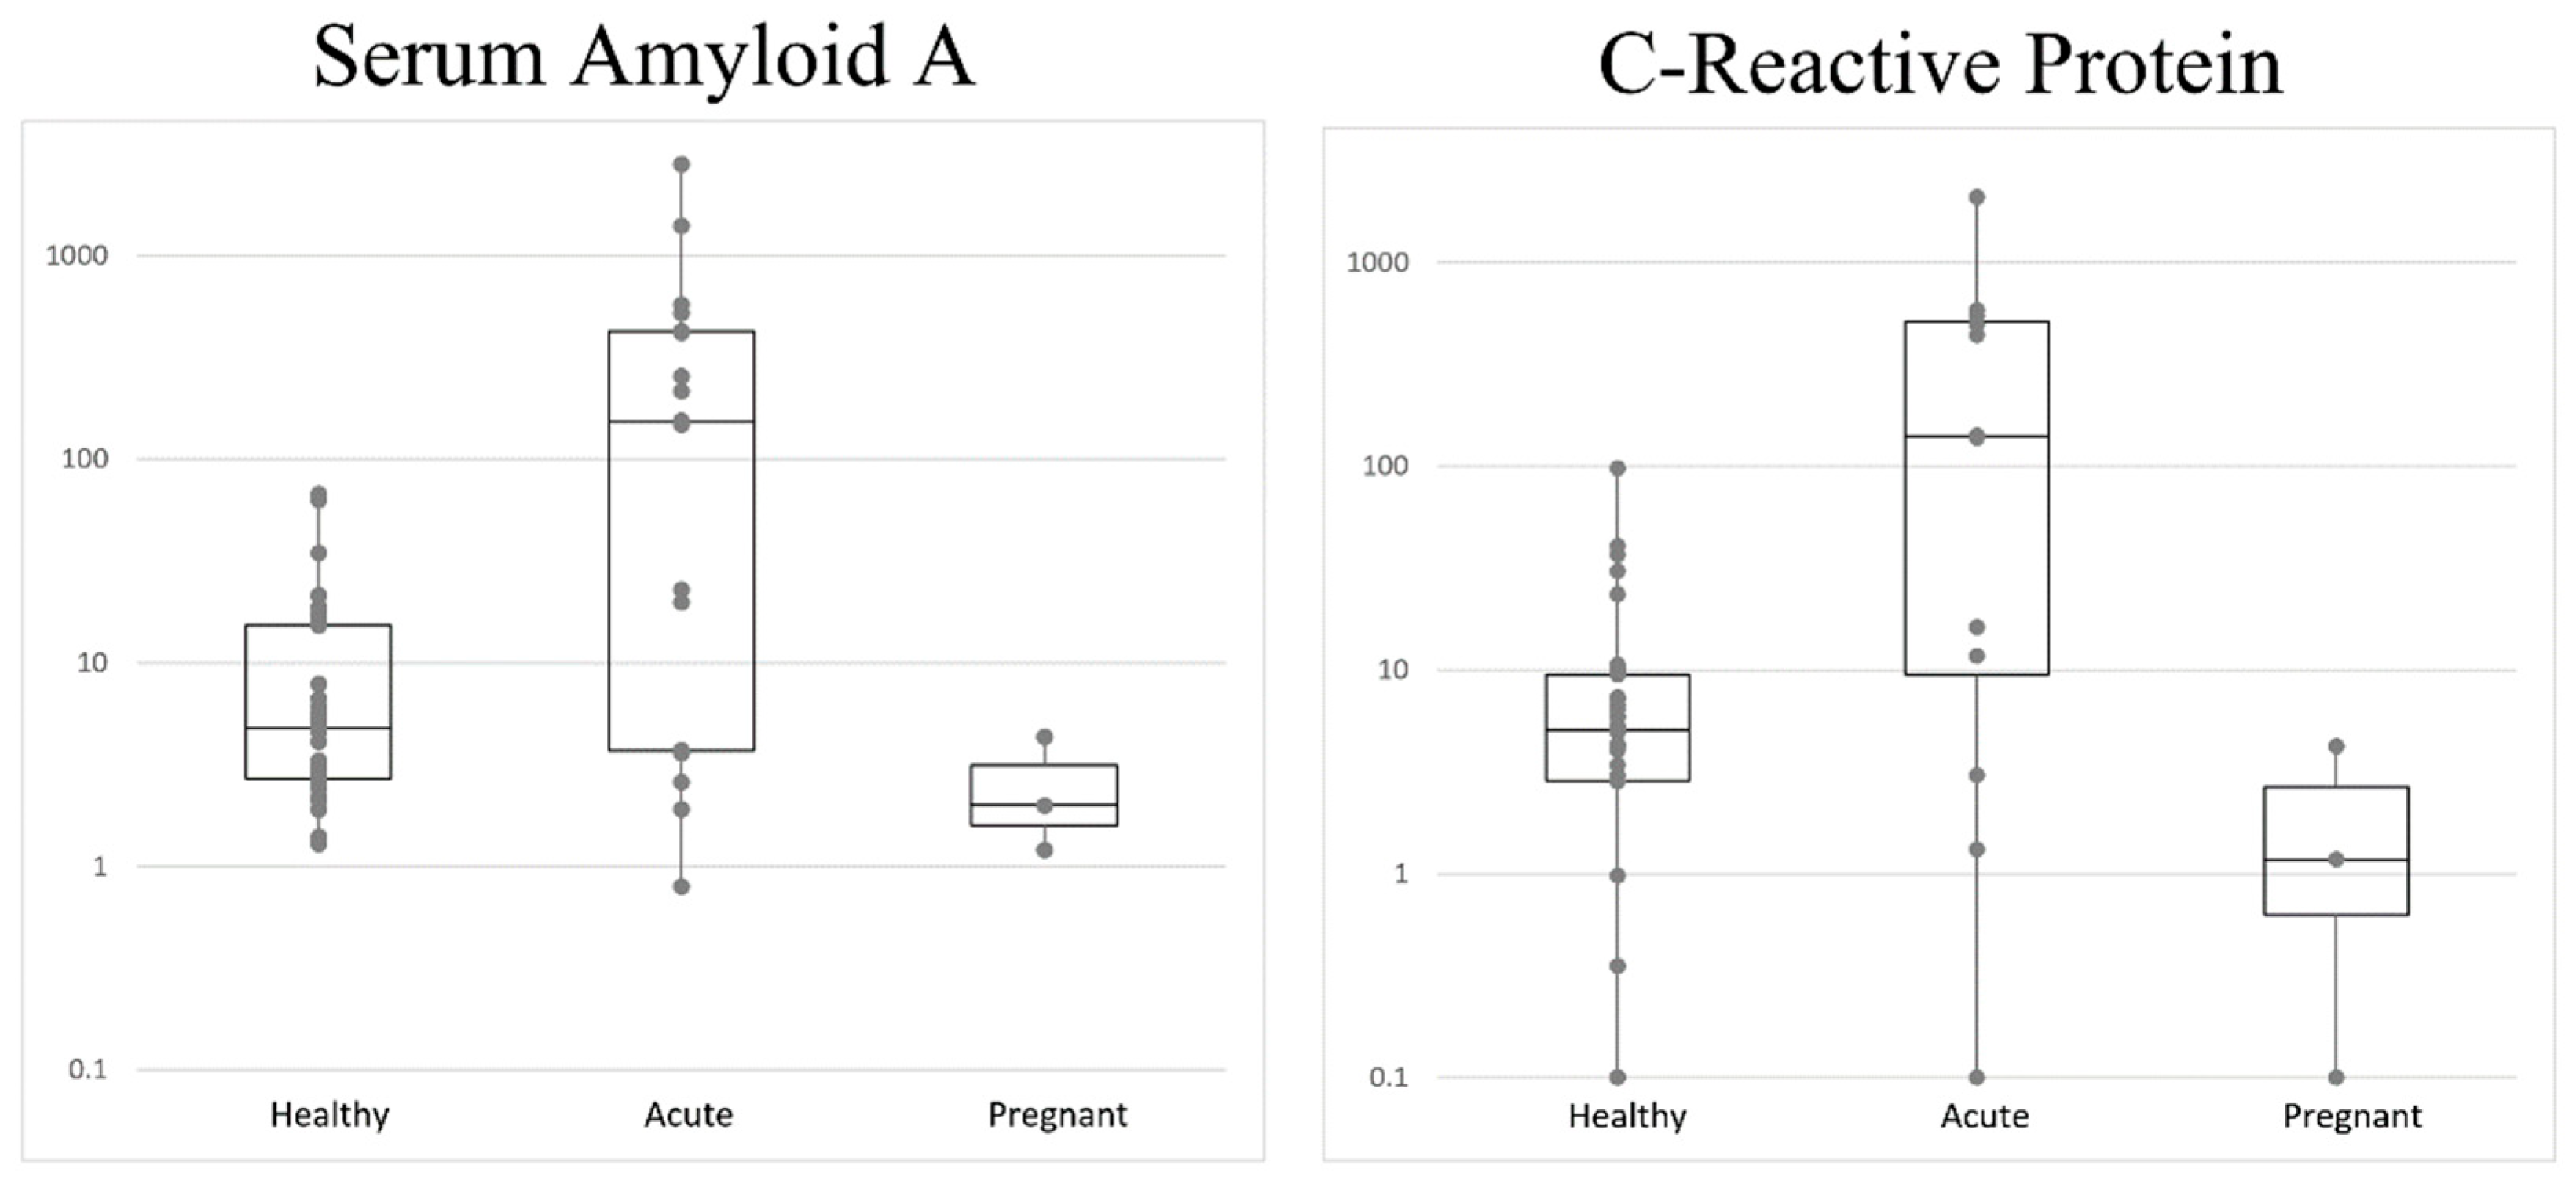
3.2. Cohort Comparison

Between male and female baboons, a Wilcoxon rank sum test found alpha-2 globulins were significantly different (adjusted p value = 0.038); female baboons had significantly higher absolute alpha-2 globulins than male conspecifics (median = 0.8 and 0.6 g/dL, respectively) (Table S2). Among age classes, A Kruskal–Wallis test found no significant difference between SAA, but did find two significant differences in CRP. Adult and juvenile baboons had significantly higher CRP levels (adjusted p value = 0.03 and 0.01, respectively) than infant baboons. Multiple ANOVAs found numerous significant differences among baboon age classes in EPH parameters (adjusted p values < 0.001) with two exceptions: no significant difference was found between adult and geriatric baboons or infant and juvenile baboons (Table S3).
Preliminary data showed elevation in APPs with acute inflammation but not in APPs with chronic inflammation; therefore, only baboons in the acutely ill cohort were evaluated further. A Wilcoxon rank sum test found SAA and CRP were significantly different (adjusted p values = 0.038 and <0.001, respectively) between healthy and acutely ill baboons. Figure 1 demonstrates the distribution of APPs by health status on a logarithmic scale. On average, acutely ill baboon SAA increased approximately 40× (mean: 411.3 mg/L) and CRP increased approximately 37× (mean: 374.4 mg/L) compared to healthy conspecifics (means: 10.2, 10.0, 6.4 mg/L, respectively) (Table 1). Finally, a t test found that the percentage gamma globulins were significantly different (adjusted p values = 0.038) between healthy and acutely ill baboons; on average, acutely ill baboons exhibited an approximate 3% increase in gamma globulins relative to total protein. All three pregnant females had SAA and CRP within the reference intervals established in this study (Table 1).

3.3. Reference Intervals

Reference intervals calculated for SAA, CRP, and EPH fractions in subadult, adult, and geriatric baboons are demonstrated in Table 2. Reference intervals were calculated from 23, 20, and 20 healthy baboon serum samples, respectively. No outliers were identified visually or quantitatively among any baboons used to establish reference intervals.

4. Discussion

This study is the first to establish cross-reactivity, reference intervals, and the clinical utility of common APPs in the hamadryas baboons. Preliminary studies successfully validated the use of one SAA and two CRP reagents, although different reactivity was observed with the latter. Baboons with acute infection or inflammation were found to have significant elevations of SAA, CRP, and absolute gamma globulins compared to their healthy counterparts. Based on these findings, reference intervals were established for SAA, CRP, and EPH fractions in healthy hamadryas baboons.
Although the use of APPs has not previously been reported in the hamadryas baboon, changes in these parameters compared to the baseline have been reported in other baboon species used in experimental infection models. In chacma baboons (Papio ursinus) with experimental Escherichia coli infection, a fifteen-fold rise was seen in CRP at 72 h post-inoculation [14]. In yellow baboons (Papio cynocephalus) inoculated with group A streptococci, CRP peaked around 48 h [18]. In olive baboons (Papio Anubis) with experimental Schistosoma mansoni infection, haptoglobin rapidly increased four-fold and returned to the baseline with the resolution of the infection [17].
In the present study, SAA and CRP would be classified as major positive APPs in hamadryas baboons, with an average forty-fold and thirty-seven-fold increase in SAA and CRP, respectively. This is in agreement with the findings of a greater than ten-fold increase in CRP in the chacma baboon and a rise in CRP within 48 h in the yellow baboon during experimental sepsis [14,18]. Unfortunately, the use of archived samples precluded the ability to determine the time from the stimulus to peak APP concentration in this study population. The discrepancy between the clinical relevance of haptoglobin in hamadryas and olive baboons using a similar colorimetric assay is also unclear, but is likely attributed to the small sample size of the pilot study reported here rather than a true species difference. The median haptoglobin concentration measured in four healthy and five acutely ill hamadryas baboons was 2.51 and 2.37 mg/mL, respectively, and therefore further investigation of this APP in this study population was not pursued. However, similar to the olive baboon, haptoglobin in other mammalian species is often characterized as a moderate positive APP with a two- to five-fold increase during an inflammatory process [3]. This may have been the case in the hamadryas baboon had it been measured in a larger study population.
It was unexpected to find that two human-focused reagents, SAA-LZ and O-CRP, did not perform as well as their veterinary counterparts, VET-SAA and R-CRP, in this nonhuman primate species. In a recent report, a human-focused assay for CRP, different from the assay used in this study, and VET-SAA were both found to cross-react with APPs of various macaque species. However, VET-SAA did not produce as robust a measurement in the Strepsirrhini species when visually compared to the Haplorhini species. Importantly, validation for these assays was not performed in any of the species assessed in that study [15]. These findings, combined with the data presented here, highlight the importance of continued research to validate and utilize assays with optimal cross-reactivity to accurately quantify these inflammatory markers in the various species under veterinary care.
Clinical interpretation of APPs is aided by the establishment of species-specific reference intervals from a similar healthy population. Within the population of clinically normal baboons in this study, no difference was found in APPs between males and females, but female baboons were found to have statistically higher absolute alpha-2 globulins than males. However, when comparing the median measurement for each sex, the difference is likely clinically insignificant (median = 0.8 g/dL in females and 0.6 g/dL in males). Therefore, males and females were included in the established reference intervals. Infants and juveniles were excluded from the population for the purpose of establishing reference intervals. Although no difference was found across age classes for SAA, CRP was statistically lower in infants than in juveniles and adults. Similarly, a significant difference was found in at least one pairwise comparison between age classes for almost all individual EPH fractions. Importantly, no significant differences were found between adult and geriatric baboons as well as infant and juvenile baboons for any EPH fraction. Despite significant differences in subadults compared to adult and geriatric baboons, these three age classes were included in the established reference intervals to meet the minimum threshold recommended by the American Society for Veterinary Clinical Pathology [19]. It is possible that larger sample sizes of healthy reference individuals could allow stricter partitioning criteria and more refined reference intervals.
As previously mentioned, EPH is a valuable tool because this test assesses the entire acute phase response, reported as groups of APPs, in contrast to measuring individual APPs which may require species-specific reagents. This evaluation also includes albumin, a well-conserved negative APP across taxa [2,7,10,22] which has also previously been identified as a negative APP in baboons [17,18]. Mean serum concentrations in albumin in this study were lower in acutely ill hamadryas baboons than healthy baboons, but this difference was not statistically significant after adjustment of p values for multiple comparisons. Interestingly, in baboons with experimental infection, the decline in albumin concentrations was not as robust as expected and occurred later in the inflammatory model [17,18]. It seems likely that in a larger study population, albumin would be identified as a negative APP in the hamadryas baboon as well.
A very small number (n = 3) of samples from pregnant females were available for inclusion in this study. Data in the giant panda (Ailuropoda melanoleuca) showed that urine concentrations of the APP ceruloplasmin could be correlated with pregnancy and used to distinguish pregnancy from pseudopregnancy. It was also noted that urine ceruloplasmin concentrations followed a specific pattern that deviated if the pregnancy was lost [13]. Concentrations of ceruloplasmin in serum are also reported to increase in humans during pregnancy [23,24,25]. Furthermore, serum ceruloplasmin, haptoglobin, and CRP concentrations increased during pregnancy in dogs [26,27]. Although ceruloplasmin has not been evaluated in baboons in this context, CRP has been evaluated in the pregnant olive baboon. In that study, serum levels were likely reflective of the severity of an experimentally induced periodontitis and did not appear to relate to the stage of pregnancy [28]. For the three pregnant hamadryas baboons in this study, no clinical difference could be identified in either CRP or SAA when compared to the healthy population. However, further study is needed to evaluate the utility of APPs for information regarding pregnancy in hamadryas baboons.
The major limitation of this study was the dependance on archived samples from the study population. The sample size available required robust methods for calculating reference intervals and precluded stricter partitioning by sex or individual age group to establish more refined reference intervals for subgroups [19]. The reference population was limited to one hamadryas baboon troop at a single institution; thus, multiple samples from individual baboons at different time points were included in the data set. When evaluating APPs in baboons with acute illness or inflammation, retrospective case selection required the inclusion of various ailments not necessarily of the same nature (e.g., acute trauma vs. focal infection). Similarly, it was not possible to control the timepoint from the stimulus of inflammation to serum collection and most often that information was not available in the reviewed medical record. Samples were stored for up to 26 years at −80 °C prior to shipping for analysis; however, these are the recommended conditions for long-term storage to preserve APPs in human samples [29,30]. Despite these limitations, the study population is reflective of a hamadryas baboon troop under managed care and the data reported here remain a valuable foundation for the clinical use of APPs in this species.

5. Conclusions

In hamadryas baboons, SAA and CRP appear to be major positive APPs reflective of acute inflammation or illness, while absolute gamma globulins were most consistently elevated on EPH. After assay validation, reference intervals were established for SAA, CRP, and EPH protein fractions in healthy hamadryas baboons to aid in their clinical use in this species.

Supplementary Materials

The following supporting information can be downloaded at: https://www.mdpi.com/article/10.3390/jzbg4010012/s1, Table S1: Preliminary data to assess for cross-reactivity of haptoglobin, serum amyloid-A (Vet-SAA) and C-reactive protein (CRP-NHP and CRP-K) in the hamadryas baboon; Figure S1: Bland–Altman plot demonstrating poor agreement between C-reactive protein measurements in hamadryas baboons using two different reagents, O-CRP and R-CRP. The solid black line denotes the average difference (84 mg/L), and the red dashed lines denote a 95% confidence interval of the average difference (−519–689 mg/L); Table S2: Descriptive statistics of acute phase proteins and protein electrophoresis fractions in healthy female and male hamadryas baboons. Vet-SAA denotes the reagent used to measure the serum amyloid A while, CRP-NHP and CRP-K denote two separate reagents used to measure the C-reactive protein. An asterisk indicates statistical significance between females and males, p ≤ 0.05; Table S3: Descriptive statistics of acute phase proteins and protein electrophoresis fractions in healthy hamadryas baboons separated by age class; infant (<two years old), juvenile (two–four years old), subadult (five–seven years old), adult (eight–twenty-five years old), and geriatric (>twenty-five years old). Vet-SAA denotes the reagent used to measure serum amyloid A, while CRP-NHP and CRP-K denote two separate reagents used to measure the C-reactive protein. Statistically significant differences between age classes are denoted by the superscript letters A–D. Age classes that are significantly different do not share a superscript letter. Age classes with no superscript letter demonstrated no significant difference from the other age classes for that measured protein. Statistical significance was determined by a p value ≤ 0.05.

Author Contributions

Conceptualization, M.L.C., C.C. and L.J.M.; methodology, M.L.C., N.G.D. and C.C.; software, M.L.C. and N.G.D.; validation, C.C.; formal analysis, N.G.D. and C.C.; investigation, M.L.C.; resources, C.C. and L.J.M.; data curation, M.L.C., N.G.D. and C.C.; writing—original draft preparation, M.L.C.; writing—review and editing, M.L.C., N.G.D., C.C. and L.J.M.; visualization, M.L.C.; supervision, C.C. and L.J.M.; project administration, M.L.C. and L.J.M.; funding acquisition, L.J.M. All authors have read and agreed to the published version of the manuscript.

Funding

This research was funded by the North Carolina Zoo Veterinary Section.

Institutional Review Board Statement

The work in this study was approved by the North Carolina Zoo research review board.

Data Availability Statement

All data are available in this manuscript and Supplementary Materials provided.

Acknowledgments

The authors would like to thank the veterinary staff at the North Carolina Zoo for their work curating the serum bank and collecting banked samples for this project.

Conflicts of Interest

The authors declare no conflict of interest.

References

  1. AZA Baboon Species Survival Plan®. Hamadryas Baboon Care Manual; Association of Zoos and Aquariums: Silver Spring, MD, USA, 2020. [Google Scholar]
  2. Cray, C.; Zaias, J.; Altman, N.H. Acute phase response in animals: A review. Comp. Med. 2009, 59, 517–526. [Google Scholar]
  3. Cray, C. Biomarkers of inflammation in exotic pets. J. Exot. Pet Med. 2013, 22, 245–250. [Google Scholar] [CrossRef]
  4. Cray, C. Acute phase proteins in animals. Prog. Mol. Biol. Transl. Sci. 2012, 105, 113–150. [Google Scholar]
  5. Sack, G.H. Serum amyloid A—A review. Mol. Med. 2018, 24, 46. [Google Scholar] [CrossRef]
  6. Black, S.; Kushner, I.; Samols, D. C-reactive protein. J. Biol. Chem. 2004, 279, 48487–48490. [Google Scholar] [CrossRef]
  7. Charlie-Silva, I.; Klein, A.; Gomes, J.M.; Prado, E.J.; Moraes, A.C.; Eto, S.F.; Fernandes, D.C.; Fagliari, J.J.; Junior, J.D.; Lima, C.; et al. Acute-phase proteins during inflammatory reaction by bacterial infection: Fish-model. Sci. Rep. 2019, 9, 4776. [Google Scholar] [CrossRef]
  8. Galezowski, A.M.; Snead, E.C.; Kidney, B.A.; Jackson, M.L. C-reactive protein as a prognostic indicator in dogs with acute abdomen syndrome. J. Vet. Diagn. Investig. 2010, 22, 395–401. [Google Scholar] [CrossRef]
  9. Pohlin, F.; Hofmeyr, M.; Hooijberg, E.H.; Blackhurst, D.; Reuben, M.; Cooper, D.; Meyer, L.C. Challenges to animal welfare associated with capture and long road transport in boma-adapted black (Diceros bicornis) and semi-captive white (Ceratotherium simum) rhinoceroses. J. Wildl. Dis. 2020, 56, 294–305. [Google Scholar] [CrossRef]
  10. Sheldon, J.D.; Johnson, S.P.; Hernandez, J.A.; Cray, C.; Stacy, N.I. Acute-phase responses in healthy, malnourished, and Otostrongylus-infected juvenile northern elephant seals (Mirounga angustirostris). J. Zoo Wildl. Med. 2017, 48, 767–775. [Google Scholar] [CrossRef]
  11. Stanton, J.J.; Cray, C.; Rodriguez, M.; Arheart, K.L.; Ling, P.D.; Herron, A. Acute phase protein expression during elephant endotheliotropic herpesvirus-1 viremia in Asian elephants (Elephas maximus). J. Zoo Wildl. Med. 2013, 44, 605–612. [Google Scholar] [CrossRef]
  12. Thomton, J.D.; Mellish, J.A. Haptoglobin concentrations in free-range and temporarily captive juvenile Steller sea lions. J. Wildl. Dis. 2007, 43, 258–261. [Google Scholar] [CrossRef] [PubMed]
  13. Willis, E.L.; Kersey, D.C.; Durrant, B.S.; Kouba, A.J. The acute phase protein ceruloplasmin as a non-invasive marker of pseudopregnancy, pregnancy, and pregnancy loss in the giant panda. PLoS ONE 2011, 6, e21159. [Google Scholar] [CrossRef] [PubMed] [Green Version]
  14. Haudek, S.B.; Natmessnig, B.E.; Redl, H.; Schlag, G.; Hatlen, L.E.; Tobias, P.S. Isolation, partial characterization, and concentration in experimental sepsis of baboon lipopolysaccharide-binding protein. J. Lab. Clin. Med. 2000, 136, 363–370. [Google Scholar] [CrossRef]
  15. Kimura, T. Comparative evaluation of acute phase proteins by C-reactive protein (CRP) and serum amyloid A (SAA) in nonhuman primates and feline carnivores. Anim. Dis. 2022, 2, 21. [Google Scholar] [CrossRef]
  16. Krogh, A.K.; Lundsgaard, J.F.; Bakker, J.; Langermans, J.A.; Verreck, F.A.; Kjelgaard-Hansen, M.; Jacobsen, S.; Bertelsen, M.F. Acute-phase responses in healthy and diseased rhesus macaques (Macaca mulatta). J. Zoo Wildl. Med. 2014, 45, 306–314. [Google Scholar] [CrossRef]
  17. Mungatana, N.W.; Ngure, R.M.; Yole, D.S. Acute phase response of albumin and haptoglobin in experimental infection of the olive baboon, Papio Anubis, with Schistosoma mansoni. Scand. J. Lab. Anim. Sci. 2007, 34, 119–126. [Google Scholar]
  18. Taylor Jr, F.B.; Bryant, A.E.; Blick, K.E.; Hack, E.; Jansen, P.M.; Kosanke, S.D.; Stevens, D.L. Staging of the baboon response to group A streptococci administered intramuscularly: A descriptive study of the clinical symptoms and clinical chemical response patterns. Clin. Infect. Dis. 1999, 29, 167–177. [Google Scholar] [CrossRef]
  19. Friedrichs, K.R.; Harr, K.E.; Freeman, K.P.; Szladovits, B.; Walton, R.M.; Barnhart, K.F.; Blanco-Chavez, J. ASVCP reference interval guidelines: Determination of de novo reference intervals in veterinary species and other related topics. Vet. Clin. Pathol. 2012, 41, 441–453. [Google Scholar] [CrossRef]
  20. Horn, P.S.; Pesce, A.J. Reference intervals: An update. Clin. Chim. Acta 2003, 334, 5–23. [Google Scholar] [CrossRef]
  21. Horn, P.S.; Pesce, A.J.; Copeland, B.E. A robust approach to reference interval estimation and evaluation. Clin. Chem. 1998, 44, 622–631. [Google Scholar] [CrossRef]
  22. Delk, K.W.; Wack, R.F.; Burgdorf-Moisuk, A.; Kass, P.H.; Cray, C. Acute phase protein and electrophoresis protein fraction values for captive American flamingos (Phoenicopterus ruber). J. Zoo Wildl. Med. 2015, 46, 929–933. [Google Scholar] [CrossRef] [PubMed]
  23. Burrows, S.; Pekala, B. Serum copper and ceruloplasmin in pregnancy. Am. J. Obstet. Gynecol. 1971, 109, 907–909. [Google Scholar] [CrossRef] [PubMed]
  24. Larsson, A.; Palm, M.; Hansson, L.O.; Basu, S.; Axelsson, O.V. Reference values for α1-acid glycoprotein, α1-antitrypsin, albumin, haptoglobin, C-reactive protein, IgA, IgG and IgM during pregnancy. Acta Obstet. Gynecol. Scand. 2008, 87, 1084–1088. [Google Scholar] [CrossRef]
  25. Watts, D.H.; Krohn, M.A.; Wener, M.H.; Eschenbach, D.A. C-reactive protein in normal pregnancy. Obstet. Gynecol. 1991, 77, 176–180. [Google Scholar] [CrossRef]
  26. Kuribayashi, T.; Shimada, T.; Matsumoto, M.; Kawato, K.; Honjyo, T.; Fukuyama, M.; Yamamoto, Y.; Yamamoto, S. Determination of serum C-reactive protein (CRP) in healthy beagle dogs of various ages and pregnant beagle dogs. Exp. Anim. 2003, 52, 387–390. [Google Scholar] [CrossRef]
  27. Vannucchi, C.I.; Mirandola, R.M.; Oliveira, C.M. Acute-phase protein profile during gestation and diestrous: Proposal for an early pregnancy test in bitches. Anim. Reprod. Sci. 2002, 74, 87–99. [Google Scholar] [CrossRef]
  28. Ebersole, J.L.; Steffen, M.J.; Holt, S.C.; Kesavalu, L.; Chu, L.; Cappelli, D. Systemic inflammatory responses in progressing periodontitis during pregnancy in a baboon model. Clin. Exp. Immunol. 2010, 162, 550–559. [Google Scholar] [CrossRef]
  29. Doumatey, A.P.; Zhou, J.; Adeyemo, A.; Rotimi, C. High sensitivity C-reactive protein (Hs-CRP) remains highly stable in long-term archived human serum. Clin. Biochem. 2014, 47, 315–318. [Google Scholar] [CrossRef]
  30. Ishikawa, S.; Kayaba, K.; Gotoh, T.; Nakamura, Y.; Kario, K.; Ito, Y.; Kajii, E. Comparison of C-reactive protein levels between serum and plasma samples on long-term frozen storage after a 13.8 year interval: The JMS Cohort Study. J. Epidemiol. 2007, 17, 120–124. [Google Scholar] [CrossRef] [Green Version]
Figure 1. Distribution of serum amyloid A- and C-reactive protein across three health status cohorts: healthy, acutely ill, and pregnant. The y-axis is expressed in mg/L for both graphs. Note the logarithmic scale of the y-axis to demonstrate the dynamic range between health status.
Jzbg 04 00012 g001
Table 1. Descriptive statistics for serum amyloid A (SAA), C-reactive protein (CRP), and protein electrophoresis fractions in hamadryas baboons of various health status. The healthy and acutely ill cohorts include males, females, and all age groups. An asterisk indicates statistical significance compared to the healthy cohort, p ≤ 0.05.
ProteinUnitsStatusnMeanMedianMinMax
SAAmg/LHealthy4110.24.81.367.1
Acutely ill *17411.3153.80.82816.6
Pregnant32.52.02.04.3
CRPmg/LHealthy3710.05.10.197.1
Acutely ill *12374.4140.60.12116.0
Pregnant31.81.170.14.21
A/G Ratiog/dLHealthy371.31.290.751.9
Acutely ill120.90.8350.471.8
Prealbuming/dLHealthy370.10.090.050.2
Acutely ill120.10.110.030.1
%Healthy371.51.50.72.4
Acutely ill121.61.5512.2
Albuming/dLHealthy373.43.452.574.1
Acutely ill122.83.070.873.9
%Healthy3753.854.841.364.4
Acutely ill1245.044.1530.662.3
Alpha-1g/dLHealthy370.30.260.20.3
Acutely ill120.30.280.180.4
%Healthy374.143.45.2
Acutely ill124.84.33.27.5
Alpha-2g/dLHealthy370.70.680.441.1
Acutely ill120.90.850.321.5
%Healthy3711.110.87.415.7
Acutely ill1214.112.959.423.0
Beta-1g/dLHealthy370.70.640.460.9
Acutely ill120.70.750.341.0
%Healthy3710.410.57.912.5
Acutely ill1211.611.858.514.3
Beta-2g/dLHealthy370.50.440.260.7
Acutely ill120.50.540.220.7
%Healthy377.06.84.19.7
Acutely ill128.08.5549.7
Total Betag/dLHealthy371.11.080.731.5
Acutely ill121.21.290.571.7
%Healthy3717.517.312.521.8
Acutely ill1219.520.412.624.0
Gammag/dLHealthy370.80.750.391.1
Acutely ill120.90.9650.421.3
%Healthy3712.012.37.116.8
Acutely ill *1214.915.558.517.6
Table 2. Reference intervals for serum amyloid A (SAA), C-reactive protein (CRP), and protein electrophoresis (EPH) fractions in the hamadryas baboon. SAA and CRP data were non-normally distributed with reference intervals calculated using robust methods. EPH fraction data were normally distributed and reference intervals were calculated using parametric methods. Healthy subadult, adult, and geriatric baboons were included.
ProteinUnitsnMeanMedianMinMaxReference IntervalLower 90% CIUpper 90% CI
SAAmg/L2311.25.31.462.60 *–35.9Null20.2–53.4
CRPmg/L2013.25.220.197.10 *–53.6Null25.2–87
A/G Ratiog/dL201.081.070.751.490.64–1.510.51–0.781.37–1.65
Prealbuming/dL200.110.10.050.170.05–0.170.03–0.070.15–0.19
%201.61.60.72.40.8–2.40.5–12.1–2.6
Albuming/dL203.373.412.574.052.61–4.132.37–2.853.88–4.37
%2049.849.841.358.639.6–59.936.4–42.956.6–63.1
Alpha-1g/dL200.270.270.230.330.22–0.310.2–0.230.3–0.33
%203.943.44.63.3–4.53.1–3.54.3–4.7
Alpha-2g/dL200.840.850.61.130.52–1.160.42–0.631.06–1.27
%2012.412.79.415.78.4–16.37.2–9.715.1–17.6
Beta-1g/dL200.760.770.620.870.6–0.920.55–0.650.87–0.97
%2011.211.39.412.59.4–12.98.8–1012.4–13.5
Beta-2g/dL200.530.560.370.680.36–0.70.31–0.420.64–0.75
%207.87.75.49.75.5–10.14.7–6.29.4–10.9
Total Betag/dL201.291.331.011.520.98–1.590.89–1.081.49–1.69
%201919.314.821.815.2–22.814–16.421.6–24
Gammag/dL200.910.970.551.140.55–1.270.44–0.661.15–1.38
%2013.413.68.816.88.8–17.97.3–10.316.5–19.4
* The estimated lower limit of the reference interval and corresponding lower 90% confidence interval were below the detection limit for SAA and CRP.
Disclaimer/Publisher’s Note: The statements, opinions and data contained in all publications are solely those of the individual author(s) and contributor(s) and not of MDPI and/or the editor(s). MDPI and/or the editor(s) disclaim responsibility for any injury to people or property resulting from any ideas, methods, instructions or products referred to in the content.

