Article

Hydrogen Purification through a Membrane–Cryogenic Integrated Process: A 3 E’s (Energy, Exergy, and Economic) Assessment

1
School of Chemical Engineering, Yeungnam University, Gyeongsan 38541, Republic of Korea
2
Exploration Department, Egyptian Petroleum Research Institute (EPRI), Nasr City 4450113, Cairo, Egypt
3
School of Energy and Chemical Engineering, Ulsan National Institute of Science and Technology, 50 UNIST-gil, Eonyang-eup, Ulju-gun, Ulsan 44919, Republic of Korea
*
Author to whom correspondence should be addressed.
Gases 2023, 3(3), 92-105; https://doi.org/10.3390/gases3030006
Submission received: 28 March 2023 / Revised: 14 June 2023 / Accepted: 15 June 2023 / Published: 27 June 2023
(This article belongs to the Special Issue Membrane Processes for Decarbonisation)

Abstract

:
Hydrogen (H2) is known for its clean energy characteristics. Its separation and purification to produce high-purity H2 is becoming essential to promoting a H2 economy. There are several technologies, such as pressure swing adsorption, membrane, and cryogenic, which can be adopted to produce high-purity H2; however, each standalone technology has its own pros and cons. Unlike standalone technology, the integration of technologies has shown significant potential for achieving high purity with a high recovery. In this study, a membrane–cryogenic process was integrated to separate H2 via the desublimation of carbon dioxide. The proposed process was designed, simulated, and optimized in Aspen Hysys. The results showed that the H2 was separated with a 99.99% purity. The energy analysis revealed a net-specific energy consumption of 2.37 kWh/kg. The exergy analysis showed that the membranes and multi-stream heat exchangers were major contributors to the exergy destruction. Furthermore, the calculated total capital investment of the proposed process was 816.2 m$. This proposed process could be beneficial for the development of a H2 economy.

1. Introduction

Energy consumption is a critical issue in the global fight against climate change. Burning fossil fuels to meet the world’s growing energy demands has significantly increased greenhouse gas emissions. According to the International Energy Agency [1], the total global energy-related greenhouse gas emissions increased by 1.0% in 2022, reaching a record high of 41.3 Gt CO2-eq., 89% of which is the direct CO2 from combustion and other industrial processes. A more sustainable trend compared to 2021 has been observed, primarily because of the slow industrial growth in China and Europe [2] and increased implementation of clean technologies such as renewables, electric vehicles, and heat pumps.
Hydrogen (H2) is considered to be one of the key players in the shift from a carbon economy to a more sustainable and clean-energy future. H2 can be a game changer in shifting away from a carbon economy by providing a clean and versatile energy carrier for various sectors and applications [3]. H2 can generate electricity with only water and heat as the byproducts in fuel cells. H2 can also be used as a clean fuel for transportation, replacing fossil fuels and reducing the emissions of pollutants such as nitrogen oxides and particulate matter. H2 can also enable the integration of renewable energy sources into the grid, enhance energy security and resilience, and create new business opportunities [4]. However, H2 still faces many challenges, such as its high cost, low efficiency, infrastructure gaps, and safety issues [5]. The production and use of H2 as a fuel have the potential to reduce greenhouse gas emissions and improve air quality significantly.
On the other hand, H2 production can also generate emissions if it relies on fossil fuels [6]. Therefore, some countries are investing in developing emission-free H2 production methods, such as using renewable energy or carbon capture and storage. H2 can be produced from various low-carbon or carbon-free sources, such as renewable energy, nuclear power, and natural gases with carbon capture and storage technology [7]. Commercially, H2 is produced from natural gas, coal, biomass, and water, resulting in impurities such as carbon monoxide, carbon dioxide, sulfur compounds, and water [8]. These impurities can negatively impact the performance of fuel cells and other H2-based technologies. Therefore, H2 purification is a crucial step in the production and use of H2.
The importance of H2 purification has grown significantly in recent years with the increasing interest in H2 as a clean energy source. The use of H2 as a fuel for transportation, power generation, and other applications requires high-purity H2 to ensure the optimal performance and reliability [9]. The purity requirements of H2 depend on its intended use. The purification standards for H2 are the specifications that define the quality and purity of this H2 for its different applications and use. For example, ISO 14687 is a standard that specifies the quality characteristics of H2 fuel for its use in proton exchange membrane fuel cells [10]. For example, in fuel cell applications, the H2 purity must be greater than 99.99% to prevent the contamination of the fuel cell electrodes and maintain their efficiency. ISO 19983 is a standard that specifies the safety requirements for H2 separation and purification systems. The allowable concentration of carbon monoxide in H2 for fuel cell applications is typically less than 10 parts per billion (ppb) [11].
Different purification methods can remove specific impurities from H2, including pressure swing adsorption (PSA), membrane separation, and catalytic processes [12]. PSA is a widely used method that uses adsorbent materials to separate H2 from other gases by changing the pressure of the feed stream. PSA can achieve high purity levels (>99.9%) and high recovery rates (>90%), but it requires high pressure and large equipment [13]. Membrane-based separation is a promising method that uses selective membranes to allow H2 to pass through while blocking other gases. Membrane-based separation can operate at a low pressure and temperature and has a low energy consumption and environmental impact. However, membrane-based separation may suffer from a low selectivity, stability, and high cost. Cryogenic distillation is a method that uses low temperatures to liquefy and separate H2 from other gases. Cryogenic distillation can produce pure H2 (>99.999%), but has a very high energy consumption and capital cost [14].
The choice of H2 purification method depends on various factors, including the level of purity required, the impurities present in the feed gas, the operating conditions, the volume of H2 to be purified, and the economic factors. Several hybrid H2 purification techniques combine different methods to achieve higher levels of purity, address specific impurities, and achieve a better performance and efficiency. Amosova et al. [15] proposed an integrated system of membrane and PSA technologies for H2 separation from a gas mixture of H2/CO/CO2/N2/H2S. The hybrid structure could achieve a 90–97% recovery for cases where the biosynthesis and petrochemical gases can have a 70% concentration of H2 at the exit of the membrane section. The simulations of the hybrid PSA–membrane and membrane–PSA processes carried out by Li et al. [16] showed that, for the same feed gas (H2 concentration 62.75%), the latter combination achieved a higher recovery (97.06%). Ohs et al. [17] applied a cost-minimization optimization of the membrane–PSA hybrid process for bioH2 purification. The hybrid PSA–membrane model for an on-site ammonia-fed H2 refueling station system presented by Lin et al. [18] demonstrated a 95% recovery rate. Ma et al. [19] used a similar combination for refinery off-gas to achieve net zero H2 emissions. The CRYOCAPTM process developed by Air Liquide integrates a cryogenic purifier with PSA to separate CO2 from the off-gas. Studies [20,21] have shown a 98% recovery of H2 and a 99.5% purity of CO2, though H2 purity has not been mentioned. Van Acht et al. [22] integrated PSA with an electrochemical H2 purification and compression system to obtain a 99.999% purity using coke oven gas as the feed. The overall percentage of the recovery was not reported, so it is difficult to comment on the efficacy of this scheme.
Membrane–cryogenic hybrid processes are processes in which membrane technology and condensation equipment are combined to achieve a gas separation. This type of process is particularly efficient when at least one component is condensable [23]. Agrawal et al. [24] used a hybrid system combining membrane and cryogenic separation technologies, which resulted in a 96.5% H2 purity and a 98% recovery from a fluid catalytic cracking unit off-gas. The power requirement of the hybrid approach is 35% less than that of the standalone cryogenic process and requires less capital investment, but this is at the cost of thermodynamic efficiency. The separation of propylene and nitrogen has been efficiently achieved by combining a hybrid process of cryogenic separation and membrane modules [25,26]. Lin et al. [27] used membrane and cryogenic technologies to separate H2 from feed derived from a coal oxy-fired GE gasifier containing 56% H2, achieving an optimum H2 recovery of 98.7% and a purity of 90.3%. Liao et al. [28,29] focused on optimizing the economic performance of the CO2 capture process using a hybrid membrane–cryogenic system. In the oilfields business, when employing the CO2-enhanced oil recovery method, this technique can save around 10% of the consumed energy while achieving a 99% purity and 96% recovery [30]. This concept has also found its potential application in the air separation process, wherein pre-enriching oxygen can result in an 11% reduction in the flow rates to the cryogenic section [31]. Burdyny and Struchtrup [32] reported a 0.9% improvement in the efficiency of the air separation process. Another hybrid setup is a multistage membrane and distillation with an integrated heat pump for propylene/propane separation. Park et al. [33] reported purity and recovery percentages of >99%.
From the literature review, it can be inferred that hybrid techniques offer advantages such as higher levels of purity, increased efficiency, and an improved selectivity for specific impurities. However, they can also be more complex and require additional equipment and infrastructure. Most of the prior works accessible in the open literature were related to CO2 capture and separation. Only a few were focused on H2 purification and efficiency and those too suffered from either a low thermodynamic efficiency and recovery or compromised on the final H2 purity, which is an important factor for fuel cell applications. This leaves a big gap that needs immediate attention. Therefore, H2 separation and purification have been targeted in the present study. For this purpose, membrane- and cryogenic (desublimation)-based technologies are integrated to produce high-purity H2 with a high recovery. To the best of authors’ knowledge, this is a unique integration attempt for maximizing the throughputs. The emphasis is also on assessing and identifying the energy sinks and economic feasibility of the proposed membrane–cryogenic hybrid process.

2. Methods

A hybrid membrane–cryogenic process for the purification of H2 is proposed in the present study. The following lines briefly introduce the details of the proposed process and the analysis approaches used to assess its efficacy and potential feasibility.

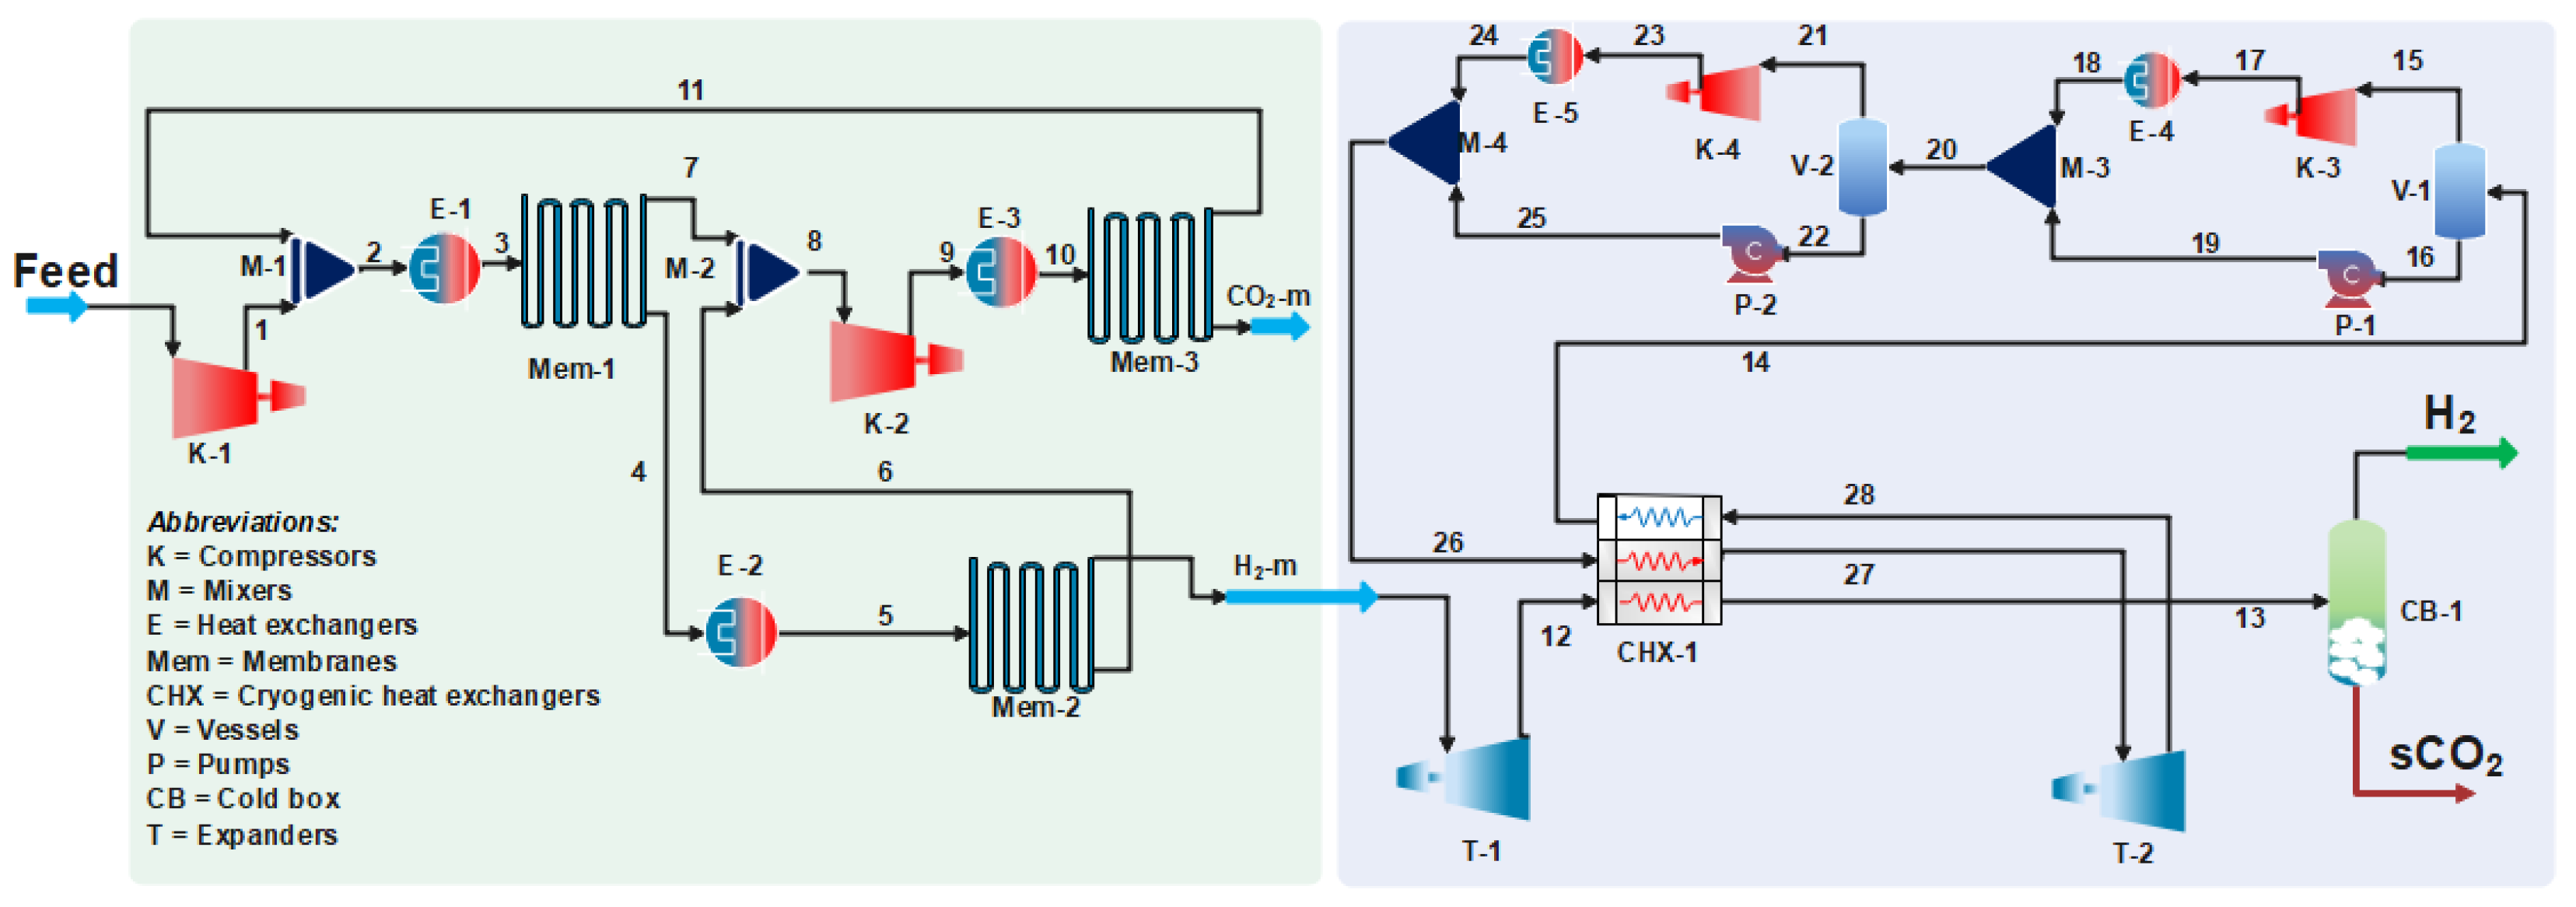
2.1. Process Description and Simulation

H2 can be produced from various sources and its composition varies widely based on these sources. The present study considered the feed conditions and composition from the works of Xu et al. [34], as this mixture represents typical fuel conversion technologies. The feed gas enters the membrane section first, followed by the cryogenic separation to improve the purity level of the H2 gas product. Figure 1 provides an overview of the proposed hybrid scheme, while the pertinent details of each section are mentioned in the following subsections.

2.1.1. Membrane Process

The choice of membranes and their module configuration heavily depends on the components involved in the gaseous mixture and their permeability or the selectivity of the material used. For mixtures like the one used in this study, the membranes can be selective towards H2 or CO2. Glassy membranes are selective towards H2, but the low pressure on the permeate side (H2) is a disadvantage [35]. Since a cryogenic process will be used for enhancing the purity, permeability has been preferred over selectivity, and a rubbery membrane type is used. A two-stage or a two-step approach is commonly used in membrane separation; however, to enhance this separation, a hybrid approach, as presented by Riaz et al. [36], has been considered in the present study. The process involves three spiral-wound membrane modules with H2 on the permeate side. Two compressors (K-1 and K-2) are employed to raise the pressure of the CO2-rich permeate streams to 10 bar. In this study, the membrane material is polyethylene oxide [37], which achieves a CO2/H2 selectivity of 8–15 or more [38]. The gas permeance values in the membrane simulation are CO2 = 1580 GPU and H2 = 195 GPU [37].

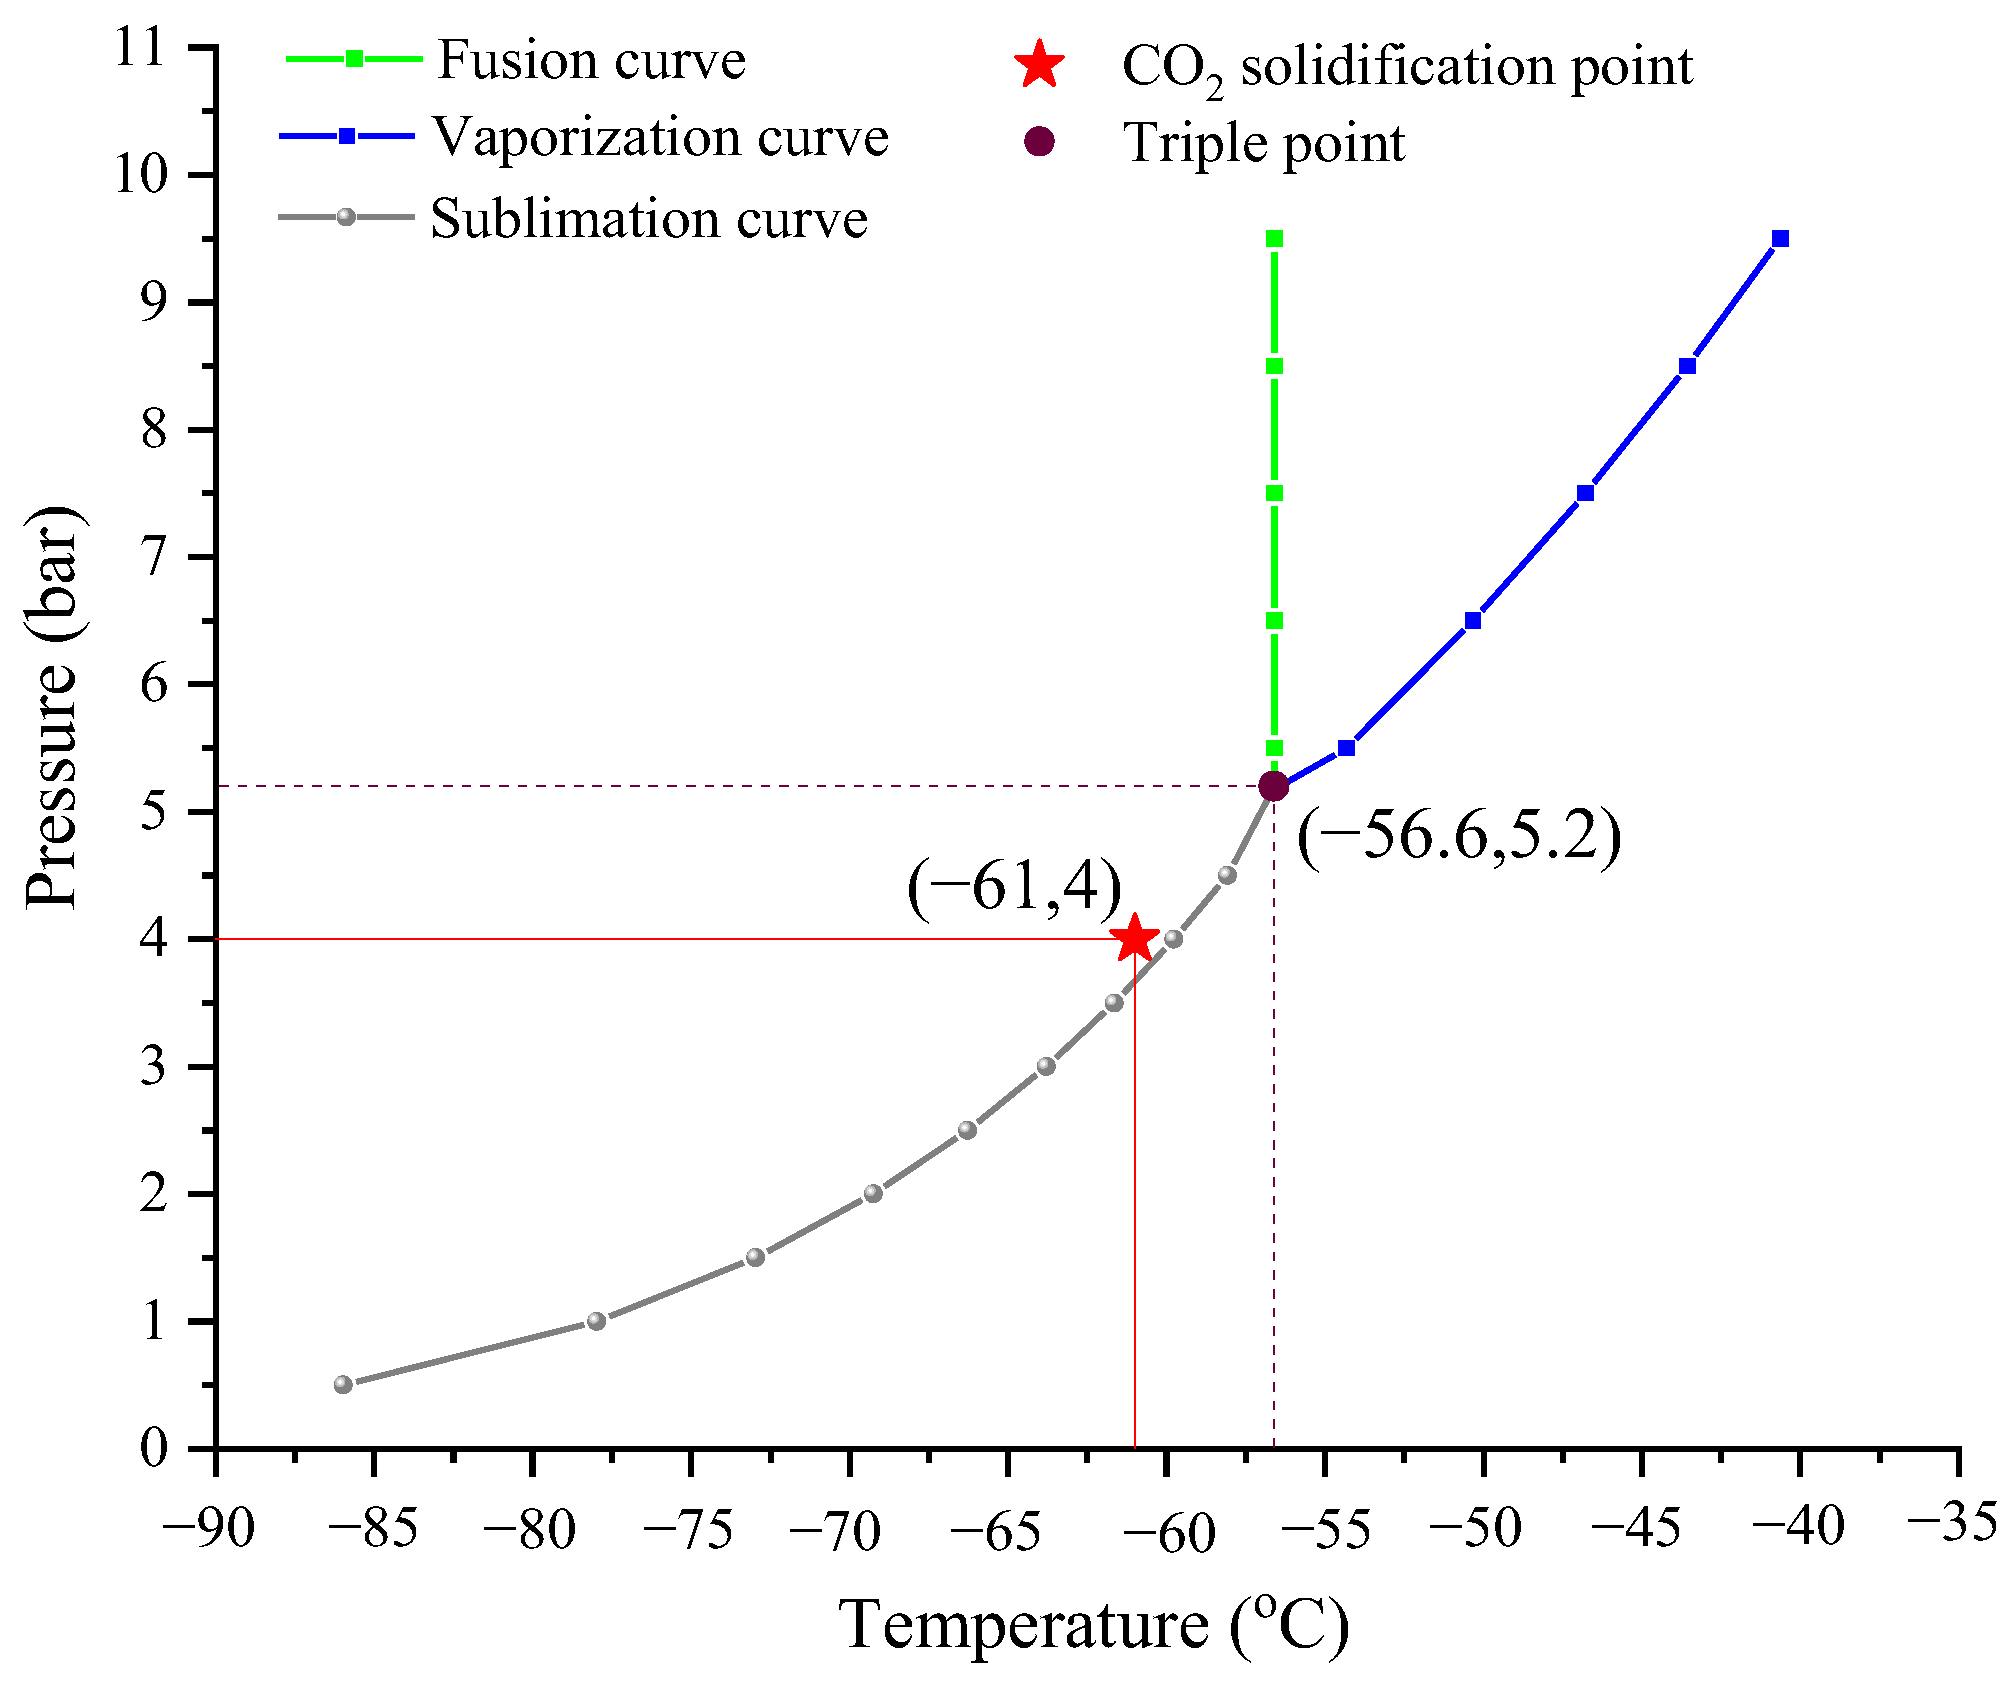
2.1.2. CO2 Solidification Process

H2 is the lightest of the known elements and has a very low boiling point (−252.8 °C), second only to Helium. However, CO2 can be solidified via an anti-sublimation process, whereby CO2 vapors are directly transformed into the solid state. This feat can be achieved within a specific temperature and pressure range, i.e., 1 bar and −81 °C to 6.3 bar and −56 °C [39]. The same technique has been applied to separating CH4 from Biogas [40].
In the present study, the H2-rich stream obtained from the retentate side of the membrane section is at 10 bar and 25 °C. The gas is expanded to 4 bar pressure via an expander (T-1) and passed through a multi-stream heat exchanger (CHX-1), wherein its temperature is further reduced to −58 °C. This cold gas stream then enters the specially designed cold box (CB-1), in which the temperature is further dropped to −61 °C. The small residual quantity of the CO2 solidifies in this chamber and the pure H2 is obtained from the top. The solidified CO2 is periodically removed from the cold box. The suitable conditions to perform this solidification phenomenon are chosen based on the phase behavior of the CO2, as shown in Figure 2.
Figure 2 shows that the product CO2 conditions (−61 °C and 4 bar) lie in the solid region below the triple point, which ensures the CO2 solidification conditions. Furthermore, this process is validated by a recent study from Yurata et al. [41]. In this study, an ethane- and propane-based mixed refrigerant (MR) in an external refrigerant cycle is used for cooling purposes in CHX-1. The MR is compressed to 14.4 bar and cooled to 23 °C in a series of compressors (K-3 and K-4) and coolers (E-4 and E-5). The MR is then passed through CHX-1 to reduce the temperature to −44.1 °C. After the temperature reduction, the pressure of MR is reduced to 1.17 bar. The low-pressure MR at 1.17 bar and −59 °C is again passed through CHX-1 to exchange its cold energy with the feed stream and MR stream. After exchanging heat, the MR stream (14) is recycled back to complete the refrigeration loop.

2.1.3. Process Simulation

The entire process is simulated in Aspen HYSYS® V14, using Peng Robinson [42] as the fluid property package. The equation of state is the flagship thermodynamic model in the Aspen database, which has been endorsed by numerous scientists [41,43]. Table 1 presents the design parameters used in the present study, whereas Table 2 describes the refrigerants’ flows and cycle operating conditions.
It is pertinent to mention the assumptions made to simulate the proposed process successfully. This is crucial for the reproducibility of this work and in line with other works using similar or even more extreme conditions [44,45]. Following is the list:
  • No experimental data are available on the amount of CO2 that solidifies under the operating conditions; a 100% solidification rate is assumed.
  • The compressors in the refrigeration cycle are operated with a compression ratio of ≤3.0.
  • The pressure drop across all the coolers and heat exchangers is considered to be negligible.
  • The efficiencies of the compressors, pumps, and expanders are maintained at 75%.
  • The minimum internal approach temperature (MITA) for the multi-stream heat exchanger is maintained at 1.0–2.0 °C.
  • The heat loss is considered to be negligible.
The composition data of the major process streams are presented in Table 3.

2.2. Process Optimization

In combination with the thermodynamic knowledge of the process, the built-in optimization environment of Aspen Hysys v14 is used to determine the optimal values of the design variables in the proposed process. In Aspen Hysys, many optimization schemes are available, such as Fletcher Reeves, Quasi-Newton, Box, sequential quadratic programming (SQP), and Mixed. In this study, a BOX optimization scheme is used to evaluate and determine the optimal values of the design variables against the minimal energy consumption. Box optimization is suitable for handling inequality constraints. Inside the cryogenic heat exchangers (CHX-1), the minimum temperature approach value of 1.0 °C is applied as a constraint during the optimization. The objective function of the optimization is to reduce the energy consumption.

2.3. Energy Analysis

The energy analysis of the proposed process includes an evaluation of the design variables and composite curves. The method for the energy analysis is given in the following subsections.

2.3.1. Design Variable Analysis

The proposed integrated process is divided into two main subsections, i.e., the membrane section and the desublimation section. The design variable analysis is conducted based on each section’s SEC. The design variables include the membrane pressure, refrigeration cycle flowrates, suction, and discharge pressure of each cycle. The values of these design variables are presented in Table 5.

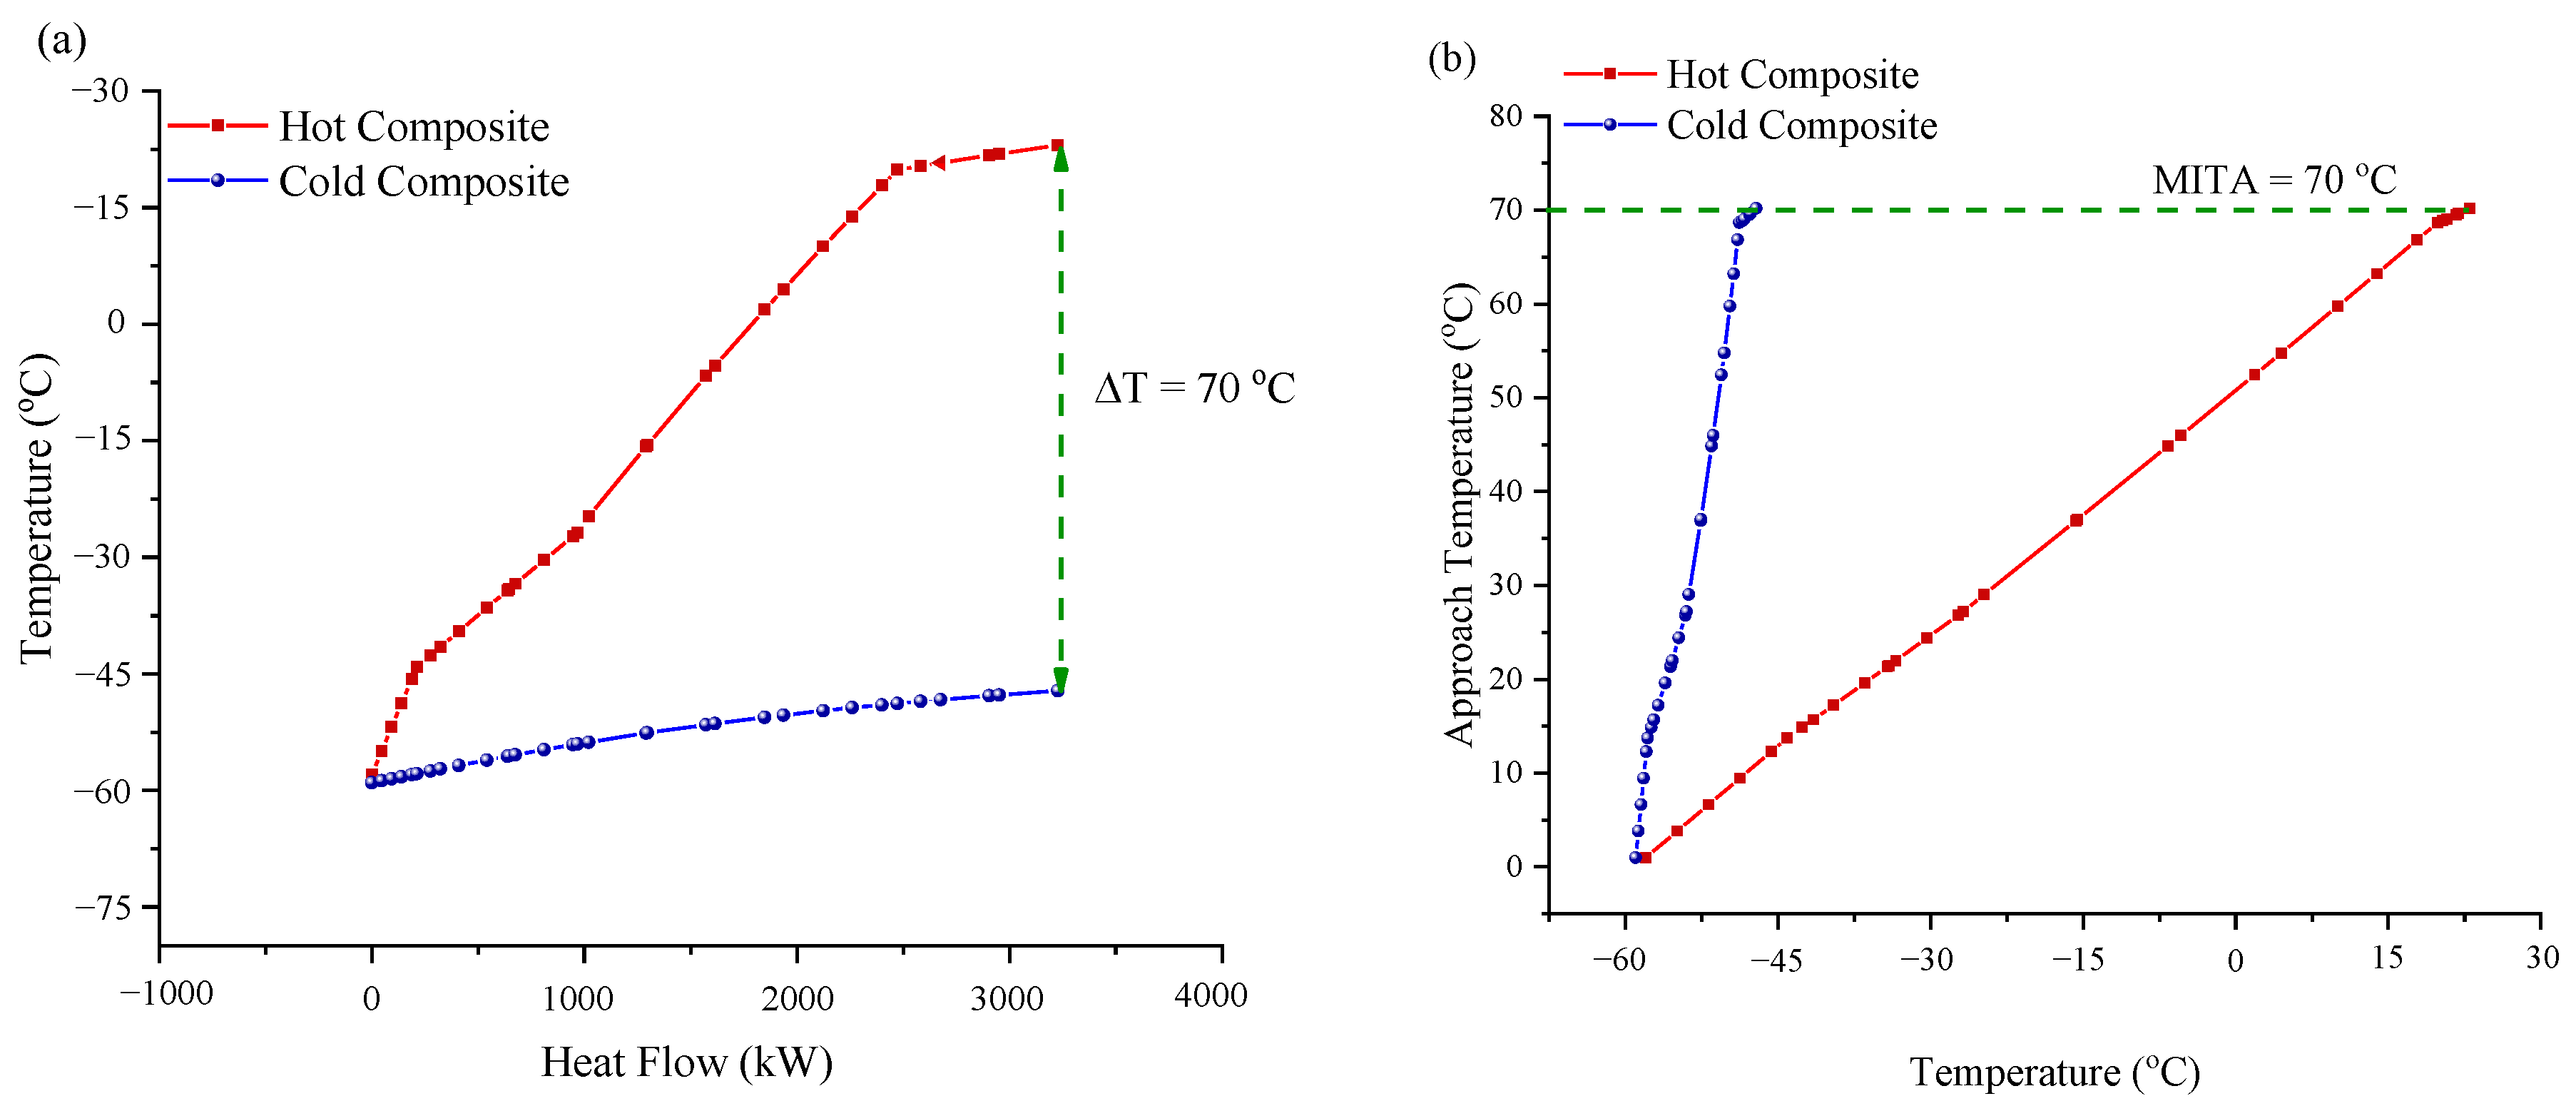
2.3.2. Composite Curve Analysis

A composite curve (CC) analysis of the proposed study is performed to analyze the heat flow within the hot and cold streams of the multi-stream heat exchanger (CHX-1). A variation in the heat flow concerning the temperature along the length of the CHX-1 is observed in terms of the temperature heat flow CCs (THCCs). The variation in the temperature approach concerning the temperature is analyzed in temperature difference CCs (TDCCs). The minimum temperature approach in TDCC is expressed as the minimum internal temperature approach (MITA). The investigation of the MITA value is essential, as it validates the feasibility of the heat exchanger. The value of the MITA in the proposed study is set as 1 °C [39].

2.4. Exergy Analysis

The exergy analysis of the process provides insight into its inefficiencies. The total exergy of the process system consists of the potential, kinetic, physical, and chemical exergies. The proposed process is assumed to be in a steady state, at ground level, and involve no chemical reaction; therefore, the potential, kinetic, and chemical exergies are neglected for the studied system. The values of the physical exergy are taken from the Aspen Hysys v14. The analysis is performed by calculating the exergy destruction across each piece of equipment. The formulas for the physical exergy (Equation (1)) are shown below:
e x p h , i = h i h o T o ( s i s o )
whereas e x p h , i is the physical exergy, h i is the enthalpy of the component i , h o is the enthalpy at the standard state, S i is the entropy of the component i , S o is the entropy at the standard state, and T o is the temperature at the standard state. The standard state is 1 atm and 298.15 K. The exergy destruction of each piece of equipment is calculated using the equations given in Table 4.
The mass flow rate of the stream under observation is given as m ˙ . Additionally, the exergies of the input streams are given as e x i n and as e x o u t for the output streams, W ˙ is the work required to provide refrigeration or heating, and Q is the heat supplied.

2.5. Economic Analysis

The economic analysis of the proposed process includes calculations of the total capital investment (TCI), total operating cost (TOC), and total annualized cost (TAC). In the proposed process, the membrane section includes membranes, compressors, and coolers. In the desublimation section, compressors, coolers, expanders, a heat exchanger, and the cold box are the major equipment. The cost of the membrane is calculated using relations from the literature [46]. The cost relations for each piece of equipment are taken from Turton et al. [47]. However, the cost relation for the compressors (Equation (2)) is taken from a study by Ahmad et al. [48].
C C o m p = 8650 × W C o m p η C o m p 0.82
where C C o m p = the cost of the compressor, W C o m p = the power required by the compressor (hp), and η C o m p = the efficiency of the compressor.
The relation for estimating the purchasing cost is presented in Equation (3). The operating costs include the electricity, cooling, labor, maintenance, and other costs.
l o g E p c = C 1 + C 2 l o g A + C 3 l o g A 2
whereas E p c = purchased cost of the equipment, C = the equipment cost constants, and A = the equipment capacity.

3. Results and Discussion: Process Analysis

3.1. Energy Analysis

In the energy analysis, the design variables and CC analysis are the main two parameters upon which the analysis of the proposed integrated system is performed.

3.1.1. Design Variables Analysis

In the design variable analysis, the effect on the system is observed by varying the values of the design variables until the optimal value is gained. The design variables’ values are presented in Table 5.
Table 5 shows that the value of the high pressure in the membranes is 10 bar. This pressure value is opted for to maximize the separation and minimize the membrane areas. The values of the optimum membrane areas are 9000, 500, and 1000 m2, respectively. In the desublimation cycle, the values of the refrigerant flowrate, i.e., C2 and C3, are 2.305 kg/s and 9.962 kg/s, respectively. The discharge and suction pressure values are 14.4 bar and 1.17 bar, respectively. The desublimation temperature and pressure conditions are adopted considering the phase behavior of the CO2 (see Figure 2). These values are optimally selected, keeping the MITA at 1.0 °C. The final purity and recovery of the H2 obtained are 99.99% and 95.9%, respectively. The goal of the optimization is to minimize the SEC, achieving a high purity and recovery of H2 while keeping the MITA within its limits. The values of the membrane section SEC, desublimation section SEC, and net process SEC are presented in Table 6.
The values of the energy consumption and energy generation and the MITA values of the turbines, expanders, and CHX-1, respectively, are significantly impacted by varying the values of the design variables. If the flow rate of the refrigerant increases, so does the energy consumption, and vice versa. It is also analyzed that the energy consumption also increases by increasing the discharge pressure of a cycle. Similarly, by increasing the suction pressure, the net energy consumption will also increase. The effect of the design variables is proportional to the net energy consumption.

3.1.2. Composite Curve (CC) Analysis

A CC analysis of the proposed process is performed. Figure 3 presents the THCC and TDCC of the CHX-1.
Figure 3a shows the significant gap between the hot and cold CCs at the hot end of the CHX-1. At the hot end, the temperature difference between the hot and cold CCs is 70 °C. This high temperature is because of the temperatures of streams 26 and 14. The temperature of stream 26 is fixed because of the cooler outlet temperature; however, stream 14’s temperature can be adjusted by adjusting the refrigerant compositions, flowrate, or pressures. By adjusting these stream conditions, the gap at the hot end can be reduced in order to minimize the entropy generation or exergy destruction. However, adjusting the temperature of stream 14 affects the MITA value at both the hot and cold ends, which leads to a negative MITA value. Similarly, Figure 4b shows the change in the approach temperature (or MITA) value along the length of the CHX-1. The higher the peak of CC, the higher the MITA value will be. This peak should be low (~1 °C). At the cold end, the value of the approach temperature is 1 °C, which shows that the cold end is efficient in terms of generating less entropy.

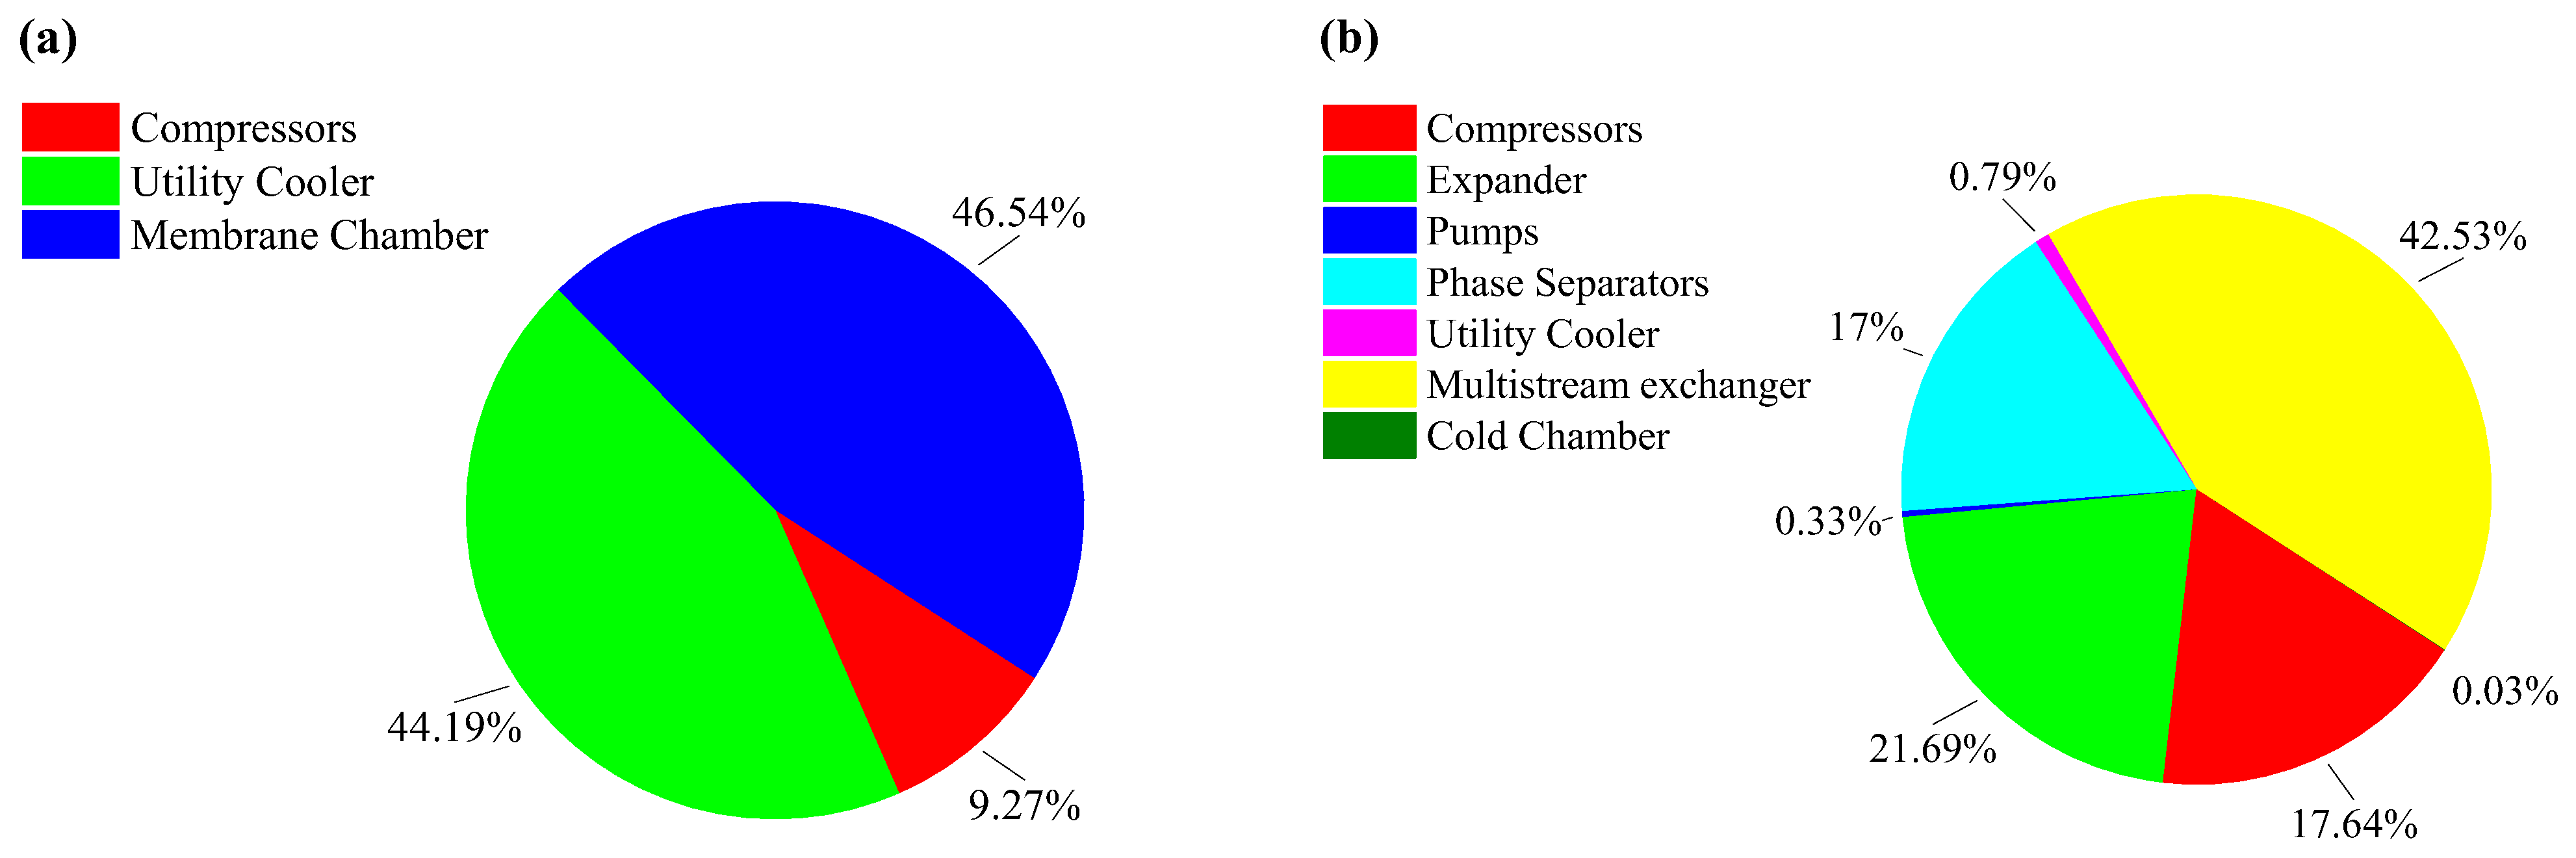
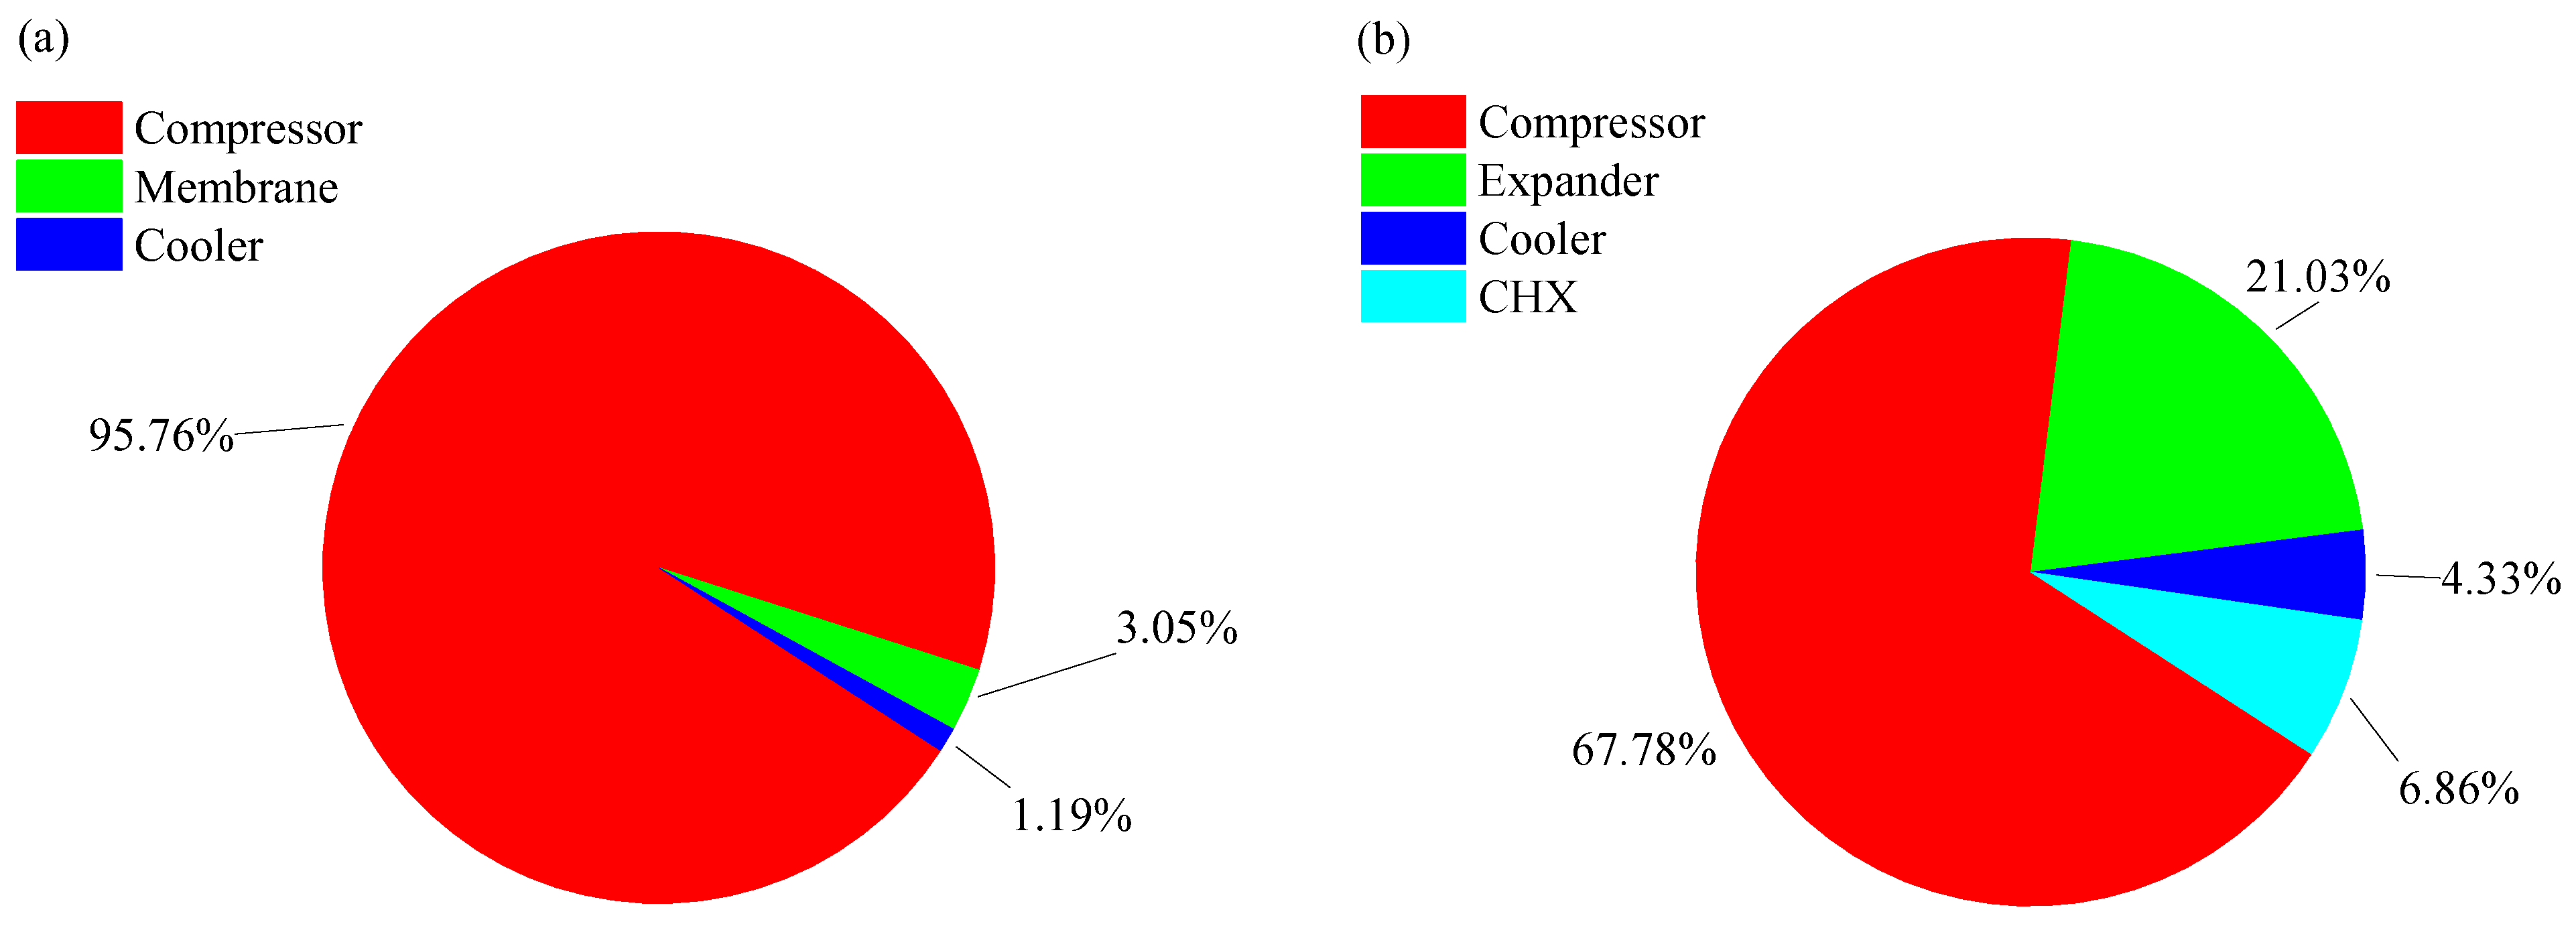
3.2. Exergy Analysis

The values of the exergy destruction (in kW) of the equipment are illustrated in Table 7, which shows the results of the performed exergy destruction analysis.
The exergy destruction in the membrane section is higher than that in the desublimation section. In this section, the coolers and membranes show the highest exergy destruction among the other unit operations in the whole process. The compressors, on the other hand, show the second-highest exergy destruction. The main reason for this high exergy destruction in the membrane section is due to the feed flow rate. The feed flow rate is high in the membrane section compared to the desublimation section because of the separated CO2 from the membrane section. In the desublimation section, the input feed flow rate is less, which leads to a low exergy destruction. In this section, the CHX-1 is the major source of the exergy destruction, i.e., 693 kW, followed by the expanders (353.5 kW) and compressors (287 kW). The major reason for this high exergy destruction in the CHX-1 is because of the large temperature difference between the streams. Figure 4 shows the percentage of the exergy destruction of the equipment in the membrane and desublimation sections.
According to Figure 4, the membrane chamber’s exergy destruction share is 46.54%, followed by the coolers share of 44.19 %. The remaining share of 9.27% is occupied by the compressors. Similarly, in the desublimation section, the CHX-1 occupies the highest share (42.5%), followed by the expanders (21.6%) and compressors (17.6%). The exergy destruction in the CHX-1 can be further reduced by reducing the temperature difference between the streams.

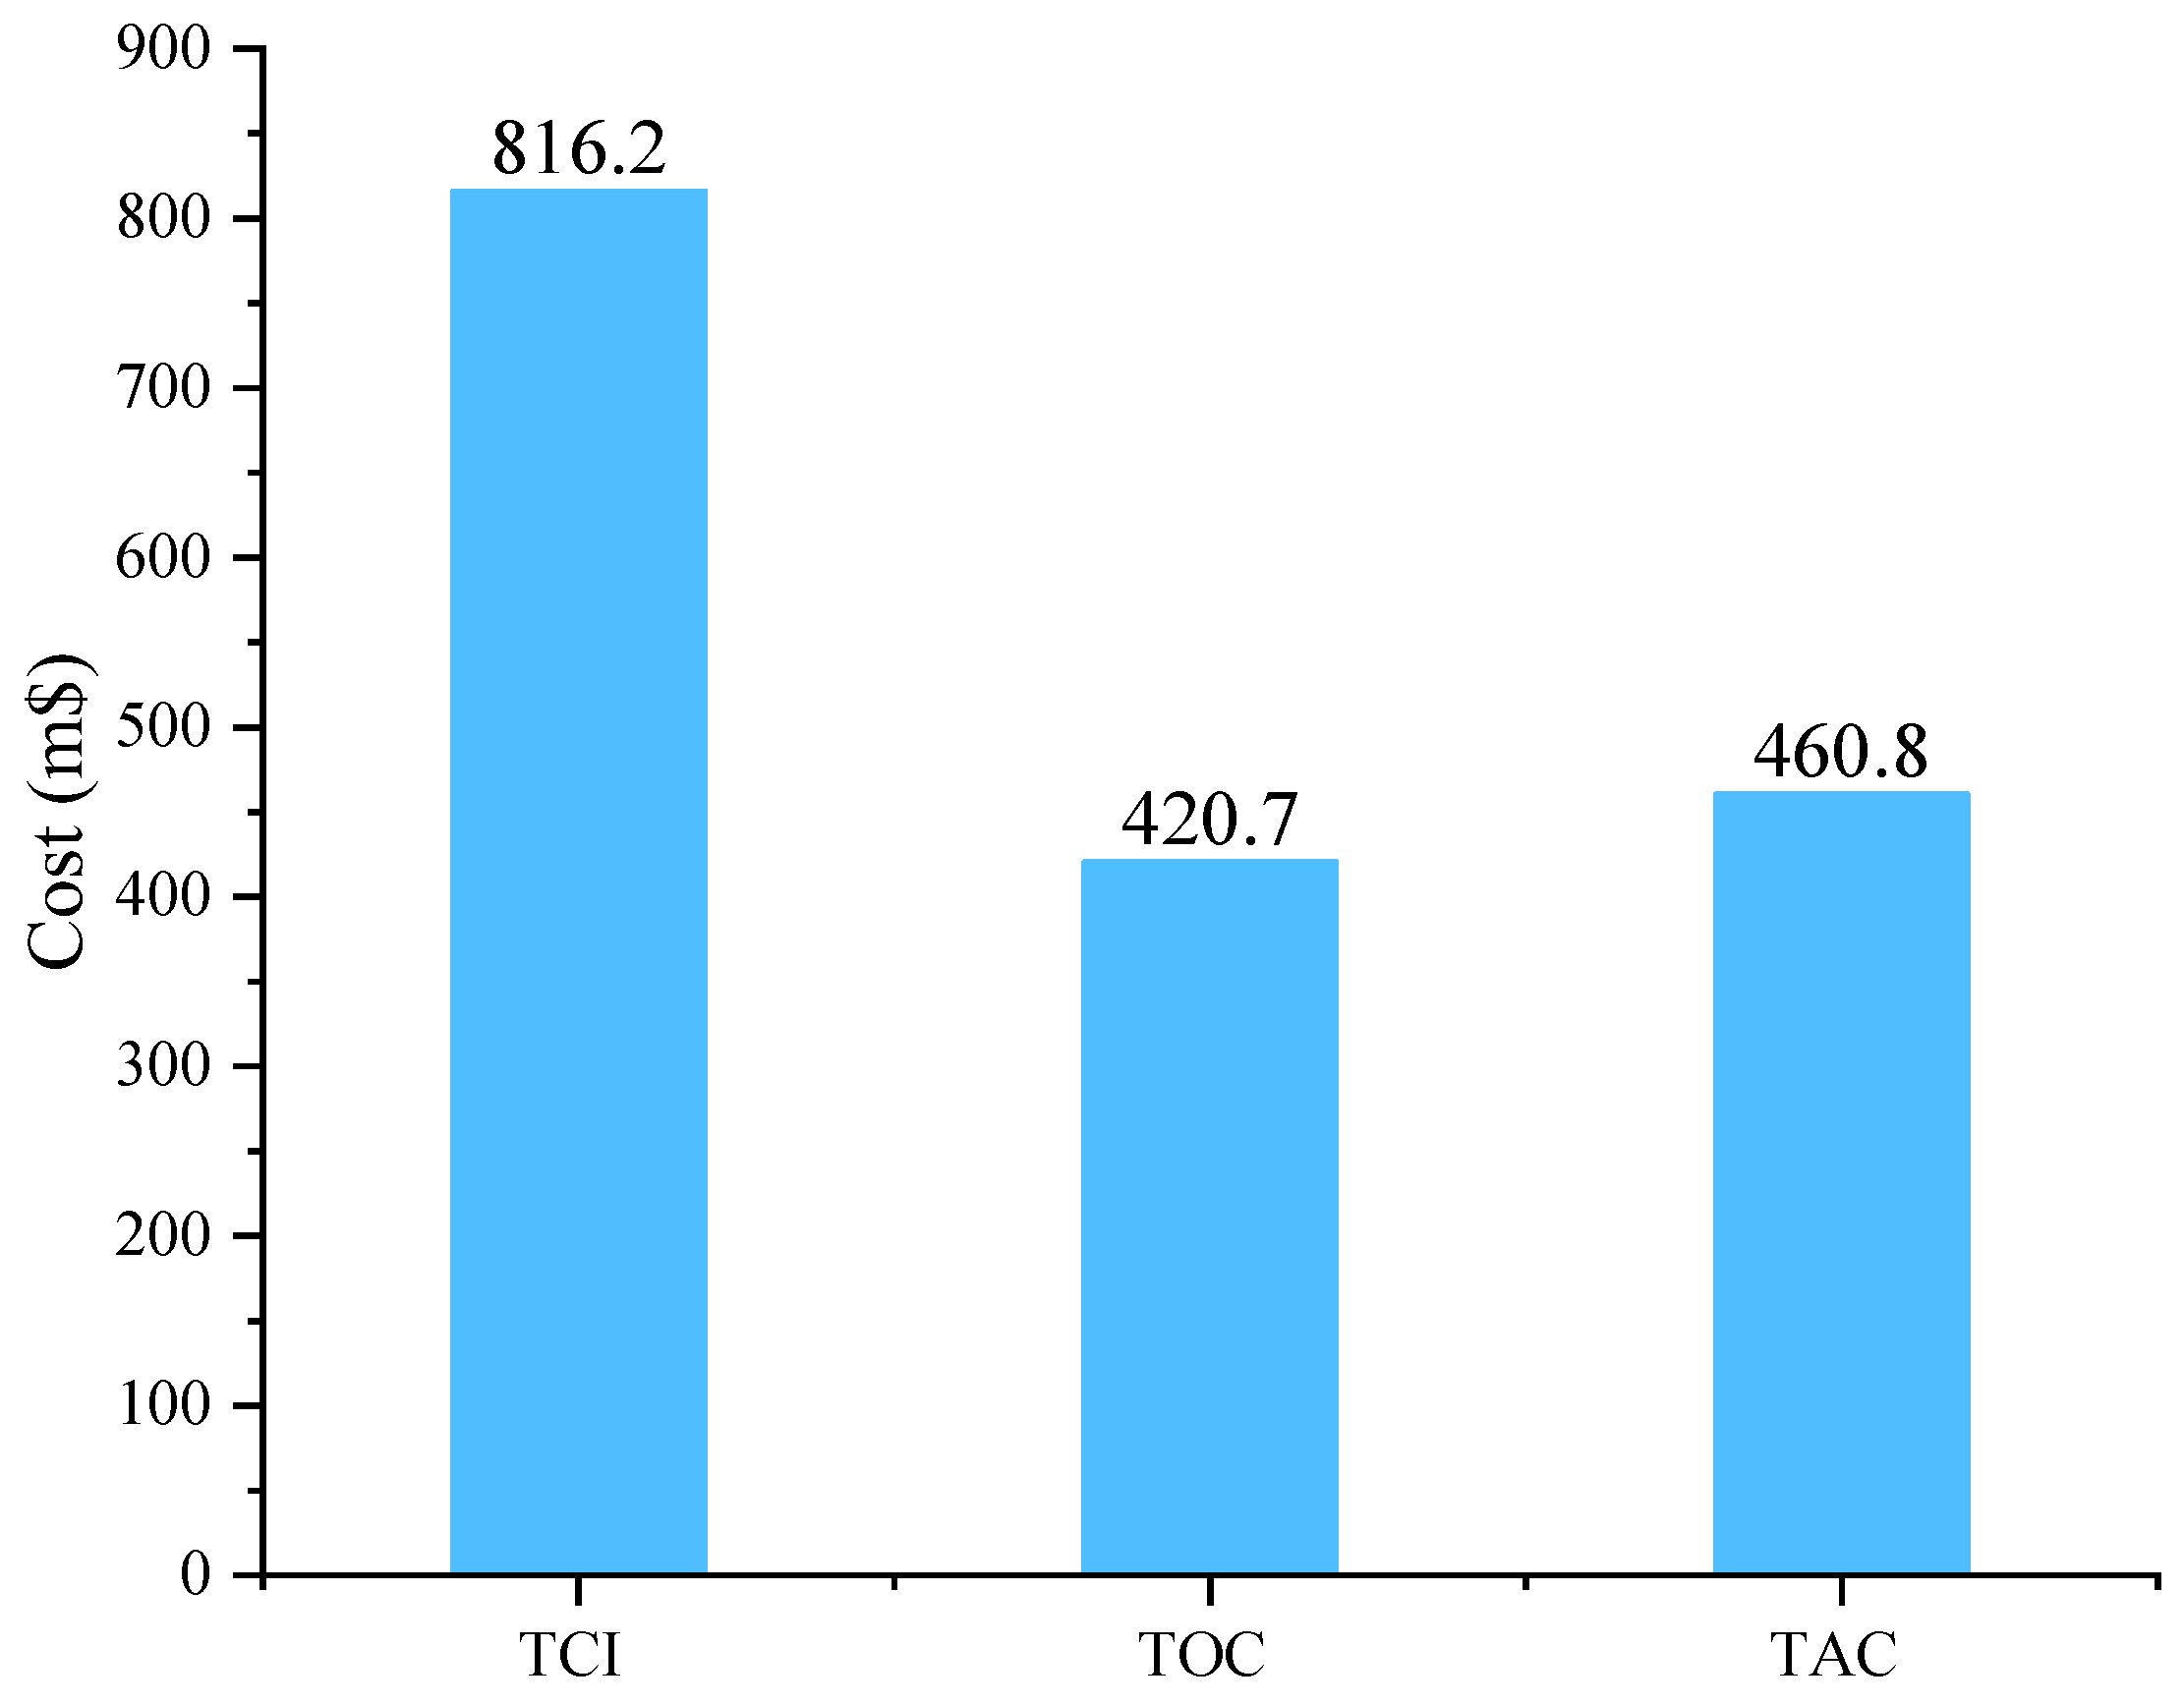
3.3. Economic Analysis

Figure 5 shows the cost breakdown of the proposed process.
Figure 5 shows that the TCI of the process is 816.2 m$, whereas the TAC and TOC of the process are 460.8 m$/y and 420.7 m$/y, respectively. The TCI comprises all the equipment costs related to the membrane and desublimation sections. The share of the equipment costs in both sections is presented in Figure 6.
According to Figure 6, the major share of the TCI in the membrane section comprises the compressors (95.7%), followed by the membranes (3.05%) and coolers (1.19%). The major reason for the high TCI of the compressors is because of the high energy consumption of the compressors. In the desublimation section, the major share of the TCI comes from the compressors (67.78 %), followed by the expanders (21.03%) and CHX-1 (6.86%). The high energy consumption in the compressors is the main reason for this high TCI in the compressors.

3.4. Comparison with Conceptual Studies

In Table 8, a brief comparison of the proposed study and previous studies is presented. The proposed study is efficient in terms of a high H2 purity, whereas the H2 recovery is competitive with other processes. However, it is important to note that Table 8 provides a brief overview of the studies’ comparison. A detailed comparison is not possible because of the different feed and product conditions, design parameters, and process configurations.

4. Conclusions and Future Work

With the growing attention towards the H2 economy, the production of high-purity H2 is becoming essential. High-purity H2 is used in many applications, such as H2 fuel cells and the production of liquid H2. The production of high-purity H2 with a high recovery and low energy consumption is a challenging issue. Unlike standalone technologies, integrated processes show commitment towards high-purity H2. The proposed integrated membrane–cryogenic process produced H2 with a 99.99% purity and 95.9 % recovery. The net SEC of the proposed process was 2.37 kWh/kg. In the integrated process, the membrane and multi-stream heat exchanger were the major sources of the exergy destruction. The total annualized cost of the integrated process was 460.8 m$/y. This proposed integration could be advantageous for boosting a H2 economy. The future work on the proposed process may include a detailed evaluation from an advanced exergy analysis.

Author Contributions

Conceptualization, methodology, and software, A.N.; methodology, A.N.; software, A.N. and Y.D.C.; formal analysis, A.N. and A.R.; writing—original draft preparation, A.N. and A.R.; writing—review and editing, F.Y.; supervision, H.L. and M.L.; funding acquisition, M.L. All authors have read and agreed to the published version of the manuscript.

Funding

This work was supported by the 2023 Yeungnam University Research Grant.

Data Availability Statement

Data is unavailable due to privacy or ethical restrictions.

Conflicts of Interest

The authors declare no competing financial interest.

References

  1. IEA. CO2 Emissions in 2022. Available online: https://www.iea.org/reports/co2-emissions-in-2022 (accessed on 14 June 2023).
  2. Gourinchas, P.-O. Global Economic Growth Slows Amid Gloomy and More Uncertain Outlook 2023. Available online: https://www.imf.org/en/Blogs/Articles/2022/07/26/blog-weo-update-july-2022 (accessed on 14 June 2023).
  3. Qyyum, M.A.; Dickson, R.; Shah, S.F.A.; Niaz, H.; Khan, A.; Liu, J.J.; Lee, M. Availability, versatility, and viability of feedstocks for hydrogen production: Product space perspective. Renew. Sustain. Energy Rev. 2021, 145, 110843. [Google Scholar] [CrossRef]
  4. Osman, A.I.; Mehta, N.; Elgarahy, A.M.; Hefny, M.; Al-Hinai, A.; Al-Muhtaseb, A.H. Hydrogen production, storage, utilisation and environmental impacts: A review. Environ. Chem. Lett. 2021, 20, 153–188. [Google Scholar] [CrossRef]
  5. U.S. Department of Energy. Hydrogen Program Plan 2020. Available online: www.hydrogen.energy.gov/pdfs/hydrogen-program-plan-2020.pdf (accessed on 14 June 2023).
  6. Stenina, I.; Yaroslavtsev, A. Modern Technologies of Hydrogen Production. Process 2022, 11, 56. [Google Scholar] [CrossRef]
  7. Ishaq, H.; Dincer, I.; Crawford, C. A review on hydrogen production and utilization: Challenges and opportunities. Int. J. Hydrog. Energy 2021, 47, 26238–26264. [Google Scholar] [CrossRef]
  8. Younas, M.; Shafique, S.; Hafeez, A.; Javed, F.; Rehman, F. An Overview of Hydrogen Production: Current Status, Potential, and Challenges. Fuel 2022, 316, 123317. [Google Scholar] [CrossRef]
  9. Du, Z.; Liu, C.; Zhai, J.; Guo, X.; Xiong, Y.; Su, W.; He, G. A review of hydrogen purification technologies for fuel cell vehicles. Catalysts 2021, 11, 393. [Google Scholar] [CrossRef]
  10. Wickham, D.; Hawkes, A.; Jalil-Vega, F. Hydrogen supply chain optimisation for the transport sector—Focus on hydrogen purity and purification requirements. Appl. Energy 2022, 305, 117740. [Google Scholar] [CrossRef]
  11. Genovese, M.; Cigolotti, V.; Jannelli, E.; Fragiacomo, P. Current standards and configurations for the permitting and operation of hydrogen refueling stations. Int. J. Hydrog. Energy 2023, 48, 19357–19371. [Google Scholar] [CrossRef]
  12. Vermaak, L.; Neomagus, H.W.J.P.; Bessarabov, D.G. Recent advances in membrane-based electrochemical hydrogen separation: A review. Membranes 2021, 11, 127. [Google Scholar] [CrossRef]
  13. Schorer, L.; Schmitz, S.; Weber, A. Membrane based purification of hydrogen system (MEMPHYS). Int. J. Hydrog. Energy 2019, 44, 12708–12714. [Google Scholar] [CrossRef]
  14. Lei, L.; Bai, L.; Lindbråthen, A.; Pan, F.; Zhang, X.; He, X. Carbon membranes for CO2 removal: Status and perspectives from materials to processes. Chem. Eng. J. 2020, 401, 126084. [Google Scholar] [CrossRef]
  15. Amosova, O.L.; Malykh, O.V.; Teplyakov, V.V. Integrated membrane/PSA systems for hydrogen recovery from gas mixtures. Desalin Water Treat. 2010, 14, 119–126. [Google Scholar] [CrossRef]
  16. Li, B.; He, G.; Jiang, X.; Dai, Y.; Ruan, X. Pressure swing adsorption/membrane hybrid processes for hydrogen purification with a high recovery. Front. Chem. Sci. Eng. 2016, 10, 255–264. [Google Scholar] [CrossRef]
  17. Ohs, B.; Falkenberg, M.; Wessling, M. Optimizing hybrid membrane-pressure swing adsorption processes for biogenic hydrogen recovery. Chem. Eng. J. 2019, 364, 452–461. [Google Scholar] [CrossRef]
  18. Lin, L.; Tian, Y.; Su, W.; Luo, Y.; Chen, C.; Jiang, L. Techno-economic analysis and comprehensive optimization of an on-site hydrogen refuelling station system using ammonia: Hybrid hydrogen purification with both high H2 purity and high recovery. Sustain. Energy Fuels 2020, 4, 3006–3017. [Google Scholar] [CrossRef]
  19. Ma, B.; Deng, C.; Chen, H.; Zhu, M.; Yang, M.; Feng, X. Hybrid Separation Process of Refinery Off-gas toward Near-Zero Hydrogen Emission: Conceptual Design and Techno-economic Analysis. Ind. Eng. Chem. Res. 2020, 59, 8715–8727. [Google Scholar] [CrossRef]
  20. Terrien, P.; Lockwood, F.; Granados, L.; Morel, T. CO2 capture from H2 plants: Implementation for, EOR. Energy Procedia 2014, 63, 7861–7866. [Google Scholar] [CrossRef] [Green Version]
  21. Pichot, D.; Granados, L.; Morel, T.; Schuller, A.; Dubettier, R.; Lockwood, F. Start-up of Port-Jérôme CRYOCAPTM Plant: Optimized Cryogenic CO2 Capture from H2 Plants. Energy Procedia 2017, 114, 2682–2689. [Google Scholar] [CrossRef]
  22. Van Acht, S.C.J.; Laycock, C.; Carr, S.J.W.; Maddy, J.; Guwy, A.J.; Lloyd, G.; Raymakers, L.F.J.M. Simulation of integrated novel PSA/EHP/C process for high-pressure hydrogen recovery from Coke Oven Gas. Int. J. Hydrog. Energy 2020, 45, 15196–15212. [Google Scholar] [CrossRef]
  23. Scholz, M. Membrane-Cryogenic Hybrid Processes. In Encyclopedia of Membranes; Drioli, E., Giorno, L., Eds.; Springer: Berlin/Heidelberg, Garmany, 2015. [Google Scholar] [CrossRef]
  24. Agrawal, R.; Auvil, S.R.; DiMartino, S.P.; Choe, J.S.; Hopkins, J.A. Membrane/cryogenic hybrid processes for hydrogen purification. Gas. Sep. Purif. 1988, 2, 9–15. [Google Scholar] [CrossRef]
  25. Baker, R.; Wijmans, J.; Kaschemekat, J. The design of membrane vapor–gas separation systems. J. Memb. Sci. 1998, 151, 55–62. [Google Scholar] [CrossRef]
  26. Baker, R.W.; Lokhandwala, K.A.; Pinnau, I. Ethylene/Nitrogen Separation Process. USOO5879431A, 9 March 1999. [Google Scholar]
  27. Lin, H.; He, Z.; Sun, Z.; Kniep, J.; Ng, A.; Baker, R.W.; Merkel, T.C. CO2-selective membranes for hydrogen production and CO2 capture—Part II: Techno-economic analysis. J. Memb. Sci. 2015, 493, 794–806. [Google Scholar] [CrossRef] [Green Version]
  28. Liao, Z.; Hu, Y.; Wang, J.; Yang, Y.; You, F. Systematic Design and Optimization of a Membrane–Cryogenic Hybrid System for CO 2 Capture. ACS Sustain. Chem. Eng. 2019, 7, 17186–17197. [Google Scholar] [CrossRef]
  29. Liao, Z.; Hu, Y.; Tu, G.; Sun, J.; Jiang, B.; Wang, J.; Yang, Y. Optimal design of hybrid cryogenic flash and membrane system. Chem. Eng. Sci. 2018, 179, 13–31. [Google Scholar] [CrossRef]
  30. Liu, B.; Yang, X.; Chiang, P.C.; Wang, T. Energy Consumption Analysis of Cryogenic-membrane Hybrid Process for CO2 Capture from CO2-EOR Extraction Gas. Aerosol Air Qual. Res. 2020, 20, 820–832. [Google Scholar] [CrossRef]
  31. Wankat, P.C.; Kostroski, K.P. Hybrid membrane-cryogenic distillation air separation process for oxygen production. Sep. Sci. Technol. 2011, 46, 1539–1545. [Google Scholar] [CrossRef]
  32. Burdyny, T.; Struchtrup, H. Hybrid membrane/cryogenic separation of oxygen from air for use in the oxy-fuel process. Energy 2010, 35, 1884–1897. [Google Scholar] [CrossRef]
  33. Park, J.; Kim, K.; Shin, J.-W.; Park, Y.-K. Analysis of Multistage Membrane and Distillation Hybrid Processes for Propylene/Propane Separation. Chem. Eng. Trans. 2019, 74, 871–876. [Google Scholar] [CrossRef]
  34. Xu, G.; Li, L.; Yang, Y.; Tian, L.; Liu, T.; Zhang, K. A novel CO2 cryogenic liquefaction and separation system. Energy 2012, 42, 522–529. [Google Scholar] [CrossRef]
  35. Wukovits, W.; Chudzicki, M.; Makaruk, A.; Friedl, A. Simulation Study on the Applicability and Performance of Conventional and Reverse-Selective Membranes for Upgrading of H2/CO2 Mixtures via Gas-Permeation. Chem. Eng. Trans. 2012, 29, 1171–1176. [Google Scholar] [CrossRef]
  36. Riaz, A.; Chaniago, Y.D.; Hussain, A.; Andika, R.; Kim, G.; Lim, H.; Lee, M. Thermodynamic, economic, and emissions assessment of integrated power to methanol concept with membrane-based biogas up-gradation and plasma electrolysis. J. Clean. Prod. 2022, 363, 132367. [Google Scholar] [CrossRef]
  37. Harlacher, T.; Melin, T.; Wessling, M. Techno-economic Analysis of Membrane-Based Argon Recovery in a Silicon Carbide Process. Ind. Eng. Chem. Res. 2013, 52, 10460–10466. [Google Scholar] [CrossRef]
  38. Huang, W.; Jiang, X.; He, G.; Ruan, X.; Chen, B.; Nizamani, A.K.; Li, X.; Wu, X.; Xiao, W. A Novel Process of H2/CO2 Membrane Separation of Shifted Syngas Coupled with Gasoil Hydrogenation. Processes 2020, 8, 590. [Google Scholar] [CrossRef]
  39. Naquash, A.; Haider, J.; Qyyum, M.A.; Islam, M.; Min, S.; Lee, S.; Lim, H.; Lee, M. Hydrogen enrichment by CO2 anti-sublimation integrated with triple mixed refrigerant-based liquid hydrogen production process. J. Clean. Prod. 2022, 341, 130745. [Google Scholar] [CrossRef]
  40. Naquash, A.; Qyyum, M.A.; Haider, J.; Lim, H.; Lee, M. Renewable LNG production: Biogas upgrading through CO2 solidification integrated with single-loop mixed refrigerant biomethane liquefaction process. Energy Convers. Manag. 2021, 243, 114363. [Google Scholar] [CrossRef]
  41. Yurata, T.; Lei, H.; Tang, L.; Lu, M.; Patel, J.; Lim, S.; Piumsomboon, P.; Chalermsinsuwan, B.; Li, C. Feasibility and sustainability analyses of carbon dioxide—Hydrogen separation via de-sublimation process in comparison with other processes. Int. J. Hydrog. Energy 2019, 44, 23120–23134. [Google Scholar] [CrossRef]
  42. Peng, D.Y.; Robinson, D.B. A New Two-Constant Equation of State. Ind. Eng. Chem. Fundam. 1976, 15, 59–64. [Google Scholar] [CrossRef]
  43. Lopez-Echeverry, J.S.; Reif-Acherman, S.; Araujo-Lopez, E. Peng-Robinson equation of state: 40 years through cubics. Fluid. Phase Equilib. 2017, 447, 39–71. [Google Scholar] [CrossRef]
  44. Aasadnia, M.; Mehrpooya, M. Large-scale liquid hydrogen production methods and approaches: A review. Appl. Energy 2018, 212, 57–83. [Google Scholar] [CrossRef]
  45. Qyyum, M.A.; Riaz, A.; Naquash, A.; Haider, J.; Qadeer, K.; Nawaz, A.; Lee, H.; Lee, M. 100% saturated liquid hydrogen production: Mixed-refrigerant cascaded process with two-stage ortho-to-para hydrogen conversion. Energy Convers. Manag. 2021, 246, 114659. [Google Scholar] [CrossRef]
  46. Naquash, A.; Qyyum, M.A.; Chaniago, Y.D.; Riaz, A.; Yehia, F.; Lim, H.; Lee, M. Separation and purification of syngas-derived hydrogen: A comparative evaluation of membrane- and cryogenic-assisted approaches. Chemosphere 2023, 313, 137420. [Google Scholar] [CrossRef] [PubMed]
  47. Richard, T. Analysis, Synthesis, and Design of Chemical Processes; Prentice Hall: London, UK, 2012. [Google Scholar]
  48. Ahmad, F.; Lau, K.K.; Shariff, A.M.; Murshid, G. Process simulation and optimal design of membrane separation system for CO2 capture from natural gas. Comput. Chem. Eng. 2012, 36, 119–128. [Google Scholar] [CrossRef] [Green Version]
  49. Xe.com. Euros to USD n.d. Available online: https://www.xe.com/ (accessed on 13 June 2023).
Figure 1. Process flow diagram of the proposed integrated process.
Gases 03 00006 g001
Figure 2. Phase diagram of CO2 and CO2 solidification conditions.
Gases 03 00006 g002
Figure 3. (a) THCC and (b) TDCC of CHX-1.
Gases 03 00006 g003
Figure 4. Percentage of exergy destruction of equipment in (a) membrane section, and (b) desublimation section.
Gases 03 00006 g004
Figure 5. TCI, TOC, and TAC of the proposed H2 separation process.
Gases 03 00006 g005
Figure 6. Percentage TCI of (a) membrane section, and (b) desublimation section.
Gases 03 00006 g006
Table 1. Design parameters of the proposed H2 separation and purification process [34].
Feed ConditionsValues
Vapor/Phase Fraction1.00
Temperature (°C)35.00
Pressure (bar)5.00
Mass Flow (kg/s)100.00
H2 (mol%)0.20
Carbon Dioxide (mol%)0.80
Table 2. External refrigerant cycle operational parameters.
Refrigerants ConditionsValues
C2 (mol%)25.33
C3 (mol%)74.67
Suction Pressure (bar)1.18
Discharge Pressure (bar)14.40
Temperature (°C)23.02
Table 3. Composition data for the important process streams (mol%).
Stream IDCO2H2C2C3
Feed0.80000.200000
CO2-m0.99080.009200
H2-m0.99960.000400
14000.25330.7467
H201.00000
sCO21.000000
Table 4. Equations for the calculations of exergy destruction [39].
EquipmentExergy Destruction Equations
Compressors E x = m ˙ e x i n e x o u t + W ˙
Expanders E x = m ˙ e x i n e x o u t W ˙
Pumps E x = m ˙ e x i n e x o u t + W ˙
Phase separators E x = m 1 ˙ e x 1 ( m 2 ˙ e x 2 + m 3 ˙ e x 3 )
Heat exchangers E x = m ˙ e x i n e x o u t
Cryogenic heat exchanger E x = i = 1 n m i ˙ e x i n e x o u t
Cold chamber E x = m 1 ˙ e x 1 m 2 ˙ e x 2 m 3 ˙ e x 3 + Q
Membranes E x = m 1 ˙ e x 1 ( m 2 ˙ e x 2 + m 3 ˙ e x 3 )
Table 5. Design variables analysis results of the proposed integrated system.
SectionVariablesValues
Membrane SeparationHigh pressure (bar)10.0
Low pressure (bar)0.10
Mem-1 area (m2)9000
Mem-2 area (m2)500
Mem-3 area (m2)1000
CO2 purity (%)99.08
CO2 recovery (%)98.13
De-sublimation cycleC2 (kg/s)2.305
C3 (kg/s)9.962
Discharge Pressure (bar)14.40
Suction Pressure (bar)1.177
Desublimation temperature (°C)−61
Desublimation pressure (bar)4.00
CHX-1 MITA (°C)1.00
H2 purity (%)99.96
H2 recovery (%)95.9
Table 6. Net overall specific energy consumption (SEC) of the proposed integrated process.
Membrane section SEC (kWh/kg)2.26
Desublimation section SEC (kWh/kg)0.11
Net SEC (kWh/kg)2.37
Table 7. Exergy destruction values of different equipment are segregated based on unit operations.
SectionEquipmentExergy Destruction (kW)
Membrane sectionCompressors77,274.1
Coolers368,514.5
Membranes388,083.5
Desublimation sectionCompressors287.4
Expanders353.5
Pumps5.3
Vessels277.1
Coolers12.8
CHX-1693.2
Cold box0.5
Table 8. Presents a brief comparison of the proposed process with other conceptual studies.
TechnologyProduct ConditionsEnergy RequirementsCostRef.
Membrane–PSAH2 purity: 99.98 %
H2 recovery: 97%
N/AN/A[16]
Membrane–PSAH2 purity: 99.0 %
H2 recovery: 98%
Energy efficiency: 77.5%H2 production cost: 0.6 €/kg (0.65 $/kg) *[17]
Cryogenic–MembraneH2 purity: 90.4%
H2 recovery: 98%
Energy consumption: 36.6 MWN/A[27]
Cryogenic–MembraneH2 purity: 90%
H2 recovery: 98%
SEC: 0.546 GJ/ton CO2TAC: 40.9 m$/y[28]
This study (Membrane–Cryogenic)H2 purity: 99%
H2 recovery: 96%
SEC: 2.37 kWh/kgTAC: 460.8 m$/y
* 1 EUR = 1.08 USD [49].
Disclaimer/Publisher’s Note: The statements, opinions and data contained in all publications are solely those of the individual author(s) and contributor(s) and not of MDPI and/or the editor(s). MDPI and/or the editor(s) disclaim responsibility for any injury to people or property resulting from any ideas, methods, instructions or products referred to in the content.

