
Computational Fluid Dynamics Analysis of a Hollow Fiber Membrane Module for Binary Gas Mixture


Abstract
:1. Introduction
2. Materials and Methods
2.1. Assumptions
- Steady-state condition is applied.
- Laminar flow is considered with constant physical properties.
- Ideal gas law is used.
- Without axial mixing of gaseous molecules.
- Fiber diameter in the module is uniform.
- Fiber deformation with high inlet pressure is neglected.
- Solution-diffusion mechanism is used for membrane gas separation.
2.2. Mass Transport Mathematical Modeling
2.2.1. Convection and Diffusion Models
2.2.2. Diffusion
2.2.3. Membrane Model
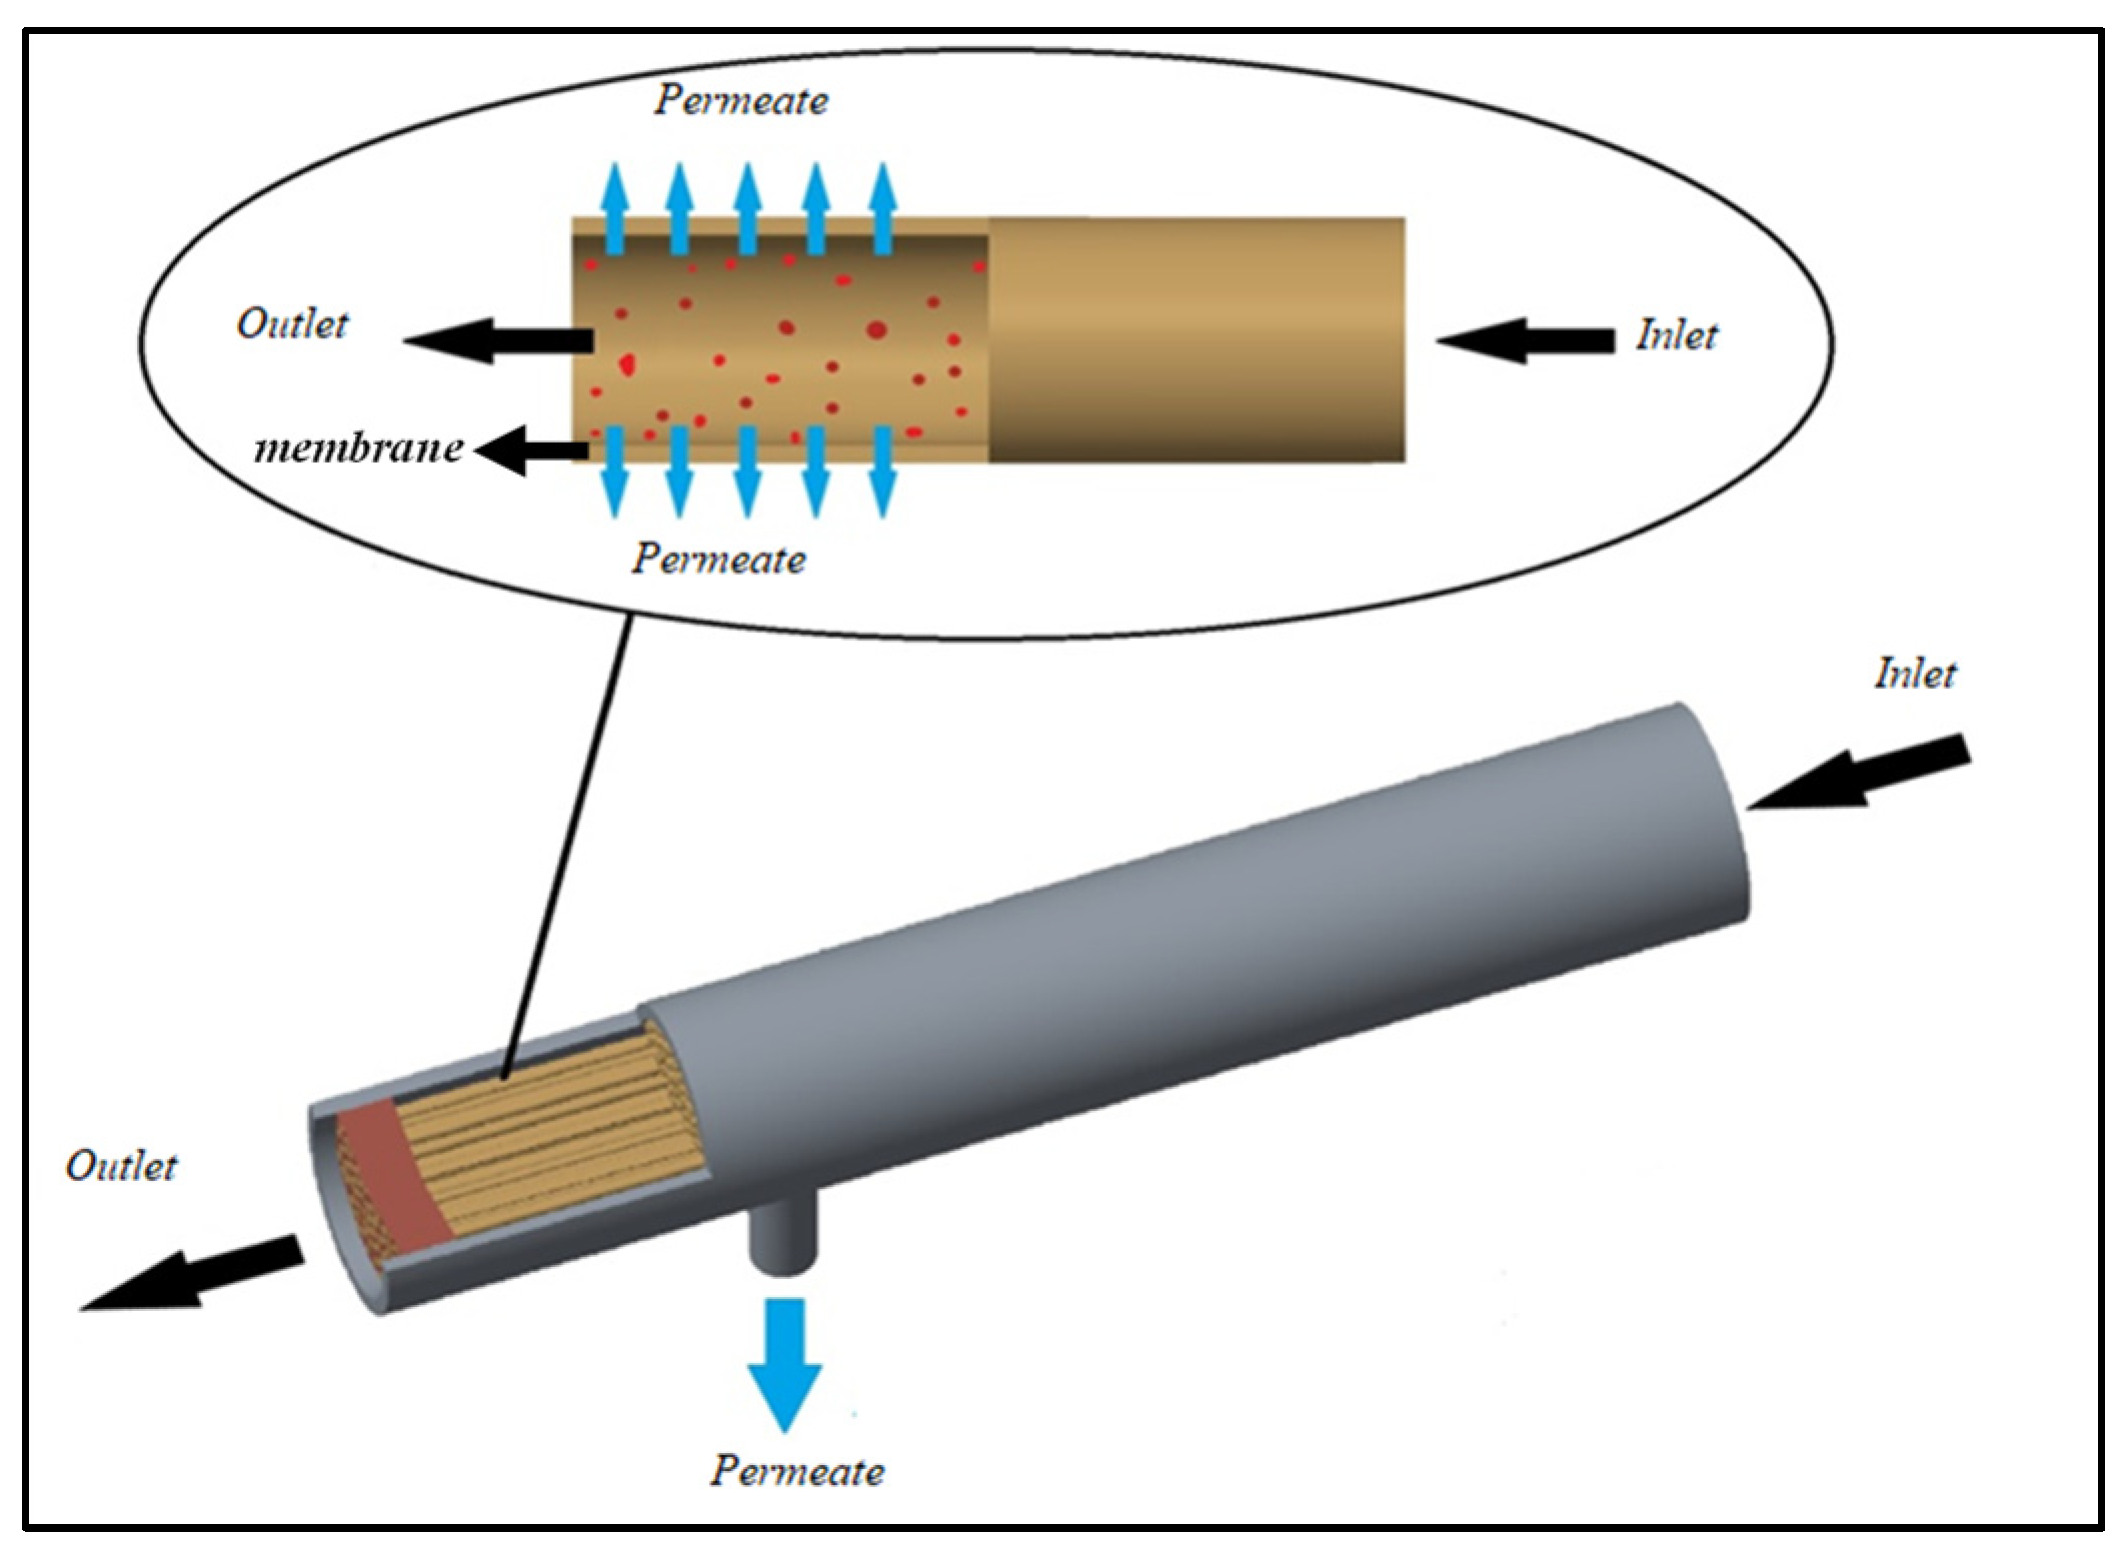
2.2.4. Flow through Membrane in HFM Module
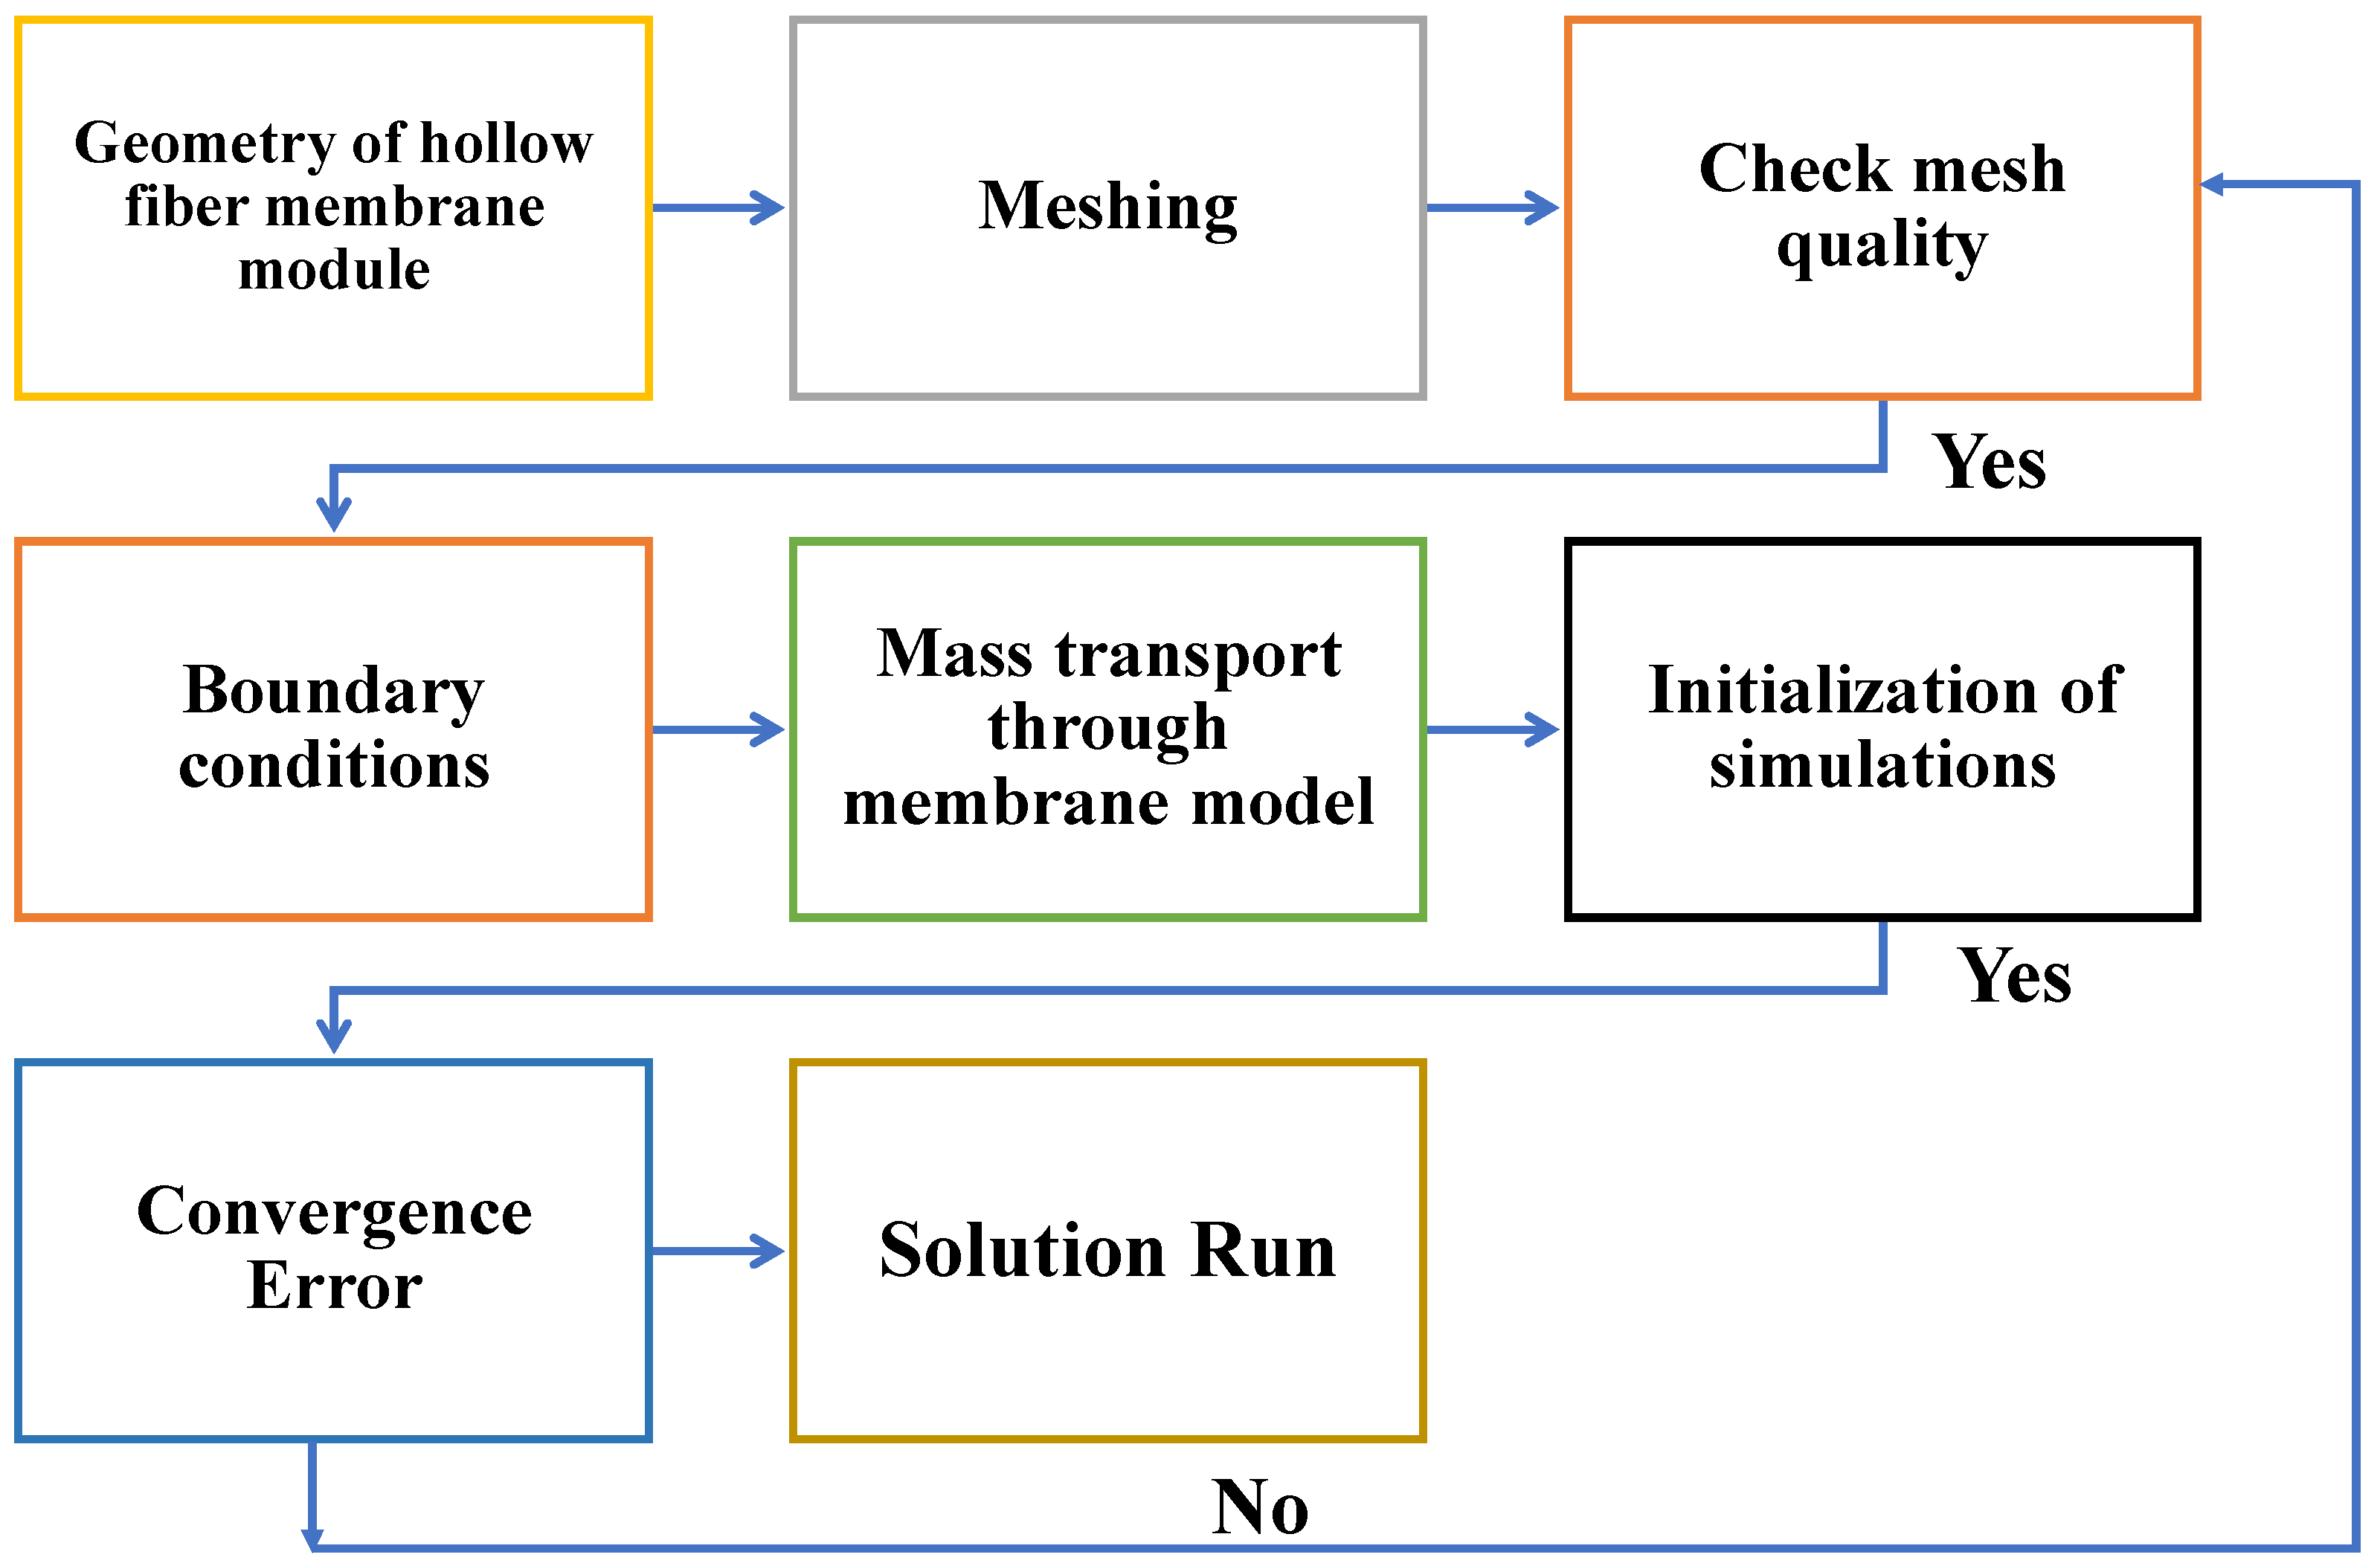
2.3. Flowchart of Post-Processing Scheme
2.4. Geometry
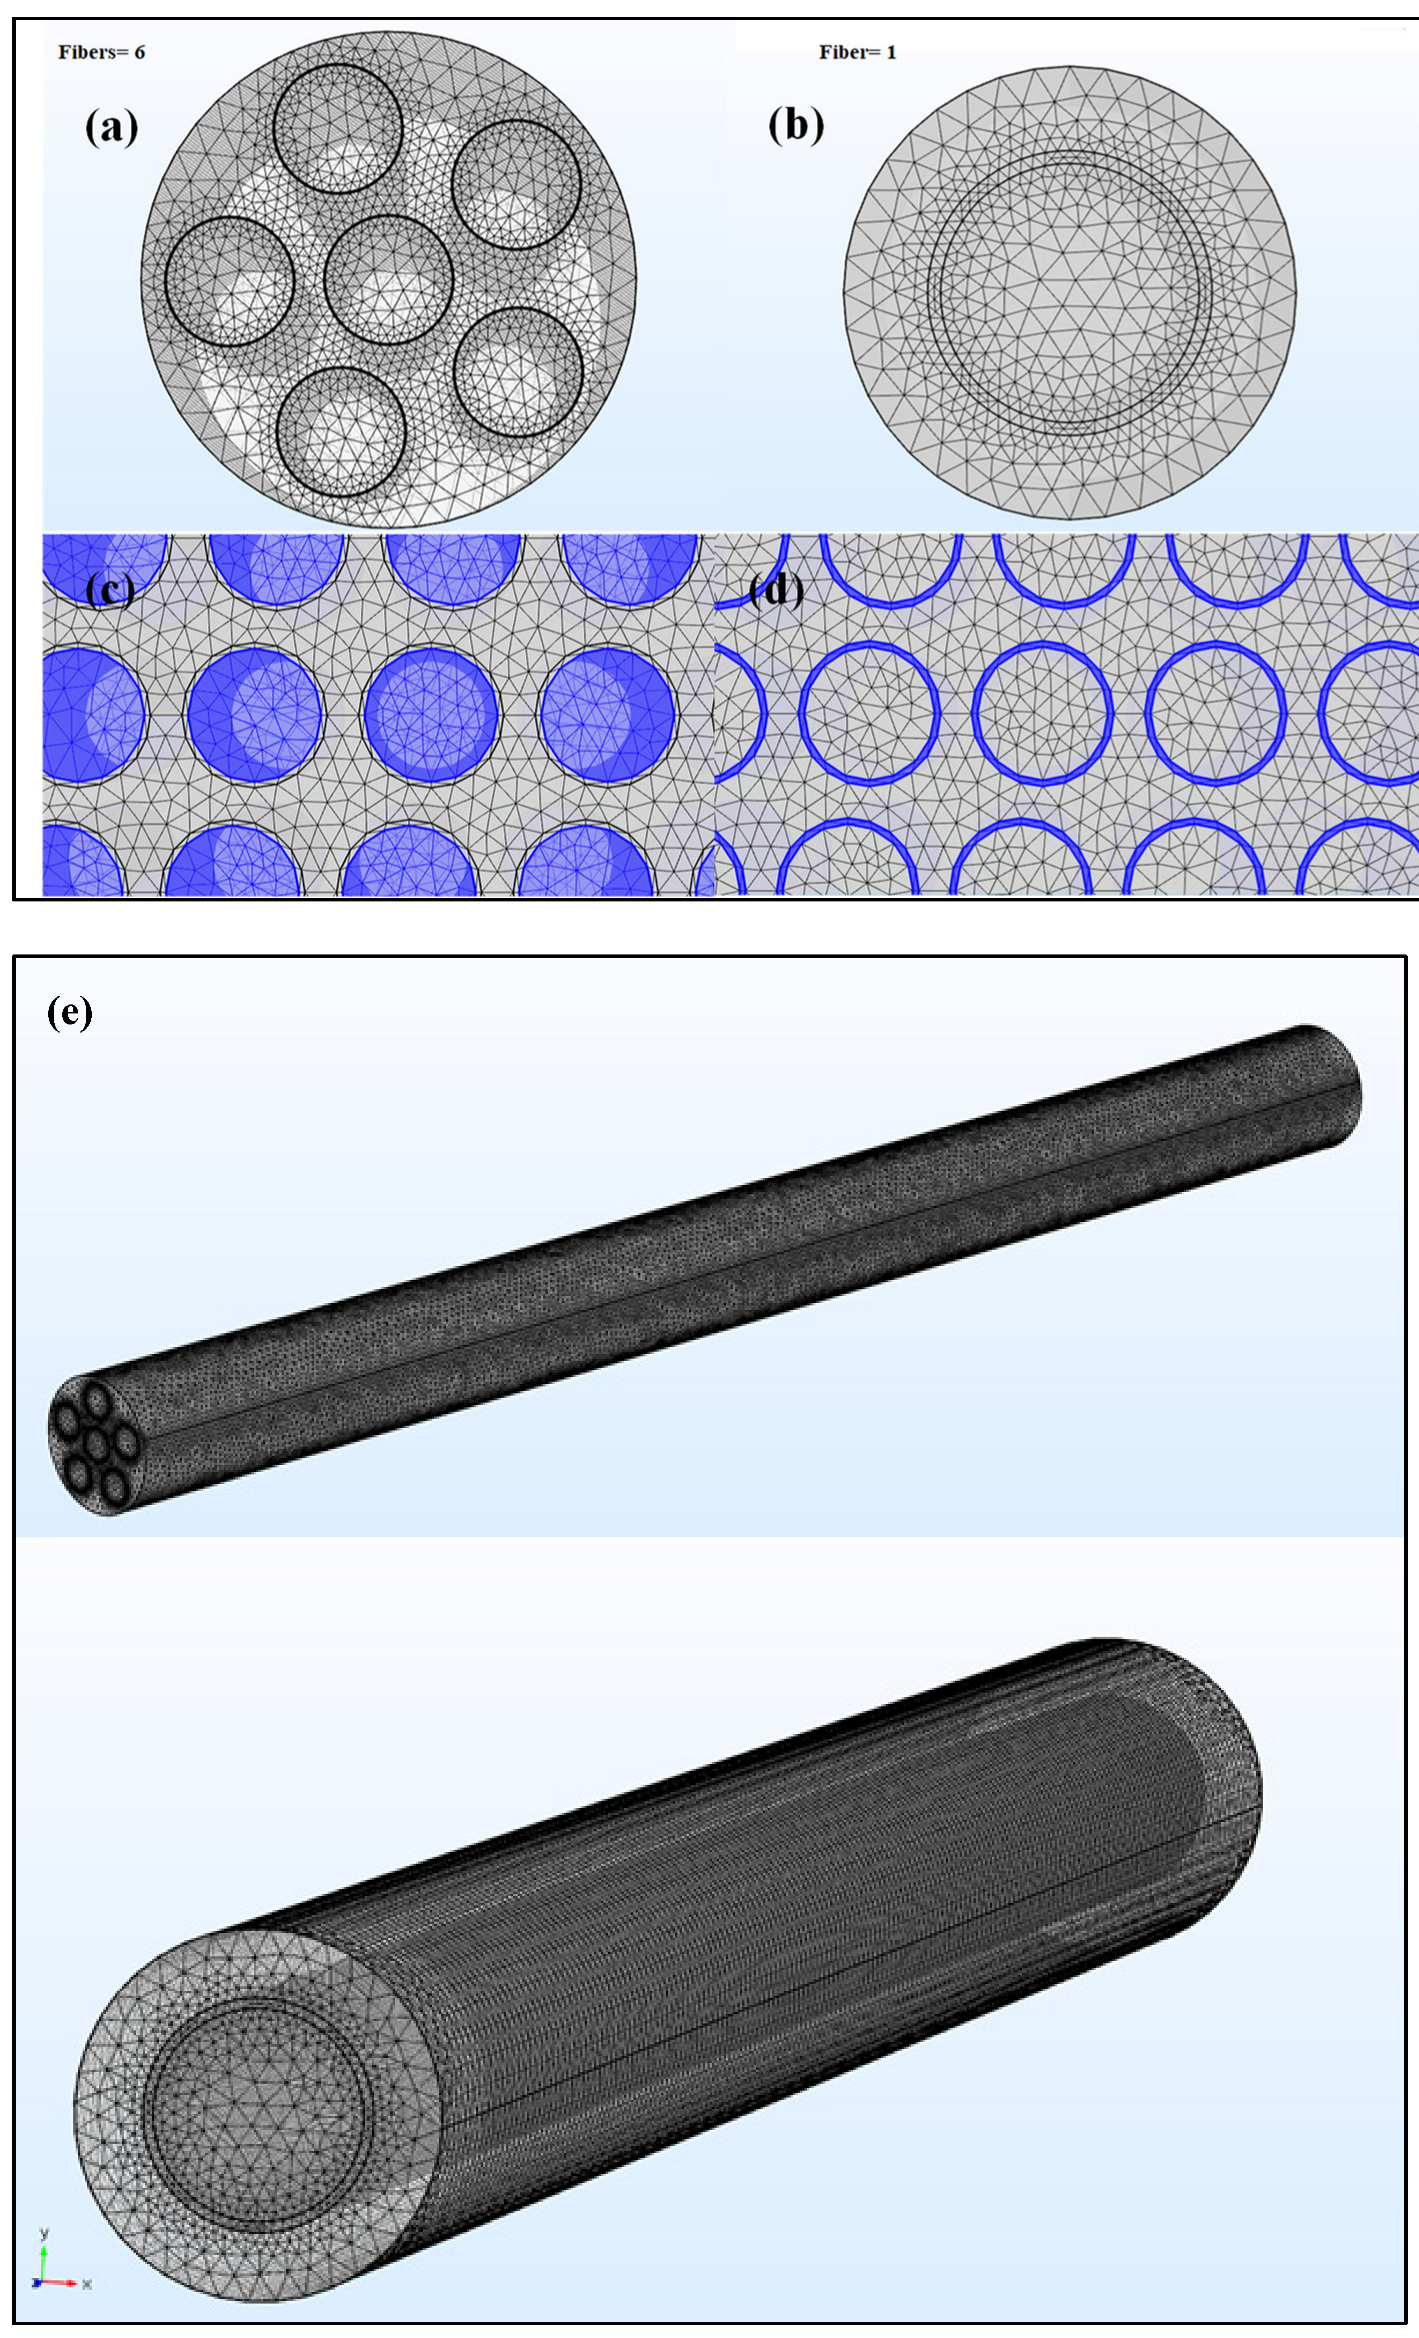
2.5. Meshing
3. Results
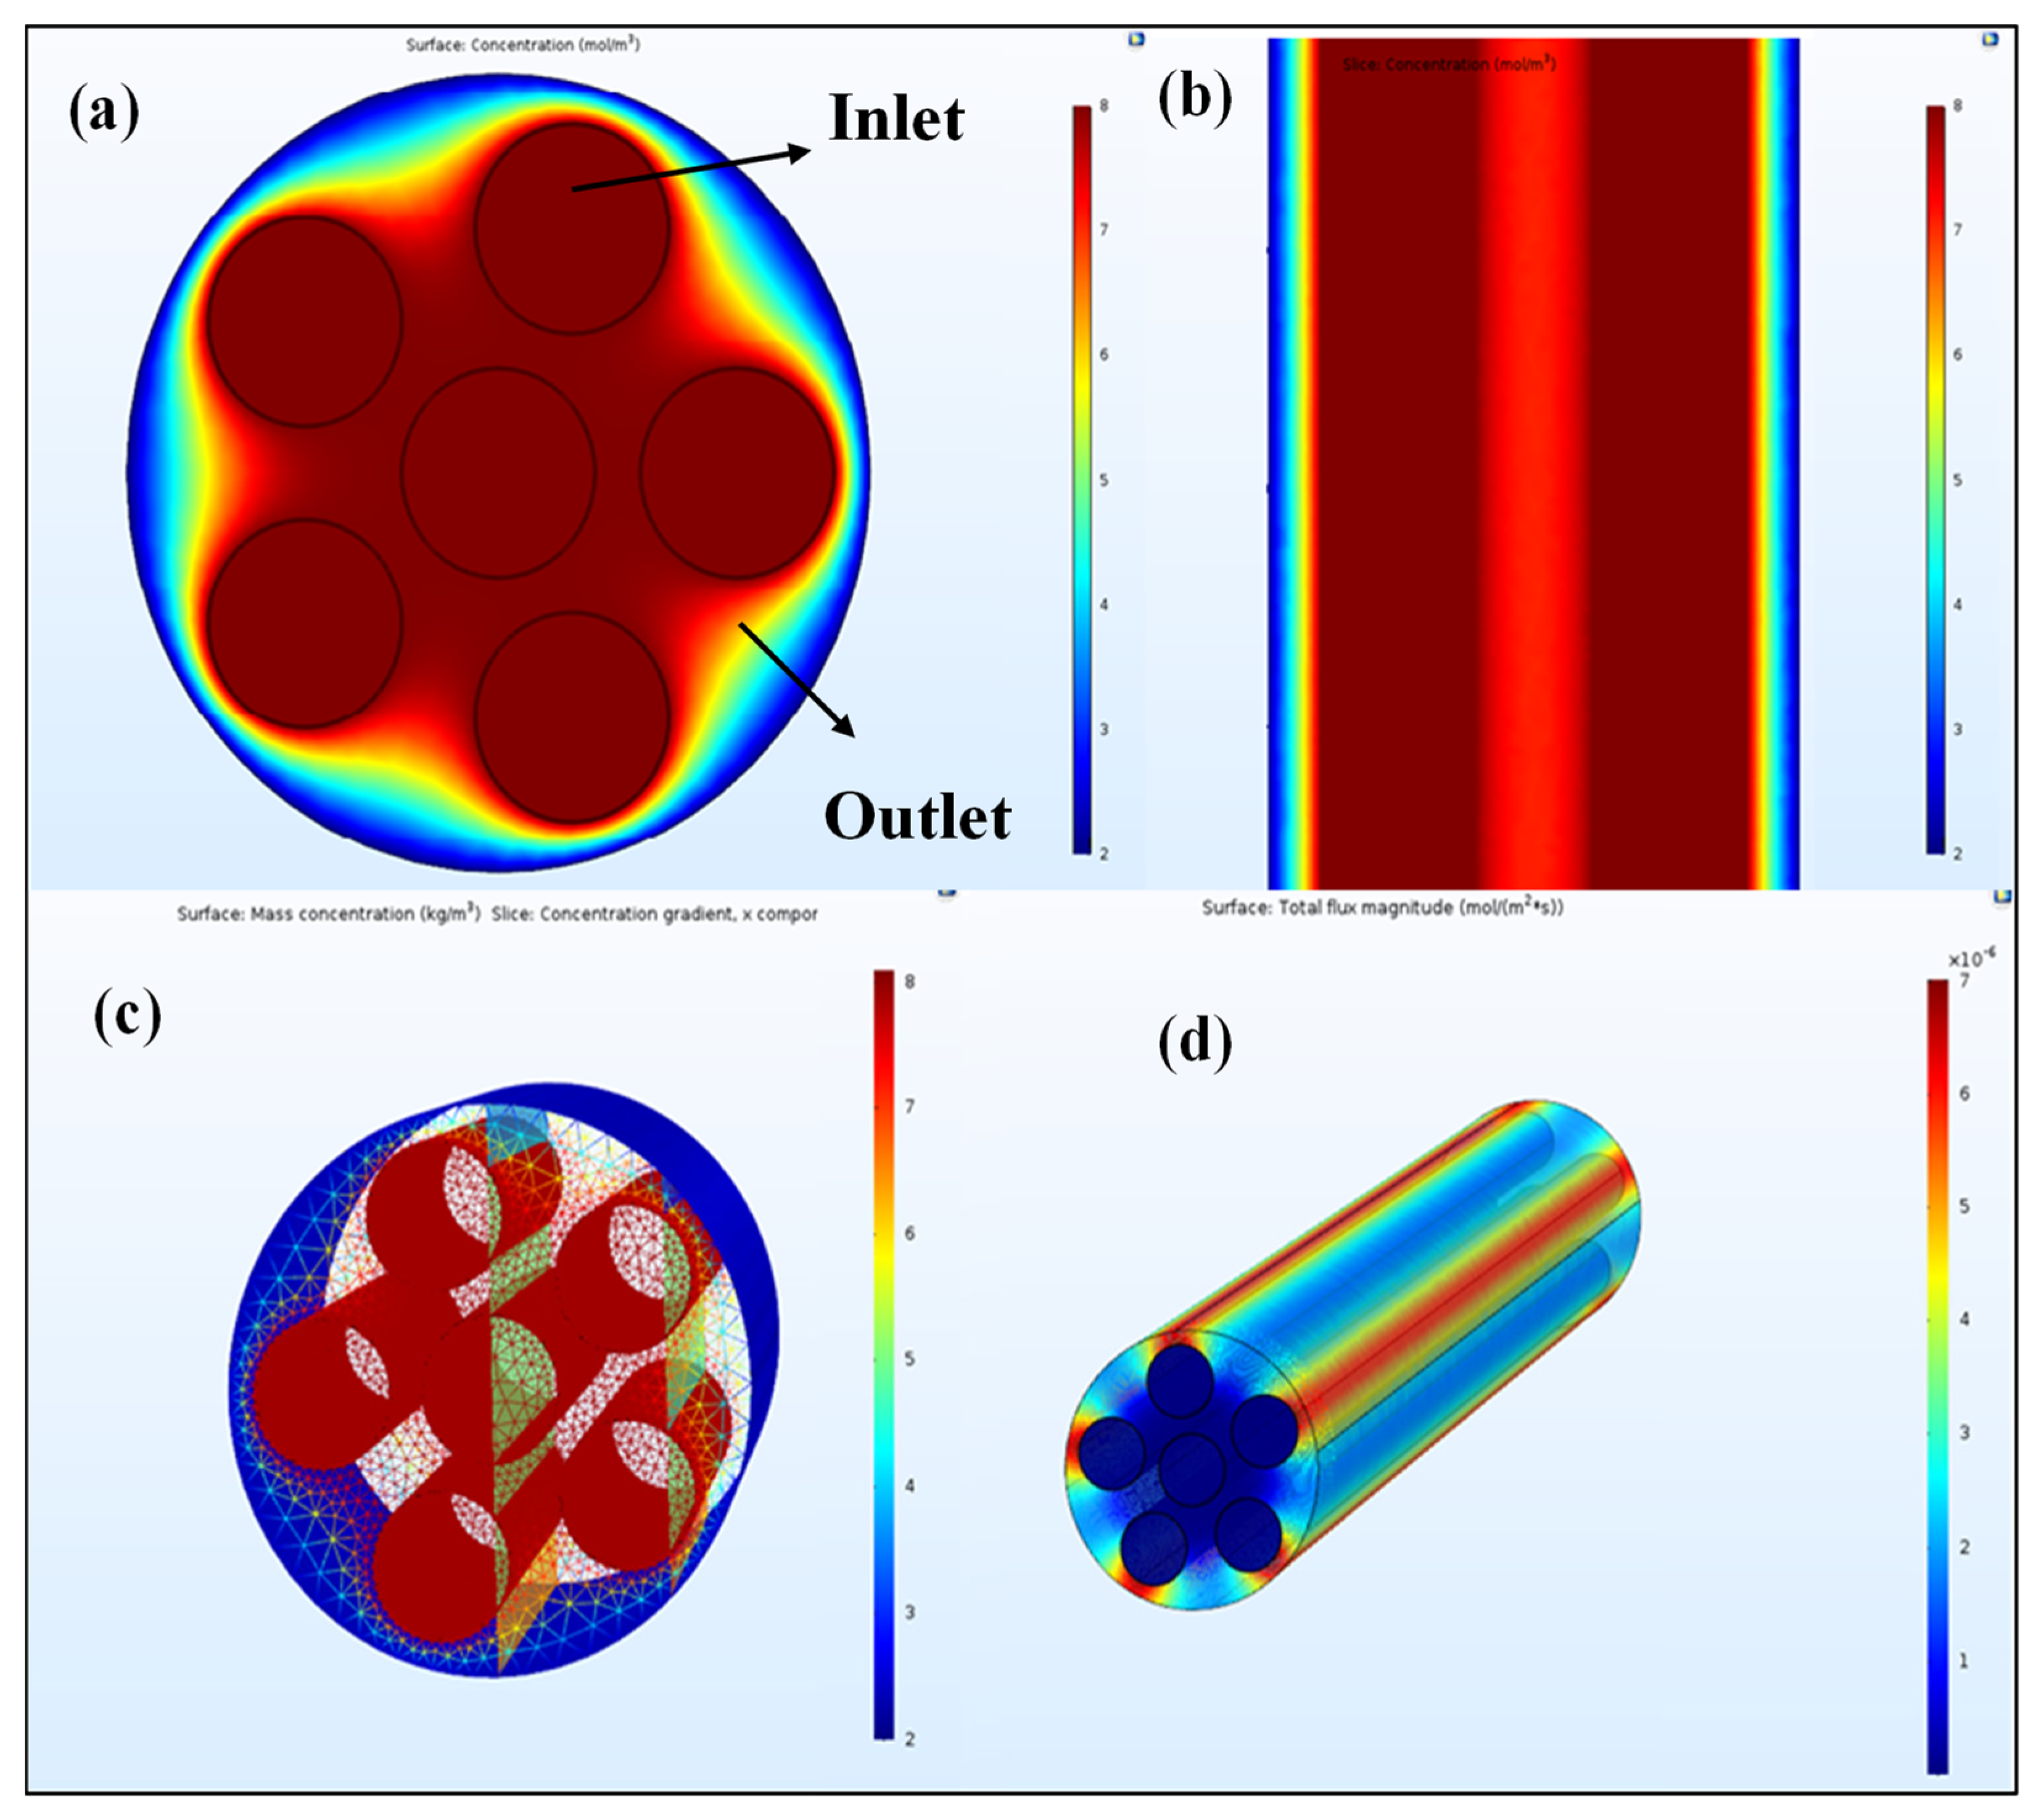
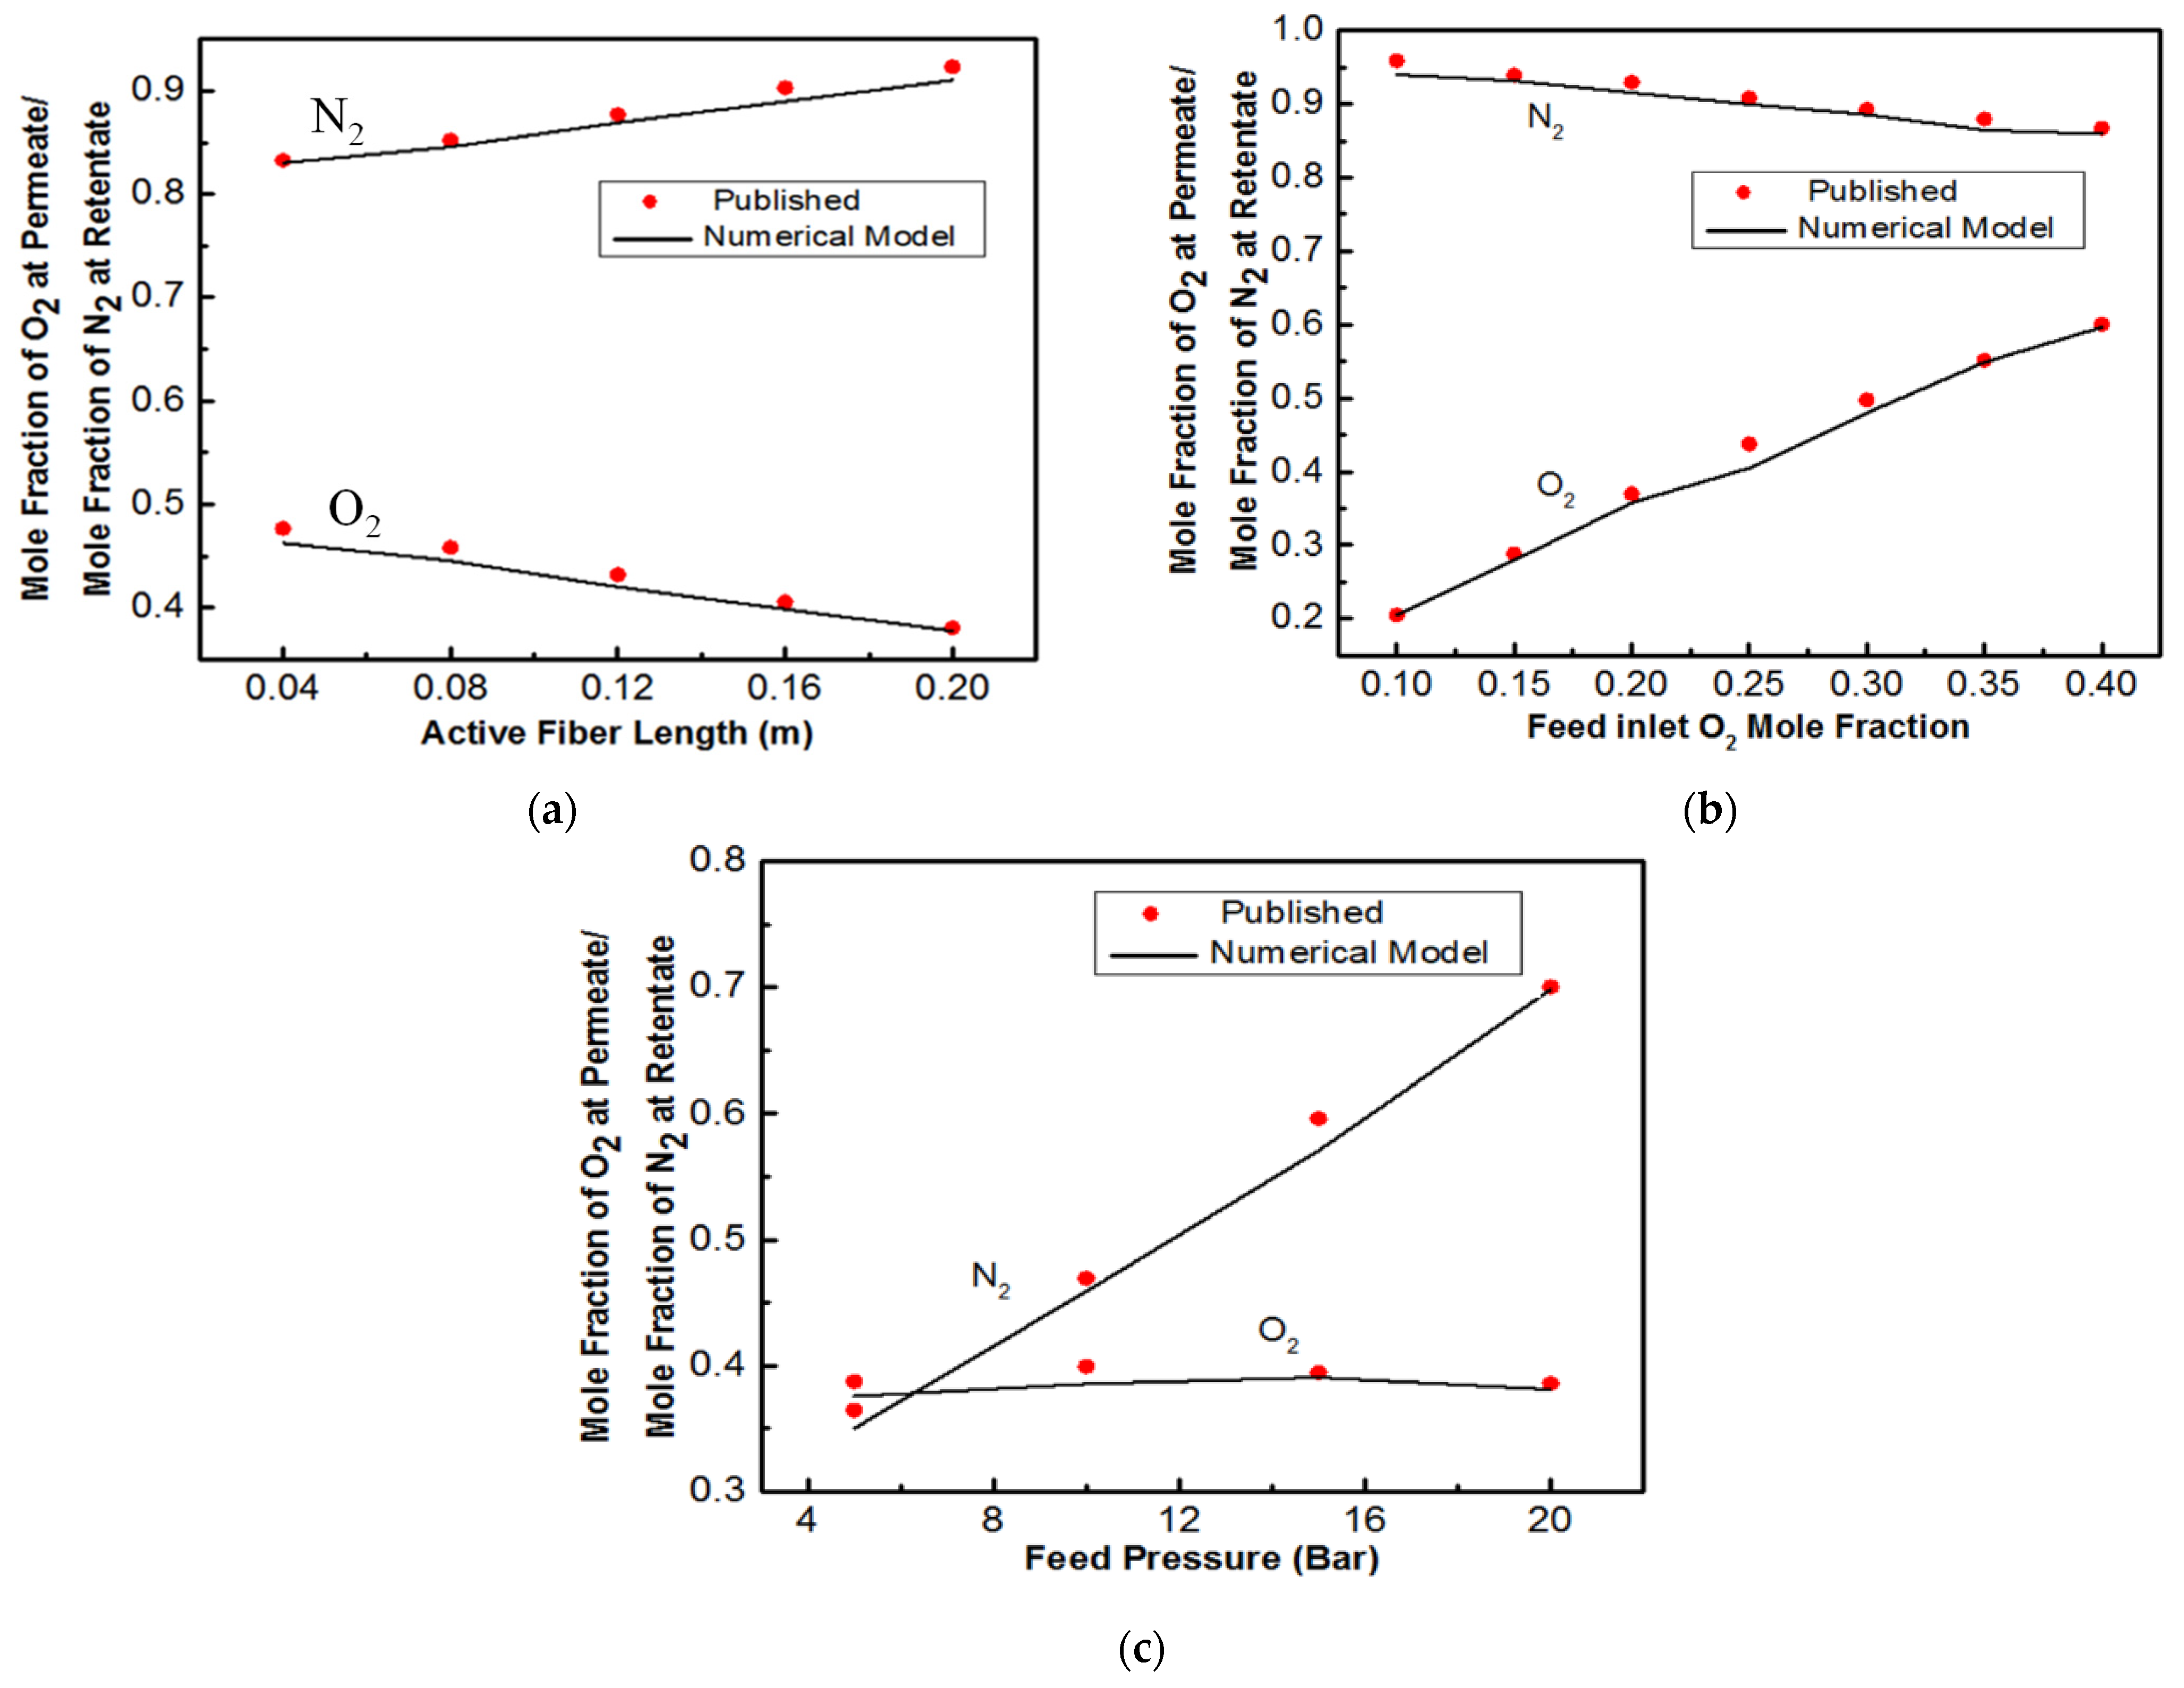
3.1. Air Separation
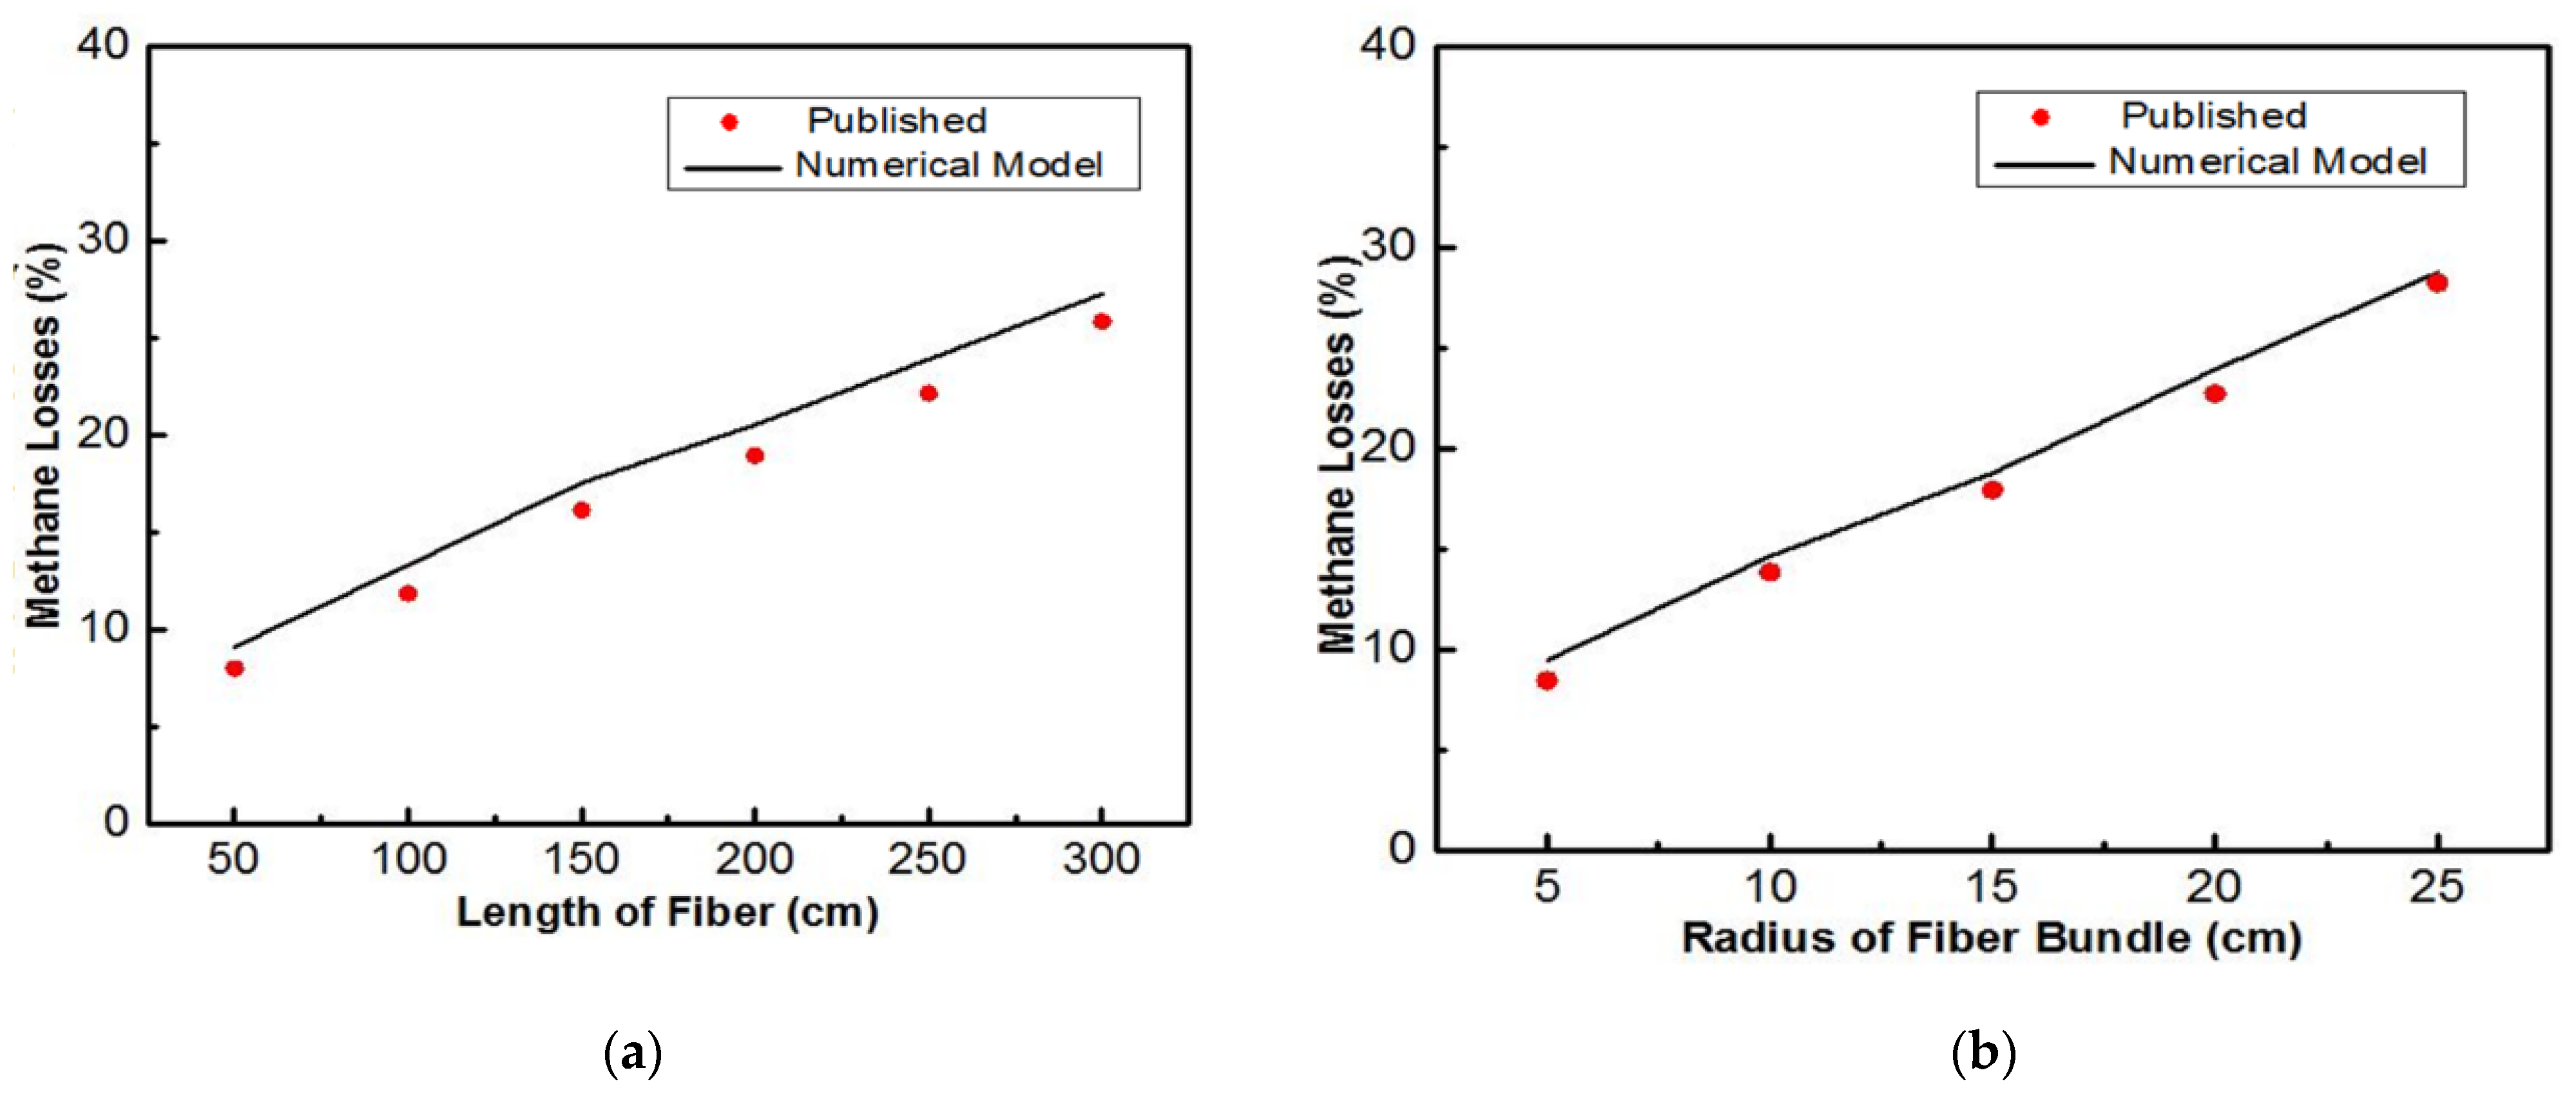
3.2. Carbon Dioxide Separation
4. Discussion
5. Conclusions
Author Contributions
Funding
Data Availability Statement
Conflicts of Interest
Appendix A
| List of symbols | |
| Acronyms | |
| CFD | Computational fluid dynamics |
| HFM | Hollow fiber membrane |
| N2 | Nitrogen |
| O2 | Oxygen |
| CO2 | Carbon dioxide |
| CH4 | Methane |
| Greek Symbols | |
| x x | Co-ordinate |
| y y | Co-ordinate |
| z z | Co-ordinate |
| Vx | Velocity in x-direction |
| Vy | Velocity in y-direction |
| Vz | Velocity in z-direction |
| “∇” | Nabla operator |
| Latin symbols t time (s) | |
| Ra. | Rate of reaction (mol/m3.s) |
| N | Molar flux (mol/.m2. s) |
| D | Diffusion coefficient (m2/s) |
| S | Solubility (mol/m3.pa) |
| P | Permeance (mol/m2.s.pa) |
| C | Concentration of component (mol/m3) |
| P | Partial pressure |
| L | Module length (m) |
| Do | Module diameter (m) |
| Ro | Fiber bundle radius (m) |
| δ | Membrane thickness (m) |
| C | Gas species concentration (mol/m3) |
| D_AB | Diffusivity coefficient (m2/s) |
| C_0 | Concentration of inlet (mol/m3) |
| C_0,1 | Concentration of outlet (mol/m3) |
| P | Permeability of the gas (mol/m2.s.pa) |
| S | Membrane solubility (mol/m3.pa) |
| pf | Pressure of the inlet side (Pa) |
| ph | Pressure of the permeate side (Pa) |
| δ | Membrane thickness (m) |
| ∆C | Concentration gradient (mol/m3) |
| ∆p | Gradient of the partial pressure of gases (Pa/m) |
References
- Bernardo, P.; Drioli, E.; Golemme, G. Membrane Gas Separation: A Review/State of the Art. Ind. Eng. Chem. Res. 2009, 48, 4638–4663. [Google Scholar] [CrossRef]
- Sanaeepur, H.; Amooghin, A.E.; Moghadassi, A. Modeling and Simulation for Membrane Gas Separation Processes. In Modeling in Membranes and Membrane-Based Processes; Scrivener Publishing LLC: Arak, Iran, 2020; pp. 201–235. [Google Scholar] [CrossRef]
- Ardaneh, M.; Abolhasani, M.; Esmaeili, M. CFD modeling of two-stage H2 recovery process from ammonia purge stream by industrial hollow fiber membrane modules. Int. J. Hydrogen Energy 2019, 44, 4851–4867. [Google Scholar] [CrossRef]
- Mousavian, S.; Faravar, P.; Zarei, Z.; Azimikia, R.; Monjezi, M.G.; Kianfar, E. Modeling and simulation absorption of CO2 using hollow fiber membranes (HFM) with mono-ethanol amine with computational fluid dynamics. J. Environ. Chem. Eng. 2020, 8, 103946. [Google Scholar] [CrossRef]
- Ghobadi, J.; Ramirez, D.; Khoramfar, S.; Kabir, M.; Jerman, R.; Saeed, M. Mathematical modeling of CO2 separation using different diameter hollow fiber membranes. Int. J. Greenh. Gas Control. 2020, 104, 103204. [Google Scholar] [CrossRef]
- Kundu, P.K.; Chakma, A.; Feng, X. Modelling of multicomponent gas separation with asymmetric hollow fibre membranes-methane enrichment from biogas. Can. J. Chem. Eng. 2012, 91, 1092–1102. [Google Scholar] [CrossRef]
- Khanafer, K.; Assad, M.E.H. Mathematical Modeling of Fluid Flow Through a Hollow Fiber Water System Using Porous Medium Model. Arab. J. Sci. Eng. 2021, 47, 6049–6057. [Google Scholar] [CrossRef]
- Chen, W.-H.; Lin, C.-H.; Lin, Y.-L. Flow-field design for improving hydrogen recovery in a palladium membrane tube. J. Membr. Sci. 2014, 472, 45–54. [Google Scholar] [CrossRef]
- Jafari, M.; Rahimpour, E.; Rahimpour, M.R. Application of computational fluid dynamics technique in processes of gas membrane separation. In Current Trends and Future Developments on (Bio-) Membranes; Elsevier: Amsterdam, The Netherlands, 2021; pp. 269–288. [Google Scholar] [CrossRef]
- Markova, S.Y.; Dukhov, A.V.; Pelzer, M.; Shalygin, M.G.; Vad, T.; Gries, T.; Teplyakov, V.V. Designing 3D Membrane Modules for Gas Separation Based on Hollow Fibers from Poly(4-methyl-1-pentene). Membranes 2021, 12, 36. [Google Scholar] [CrossRef]
- Bernardo, P.; Clarizia, G. 30 years of membrane technology for gas separation. Chem. Eng. 2013, 32, 1999–2004. [Google Scholar]
- Liu, Y.; Cui, X.; Yan, W.; Su, J.; Duan, F.; Jin, L. Analysis of pressure-driven water vapor separation in hollow fiber composite membrane for air dehumidification. Sep. Purif. Technol. 2020, 251, 117334. [Google Scholar] [CrossRef]
- Hashim, S.; Mohamed, A.R.; Bhatia, S. Oxygen separation from air using ceramic-based membrane technology for sustainable fuel production and power generation. Renew. Sustain. Energy Rev. 2011, 15, 1284–1293. [Google Scholar] [CrossRef]
- Shamsabadi, A.A.; Kargari, A.; Farshadpour, F.; Laki, S. Mathematical modeling of CO2/CH4 separation by hollow fiber membrane module using finite difference method. J. Membr. Sep. Technol. 2012, 1, 19–29. [Google Scholar]
- Li, X.; Younas, M.; Rezakazemi, M.; Ly, Q.V.; Li, J. A review on hollow fiber membrane module towards high separation efficiency: Process modeling in fouling perspective. Chin. Chem. Lett. 2021, 33, 3594–3602. [Google Scholar] [CrossRef]
- Cancilla, N.; Gurreri, L.; Marotta, G.; Ciofalo, M.; Cipollina, A.; Tamburini, A.; Micale, G. Performance Comparison of Alternative Hollow-Fiber Modules for Hemodialysis by Means of a CFD-Based Model. Membranes 2022, 12, 118. [Google Scholar] [CrossRef]
- Feng, B.; Song, J.; Wang, Z.; Dewangan, N.; Kawi, S.; Tan, X. CFD modeling of the perovskite hollow fiber membrane modules for oxygen separation. Chem. Eng. Sci. 2020, 230, 116214. [Google Scholar] [CrossRef]
- Lock, S.; Lau, K.; Ahmad, F.; Shariff, A. Modeling, simulation and economic analysis of CO2 capture from natural gas using cocurrent, countercurrent and radial crossflow hollow fiber membrane. Int. J. Greenh. Gas Control. 2015, 36, 114–134. [Google Scholar] [CrossRef]
- Cancilla, N.; Gurreri, L.; Marotta, G.; Ciofalo, M.; Cipollina, A.; Tamburini, A.; Micale, G. A porous media CFD model for the simulation of hemodialysis in hollow fiber membrane modules. J. Membr. Sci. 2022, 646, 120219. [Google Scholar] [CrossRef]
- Ahsan, M.; Hussain, A. Computational fluid dynamics (CFD) modeling of heat transfer in a polymeric membrane using finite volume method. J. Therm. Sci. 2016, 25, 564–570. [Google Scholar] [CrossRef]
- Ahsan, M.; Hussain, A. A computational fluid dynamics (CFD) approach for the modeling of flux in a polymeric membrane using finite volume method. Mech. Ind. 2017, 18, 406. [Google Scholar] [CrossRef]
- Ghidossi, R.; Veyret, D.; Moulin, P. Computational fluid dynamics applied to membranes: State of the art and opportunities. Chem. Eng. Process.—Process. Intensif. 2006, 45, 437–454. [Google Scholar] [CrossRef]
- Foo, K.; Liang, Y.; Goh, P.; Ahmad, A.; Wang, D.; Fletcher, D. Comparison of analytical film theory and a numerical model for predicting concentration polarisation in membrane gas separation. Chem. Eng. Res. Des. 2022, 185, 281–290. [Google Scholar] [CrossRef]
- Dash, S.; Mohanty, S. Separation of lanthanum and neodymium in a hollow fiber supported liquid membrane: CFD modelling and experimental validation. Miner. Eng. 2022, 180, 107472. [Google Scholar] [CrossRef]
- Marcos, B.; Moresoli, C.; Skorepova, J.; Vaughan, B. CFD modeling of a transient hollow fiber ultrafiltration system for protein concentration. J. Membr. Sci. 2009, 337, 136–144. [Google Scholar] [CrossRef]
- Ranade, V.V.; Kumar, A. Fluid dynamics of spacer filled rectangular and curvilinear channels. J. Membr. Sci. 2006, 271, 1–15. [Google Scholar] [CrossRef]
- Lukitsch, B.; Ecker, P.; Elenkov, M.; Janeczek, C.; Haddadi, B.; Jordan, C.; Krenn, C.; Ullrich, R.; Gfoehler, M.; Harasek, M. Computation of Global and Local Mass Transfer in Hollow Fiber Membrane Modules. Sustainability 2020, 12, 2207. [Google Scholar] [CrossRef]
- Haghshenasfard, M.; Moheb, A.; Ansaripour, M. Application of computational fluid dynamics technique in membrane contactor systems. In Current Trends and Future Developments on (Bio-) Membranes; Elsevier: Amsterdam, The Netherlands, 2021; pp. 289–310. [Google Scholar] [CrossRef]
- Ng, E.; Lau, K.; Lau, W.; Ahmad, F. Holistic review on the recent development in mathematical modelling and process simulation of hollow fiber membrane contactor for gas separation process. J. Ind. Eng. Chem. 2021, 104, 231–257. [Google Scholar] [CrossRef]
- Tahmasbi, D.; Hossainpour, S.; Babaluo, A.A.; Rezakazemi, M.; Souq, S.S.M.N.; Younas, M. Hydrogen separation from synthesis gas using silica membrane: CFD simulation. Int. J. Hydrogen Energy 2020, 45, 19381–19390. [Google Scholar] [CrossRef]
- Coroneo, M.; Montante, G.; Baschetti, M.G.; Paglianti, A. CFD modelling of inorganic membrane modules for gas mixture separation. Chem. Eng. Sci. 2009, 64, 1085–1094. [Google Scholar] [CrossRef]
- Chen, W.-H.; Syu, W.-Z.; Hung, C.-I.; Lin, Y.-L.; Yang, C.-C. A numerical approach of conjugate hydrogen permeation and polarization in a Pd membrane tube. Int. J. Hydrogen Energy 2012, 37, 12666–12679. [Google Scholar] [CrossRef]
- Qi, R.; Henson, M. Optimization-based design of spiral-wound membrane systems for CO2/CH4 separations. Sep. Purif. Technol. 1998, 13, 209–225. [Google Scholar] [CrossRef]
- Gholami, G.; Soleimani, M.; Ravanchi, M.T. Mathematical Modeling of Gas Separation Process with Flat Carbon Membrane. J. Membr. Sci. Res. 2015, 1, 90–95. [Google Scholar] [CrossRef]
- Kundu, P.K.; Chakma, A.; Feng, X. Simulation of binary gas separation with asymmetric hollow fibre membranes and case studies of air separation. Can. J. Chem. Eng. 2011, 90, 1253–1268. [Google Scholar] [CrossRef]
- Hosseini, S.S.; Dehkordi, J.A.; Kundu, P.K. Gas permeation and separation in asymmetric hollow fiber membrane permeators: Mathematical modeling, sensitivity analysis and optimization. Korean J. Chem. Eng. 2016, 33, 3085–3101. [Google Scholar] [CrossRef]
- Ahmad, F.; Lau, K.; Lock, S.; Rafiq, S.; Khan, A.U.; Lee, M. Hollow fiber membrane model for gas separation: Process simulation, experimental validation and module characteristics study. J. Ind. Eng. Chem. 2015, 21, 1246–1257. [Google Scholar] [CrossRef]
- Katoh, T.; Tokumura, M.; Yoshikawa, H.; Kawase, Y. Dynamic simulation of multicomponent gas separation by hollow-fiber membrane module: Nonideal mixing flows in permeate and residue sides using the tanks-in-series model. Sep. Purif. Technol. 2011, 76, 362–372. [Google Scholar] [CrossRef]
- Foo, K.; Liang, Y.; Goh, P.; Fletcher, D. Computational fluid dynamics simulations of membrane gas separation: Overview, challenges and future perspectives. Chem. Eng. Res. Des. 2023, 191, 127–140. [Google Scholar] [CrossRef]
- McKeen, L.W. Markets and Applications for Films, Containers, and Membranes. Permeabil. Prop. Plast. Elastomers 2012, 4, 59–75. [Google Scholar] [CrossRef]


| Parameters | Symbols | Hollow Fiber Membrane Module [33,34,35,36,37] | Units | |
|---|---|---|---|---|
| Inlet pressure | 790.8 | 6895 | Pa | |
| Permeate pressure | 101.3 | 138 | Pa | |
| Inlet gas | 0.205 O2 | 0.5 CO2 | Mole fraction | |
| Permeance | 30.78 × 10⁻¹⁰ | 33 × 10−10 | mol/m2. s.pa | |
| Module diameter | Do | 9.5 × 10⁻³ | 20 × 10−3 | m |
| Module length | 0.25 | 0.1 | m | |
| Membrane thickness | 0.08 | 0.0004 | mm | |
| Parameters | Total Elements |
|---|---|
| Solution time (Study 1) | 625 s |
| Number of edge elements | 33,311 |
| Number of boundary elements | 779,926 |
| Number of elements | 6,376,565 |
| Minimum element quality | 7.11 × 10⁻⁵ |
Disclaimer/Publisher’s Note: The statements, opinions and data contained in all publications are solely those of the individual author(s) and contributor(s) and not of MDPI and/or the editor(s). MDPI and/or the editor(s) disclaim responsibility for any injury to people or property resulting from any ideas, methods, instructions or products referred to in the content. |
© 2023 by the authors. Licensee MDPI, Basel, Switzerland. This article is an open access article distributed under the terms and conditions of the Creative Commons Attribution (CC BY) license (https://creativecommons.org/licenses/by/4.0/).
Share and Cite
Qadir, S.; Ahsan, M.; Hussain, A. Computational Fluid Dynamics Analysis of a Hollow Fiber Membrane Module for Binary Gas Mixture. Gases 2023, 3, 77-91. https://doi.org/10.3390/gases3020005
Qadir S, Ahsan M, Hussain A. Computational Fluid Dynamics Analysis of a Hollow Fiber Membrane Module for Binary Gas Mixture. Gases. 2023; 3(2):77-91. https://doi.org/10.3390/gases3020005
Chicago/Turabian StyleQadir, Salman, Muhammad Ahsan, and Arshad Hussain. 2023. "Computational Fluid Dynamics Analysis of a Hollow Fiber Membrane Module for Binary Gas Mixture" Gases 3, no. 2: 77-91. https://doi.org/10.3390/gases3020005