Article

Markers for Immunological Resilience: Effects of Moderate- and High-Intensity Endurance Exercise on the Kinetic Response of Leukocyte Subsets

1
Research Group Innovative Testing in Life Sciences and Chemistry, University of Applied Sciences Utrecht, 3584 CS Utrecht, The Netherlands
2
Nutritional Biology, Division of Human Nutrition and Health, Wageningen University & Research, 6708 PB Wageningen, The Netherlands
3
Research Group Analysis Techniques in the Life Sciences, Avans University of Applied Sciences, 4818 AJ Breda, The Netherlands
4
Star-shl, 4872 LA Etten-Leur, The Netherlands
5
Department of Pharmaceutical Sciences, Utrecht University, 3584 CG Utrecht, The Netherlands
6
Nutricia Research, 3584 CT Utrecht, The Netherlands
7
Immunotoxicology, Institute for Risk Assessment Sciences, Utrecht University, 3584 CS Utrecht, The Netherlands
*
Author to whom correspondence should be addressed.
Immuno 2024, 4(1), 43-56; https://doi.org/10.3390/immuno4010003
Submission received: 2 December 2023 / Revised: 17 January 2024 / Accepted: 24 January 2024 / Published: 30 January 2024
(This article belongs to the Section Clinical/translational Immunology)

Abstract

:
The kinetic responses of leukocyte subsets to exercise and their recovery may serve as indicators of immunological resilience. These time-dependent responses were investigated in healthy young men using a bicycle ergometer test. Fifteen recreationally active male cyclists (20–35 years, VO2max 56.9 ± 3.9 mL kg−1 min−1) performed four exercise protocols with a 1 h duration in a cross-over design: at 70% of the maximal workload (Wmax) in a hydrated and a mildly dehydrated state, at 50% of the Wmax, and intermittently at 85/55% of the Wmax in blocks of 2 min. The numbers of lymphocytes, monocytes, neutrophils, eosinophils, basophils, thrombocytes, and NK cells (CD16 and CD56) were measured at different time points up to 24 h post-exercise. The total leukocyte counts and those of most subsets increased from the start of the exercise, peaking after 30–60 min of exercising. The neutrophil numbers, however, peaked 3 h post-exercise. The CD16brightCD56dim NK cells showed a 1.5-fold increase compared to the CD16brightCD56bright NK cells. Other than for MCP-1, no significant differences were found in the serum cytokine levels. Our results show that exercise intensity is reflected in different time-dependent changes in leukocyte subsets, which supports the concept that the exchange of immune cells between peripheral blood and tissues contributes to enhanced immune surveillance during strenuous exercise.

1. Introduction

Physical and psychological stresses induce a plethora of coordinated and dynamic processes aimed at protection, the maintenance of homeostasis, adaptation, and restoration. The eventual course and outcome of these processes are, depending on various factors, related to the individual as well as to the degree and duration of the stressor(s). This also applies to the effects of exercise stress on the immune system. For instance, it has been shown that exercise training can improve immune function in favor of exercise performance and post-exercise recovery [1]. Similarly, exercise training has shown to be of value to improving immune fitness in the elderly [2] and in less fit or diseased individuals [3]. These findings are also in line with the observation that regular moderate exercise is effective in preventing and managing disease [4]. On the other hand, immune functions can be attenuated following acute or chronic excessive exertion [5], which is, for example, seen in situations of exhaustion or overtraining [6].
More insight into the kinetics of innate and adaptive immune responses to stressors will not only contribute to understanding these phenomena, but also to better predicting the health outcomes of stressors in specific situations such as COVID-19 [7]. Furthermore, this also applies to aging, which is associated with an altered immune function, known as immunosenescence, contributing to an increased susceptibility to more inflammation, tissue damage, and the loss of control of persistent infections [8]. Over the past decades, physical exercise has been frequently used to examine how humans respond to a given stressor [9,10,11]. The effects on the immune system range from changes in the composition of cell populations to the release of cytokines and chemokines and the activation of the neuroendocrine system [12,13,14]. Immediate leukocytosis during brief exercise has been described as a result of increased catecholamine levels, whereas delayed-onset neutrophilia is due to increased cortisol levels [15]. A common finding across many studies is that the number of neutrophils and the proportion of lymphocyte subsets change acutely during moderate- or high-intensity exercise [16,17]. Physical activity supports a healthy immune system, and recent studies suggest its potential value for both prevention and treatment [18,19,20]. In addition, exercise has been shown to mitigate immunosenescence and age-related morbidity, suggesting that immunological adaptations to exercise may also lessen the burden of disease and improve the health span [21,22]. However, there is considerable heterogeneity in the populations studied and in the type, duration, intensity, and frequency of the exercise sessions that were carried out. Different protocols with different physiological and immunological responses hamper the comparison of the unambiguous statements of study outcomes. Therefore, exercise models need further standardization, including of the exercise intensity, the duration of exercise, and the number of time points sampled, to better understand the relevance of health biomarkers. Recently, we demonstrated that a standardized bout of moderate or strenuous exercise on a bicycle ergometer causes distinct responses in a range of intestinal and immunological biomarkers [23,24,25,26]. Depending on the workload and duration, different effects on the biomarkers for intestinal metabolic activity (detected as the amount of citrulline produced after providing a glutamine bolus) and intestinal barrier function (detected by the levels of iFABP and zonulin in the blood) were found. Furthermore, a mild dehydrated condition enhanced these responses. Interestingly, the exercise-induced increase in the total numbers of leukocytes showed a biphasic response [26].
While most studies thus far, including ours, have focused on biochemical and inflammatory markers in the blood, an analysis of the cellular responses to exercise can be used to broaden the perspective. To this end, in the present study, we delved deeper into the cellular responses and analyzed the effects of moderate- and high-intensity exercise on a broad time course of various leukocyte subsets and a wide range of cytokines. Here, we describe a detailed kinetic analysis of the lymphocytes, monocytes, neutrophils, eosinophils, basophils, and thrombocytes, as well as the determination of the expression of CD16 and CD56 on the cell surface of NK cells, in blood samples collected during a standardized exercise test described previously [25,26]. Our analysis shows that the time-dependent (kinetic) changes in leukocyte subsets, including their recovery to baseline, are clearly associated with the exercise intensity and the apparent stress. At both the individual and population levels, the relationships between the stressor and kinetic effects may be used to study immune resilience.

2. Materials and Methods
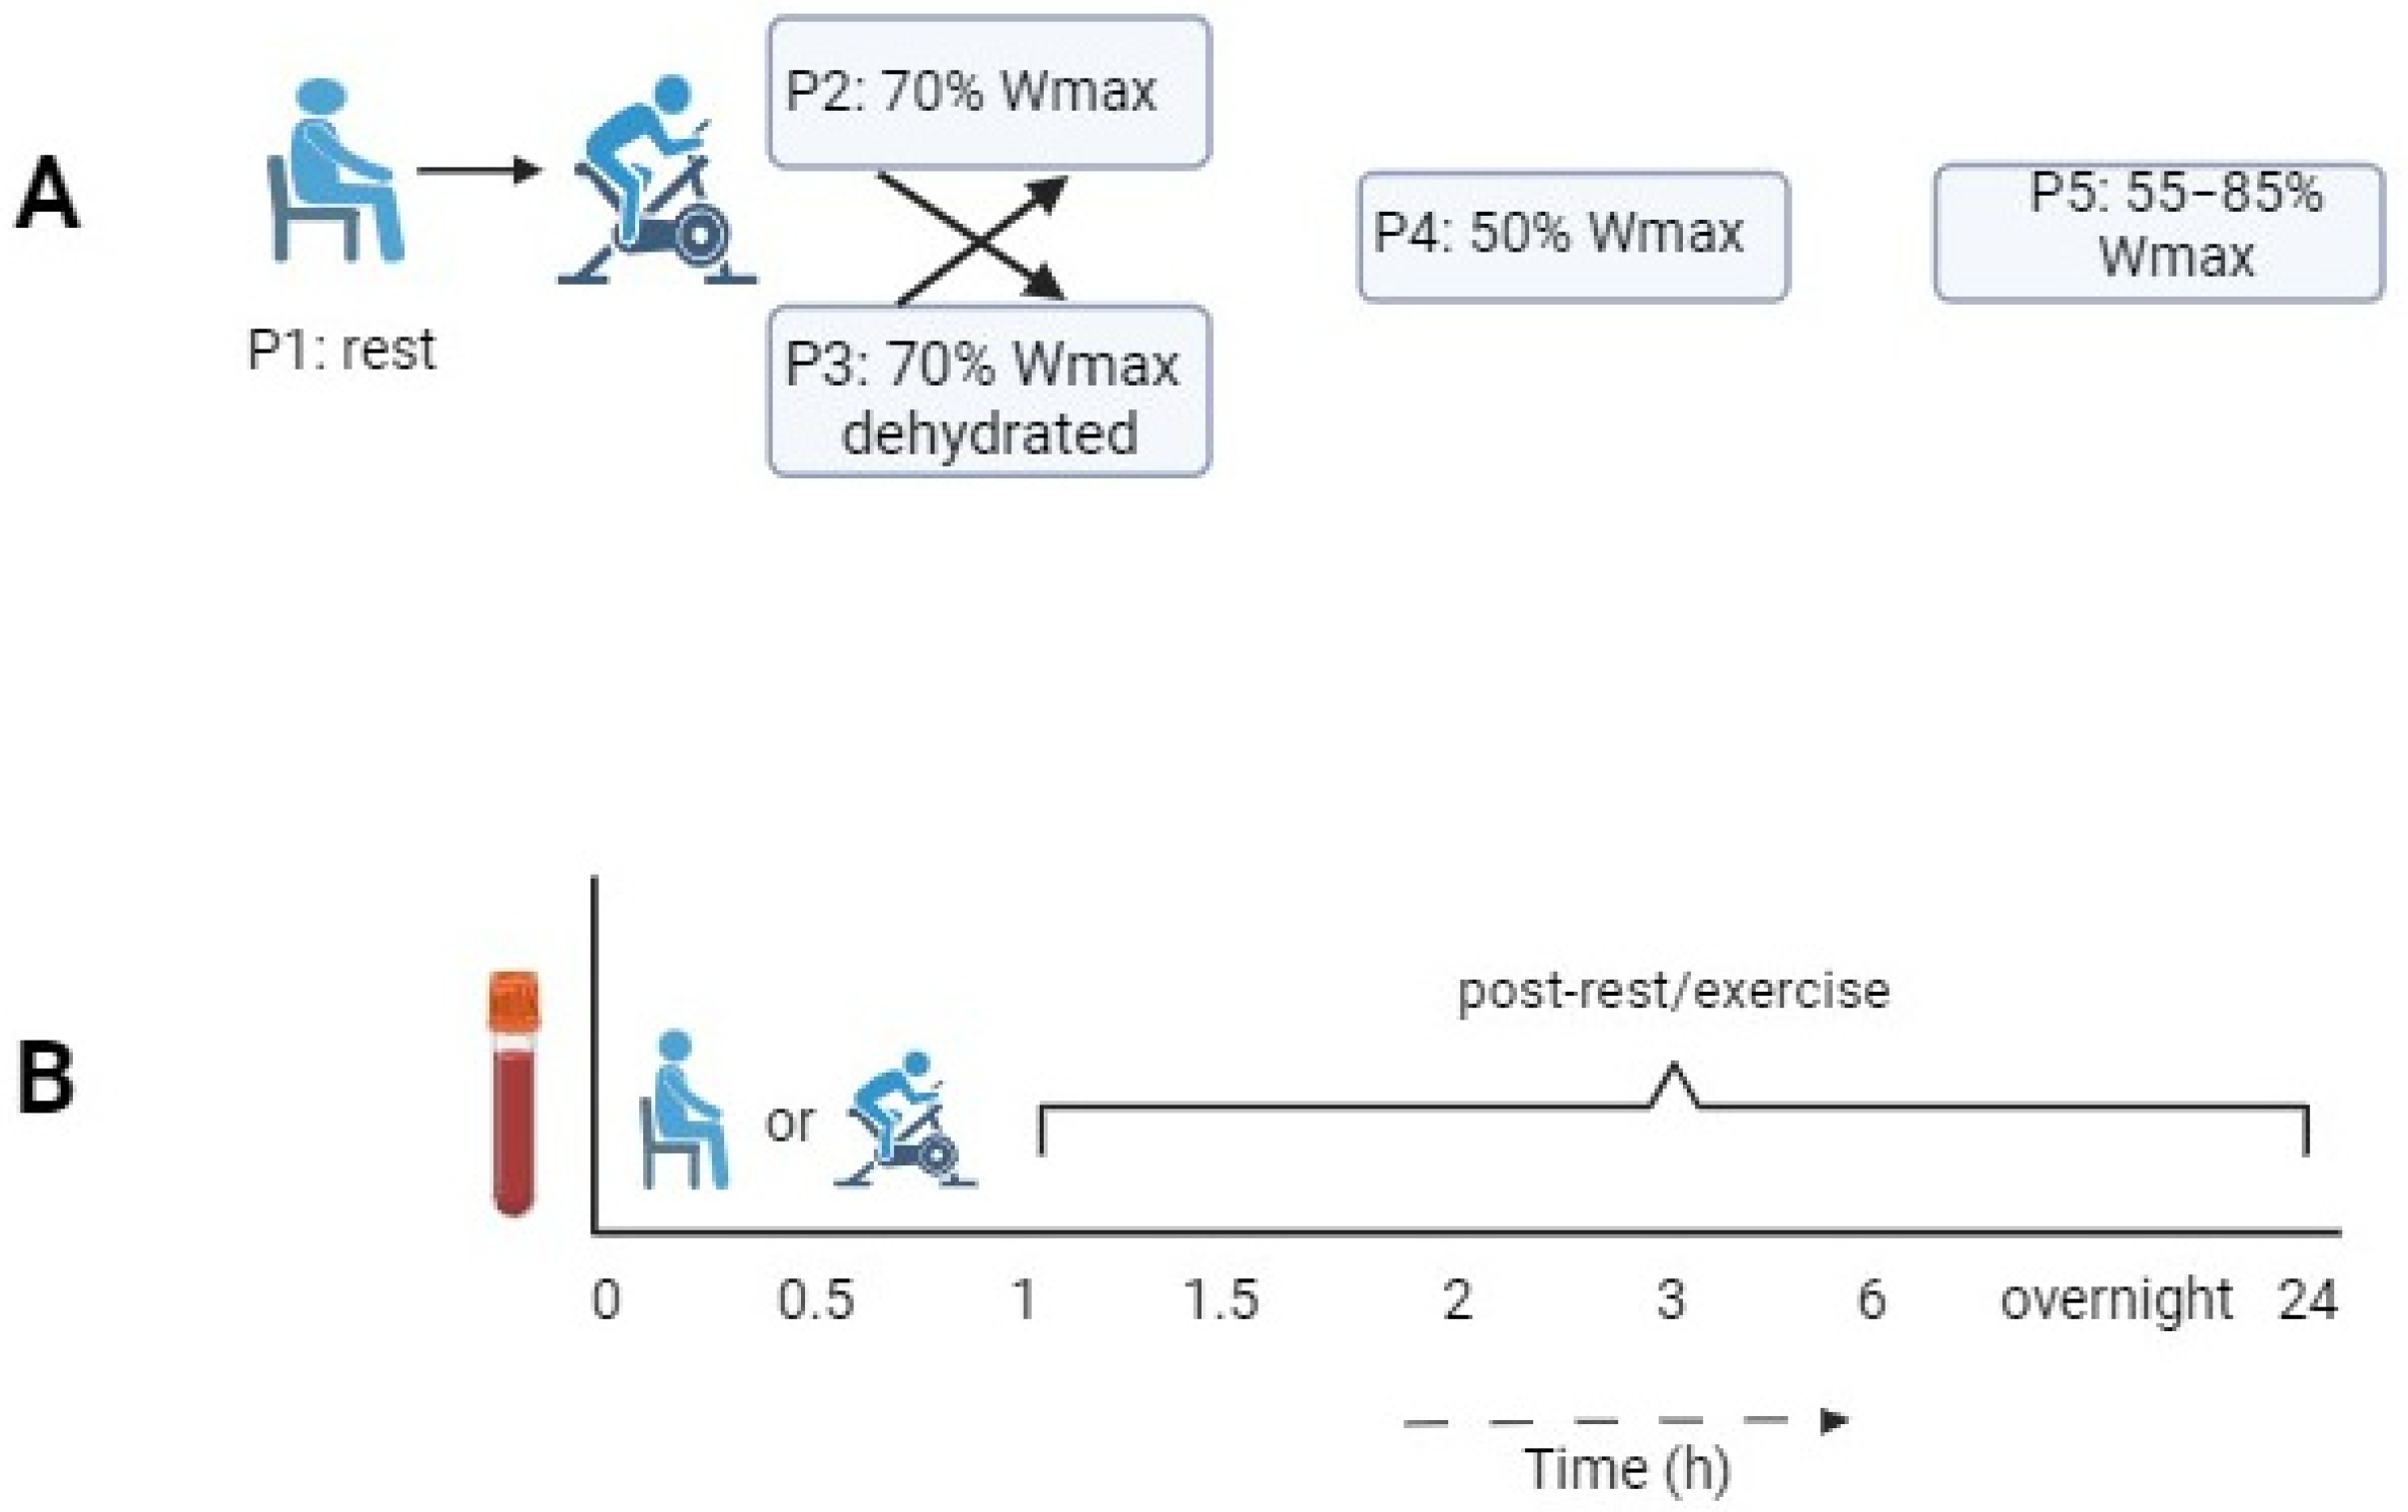
This study was registered at the ISRCTN clinical trial registry (isrctn.com) with code ISRCTN13656034; approved by the medical ethics committee of Wageningen University and Research (WUR), The Netherlands; and conducted in accordance with the Declaration of Helsinki [27]. Informed consent was signed after the procedures and guidelines were discussed and before data collection started.

2.1. Study Design

The study setup has been previously outlined [25,26]. In summary, 15 healthy, young (20–35 years) men initially underwent a pre-test using an electronically braked cycle ergometer (Lode Excalibur, Groningen, The Netherlands) to determine their individual maximal workload (Wmax) and maximal oxygen uptake (VO2max). Subsequently, the participants followed an experimental protocol comprising both no exercise (P1) and four different bicycle ergometer protocols (P2–P5) in a random block order with a wash-out of 1 week in between. Each participant commenced with the rest protocol (P1). The exercise protocols included one moderate-intensity exercise protocol (50% of the Wmax) and three high-intensity exercise protocols, two of which differed only in the hydration status (70% of the Wmax) and one of which was an interval protocol (55/85% of the Wmax). Details on the protocols are given in Table 1 and full details are given by Kartaram et al. [25,26].
Both the high-intensity protocols of 70% of the Wmax (P2 and P3), which differed only in their hydration status, were always performed sequentially in a random cross-over mode. A condition of mild dehydration was induced by not compensating for the fluid lost during exercise.
Blood samples were taken at different time points (displayed as T in hours after the start of exercise): before (T0), during (T0.5), and at the end (T1) of the exercise period, and at several time points post-exercise (T1.5, T2, T3, T6, and T24). The baseline blood sample (T0) was obtained after fasting overnight. The samples were collected separately in EDTA, sodium heparin plasma, and serum separator tubes (Vacutainer; Becton Dickinson, Breda, The Netherlands). The EDTA-treated whole-blood tubes were stored at 4 °C and the sodium heparin plasma tubes were stored at room temperature (RT) until the analyses at the end of each test day. The serum separator tubes were set aside in the dark at RT for at least 30 min, after which the tubes were centrifuged at 2000× g for 10 min. The obtained sera were directly aliquoted and stored at 80 °C until further analysis. Following a second overnight fast, the participants arrived the next morning at the laboratory for a final blood collection at 24 h. Figure 1 shows an overview of the experimental protocols and the time points at which the blood samples were obtained.

2.2. Blood Analysis

A quantitative analysis of the leukocyte subsets, i.e., lymphocytes, monocytes, neutrophils, eosinophils, basophils, and thrombocytes, was performed on the EDTA whole blood with an ADVIA 1200 Chemistry Analyzer (Siemens, Star-shl, Etten-Leur, Netherlands), according to standard procedures. The interleukins and chemokines IL-6, IL-10, IFN-γ, granulocyte colony-stimulating factor (G-CSF), monocyte chemotactic protein 1 (MCP-1), inflammatory chemokine interferon gamma-inducible protein of 10 kDa (IP-10, also known as CXCL10), macrophage migration inhibitory factor (MIF), and tumor necrosis factor alpha (TNF-α) were analyzed in the serum. To this end, the frozen sera were thawed on ice, mixed well, and centrifuged at 12,000× g for 10 min at 4 °C. All the sera were diluted to 1:6 in serum matrix diluent (Merck KGaA, Darmstadt, Germany). IL-6, IL-10, IFN-γ, G-CSF, MCP-1, IP-10, and TNF-α were analyzed using the MILLIPLEX MAP Human Cytokine/Chemokine Magnetic Bead Panel (HCYTOMAG-60K-07, Merck). MIF was analyzed using the MILLIPLEX MAP Human Circulating Cancer Biomarker Magnetic Bead Panel (HCCBP1MAG-58K-01, Merck), according to the manufacturer’s instructions, using a MAGPIX Luminex analyzer with (Luminex/Diasorin, ‘s Hertogenbosch, Netherlands) with xPONENT software (version 4.2).
For the flow cytometric analysis, whole-blood samples were stained using three different antibody panels to define the granulocyte (panel 1: CD45, CD193, CD16, and CD62L), monocyte (panel 2: CD3, CD14, CD19, and CD40), and lymphocyte (panel 3: CD16, CD3, and CD56) subpopulations. For each panel, 100 µL of whole blood was stained for 15 min at RT. The red blood cells were lysed by adding lysing solution (BD Biosciences, 10× concentrate), vortexing for 10 s, and incubating for 10 min at RT. Thereafter, the samples were centrifuged for 5 min at 500× g, the cell pellets were carefully resuspended using 1 mL of washing buffer (PBS (Gibco, pH of 7.8) containing 0.2% BSA (Sigma-Aldrich, St. Louis, MI, USA), and the samples were centrifuged again for 5 min at 500× g. The samples were resuspended using 250 µL of PBS (Gibco, pH of 7.8) and 100.000 events were analyzed using the Accuri C6 Flow Cytometer (Becton Dickinson, Breda, The Netherlands). The data were analyzed using the Accuri C6 Software (Version 1.0.264.21).

2.3. Statistical Analysis and Data

The data were analyzed using a multilevel mixed-effects model, as described previously by Kartaram et al. [25]. This model included terms that captured the random variation among the subjects, among the five experimental protocols per volunteer, and also within these experimental protocols. The analysis determined the effects of the overall protocol differences, the differences between the time points within a protocol, and the protocol-by-time interaction. The analyses were performed using the statistical software GenStat (version 18) and the R (version 3.6.1) (Team R Core, 2013) packages lme4 [28,29]. The graphs were created with ggplot2 (R Core Team, 2018). Prior to the analysis, the data were log-transformed to ensure compatibility with the assumption of a constant standard deviation of the observations. To focus on the statistically significant effects, we corrected the raw p-values for multiple testing [30]. he outcomes of the statistical tests with p < 0.05 were considered statistically significant.

3. Results

Blood samples from 15 volunteers were analyzed. Due to personal and organizational issues, one volunteer did not perform the high-intensity exercise protocol at 70% of the Wmax in a dehydrated condition. Data from the other protocols performed by this volunteer, however, were included, as the data analysis showed no differences in the means of the results. The characteristics of the subjects are presented in Table 2.

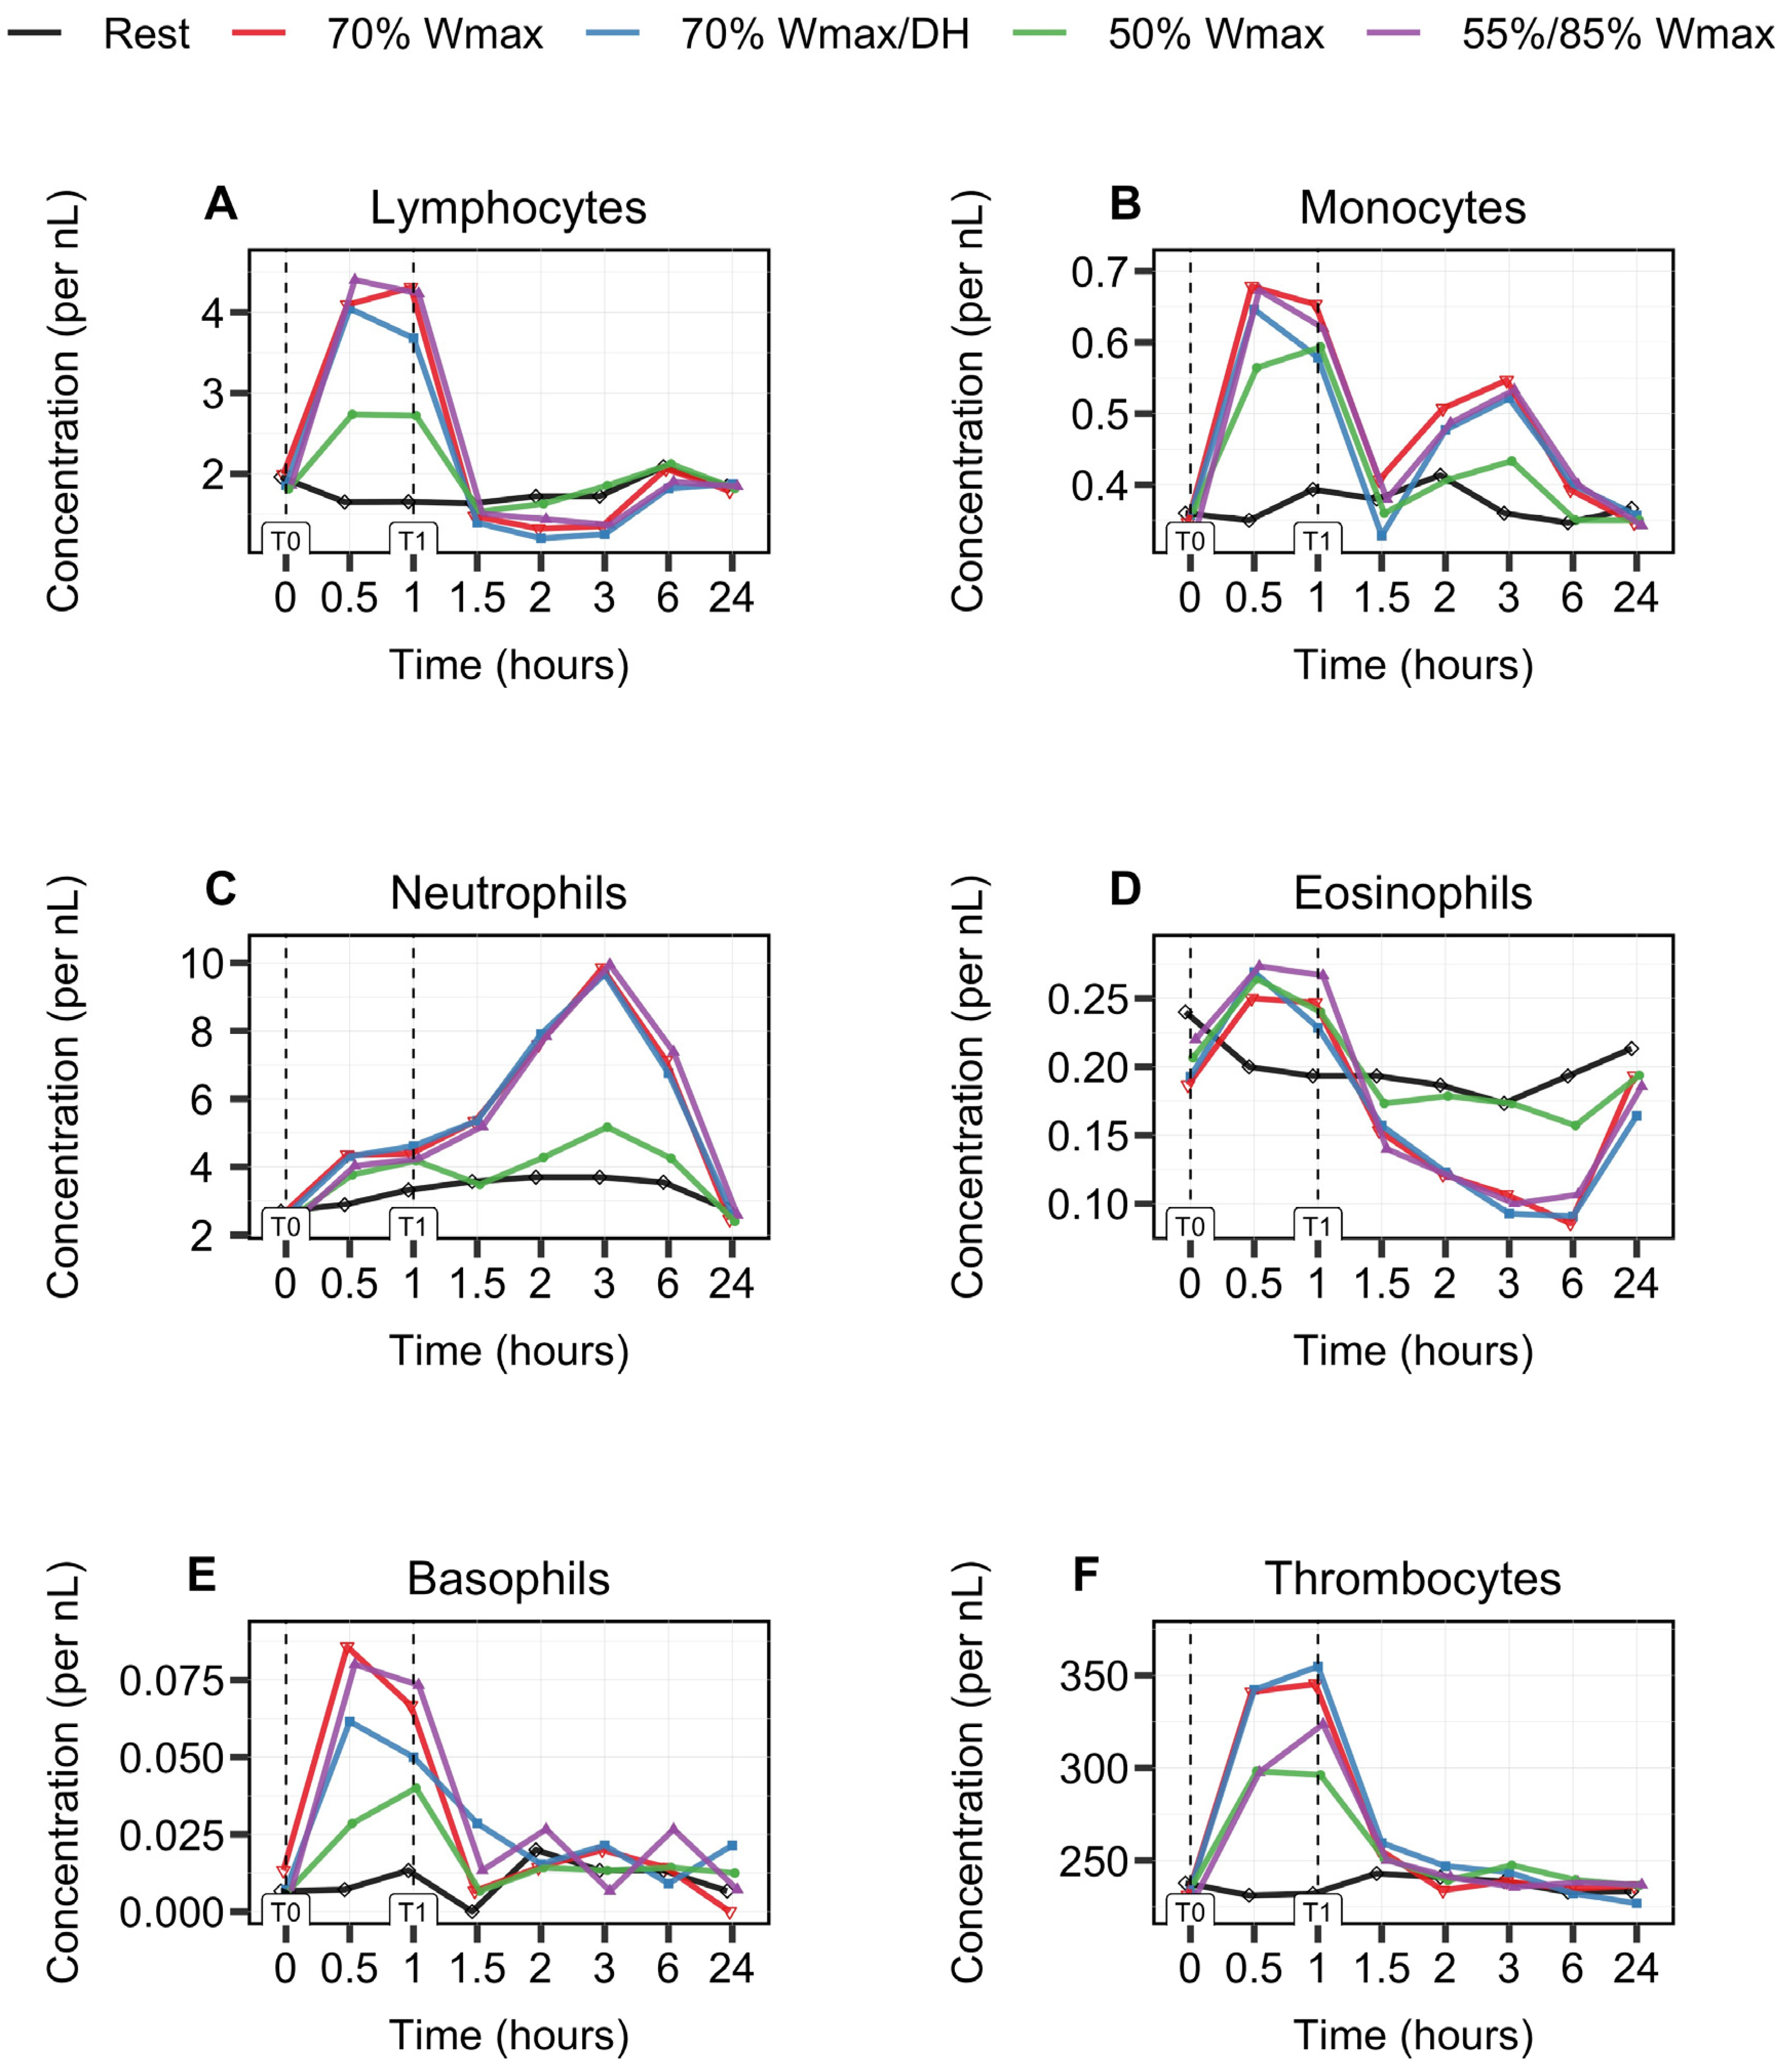
3.1. Biphasic Kinetic Response of Leukocytes

The leukocyte counts showed a biphasic response in all the exercise protocols while remaining stable during and after rest. The total leukocyte count in these protocols increased from the baseline levels at the start of the exercise to a peak between 30 min (T0.5) and the end of the exercise (T1), after which it decreased to the baseline levels at 30 min post-exercise (T1.5) (Table 3). From this point, the number of leukocytes increased again to a second, higher peak 2 h after the exercise (T3). This effect was most pronounced in the high-intensity protocols (P2, P3, and P5), but the mild-intensity exercise (P4) also showed the same biphasic response, although with lower leukocyte numbers in both peaks [26].

3.2. Leukocyte Subsets Behave Differently during and after 1 h Cycle Exercise

We analyzed the counts of different subsets of leukocytes to unravel defined phases of the kinetic response. The lymphocytes and basophils showed a comparable response during exercise (T0–T1), Figure 2A,E), which was distinct from the responses of monocytes, neutrophils, and eosinophils. The lymphocyte and basophil subsets reached maximum levels at T0.5, again more pronounced (p < 0.001) in the high-intensity protocols (70% of Wmax in hydrated and dehydrated conditions, and 55/85% of Wmax with intermittent exercise) compared to the mild-intensity exercise (50% of Wmax). The kinetic changes in the monocyte numbers showed a second, lower peak (T3) that was also exercise-intensity-dependent (p < 0.01, high- vs. low-intensity exercise). The neutrophil numbers, on the other hand, rose slowly during exercise and showed a fast increase from 30 min post-exercise (T1.5) towards a peak 2 h post-exercise (T3) (Figure 2C). The mild-intensity exercise protocol showed much lower peak numbers of neutrophils at T3 (p < 0.001) compared to high-intensity exercise. The number of eosinophils increased during exercise in all the exercise protocols and decreased after exercise to below the baseline levels (T6) only in the high-intensity exercise protocols. The numbers of thrombocytes also increased during exercise (Figure 2F), reaching maximum levels at the end of the exercise and returning to the baseline levels 0.5 h post-exercise, which is comparable to the responses of lymphocytes and basophils. This increase appeared to be exercise-intensity-dependent and was greatest for the high-intensity 70%-of-Wmax protocols in both hydrated and dehydrated conditions (P2 and P3).

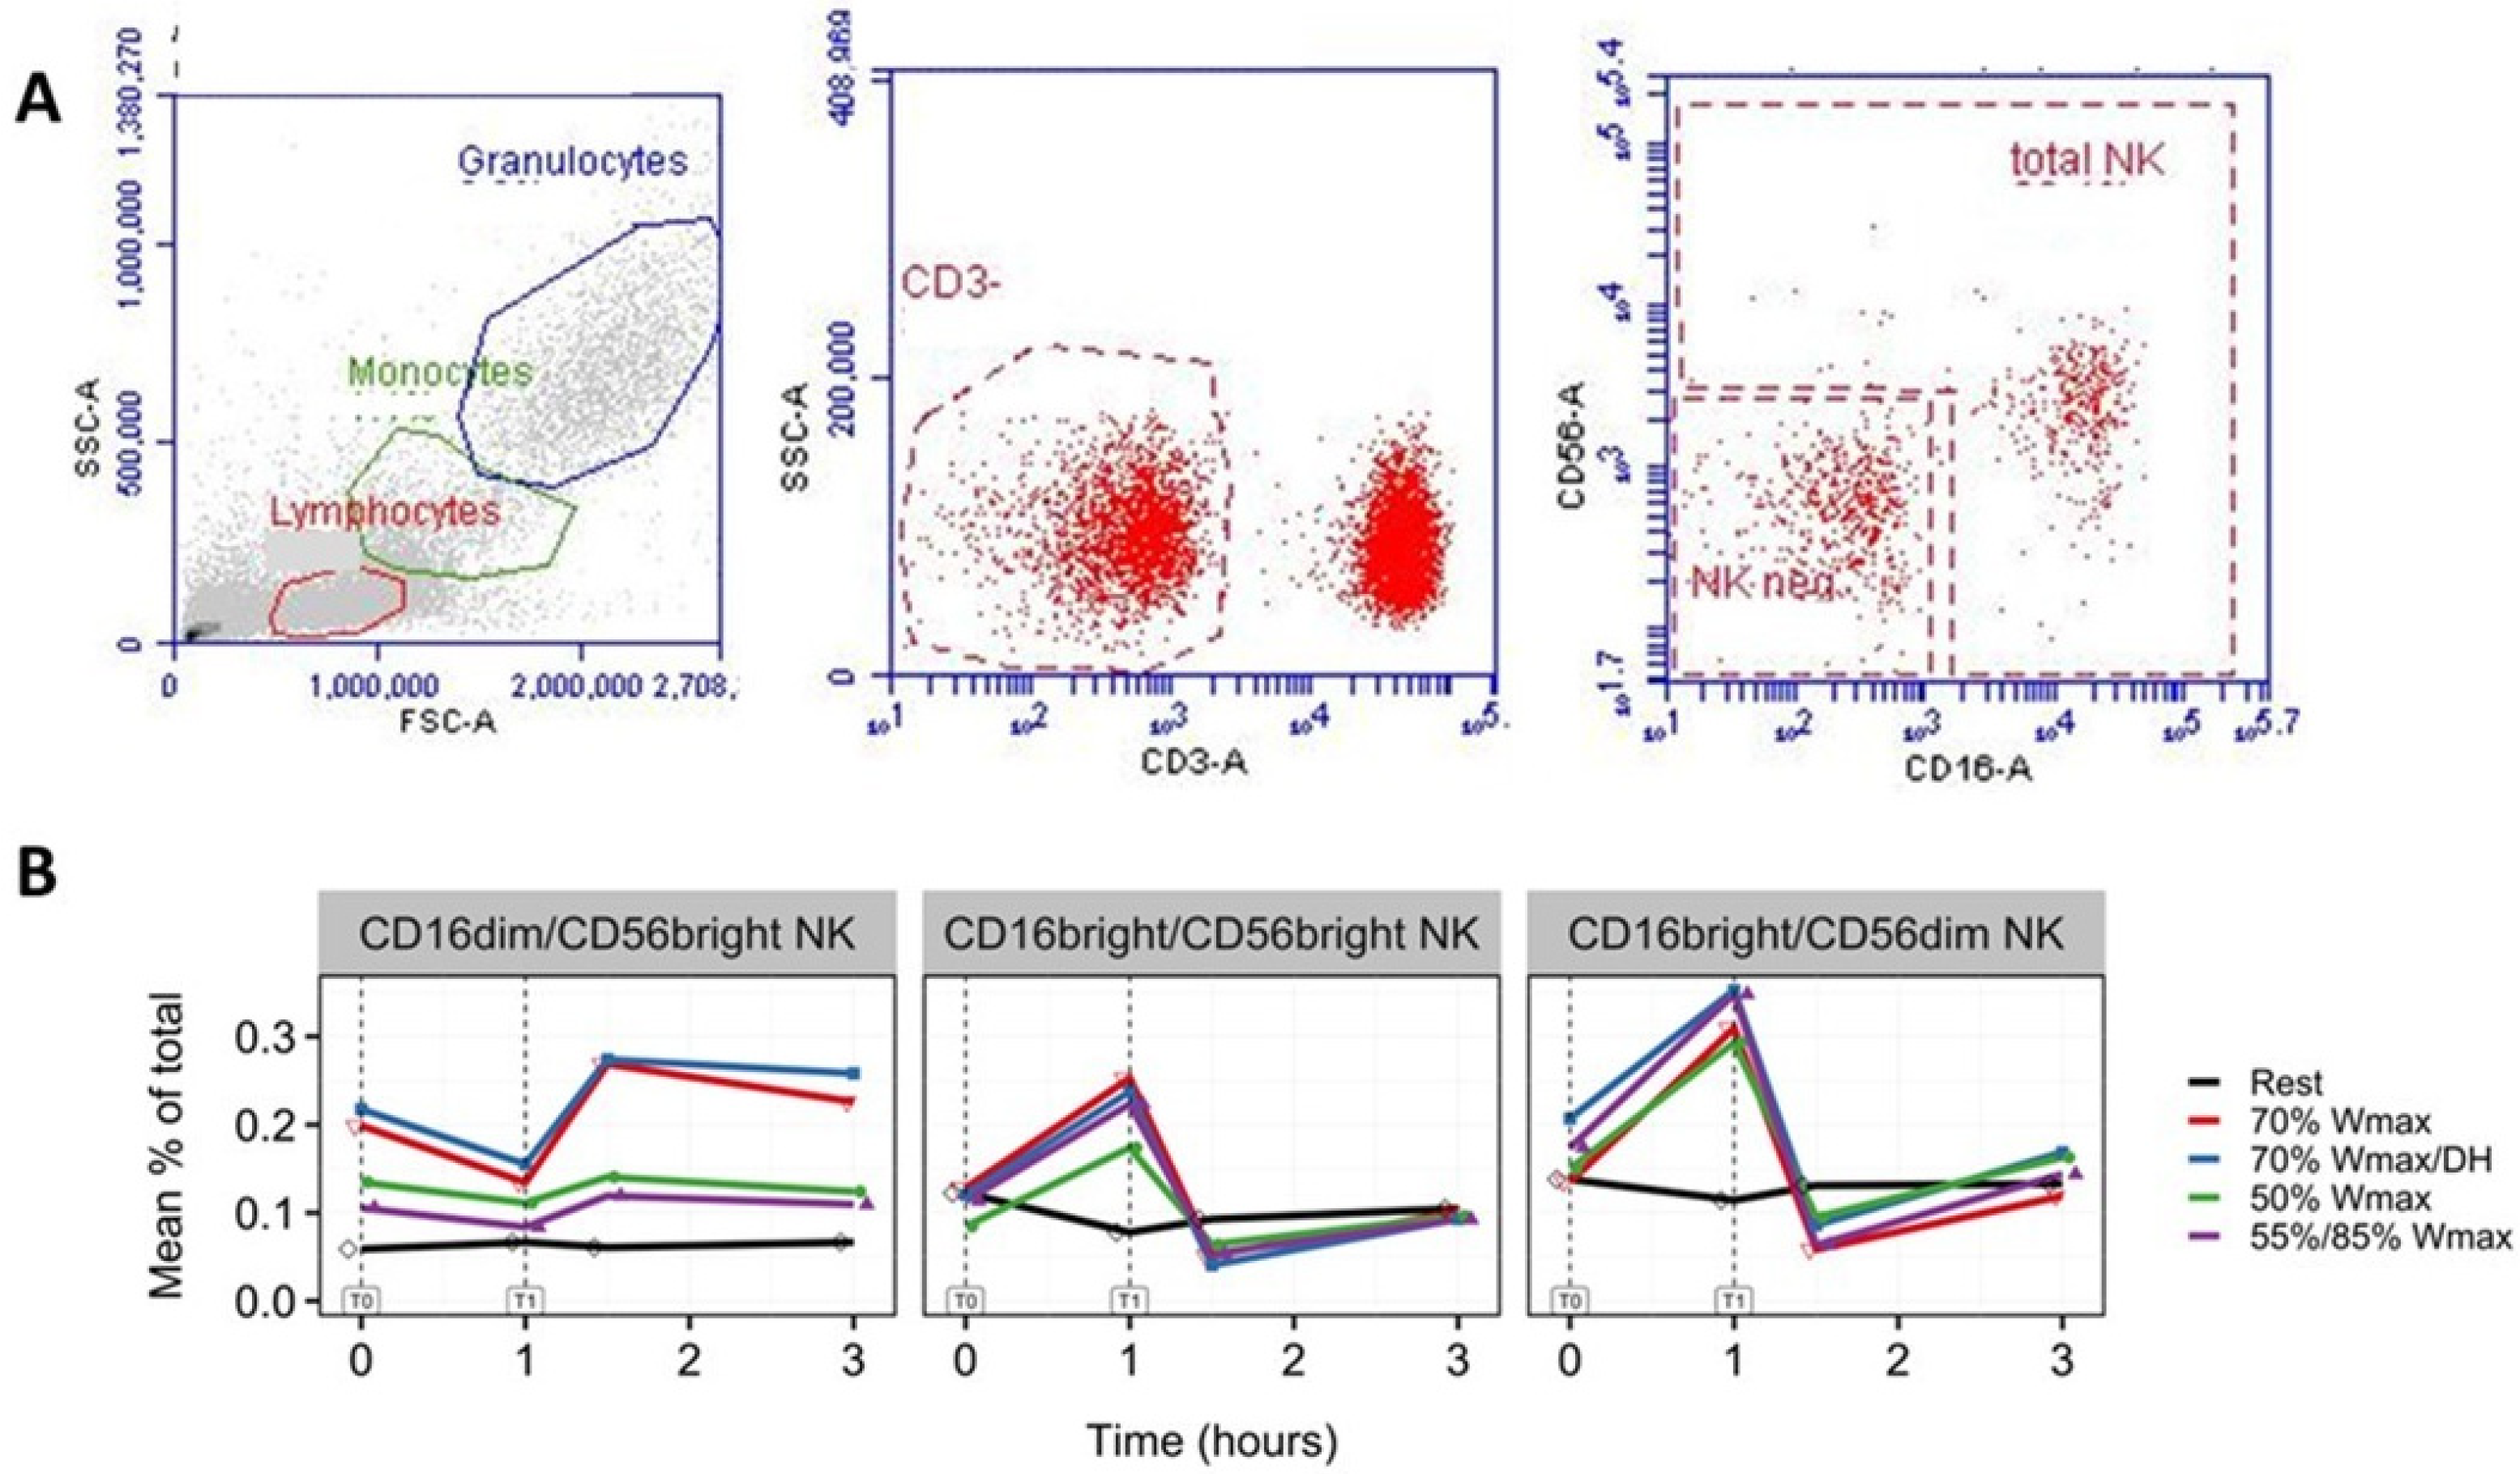
3.3. Increase in NK Cells with Phenotypes CD16brightCD56dim and CD16brightCD56bright

Circulating (CD3CD16+CD56+) NK cells were gated based on their forward- and side- scatter properties (Figure 3A). During exercise, CD16-positive NK cells showed a proportional increase for the subpopulations of CD16bright cells compared to CD16dim cells. This increase was 1.5-fold for the subpopulation with the phenotype CD16brightCD56dim in all the exercise protocols compared to the subpopulation with the phenotype CD16brightCD56bright (Figure 3B), which showed an exercise-intensity dependency. For both CD16bright subpopulations, the peak levels at the end of the exercise (T1) declined beneath the baseline levels at 30 min post-exercise (T1.5) and returned to the baseline levels 2 h post-exercise (T3).

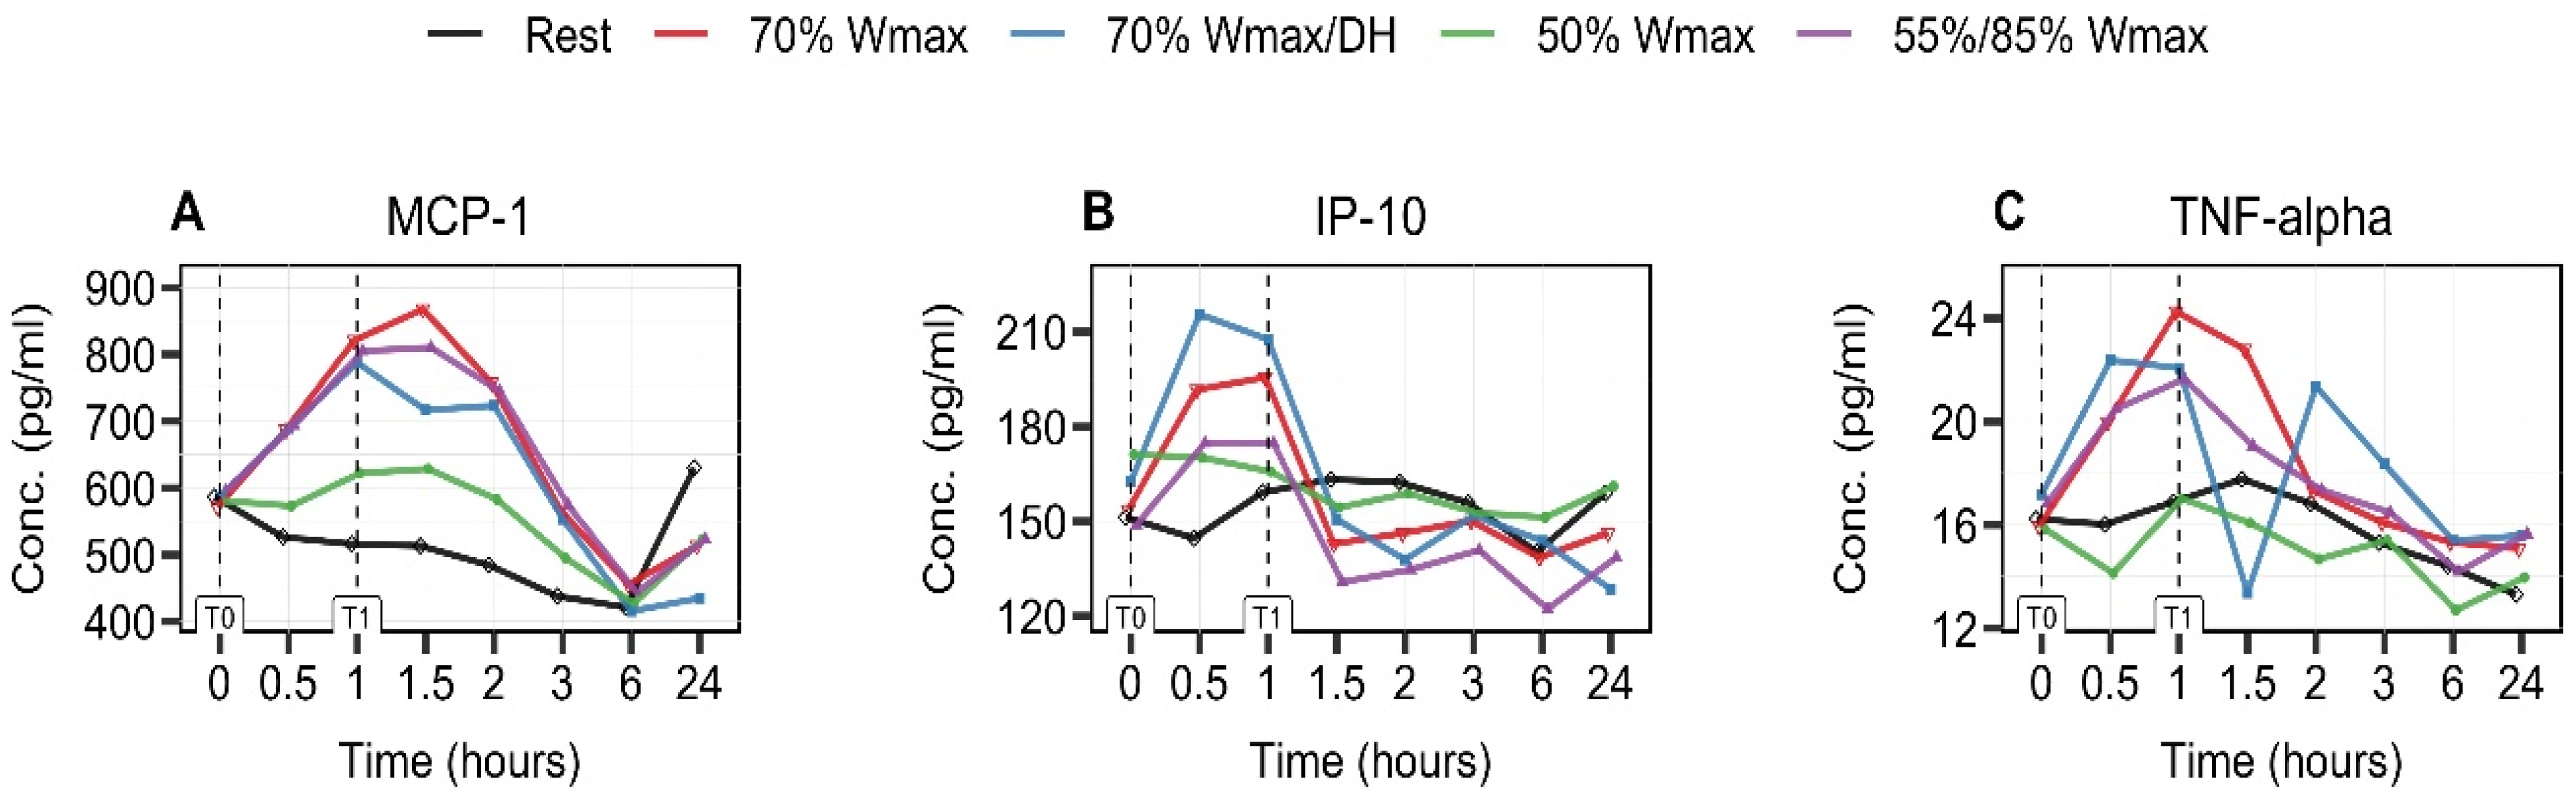
3.4. Exercise-Intensity- and Hydration-Status-Dependent Increase in MCP-1 and IP-10

We analyzed a number of cytokines and chemokines, for which the serum levels of MCP-1 and IP-10 showed the greatest changes (Figure 4A,B). The increase in the MCP-1 levels during exercise was profound in all the high-intensity exercise protocols (P2, P3, and P5), while the increase in the IP-10 levels was more pronounced in a dehydrated condition (P3). The maximum MCP-1 levels were reached gradually at 0.5 h post-exercise (T1.5) and they decreased to the baseline levels at 5 h post-exercise (T6), whereas the IP-10 levels returned to the baseline levels shortly after exercise (T1.5). The TNF-α levels did not change significantly (Figure 4C). The serum levels of MIF, G-CSF, IFN-γ, IL-6, and IL-10 were also measured, but did not show significant changes (Supplementary Materials).

4. Discussion

In this study, we investigated the impact of varying levels of physical exertion on blood markers related to the intestinal barrier function, general metabolism, and hematological parameters, such as the total leukocytes and hemoglobin. These changes correlated with the workload and the perceived exercise stress, as previously reported [26]. We also observed a biphasic change in the numbers of blood leukocytes, with a gradual increase during cycling, resulting in a first peak at 1 h, followed by a decrease immediately after cycling cessation (at 1 h) and a subsequent rise starting from 1.5 h, peaking at 3 h. To delve deeper into the immunological effects of these observations, the present study focused on analyzing the time course of the different leukocyte subsets and a broad range of cytokines. Our current data show that the initial peak primarily comprised lymphocytes, monocytes, basophils, and eosinophils, while the second peak also included monocytes and neutrophils. The increase in the NK cell numbers contributed to the overall rise in the lymphocyte counts. Furthermore, the physical exercise regimen employed in our study led to increased blood levels of MCP-1, IP-10, and, to some extent, TNF-α, coinciding with the first peak in the biphasic leukocyte response. Conversely, the serum levels of MIF, G-CSF, INF-γ, IL-6, and IL-10 remained unaffected. Previous studies have documented alterations in blood leukocyte subsets in response to exercise [31,32,33]. Only a limited number of investigations have explored the kinetics of these responses by assessing multiple time points during and after exercise and by comparing various exercise intensities within a single study. For example, Neves et al. [34] conducted a study involving brief 2 h bouts of treadmill exercise at different intensities (40% and 80% of the VO2peak) and examined two time points: immediately after the 2 h exercise and 2 h later. Their data demonstrated similar peaks, specifically a peak increase in the lymphocyte and monocyte numbers immediately after exercise and a subsequent peak increase in the neutrophil numbers at the 2 h mark after exercise. Notably, the participants in this study were also regular exercisers rather than endurance athletes. In contrast, Bessa et al. [35] investigated the time-dependent effects of exercise-induced leukocytosis up to 72 h after a combined exercise session, including cycling at 85% of the VO2peak. They observed that the highest increase in leukocytosis occurred 3 h post-exercise, which is consistent with our results. However, in contrast to our results, these authors found that the lymphocyte numbers peaked at 12 h post-exercise, whereas the neutrophils and monocytes peaked at 3 h, coinciding with the peak of leukocytosis. Studies involving marathon runners and long-distance cyclists, including a study on a 164 km race in hot and humid conditions, have also reported increases in blood neutrophil counts [36,37]. Luk et al. [36] observed increases in the lymphocyte numbers, including NK cells, at two evaluation points (before and after exercise), whereas Suzuki et al. [37] did not report similar findings. In a separate investigation [33], the exercise-induced effects on leukocytosis were examined in 800 healthy young females and males. Notably, this study only assessed the changes at two time points. They found that just one hour of exercise increased the number of neutrophils, eosinophils, and, to a lesser extent, lymphocytes, but not monocytes. Remarkably, these alterations were observed as early as five minutes after intense exercise. These listed studies show that variations in the trafficking time and the contribution of different leukocyte subsets to exercise-induced leukocytosis were influenced by factors such as individual fitness levels, the exercise duration, the workload, and the nature of the exercise.
We examined changes in the CD56dim and CD56bright subpopulations of NK cells, a subset of lymphocytes known for their heightened responsiveness to physical exercise and their role in the innate immune response. Resting CD56dim NK cells possess a higher cytotoxic potential, while CD56bright cells produce immunoregulatory cytokines, including IFN-γ, IL-10, and G-CSF [38]. Our study revealed that acute lymphocytosis occurred immediately from the beginning of exercise, coinciding with an increase in both NK cell subsets, CD16brightCD56dim and CD16brighCD56bright. Notably, the response in the latter subset appeared to be dependent on the exercise intensity. However, our results obtained from healthy and fit volunteers did not demonstrate a proportional increase in most cytokines, including IFN-γ. We hypothesize that the NK cell response varies based on factors such as physical condition, age, gender, and the intensity and duration of exercise. Timmons et al. [39,40] investigated exercise-induced changes in NK cell subsets in both male and female children and adolescents. They found that both the CD56dim and CD56bright cell subsets were significantly increased in female adolescents compared to male adolescents, while the ratio between these subsets remained constant. Additionally, they observed that, during exercise, boys in the late puberty stage exhibited the highest increase in CD56bright cell numbers. In contrast, Kakanis et al. [41] reported that a strenuous endurance exercise protocol, consisting of 2 h at 90% of the Wmax, resulted in decreased total NK cell numbers, an increase in CD16+CD56brigjht NK cells, and no change in CD16+CD56dim NK cells. This variance between the findings of Kakanis and our study could be attributed to differences in study participants, with Kakanis et al. focusing on elite triathlon athletes and our study involving less highly trained recreational cyclists. These distinctions may have also influenced the kinetics of the neutrophils, which exhibited variability between the two studies. In studies of this nature, the relationship between the cellular responses and soluble factors, including cytokines, chemokines, and growth factors, is relevant, as these factors may serve as early biomarkers that may explain underlying mechanisms. Some studies have shown that, following exhaustive endurance exercises such as marathons and triathlons, the post-exercise levels of cytokines such as IL-1RA, IL-1, IL-6, and IL-10 significantly increased [42,43], while short-duration intensive exercises had no such effect [44].
Conversely, it is well accepted that prolonged periods of intensive exercise training can potentially suppress immunity and elevate the risk of infection, a concept known as the “open window” theory. However, Campbell and Turner [45] debunked this theory, redefining the impact of exercise on immunological health. They proposed that the decline in the numbers of lymphocyte subsets primarily reflects a redistribution of cells rather than a suppression of the immune response. Additionally, a recent review article [7] argued that any bout of moderate to intense exercise enhances the exchange of immune cells between peripheral blood and tissues, contributing to improved immune surveillance and overall health. Based on these references and on our data, we assumed that, in our study, the kinetic changes in cell subsets reflected a redistribution of cells due to heightened hemodynamic activity between the blood compartment and the lymphoid and peripheral tissues.
The precise mechanisms and biological triggers responsible for these observed kinetic changes, as well as their relevance to health outcomes, remain largely unknown. Multiple factors may be at play, including the release of the stress hormone cortisol, elevated creatinine levels due to increased muscle activity, metabolic alterations in immune cells, and changes in intestinal metabolism and permeability. For instance, in a study involving a single bout of 20 min high-intensity exercise [46], cortisol levels increased slightly compared to the twofold increase observed after a marathon [47], implying that the exercise duration and intensity may influence the cortisol levels. Elevated cortisol levels, further augmented by the rise in circulating IL-6 from skeletal muscles [48], may play a pivotal role in exercise-induced leukocytosis [49], along with increased levels of catecholamines [36]. Our data [25] indicate that the increase in serum cortisol levels during high-intensity exercise protocols coincides with the initial peak response of leukocytes, including lymphocytes, suggesting that the stress response rapidly initiates the immune response. In our study, the kinetic response of leukocytes exhibited a biphasic pattern, similar to that observed with creatine phosphokinase (CPK), a marker for muscle damage, during high-intensity exercise, as previously demonstrated [25]. The magnitude of the post-exercise peak of CPK coincided with the maximum response of neutrophils. These findings suggest a potential association between the cellular immune response and muscle damage, aligning with the results of Shin et al. [50], who showed that, during an ultra-marathon run, leukocytosis followed the increased levels of CPK and the cytokine IL-6. While it is widely acknowledged that changes in cytokine levels are linked to muscle damage [51], our results did not reveal elevated IL-6 levels. Monocyte chemoattractant protein-1 (MCP-1) functions as a chemokine that regulates monocyte migration and acts as a muscle-contraction-regulated myokine with potential implications for exercise-induced changes in the immune system [52]. In our study, the time course of MCP-1 exhibited an intensity-dependent increase during exercise, coinciding with the initial peak in exercise-induced changes in monocytes. This suggests a possible influence of muscle activity on the immune response of a specific leukocyte subset. However, 2 h post-exercise, the MCP-1 levels declined and returned to their baseline levels, while the monocytes exhibited a second peak at this time point. There is a likelihood that various monocyte subtypes are engaged, each with unique underlying mechanisms playing a role.
A previous study on cytokines in healthy, less fit, older adults [53] showed that the serum levels of cytokines TNF-α, IL-6, and IL-10 did not change significantly after 24 min of mild-intensity (40% of Wmax) or 12 min of high-intensity (70%) interval exercise. Our results regarding IL-6 and IL-10 in healthy, young men align with the findings of Windsor et al. Furthermore, van Craenenbroeck et al. [54] reported no significant change in the IL-6 levels of healthy subjects after exercise compared to patients with chronic kidney disease or chronic heart failure. It can be hypothesized that, in healthy, physically fit individuals, a single bout of exercise does not result in increased levels of inflammatory cytokines. Conversely, Suzuki [37] showed that, after a 42 km marathon race, plasma interleukins and cytokines, including IL-6, IL-8, IL-10, G-CSF, and MCP-1, significantly increased. Moreover, they showed that the increases in band neutrophils were correlated with the IL-6 response, suggesting the IL-6-mediated bone marrow release of neutrophils. It is highly probable that intensive, prolonged exercise results in the elevation of cytokine levels.
Although previous studies have provided valuable insights, there are conflicting data due to factors such as the individual fitness level, the type of exercise, the intensity, and the duration. These factors, which we have also taken into account in our study design, influence the cellular response, particularly the involvement of immune cell subsets, in exercise-induced leukocytosis in relation to cytokines and chemokines. The protocols in our study were standardized in their duration (1 h cycling), but varied in their exercise intensity to explore the effects of moderate- and high-intensity exercise on various parameters [26], including immune markers. The subjects were limited to relatively young, healthy, and fit men to control for the effects of age, fitness level, and gender on the immune system. However, individual intrinsic factors such as genetic predispositions and diet may also play a role [31]. Therefore, the further standardization of exercise models is required before the data can contribute to the understanding of the predictive power selectivity and specificity of biomarkers in assessing immunological health.
To the best of our knowledge, none of the cited studies have addressed a comprehensive time course of leukocytosis as a potential measure of exercise-induced immunological stress with varying intensities within the same study. Measuring resilience requires observing the kinetics for at least 24 h. Our data show that all the biomarkers returned from the maximal response to their normal background levels within 6 to 24 h after the start of the cycling exercise, reflecting a temporary imbalance and a striving for homeostasis. Therefore, it is highly recommended to obtain samples at multiple time points to monitor the responses during exercise as well as during post-exercise recovery. Most of the cytokines measured in our study exhibited no significant differences in their responses between mild- and high-intensity exercise, except for MCP-1, which may indicate the extent of the exercise stress. As such, the physiological response, particularly among different leukocyte subsets, may serve as an indicator of immune resilience to stressors. Additionally, an interesting observation in our study was that even low-intensity exercise at 50% of the Wmax led to alterations in the kinetic responses of lymphocytes, monocytes, neutrophils, and basophils. This holds promise for assessing the health and recovery status of less fit and diseased individuals. Our data provide a deeper understanding of the immune response triggered by exercise and the time required for recovery among various subsets in healthy young men. The distinct underlying mechanisms governing the trafficking time of these subsets still require further exploration.

5. Conclusions

In conclusion, our study sheds light on the complex and dynamic relationship between exercise and the immune system. We observed distinct kinetic patterns in leukocyte subsets and cytokines during exercise that were influenced by different exercise intensities. The analysis of leukocyte subsets as inflammatory markers offers valuable insights for understanding the immune responses to physical stress and for exploring immunological resilience. The kinetics of exercise-induced immune responses, including increases, peaks, and decreases, provide valuable information on the dynamics of immune fitness and the recovery time. These findings have the potential to assess individuals’ health status and monitor the effects of training in both elite and recreational athletes.

Supplementary Materials

The following supporting information can be downloaded at: https://www.mdpi.com/article/10.3390/immuno4010003/s1, Figure S1: Kinetic changes in serum levels of the cytokines IL-6 (A), IL-10 (B), IFN-γ (C), G-CSF (D) and MIF (E) during and at various time points after exercise or rest.

Author Contributions

Conceptualization, S.W.K., K.v.N., L.M., J.G., R.W. and R.P.; data curation, S.W.K., M.T., K.v.N., M.S., M.C.M.V., R.W. and R.P.; formal analysis, S.W.K., M.T., M.S., M.C.M.V. and K.M.; funding acquisition, L.M., J.G., R.W. and R.P.; investigation, S.W.K., K.v.N., M.S., M.C.M.V. and R.P.; methodology, S.W.K., M.S., M.C.M.V., R.W. and R.P.; project administration, S.W.K., M.S., L.M. and M.C.M.V.; resources, M.S.; software, M.T. and K.M.; supervision, K.v.N., J.G., R.W. and R.P.; validation, M.S., M.C.M.V. and K.M.; visualization, S.W.K., M.T. and M.S.; writing—original draft, S.W.K.; writing—review and editing, S.W.K., M.T., K.v.N., M.S., L.M., M.C.M.V., K.M., J.G., R.W. and R.P. All authors have read and agreed to the published version of the manuscript.

Funding

This study was funded by The Dutch Society of Sciences and Art NWO SIA, RAAK project RAAK PRO 4-017.

Institutional Review Board Statement

The current study, registered at isrctn.com with code ISRCTN13656034, was approved by the medical ethics committee of Wageningen University and Research (WUR), The Netherlands, and was conducted in accordance with the Declaration of Helsinki [27]. Informed consent was signed after the procedures and guidelines were discussed, and before data collection started. All the subjects completed a health questionnaire and participated voluntarily.

Informed Consent Statement

Written informed consent has been obtained from the subjects to publish this paper.

Data Availability Statement

The data generated in this study, the graphs included in this publication, and part of the statistical analyses are available in an R package at https://github.com/uashogeschoolutrecht/immuneDiagrams (accessed date 17 January 2024).

Acknowledgments

We are grateful to all the subjects for their dedicated commitment during the study period. We would like to thank the staff of the Division of Human Nutrition and Health of Wageningen University and Research for taking the blood samples. We would also like to thank Renée Aleman for her technical support concerning the cytokine measurements.

Conflicts of Interest

The authors declare that the research was conducted in the absence of any commercial or financial relationships that could be construed as potential conflicts of interest.

References

  1. Walsh, N.P.; Gleeson, M.; Pyne, D.B.; Nieman, D.C.; Dhabhar, F.S.; Shephard, R.J.; Oliver, S.J.; Bermon, S.; Kajeniene, A. Position statement. Part two: Maintaining immune health. Exerc. Immunol. Rev. 2011, 17, 64–103. [Google Scholar]
  2. de Toda, I.M.; Ceprián, N.; Cerro, E.D.-D.; De la Fuente, M. The Role of Immune Cells in Oxi-Inflamm-Aging. Cells 2021, 10, 2974. [Google Scholar] [CrossRef] [PubMed]
  3. Petersen, A.M.W.; Pedersen, B.K. The anti-inflammatory effect of exercise. J. Appl. Physiol. 2005, 98, 1154–1162. [Google Scholar] [CrossRef] [PubMed]
  4. Gleeson, M.; Bishop, N.C.; Stensel, D.J.; Lindley, M.R.; Mastana, S.S.; Nimmo, M.A. The anti-inflammatory effects of exercise: Mechanisms and implications for the prevention and treatment of disease. Nat. Rev. Immunol 2011, 11, 607–615. [Google Scholar] [CrossRef] [PubMed]
  5. Pyne, D.B.; Gleeson, M. Effects of Intensive Exercise Training on Immunity in Athletes. Int. J. Sports Med. 1998, 19 (Suppl. S3), S183–S194. [Google Scholar] [CrossRef] [PubMed]
  6. Nieman, D.C.; Nehlsen-Cannarella, S.L.; Fagoaga, O.R.; A Henson, D.; Shannon, M.; E Hjertman, J.M.; Schmitt, R.L.; Bolton, M.R.; Austin, M.D.; Schilling, B.K.; et al. Immune function in female elite rowers and non-athletes. Br. J. Sports Med. 2000, 34, 181–187. [Google Scholar] [CrossRef] [PubMed]
  7. Simpson, R.J.; Katsanis, E. The immunological case for staying active during the COVID-19 pandemic. Brain Behav. Immun. 2020, 87, 6–7. [Google Scholar] [CrossRef]
  8. Pawelec, G. Age and immunity: What is “immunosenescence”? Exp. Gerontol. 2018, 105, 4–9. [Google Scholar] [CrossRef]
  9. Nieman, D.C.; Henson, D.A.; Gusewitch, G.; Warren, B.J.; Dotson, R.C.; Butterworth, D.E.; Nehlsen-Cannarella, S.L. Physical activity and immune function in elderly women. Med. Sci. Sports Exerc. 1993, 25, 823–831. [Google Scholar] [CrossRef]
  10. Suzuki, K.; Totsuka, M.; Nakaji, S.; Yamada, M.; Kudoh, S.; Liu, Q.; Sugawara, K.; Yamaya, K.; Sato, K. Endurance exercise causes interaction among stress hormones, cytokines, neutrophil dynamics, and muscle damage. J. Appl. Physiol. 1999, 87, 1360–1367. [Google Scholar] [CrossRef]
  11. Carol, A.; Witkamp, R.F.; Wichers, H.J.; Mensink, M. Bovine colostrum supplementation’s lack of effect on immune variables during short-term intense exercise in well-trained athletes. Int. J. Sport Nutr. Exerc. Metab. 2011, 21, 135–145. [Google Scholar] [CrossRef] [PubMed]
  12. Hackney, A.C. Exercise as a stressor to the human neuroendocrine system. Medicina 2006, 42, 788–797. [Google Scholar] [PubMed]
  13. Lee, E.C.; Fragala, M.S.; Kavouras, S.A.; Queen, R.M.; Pryor, J.L.; Casa, D.J. Biomarkers in Sports and Exercise: Tracking Health, Performance, and Recovery in Athletes. J. Strength Cond. Res. 2017, 31, 2920–2937. [Google Scholar] [CrossRef] [PubMed]
  14. Pedersen, B.K. Influence of Physical Activity on the Cellular Immune System: Mechanisms of Action. Int. J. Sports Med. 1991, 12 (Suppl. S1), S23–S29. [Google Scholar] [CrossRef]
  15. A McCarthy, D.; Grant, M.; Marbut, M.; Watling, M.; Wade, A.J.; Macdonald, I.; Nicholson, S.; Melsom, R.D.; Perry, J.D. Brief exercise induces an immediate and a delayed leucocytosis. Br. J. Sports Med. 1991, 25, 191–195. [Google Scholar] [CrossRef]
  16. Ronsen, O.; Pedersen, B.K.; Øritsland, T.R.; Bahr, R.; Kjeldsen-Kragh, J. Leukocyte counts and lymphocyte responsiveness associated with repeated bouts of strenuous endurance exercise. J. Appl. Physiol. 2001, 91, 425–434. [Google Scholar] [CrossRef]
  17. Saito, Y.; Kusaka, Y.; Shimada, M. Effects of exercise intensity on circulating leukocyte subpopulations. Environ. Health Prev. Med. 2003, 8, 18–22. [Google Scholar] [CrossRef]
  18. Nieman, D.C. Clinical implications of exercise immunology. J. Sport Health Sci. 2012, 1, 12–17. [Google Scholar] [CrossRef]
  19. Nigro, E.; Polito, R.; Alfieri, A.; Mancini, A.; Imperlini, E.; Elce, A.; Krustrup, P.; Orrù, S.; Buono, P.; Daniele, A. Molecular mechanisms involved in the positive effects of physical activity on coping with COVID-19. Eur. J. Appl. Physiol. 2020, 120, 2569–2582. [Google Scholar] [CrossRef]
  20. Scurati, R.; Papini, N.; Giussani, P.; Alberti, G.; Tringali, C. The Challenge of Long COVID-19 Management: From Disease Molecular Hallmarks to the Proposal of Exercise as Therapy. Int. J. Mol. Sci. 2022, 23, 12311. [Google Scholar] [CrossRef] [PubMed]
  21. Duggal, N.A.; Niemiro, G.; Harridge, S.D.R.; Simpson, R.J.; Lord, J.M. Can physical activity ameliorate immunosenescence and thereby reduce age-related multi-morbidity? Nat. Rev. Immunol. 2019, 19, 563–572. [Google Scholar] [CrossRef]
  22. Sellami, M.; Gasmi, M.; Denham, J.; Hayes, L.D.; Stratton, D.; Padulo, J.; Bragazzi, N. Effects of acute and chronic exercise on immunological parameters in the elderly aged: Can physical activity counteract the effects of aging? Front. Immunol. 2018, 9, 2187. [Google Scholar] [CrossRef]
  23. JanssenDuijghuijsen, L.M.; Keijer, J.; Mensink, M.; Lenaerts, K.; Ridder, L.; Nierkens, S.; Kartaram, S.W.; Verschuren, M.C.M.; Pieters, R.H.H.; Bas, R.; et al. Adaptation of exercise-induced stress in well-trained healthy young men. Exp. Physiol. 2017, 102, 86–99. [Google Scholar] [CrossRef]
  24. JanssenDuijghuijsen, L.M.; Van Norren, K.; Grefte, S.; Koppelman, S.J.; Lenaerts, K.; Keijer, J.; Witkamp, R.F.; Wichers, H.J. Endurance Exercise Increases Intestinal Uptake of the Peanut Allergen Ara h 6 after Peanut Consumption in Humans. Nutrients 2017, 9, 84. [Google Scholar] [CrossRef]
  25. Kartaram, S.; Mensink, M.; Teunis, M.; Schoen, E.; Witte, G.; Duijghuijsen, L.J.; Verschuren, M.; Mohrmann, K.; M’Rabet, L.; Knipping, K.; et al. Plasma citrulline concentration, a marker for intestinal functionality, reflects exercise intensity in healthy young men. Clin. Nutr. 2019, 38, 2251–2258. [Google Scholar] [CrossRef] [PubMed]
  26. Kartaram, S.W.; van Norren, K.; Schoen, E.; Teunis, M.; Mensink, M.; Verschuren, M.; M’rabet, L.; der Vaart, I.B.-V.; Mohrmann, K.; Wittink, H.; et al. Kinetics of Physiological Responses as a Measure of Intensity and Hydration Status During Experimental Physical Stress in Human Volunteers. Front. Physiol. 2020, 11, 1006. [Google Scholar] [CrossRef]
  27. WMA Declaration Of Helsinki – Ethical Principles For Medical Research Involving Human Subjects. Available online: https://www.wma.net/policies-post/wma-declaration-of-helsinki-ethical-principles-for-medical-research-involving-human-subjects/ (accessed on 17 January 2024).
  28. Bates, D.; Mächler, M.; Bolker, B.; Walker, S. Fitting linear Mixed-effects models using lme4. J. Stat. Softw. 2015, 67, 1–48. [Google Scholar] [CrossRef]
  29. nlme: Linear and Nonlinear Mixed Effects Models. Available online: https://cran.r-project.org/web/packages/nlme/nlme.pdf (accessed on 17 January 2024).
  30. Benjamini, Y.; Hochberg, Y. Controlling the False Discovery Rate: A Practical and Powerful Approach to Multiple Testing. J. R. Stat. Soc. Ser. B (Methodol.) 1995, 57, 289–300. [Google Scholar] [CrossRef]
  31. Gustafson, M.P.; DiCostanzo, A.C.; Wheatley, C.M.; Kim, C.-H.; Bornschlegl, S.; Gastineau, D.A.; Johnson, B.D.; Dietz, A.B. A systems biology approach to investigating the influence of exercise and fitness on the composition of leukocytes in peripheral blood. J. Immunother. Cancer 2017, 5, 30. [Google Scholar] [CrossRef]
  32. Pedersen, B.K.; Hoffman-Goetz, L. Exercise and the Immune System: Regulation, Integration, and Adaptation. Physiol. Rev. 2000, 80, 1055–1081. [Google Scholar] [CrossRef] [PubMed]
  33. Sand, K.L.; Flatebo, T.; Andersen, M.B.; A Maghazachi, A. Effects of exercise on leukocytosis and blood hemostasis in 800 healthy young females and males. World J. Exp. Med. 2013, 3, 11–20. [Google Scholar] [CrossRef]
  34. Neves, P.R.D.S.; Tenório, T.R.D.S.; Lins, T.A.; Muniz, M.T.C.; Pithon-Curi, T.C.; Botero, J.P.; Prado, W.L.D. Acute effects of high- and low-intensity exercise bouts on leukocyte counts. J. Exerc. Sci. Fit. 2015, 13, 24–28. [Google Scholar] [CrossRef]
  35. Bessa, A.L.; Oliveira, V.N.; Agostini, G.G.; Oliveira, R.J.; Oliveira, A.C.; White, G.E.; Wells, G.D.; Teixeira, D.N.; Espindola, F.S. Exercise Intensity and Recovery. J. Strength Cond. Res. 2016, 30, 311–319. [Google Scholar] [CrossRef]
  36. Luk, H.-Y.; McKenzie, A.L.; Duplanty, A.A.; Budnar, R.G.; Levitt, D.; Fernandez, A.; Lee, E.C.; Armstrong, L.E.; Vingren, J.L. Leukocyte Subset Changes in Response to a 164-km Road Cycle Ride in a Hot Environment. Int. J. Exerc. Sci. 2016, 9, 34–46. [Google Scholar]
  37. Suzuki, K.; Nakaji, S.; Yamada, M.; Liu, Q.; Kurakake, S.; Okamura, N.; Kumae, T.; Umeda, T.; Sugawara, K. Impact of a Competitive Marathon Race on Systemic Cytokine and Neutrophil Responses. Med. Sci. Sports Exerc. 2003, 35, 348–355. [Google Scholar] [CrossRef] [PubMed]
  38. A Cooper, M.; A Fehniger, T.; A Caligiuri, M. The biology of human natural killer-cell subsets. Trends Immunol. 2001, 22, 633–640. [Google Scholar] [CrossRef]
  39. Timmons, B.W.; Tarnopolsky, M.A.; Bar-Or, O.; Radom-Aizik, S.; Zaldivar, F.; Haddad, F.; Cooper, D.M.; Riddell, M.C.; Devries, M.C.; Hamadeh, M.J.; et al. Sex-based effects on the distribution of NK cell subsets in response to exercise and carbohydrate intake in adolescents. J. Appl. Physiol. 2006, 100, 1513–1519. [Google Scholar] [CrossRef] [PubMed]
  40. Timmons, B.W.; Bar-Or, O. Evidence of sex-based differences in natural killer cell responses to exercise and carbohydrate intake in children. Eur. J. Appl. Physiol. 2007, 101, 233–240. [Google Scholar] [CrossRef] [PubMed]
  41. Kakanis, M.W.; Peake, J.; Brenu, E.W.; Simmonds, M.; Gray, B.; Hooper, S.L.; Marshall-Gradisnik, S.M. The open window of susceptibility to infection after acute exercise in healthy young male elite athletes. Exerc. Immunol. Rev. 2010, 16, 119–137. [Google Scholar] [CrossRef]
  42. Pedersen, B.K.; Febbraio, M.A. Muscle as an Endocrine Organ: Focus on Muscle-Derived Interleukin-6. Physiol. Rev. 2008, 88, 1379–1406. [Google Scholar] [CrossRef]
  43. Suzuki, K.; Peake, J.; Nosaka, K.; Okutsu, M.; Abbiss, C.R.; Surriano, R.; Bishop, D.; Quod, M.J.; Lee, H.; Martin, D.T.; et al. Changes in markers of muscle damage, inflammation and HSP70 after an Ironman triathlon race. Eur. J. Appl. Physiol. 2006, 98, 525–534. [Google Scholar] [CrossRef]
  44. Kim, H.-K.; Konishi, M.; Takahashi, M.; Tabata, H.; Endo, N.; Numao, S.; Lee, S.-K.; Kim, Y.-H.; Suzuki, K.; Sakamoto, S. Effects of Acute Endurance Exercise Performed in the Morning and Evening on Inflammatory Cytokine and Metabolic Hormone Responses. PLoS ONE 2015, 10, e0137567. [Google Scholar] [CrossRef]
  45. Campbell, J.P.; Turner, J.E. Debunking the Myth of Exercise-Induced Immune Suppression: Redefining the Impact of Exercise on Immunological Health Across the Lifespan. Front. Immunol. 2018, 9, 648. [Google Scholar] [CrossRef]
  46. Farrell, P.A.; Garthwaite, T.L.; Gustafson, A.B. Plasma adrenocorticotropin and cortisol responses to submaximal and exhaustive exercise. J. Appl. Physiol. Respir. Environ. Exerc. Physiol. 1983, 55, 1441–1444. [Google Scholar] [CrossRef]
  47. Dearman, J.; Francis, K.T. Plasma levels of catecholamines, cortisol, and beta-endorphins in male athletes after running 26.2, 6, and 2 miles. J. Sports Med. Phys. Fitness 1983, 23, 30–38. [Google Scholar]
  48. Steensberg, A. The role of IL-6 in exercise-induced immune changes and metabolism. Exerc. Immunol. Rev. 2003, 9, 40–47. [Google Scholar] [PubMed]
  49. McCarthy, D.A.; Dale, M.M. The leucocytosis of exercise. A review and model. Sports Med. 1988, 6, 333–363. [Google Scholar] [CrossRef] [PubMed]
  50. Shin, Y.O.; Lee, J.B. Leukocyte chemotactic cytokine and leukocyte subset responses during ultra-marathon running. Cytokine 2013, 61, 364–369. [Google Scholar] [CrossRef] [PubMed]
  51. Nieman, D.C.; Dumke, C.L.; Henson, D.A.; McAnulty, S.R.; Gross, S.J.; Lind, R.H. Muscle damage is linked to cytokine changes following a 160-km race. Brain Behav. Immun. 2005, 19, 398–403. [Google Scholar] [CrossRef] [PubMed]
  52. Raschke, S.; Eckel, J. Adipo-Myokines: Two Sides of the Same Coin—Mediators of Inflammation and Mediators of Exercise. Mediat. Inflamm. 2013, 2013, 1–16. [Google Scholar] [CrossRef] [PubMed]
  53. Windsor, M.T.; Bailey, T.G.; Perissiou, M.; Meital, L.; Golledge, J.; Russell, F.D.; Askew, C.D. Cytokine Responses to Acute Exercise in Healthy Older Adults: The Effect of Cardiorespiratory Fitness. Front. Physiol. 2018, 9, 203. [Google Scholar] [CrossRef] [PubMed]
  54. Van Craenenbroeck, A.H.; Van Ackeren, K.; Hoymans, V.Y.; Roeykens, J.; Verpooten, G.A.; Vrints, C.J.; Couttenye, M.M.; Van Craenenbroeck, E.M. Acute Exercise-Induced Response of Monocyte Subtypes in Chronic Heart and Renal Failure. Mediat. Inflamm. 2014, 2014, 1–11. [Google Scholar] [CrossRef]
Figure 1. Schematic overview of the experimental protocols and the time points at which the blood samples were obtained. (A). An example of the exercise schedule for one subject. Each subject started with the rest protocol (P1) without exercise. Subsequently, they underwent four different exercise interventions (P2–P5), which were randomly assigned. The 70%-of-Wmax interventions in hydrated and dehydrated conditions were always performed in sequence. The washout period between protocols was 1 week. (B). Blood samples were taken before, during, immediately at the end of, and at several time points after the rest or exercise for up to 24 h.
Immuno 04 00003 g001
Figure 2. The kinetic changes in leukocyte subsets and thrombocyte counts (in counts/nL) at multiple time points during and after both rest and 1 h cycling (T0–T1) at varying intensities are depicted in the colored line graphs. The individual subsets are shown in the panel figures: lymphocytes (A), monocytes (B), neutrophils (C), eosinophils (D), basophils (E), and thrombocytes (F).
Immuno 04 00003 g002
Figure 3. NK cells were identified using flow cytometry based on the relative expression of CD16 and CD56. Lymphocytes were selected in the forward–side scatter plot. A gate was applied to CD3-negative cells in the side scatter plot, and NK cells were identified as cells with the phenotype CD3CD16+CD56 (A). Kinetic changes in the NK cell subsets CD16dim CD56bright, CD16brightCD56bright, and CD16bright CD56dim, presented as percentages of the total NK cell population. Time points are denoted in hours: T0–T1 (from the beginning to the end of exercise) and T2–T3 (1 to 2 h post-exercise) (B).
Immuno 04 00003 g003
Figure 4. Kinetic changes in serum levels of the cytokines MCP-1 (A), IP-10 (B), and TNF-α (C) during and at various time points after exercise or rest.
Immuno 04 00003 g004
Table 1. Experimental protocols with corresponding protocol number and exercise intensity.
ProtocolP1P2P3P4P5
Experimental conditionRest condition without exercise1 h of cycling
at 70% of Wmax
1 h of cycling at 70% of Wmax in dehydrated condition1 h of cycling
at 50% of Wmax
1 h of cycling
in blocks of 2 min at 55/85% of Wmax
Table 2. The mean values with SD are presented here for the age, anthropometric measurements (body mass index (BMI), weight, length), and fitness characteristics (maximal oxygen consumption (VO2max), maximal work capacity (Wmax)) of all the volunteers.
VariablesMean ± SD
Age (yrs)24.3 ± 2.4
BMI (kg/m2)22.5 ± 1.5
Weight (kg)75.8 ± 6.7
Length (cm)183.4 ± 3.8
VO2max (mL/kg/min)56.9 ± 3.9
Wmax (W)335.1 ± 39.9
Table 3. Leukocyte counts per nanoliter (nL) were measured at various time points (T) under resting conditions (P1) and during exercise at different intensities: P2 = 70% of Wmax, P3 = 70% of Wmax in a dehydrated state, P4 = 50% of Wmax, and P5 = 55/85% of Wmax. The numbers for the initial peak at T0.5 and the second peak at T3, where the maximum levels were observed, are presented in bold for the high-intensity exercise protocols and in bold italics for the low-intensity exercise protocol. This table provides additional data compared to a previous study [26].
ProtocolT0T0.5T1T1.5T2T3T6T24
P15.3 ± 0.845.1 ± 0.805.5 ± 1.135.8 ± 1.076.0 ± 1.196.0 ± 1.216.2 ± 1.145.2 ± 0.90
P25.0 ± 1.029.3 ± 2.09.6 ± 2.217.2 ± 2.059.0 ± 2.2711.4 ± 2.239.3 ± 1.884.8 ± 1.14
P35.0 ± 1.029.3 ± 1.699.2 ± 1.997.4 ± 1.899.6 ± 2.6011.3 ± 2.449.0 ± 1.765.0 ± 0.96
P44.8 ± 0.767.4 ± 1.027.8 ± 1.365.5 ± 0.876.4 ± 1.127.5 ± 1.406.8 ± 1.354.8 ± 1.12
P54.7 ± 0.659.4 ± 1.409.4 ± 1.487.2 ± 3.429.9 ± 4.312.0 ± 3.069.8 ± 2.204.9 ± 0.91
Disclaimer/Publisher’s Note: The statements, opinions and data contained in all publications are solely those of the individual author(s) and contributor(s) and not of MDPI and/or the editor(s). MDPI and/or the editor(s) disclaim responsibility for any injury to people or property resulting from any ideas, methods, instructions or products referred to in the content.

