Article

Increased COVID-19 Mortality and Deficient SARS-CoV-2 Immune Response Are Not Associated with Higher Levels of Endemic Coronavirus Antibodies

1
Department of Veterinary Preventive Medicine, College of Veterinary Medicine, The Ohio State University, Wooster, OH 44691, USA
2
Center for Food Animal Health, Department of Animal Sciences, OARDC, College of Food, Agricultural and Environmental Sciences, The Ohio State University, Wooster, OH 44691, USA
3
Department of Microbial Infection and Immunity, The Ohio State University, Columbus, OH 43210, USA
4
Department of Internal Medicine, Division of Pulmonary, Critical Care, and Sleep Medicine, The Ohio State University, Columbus, OH 43210, USA
5
Department of Biomedical Informatics, College of Medicine and Center for Biostatistics, The Ohio State University, Columbus, OH 43210, USA
6
Center for Retrovirus Research, The Ohio State University, Columbus, OH 43210, USA
7
Department of Veterinary Biosciences, The Ohio State University, Columbus, OH 43210, USA
8
Viruses and Emerging Pathogens Program, Infectious Diseases Institute, The Ohio State University, Columbus, OH 43210, USA
9
Division of Medical Oncology, Department of Internal Medicine, The Ohio State University, Columbus, OH 43210, USA
10
The Pelotonia Institute of Immuno-Oncology, The Ohio State University James Comprehensive Cancer Center, Columbus, OH 43210, USA
11
Department of Pathology, The Ohio State University, Columbus, OH 43210, USA
*
Author to whom correspondence should be addressed.
Immuno 2023, 3(3), 330-345; https://doi.org/10.3390/immuno3030020
Submission received: 27 July 2023 / Revised: 10 August 2023 / Accepted: 31 August 2023 / Published: 4 September 2023

Abstract

:
The impact of pre-existing common cold coronavirus (CCCoV) antibodies (Abs) on severe acute respiratory syndrome coronavirus 2 (SARS-CoV-2) immune responses and pathogenesis remains poorly defined. We evaluated these associations in a cohort of hospitalized patients with COVID-19 and respiratory failure of varying severity. Patients with respiratory failure from other causes (non-COVID-19) were evaluated as controls. We demonstrated a positive correlation between levels of CCCoV and SARS-CoV-2 Abs using CCCoV and SARS-CoV-2 N and S protein peptide-specific ELISA. Consistent with the above, moderately increased levels of CCCoV-specific Abs in non-COVID-19 vs. COVID-19 patients suggest potential protective effects. Further, higher SARS-CoV-2 N protein-specific and CCCoV Ab levels were observed among surviving vs. non-surviving COVID-19 positive patients. However, the highest SARS-CoV-2 N and S protein-specific IgG and IgA Ab levels were noted in the patients with the most severe clinical disease. Finally, advanced age, cancer and immunosuppression were associated with significantly higher mortality and reduced SARS-CoV-2 and CCCoV Ab levels. Thus, our data highlight that sufficient SARS-CoV-2 N protein-specific Ab responses improve clinical outcomes in severely ill COVID-19 patients. We also confirmed that pre-existing CCCoV-specific Abs do not inhibit the SARS-CoV-2 Ab response and may further reduce the prevalence and/or severity of COVID-19.

1. Introduction

Severe acute respiratory syndrome coronavirus (SARS-CoV) 2 (SARS-CoV-2) has infected hundreds of millions of people and claimed the lives of nearly 7 million individuals as of July 2023. Along with four other human coronaviruses (HCoVs) [OC43, HKU1, SARS-CoV and Middle East respiratory syndrome CoV (MERS-CoV)], SARS-CoV-2 belongs to the Betacoronavirus genus, family Coronaviridae [1], while HCoVs 229E and NL63 belong to the Alphacoronavirus genus. SARS-CoV, MERS-CoV and SARS-CoV-2 are known to cause severe acute respiratory symptoms, while HCoVs 229E, NL63, OC43 and HKU1 are associated with mild respiratory symptoms and are referred to as endemic or common cold CoVs (CCCoVs) [2,3].
Studies evaluating the characteristics of SARS-CoV-2 immune response and the influence of pre-existing Abs against CCCoVs [4,5,6,7,8] yielded inconsistent results, providing conflicting evidence for a protective vs. a detrimental role for CCCoV immunity in Coronavirus disease 2019 (COVID-19) pathogenesis and immune responses [7,8,9,10,11]. These inconsistencies may be associated with multiple confounding factors, including age, sex, exposure dose, lifestyle/occupational risks, comorbidities and CCCoV Ab characteristics and levels. Thus, it remains unclear whether the ‘original antigenic sin’ plays a role in the generation of an inadequate immune response to SARS-CoV-2, in which the infection is not controlled efficiently due to diversion of the immune response associated with prior exposures to CCCoVs and ultimately results in the development of severe COVID-19 [12]. Consequently, the amino acid (aa) identity shared between SARS-CoV-2 and CCCoV N and S proteins reaches 18–29% resulting in variable levels of serological cross-reactivity between these HCoVs, which may lead to a range of clinical and immunological outcomes.
To test whether pre-existing CCCoV immunity can alleviate or aggravate COVID-19 severity and alter SARS-CoV-2-specific Ab responses, we analyzed the association between different Ab isotypes targeting SARS-CoV-2 and CCCoV nucleocapsid (N) and spike (S) proteins and the prevalence, dynamics and severity of COVID-19 in a hospitalized cohort. Our analysis was further stratified based on the patient’s age, sex, comorbidity status and SARS-CoV-2 Ab response dynamics as well as the disease outcome.

2. Materials and Methods

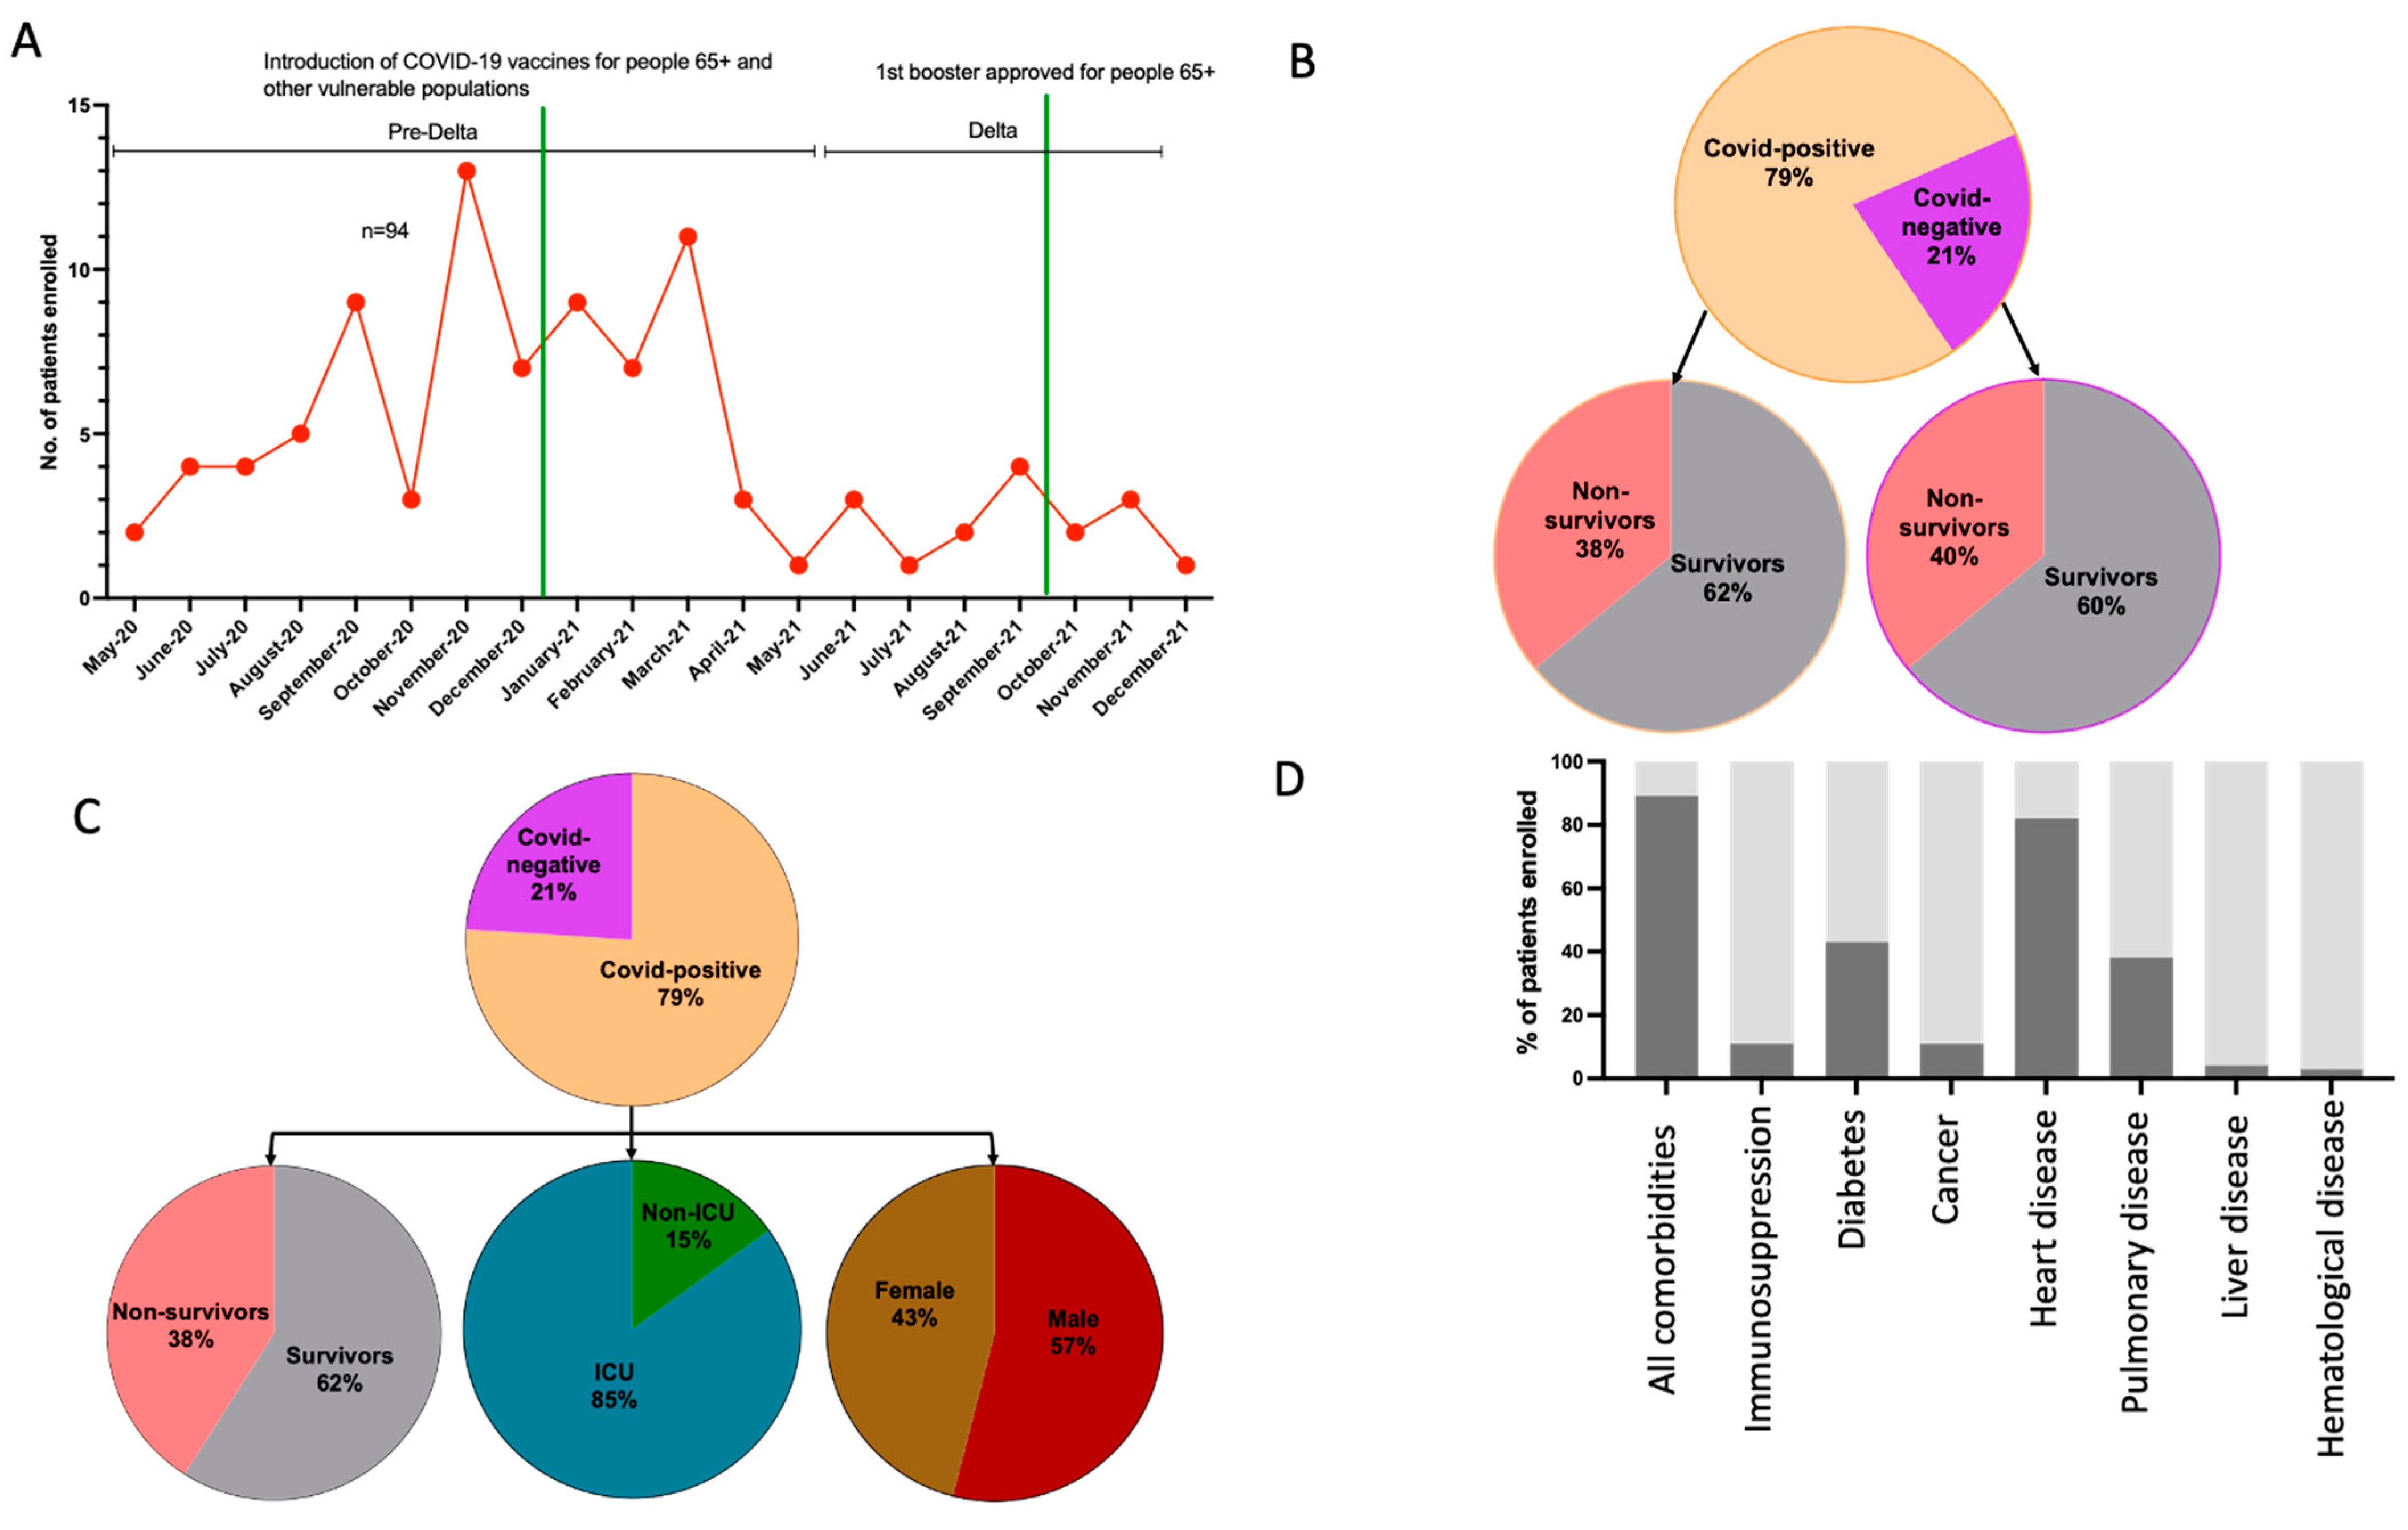
2.1. Study Population

We obtained banked plasma samples from the Ohio State University Intensive Care Unit Registry (BuckICU) collected from individuals admitted to the Ohio State University (OSU) hospitals from May 2020 to December 2021. This biorepository collects longitudinal biospecimens and associated clinical data from hospitalized patients tested positive for COVID-19 (by RT-PCR) and non-COVID-19 respiratory failure of varying severity. Notably, the cohort is enriched for critically ill patients admitted to the Intensive Care Unit (ICU), and the impact of CCCoV Abs on COVID-19 pathogenesis and immunity has not been evaluated previously in this population. The series included consecutive, randomly sampled adult (>18 years) inpatients of both sexes (not vaccinated against COVID-19), with COVID-19 and respiratory failure, defined as any increase in supplemental oxygen and/or use of non-invasive or invasive mechanical ventilation above baseline, and non-COVID-19 patients with respiratory failure were used as the control population. All patients were tested for COVID-19 and had blood drawn at the hospital admission. The three severity groups were defined as follows: (S1) hospitalized patients not admitted to the ICU, (S2) ICU patients without invasive respiratory support and (S3) critically ill COVID-19 patients that required invasive ventilator support. After obtaining informed consent, peripheral blood samples were collected at admission (week 1, W1) in sodium citrate vacutainer tubes (BD biosciences) by trained clinical staff. Whenever possible, two more blood samples were obtained in weeks 2 (W2) and 3 (W3). Blood tubes were centrifuged at 1800× g for 15 min, at room temperature, and plasma was collected, aliquoted and stored at –80 °C for later analysis. Demographic (age, sex, comorbidity type) and clinical (SARS-CoV-2 infection status and disease severity) data were collected from the electronic medical record system for each patient. Figure 1A shows the timing of hospital admission and dominant SARS-CoV-2 variant of concern (VOC). A total of 94 patients (Figure 1) were included in the study with 74 (79%, Figure 1B,C) being SARS-CoV-2-infected and 20 (21%, Figure 1B,C) non-infected or non-COVID (NC).

2.2. CCCoV- and SARS-CoV-2 Ab Peptides

We synthesized a series of peptides targeting highly antigenic N and S protein epitopes of SARS-CoV-2 and each CCCoV (NL63-CoV, 229E-CoV, OC43-CoV and HKU1-CoV) (Table 1).
The S and N protein peptides were designed using Peptide Antigen Design Tool (NovoPro) to target highly antigenic regions characterized by low amino acid identity shared between CCCoVs and SARS-CoV-2 to ensure high specificity. Additionally, we designed two peptides that targeted highly conserved regions of the N protein (identified by multiple sequence alignment analysis in Mega X) representing potential targets for cross-reactive Abs induced by CCCoVs (alpha-CCCoVs and beta-CCCoVs). The most antigenic (Table 1) peptides were selected for each CCCoV and SARS-CoV-2 to develop enzyme-linked immunosorbent assays (ELISA). Table 2 lists the reference sera used for peptide characterization/ELISA validation.

2.3. Reference Sera Used for Peptide Characterization Sensitivity and Specificity and ELISA Validation

2.4. ELISA

ELISA was conducted as described elsewhere [13]. Briefly, 96-well plates (Nunc MaxiSorp) were coated with 800 ng/well (determined to be the optimal coating amount) of each peptide in 1× phosphate-buffered saline (PBS) overnight at 4 °C. After rinsing and blocking the plates, plasma dilutions (for CCCoVs, 1:100, and SARS-CoV-2, serial 4-fold dilutions starting at 1:100) were prepared using a 5% NFDM in PBS-T, loaded (50 µL/well) in duplicates and incubated at 37 °C for 45 min. After, the plates were washed 5 times using 0.05% PBS-T. Next, 50 µL of a horse radish peroxidase (HRP)-conjugated goat anti-human Fc cross-absorbed Ab (Table S2) were added at the dilutions recommended by the manufacturer (IgG 1:2000; IgM 1:1000; IgA 1:1000) in 5% NFDM in PBS-T, incubated at 37 °C for 45 min and washed 5 times with 0.05% PBS-T. Then, the plates were developed as described previously [12], and the optical density (OD) values were read at 650 nm using SoftMax Pro 7.1 (Molecular Devices, LLC., San Jose, CA, USA). For SARS-CoV-2-specific ELISAs, the cut-off values were determined as 3 standard deviations above the mean of 4 replicates of the negative control samples.

2.5. Statistical Analysis

Most of the statistical analyses were performed using PRISM 9 (GraphPad). Kaplan Meier survival analysis was conducted using R studio to compare the probability of survival among patients during the study period. Mann–Whitney test was used to compare unpaired values. One-way analysis of variance (ANOVA followed by Kruskal–Wallis post hoc test) was used for multiple-group comparisons. For correlation studies, Pearson’s rank correlation was used. The significance level of 0.05 was used to determine significance; * p < 0.05, ** p < 0.01, *** p < 0.001 and **** p < 0.0001.

3. Results

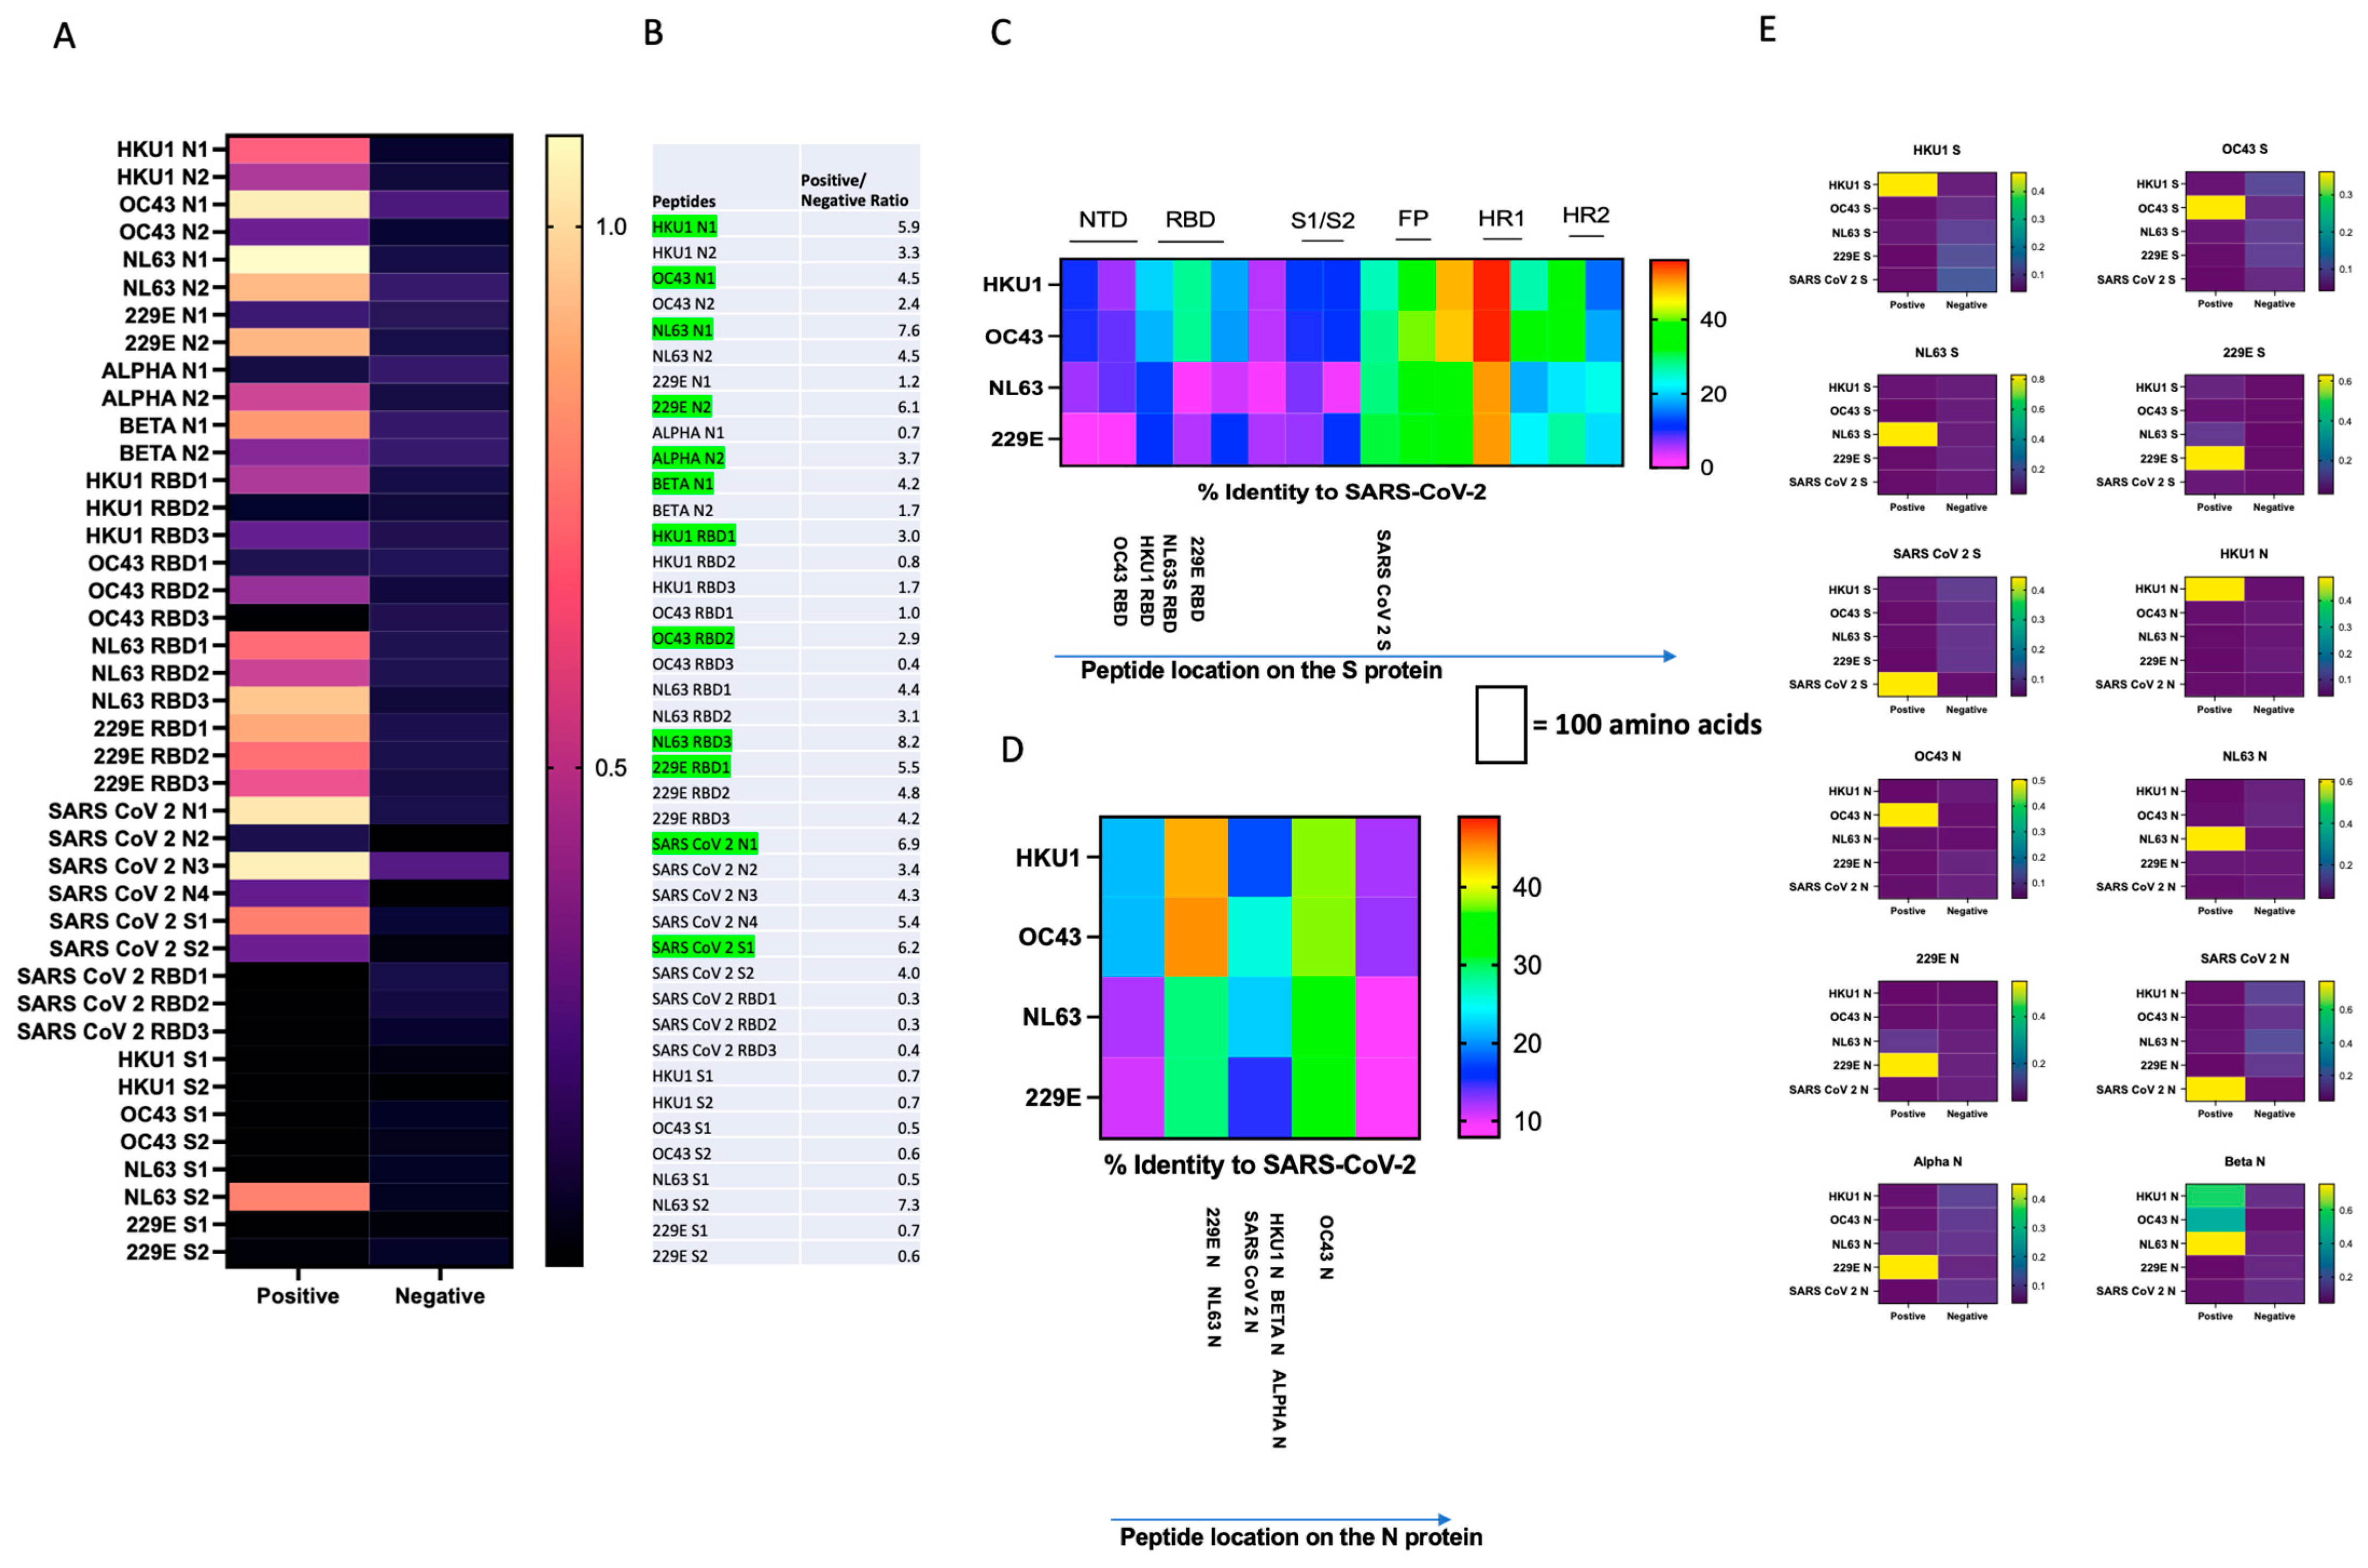
3.1. Design and Characterization of SARS-CoV-2 and CCCoV N and S Protein Peptides and ELISA Development Subsection

Thirty-seven SARS-CoV-2/CCCoV N and S protein-specific peptides with a predicted high antigenic score and a hydrophobicity index ≤ 60% were designed using the NovoPro peptide design tool (Figure 2A). Four additional peptides targeting conserved regions of nucleoprotein, Alpha N and Beta N were designed (Figure 2A). Peptide-coating conditions (optimal coating buffer and peptide concentration) were optimized, and peptide antigenicity was tested. Moreover, 1× PBS was found to be optimal for coating for all peptides, and 800 ng/well was determined to be the optimal coating amount. Twenty-seven peptides were shown to possess satisfactory antigenic characteristics in ELISA with positive-to-negative (P/N) serum (OD) 650 nm (OD650) values > 2 for IgG Abs. Based on the best antigenicity (P/N values = 3–8) (Figure 2B), we selected one S and one N protein-specific peptide for each CCCoV and SARS-CoV-2 that mapped to the S or N protein regions where SARS-CoV-2 and CCCoV share low (for S protein) or low-to-moderate (for N protein) amino-acid sequence identity to develop ELISA and screen clinical samples (Figure 2C,D, Table 1). Of note, the selected SARS-CoV-2 N/S peptides shared 100% aa identity with the different SARS-CoV-2 variants (including alpha, delta, and omicron VOCs) analyzed.
The specificity of these peptides (Table 1) was evaluated using indirect ELISA in which each of the selected peptides was tested with the reference positive and negative sera (Table 2). Our results demonstrated that all virus-specific peptides were recognized by the virus-/antigen-specific sera only, while no cross-reactivity/non-specific reactivity with heterologous or negative sera was observed (Figure 2E). Unexpectedly, Alpha N peptide was only recognized with 229E-specific rabbit antiserum, while Beta N peptide was recognized with NL63-, OC43- and HKU1-specific rabbit antisera (Figure 2E).
We next tested the selected peptides with a panel of SARS-CoV-2 seropositive (31) and seronegative (78) blinded serum samples (n = 109), 7 negative pre-COVID-19 (pre-2019) and 30 SARS-CoV-2 seropositive plasma samples (3 longitudinal samples from 10 COVID-19-positive cases of variable severity) collected in 2020 (Table 2). For the SARS-CoV-2-specific peptides, there was no reactivity with plasma from healthy volunteers collected prior to 2019, while variable levels of SARS-CoV-2-specific IgM/IgA/IgG Abs were detected in the samples from COVID-19-positive individuals (1:100–256,000). Additionally, low but variable levels of CCCoV-specific IgM/IgA/IgG Abs were detected in the pre-COVID-19 and SARS-CoV-2 seropositive samples (OD650 0.03–0.9). The sensitivity and specificity of the SARS-CoV-2 N- and S-specific ELISA are shown in Table 3.
Because reference human serum samples seronegative for CCCoV are not available, we report raw OD650 values for CCCoV Ab levels thereafter, while for SARS-CoV-2 Abs we present both OD650 values (included in all heatmaps together with CCCoV data) and SARS-CoV-2 Ab titers (shown in Supplementary Materials figures).

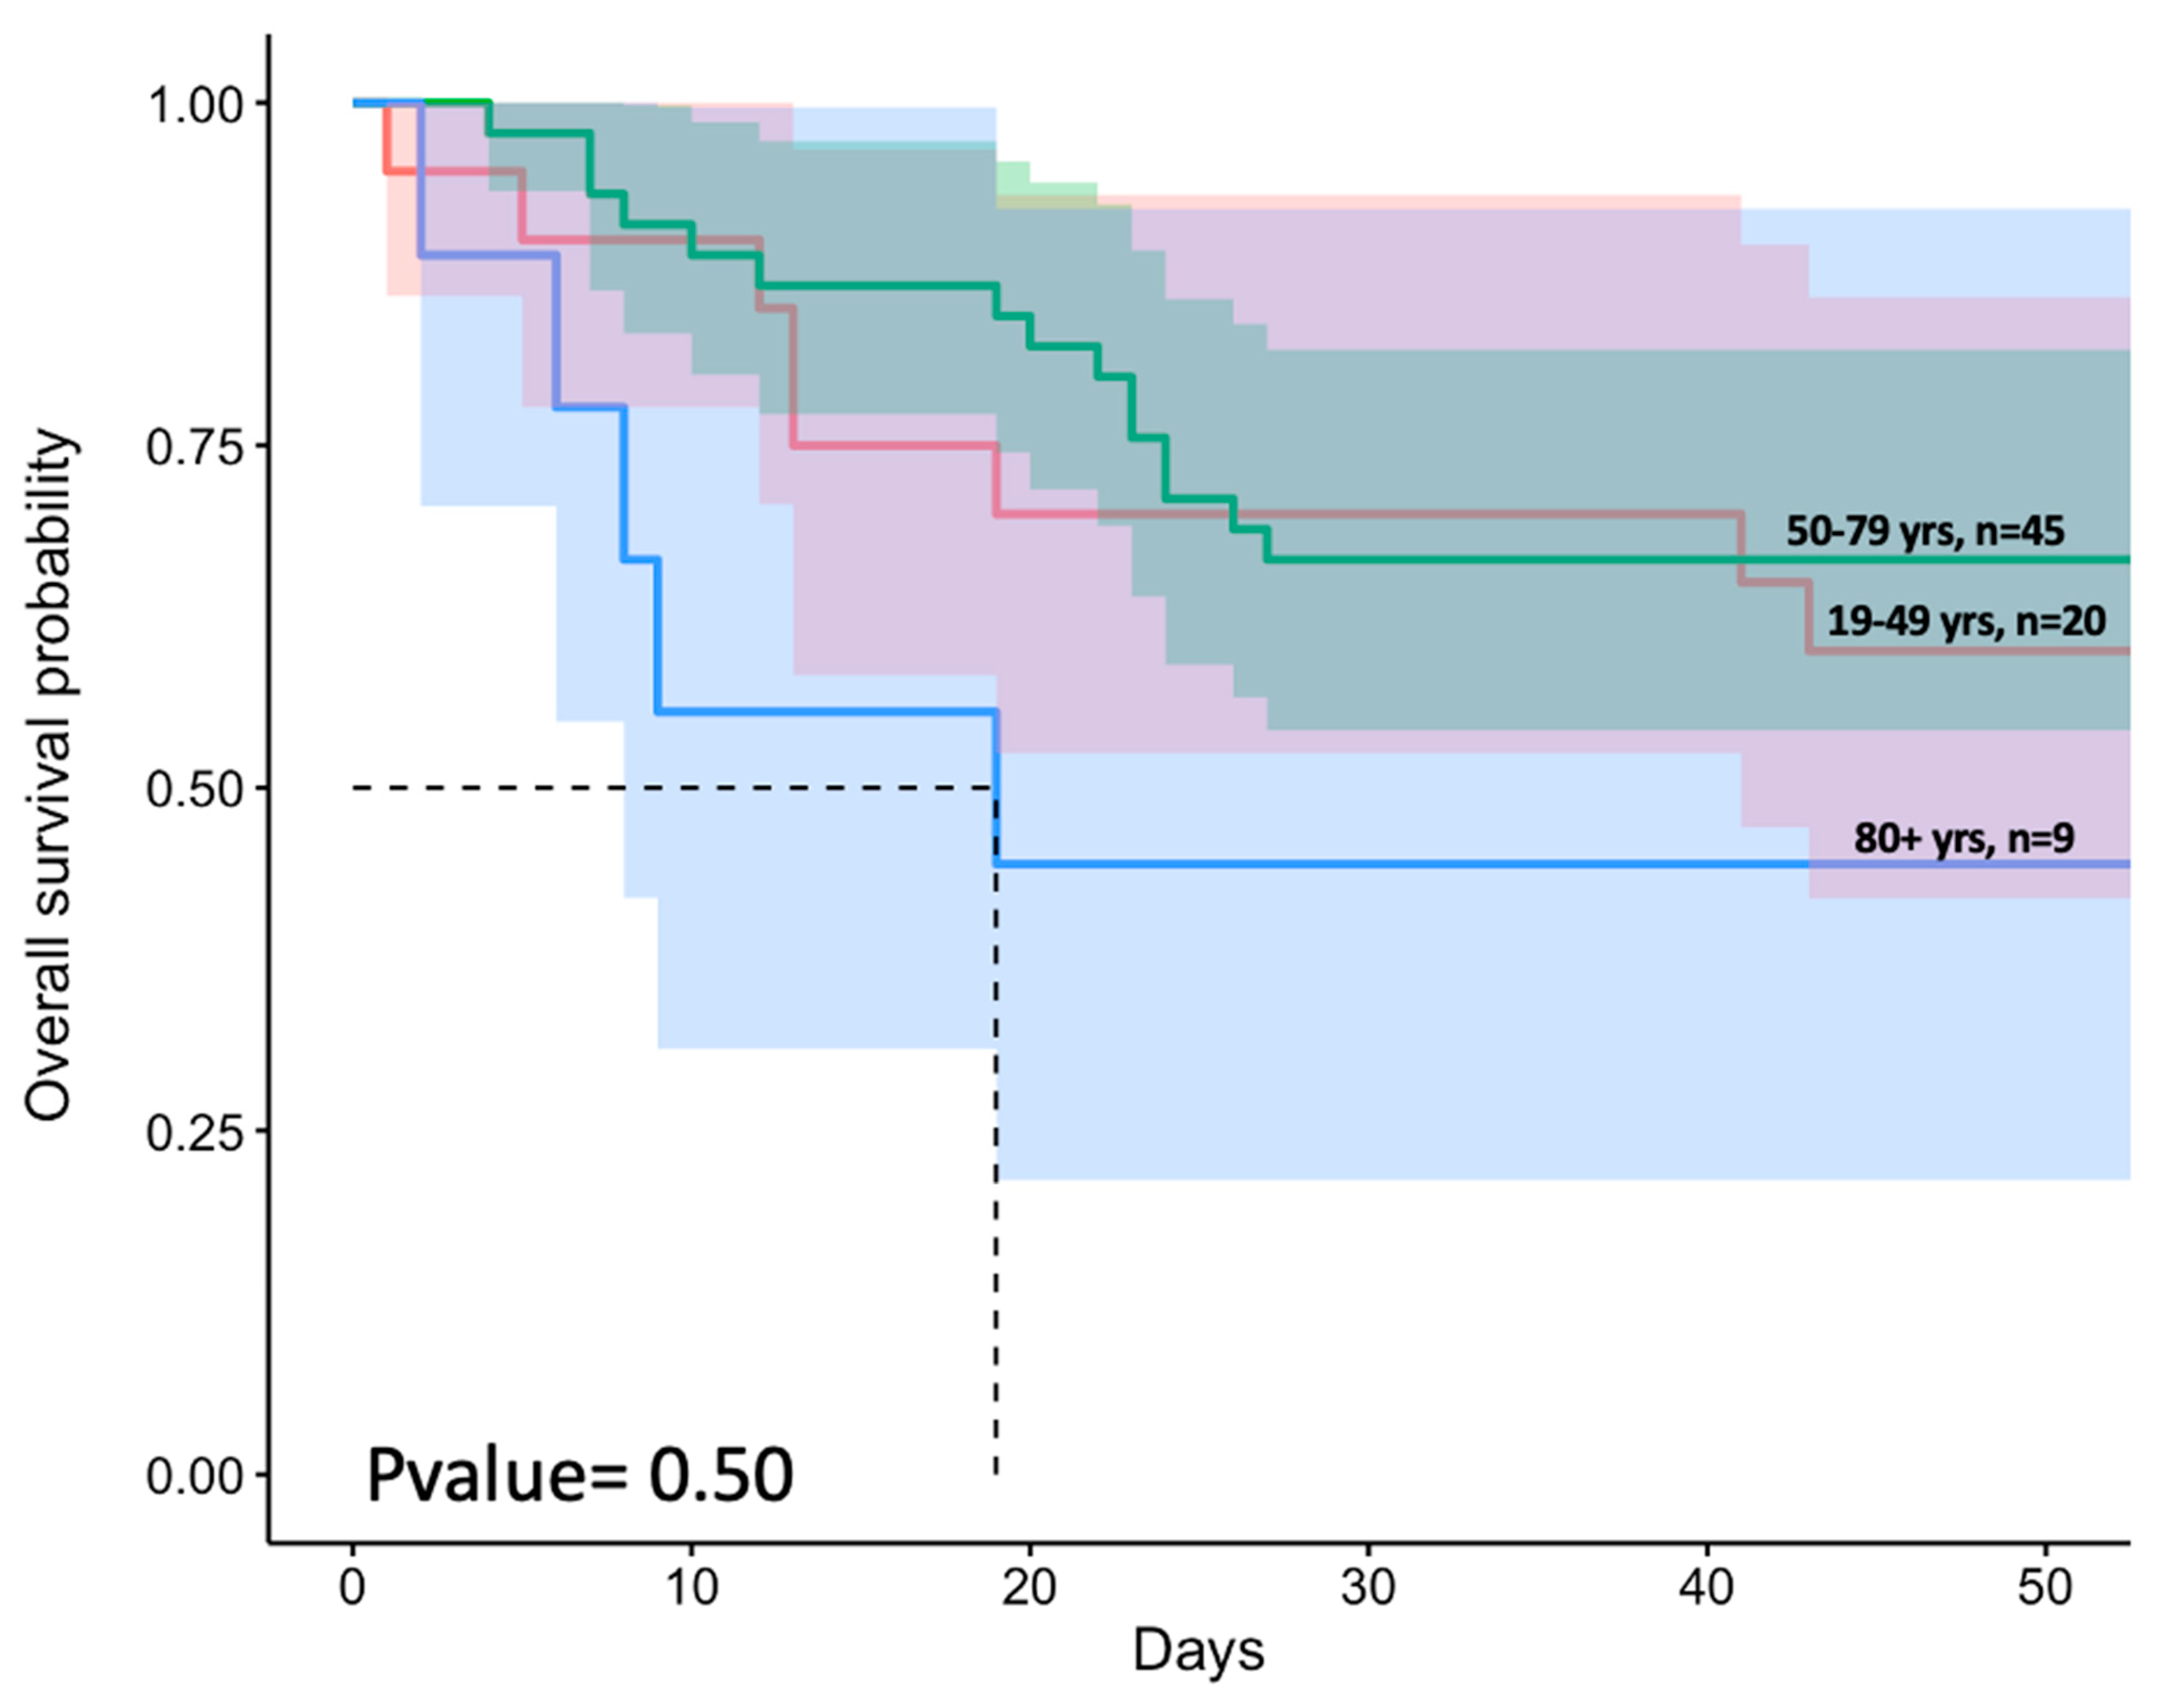
3.2. Advanced Age and Higher Prevalence of Comorbidities Were Associated with Increased Patient Mortality

Of the COVID-19-positive patients, 57% were males, 85% were admitted to the ICU and 38% died (Figure 1C). The cause of death for most deceased COVID-19 positive patients was consistent with COVID-19 (Table S3), and mortality increased progressively with disease severity. So, in the group (S1) with the least severe disease at admission, 1 out of 11 patients (9%) died. In the ICU-admitted but non-intubated inpatients (S2), 2 out of 10 patients (20%) died, while among hospitalized, ICU-admitted and intubated inpatients (S3), 25 out of 53 (47%) died. Patients in our study had high levels of comorbidities, including heart disease (the most prevalent comorbidity found in 83% of the patients), diabetes (43%) and pulmonary disease (38%) (Figure 1D), all previously identified as risk factors for severe COVID-19. Moreover, our analysis demonstrated that advanced age was significantly associated with a higher prevalence of comorbidities (Table 4), and the probability of survival was the lowest among the oldest (80+ years) (Figure 3). Overall, clinical outcomes varied drastically depending on the comorbidity status/type, suggestive of differing mechanisms of the disease pathogenesis or the ability to effectively clear infection associated with various comorbidities (Table 5).

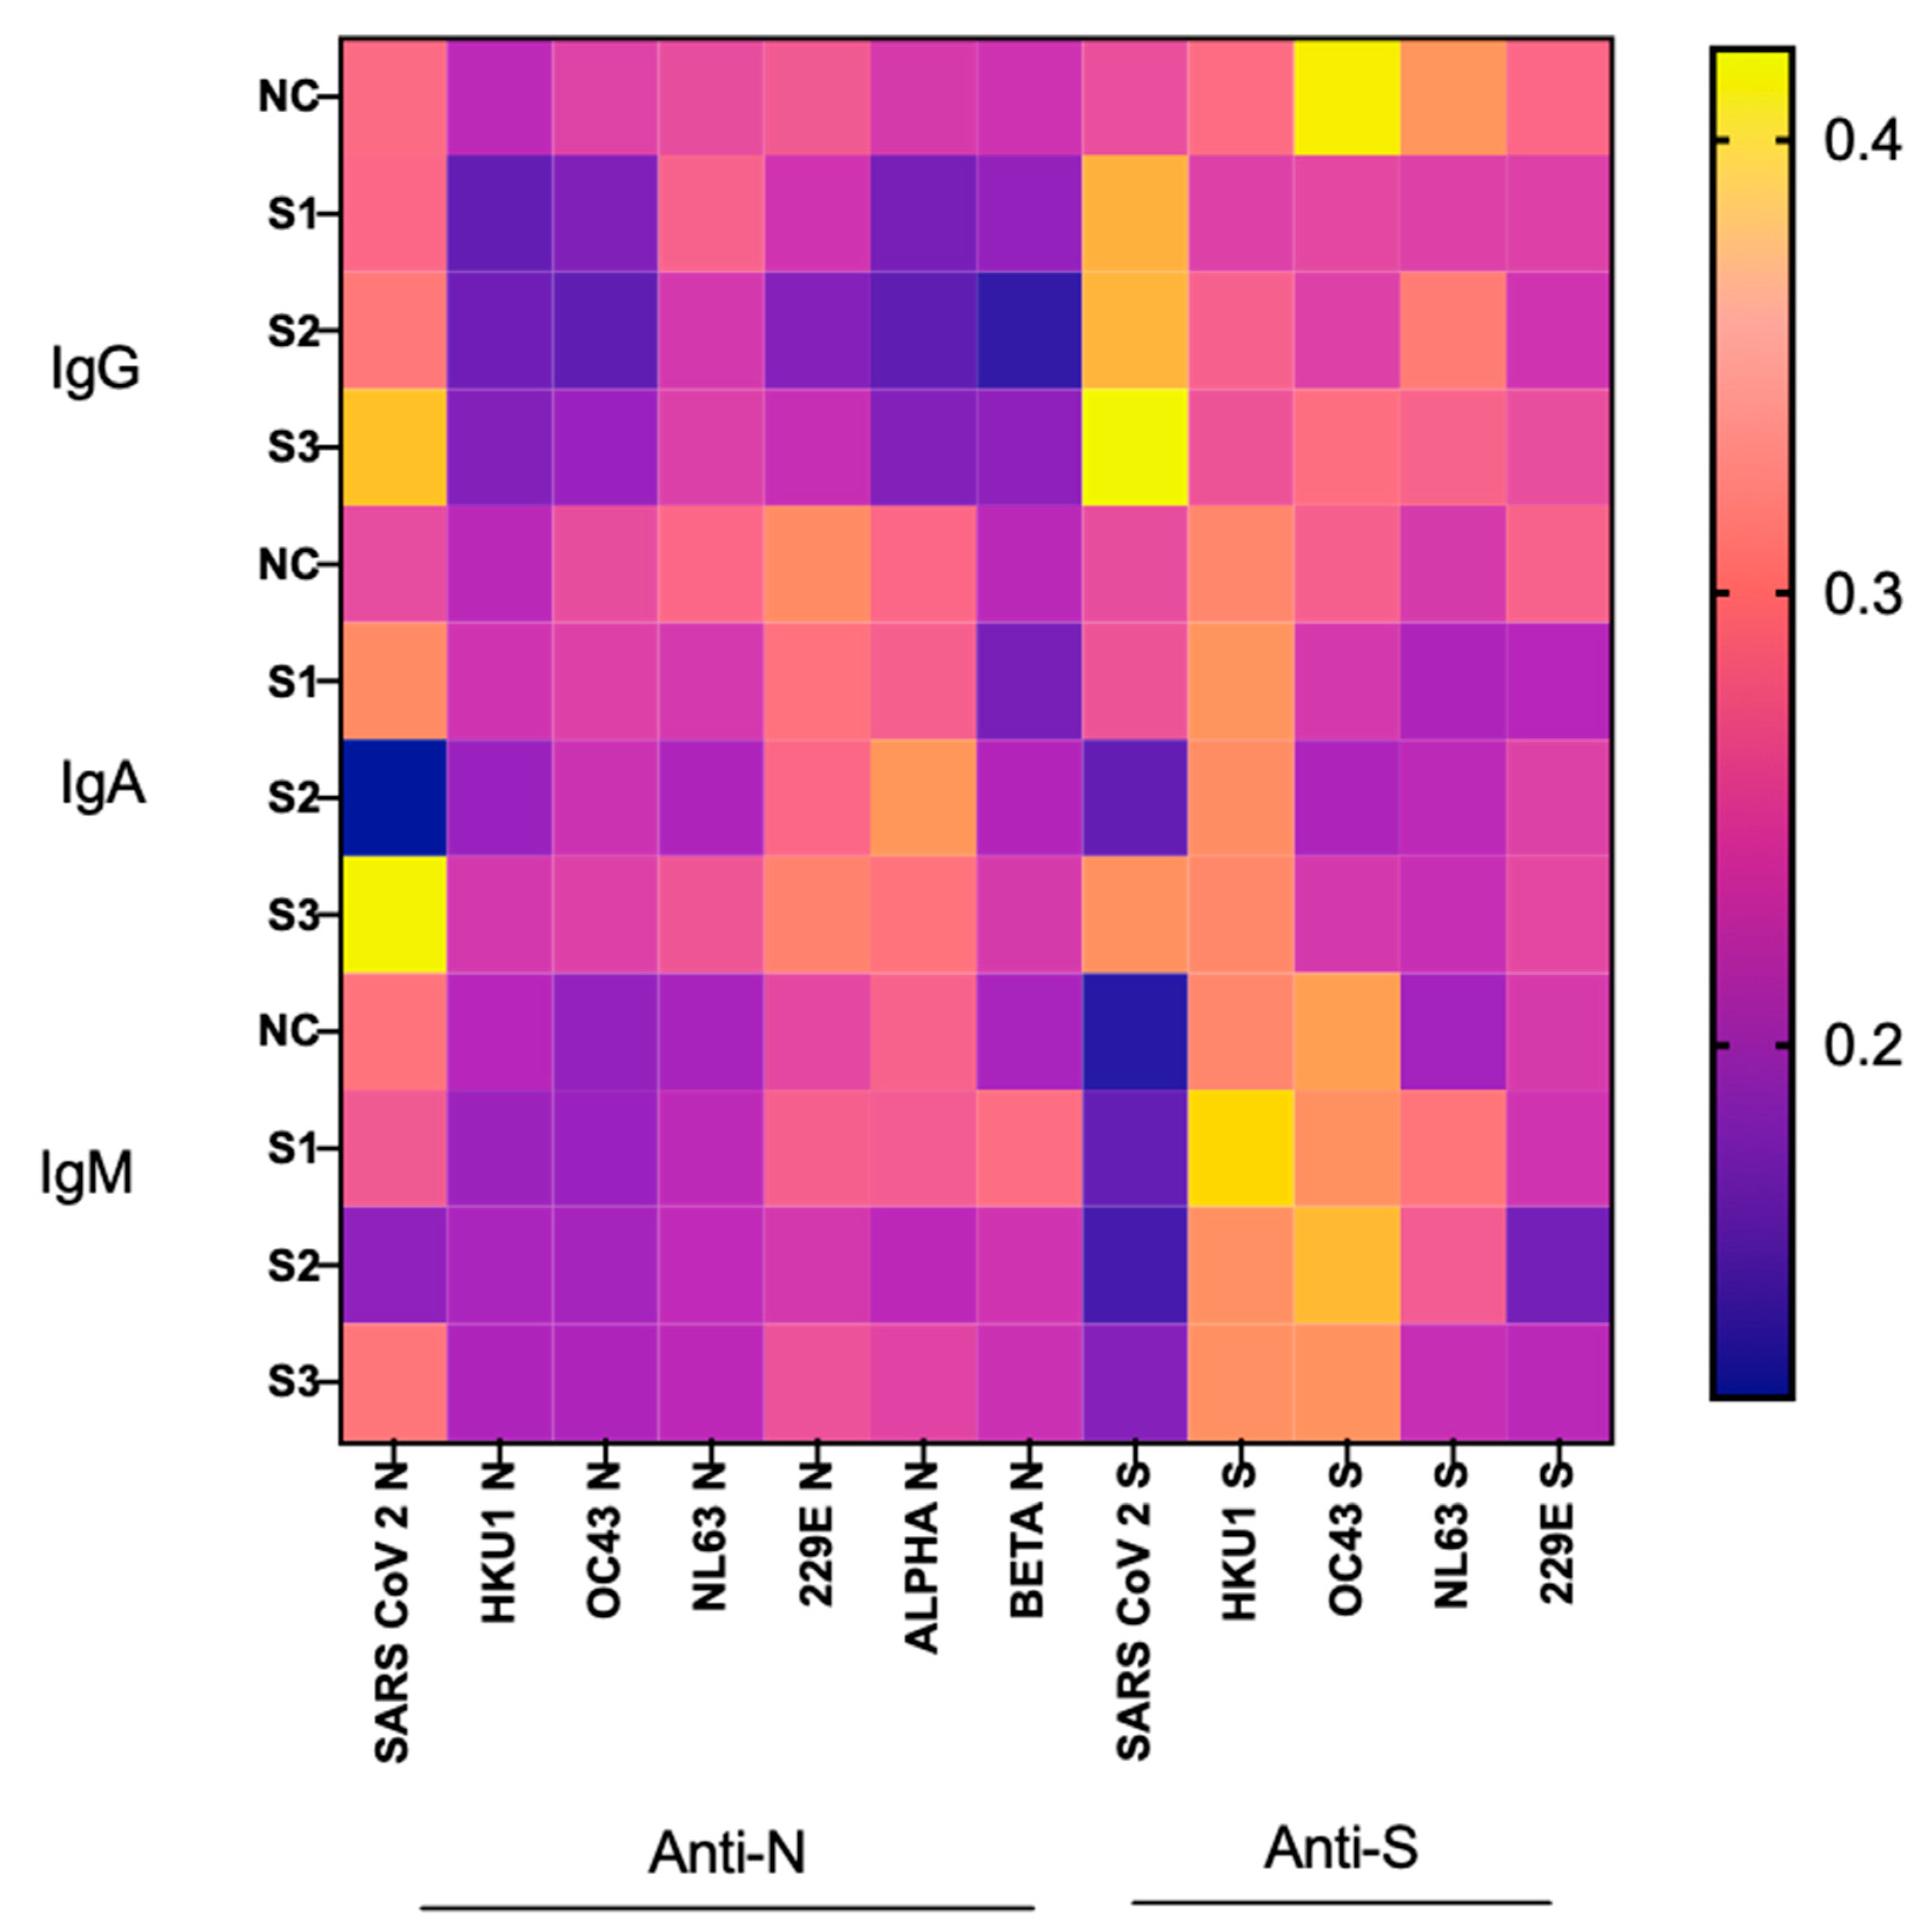
3.3. Correlation between CCCoV- and SARS-CoV-2-Specific Ab Levels and COVID-19 Severity

To identify the role of pre-existing CCCoV Abs in severe COVID-19 pathogenesis and immunity, we analyzed the levels of SARS-CoV-2/CCCoV IgG/IgA/IgM Abs in the plasma samples of the 94 individuals. A comparison of CCCoV- and SARS-CoV-2-specific anti-N/S Ab levels among NC and COVID-19 patients with variable severity (S1, S2 and S3) of clinical disease revealed largely distinct profiles of SARS-CoV-2- vs. CCCoV-specific Abs (Figure 4 and Figure S1 in Supplementary Materials). Consistent with the absence of SARS-CoV-2 infection, NC patients generally had similar and low levels of SARS-CoV-2- and CCCoV-specific Abs (except for high IgG/IgM S Abs to OC43), while COVID-19-positive patients had higher SARS-CoV-2 Ab levels sometimes coinciding with noticeably decreased CCCoV Ab levels (e.g., N protein-specific IgG). This is suggestive of a protective role of pre-existing CCCoV Abs. Further, we demonstrated that SARS-CoV-2 N/S Ab levels correlated significantly (p < 0.05) with the respective levels of CCCoV N and S Abs (Figure S2). SARS-CoV-2 infection induced variable levels of S-/N-specific IgG/IgA/IgM Abs in S1, S2 and S3 patients. Surprisingly, ICU-admitted, non-intubated COVID-19 positive patients (S2) had the lowest SARS-CoV-2 N/S protein-specific IgA and IgM Ab levels, while the highest disease severity (S3) was invariably associated with the highest SARS-CoV-2 IgG/IgA N/S protein-specific Ab levels. Because the remainder of our study is focused on COVID-19 patients, the NC group is not included in the data analyses presented below.

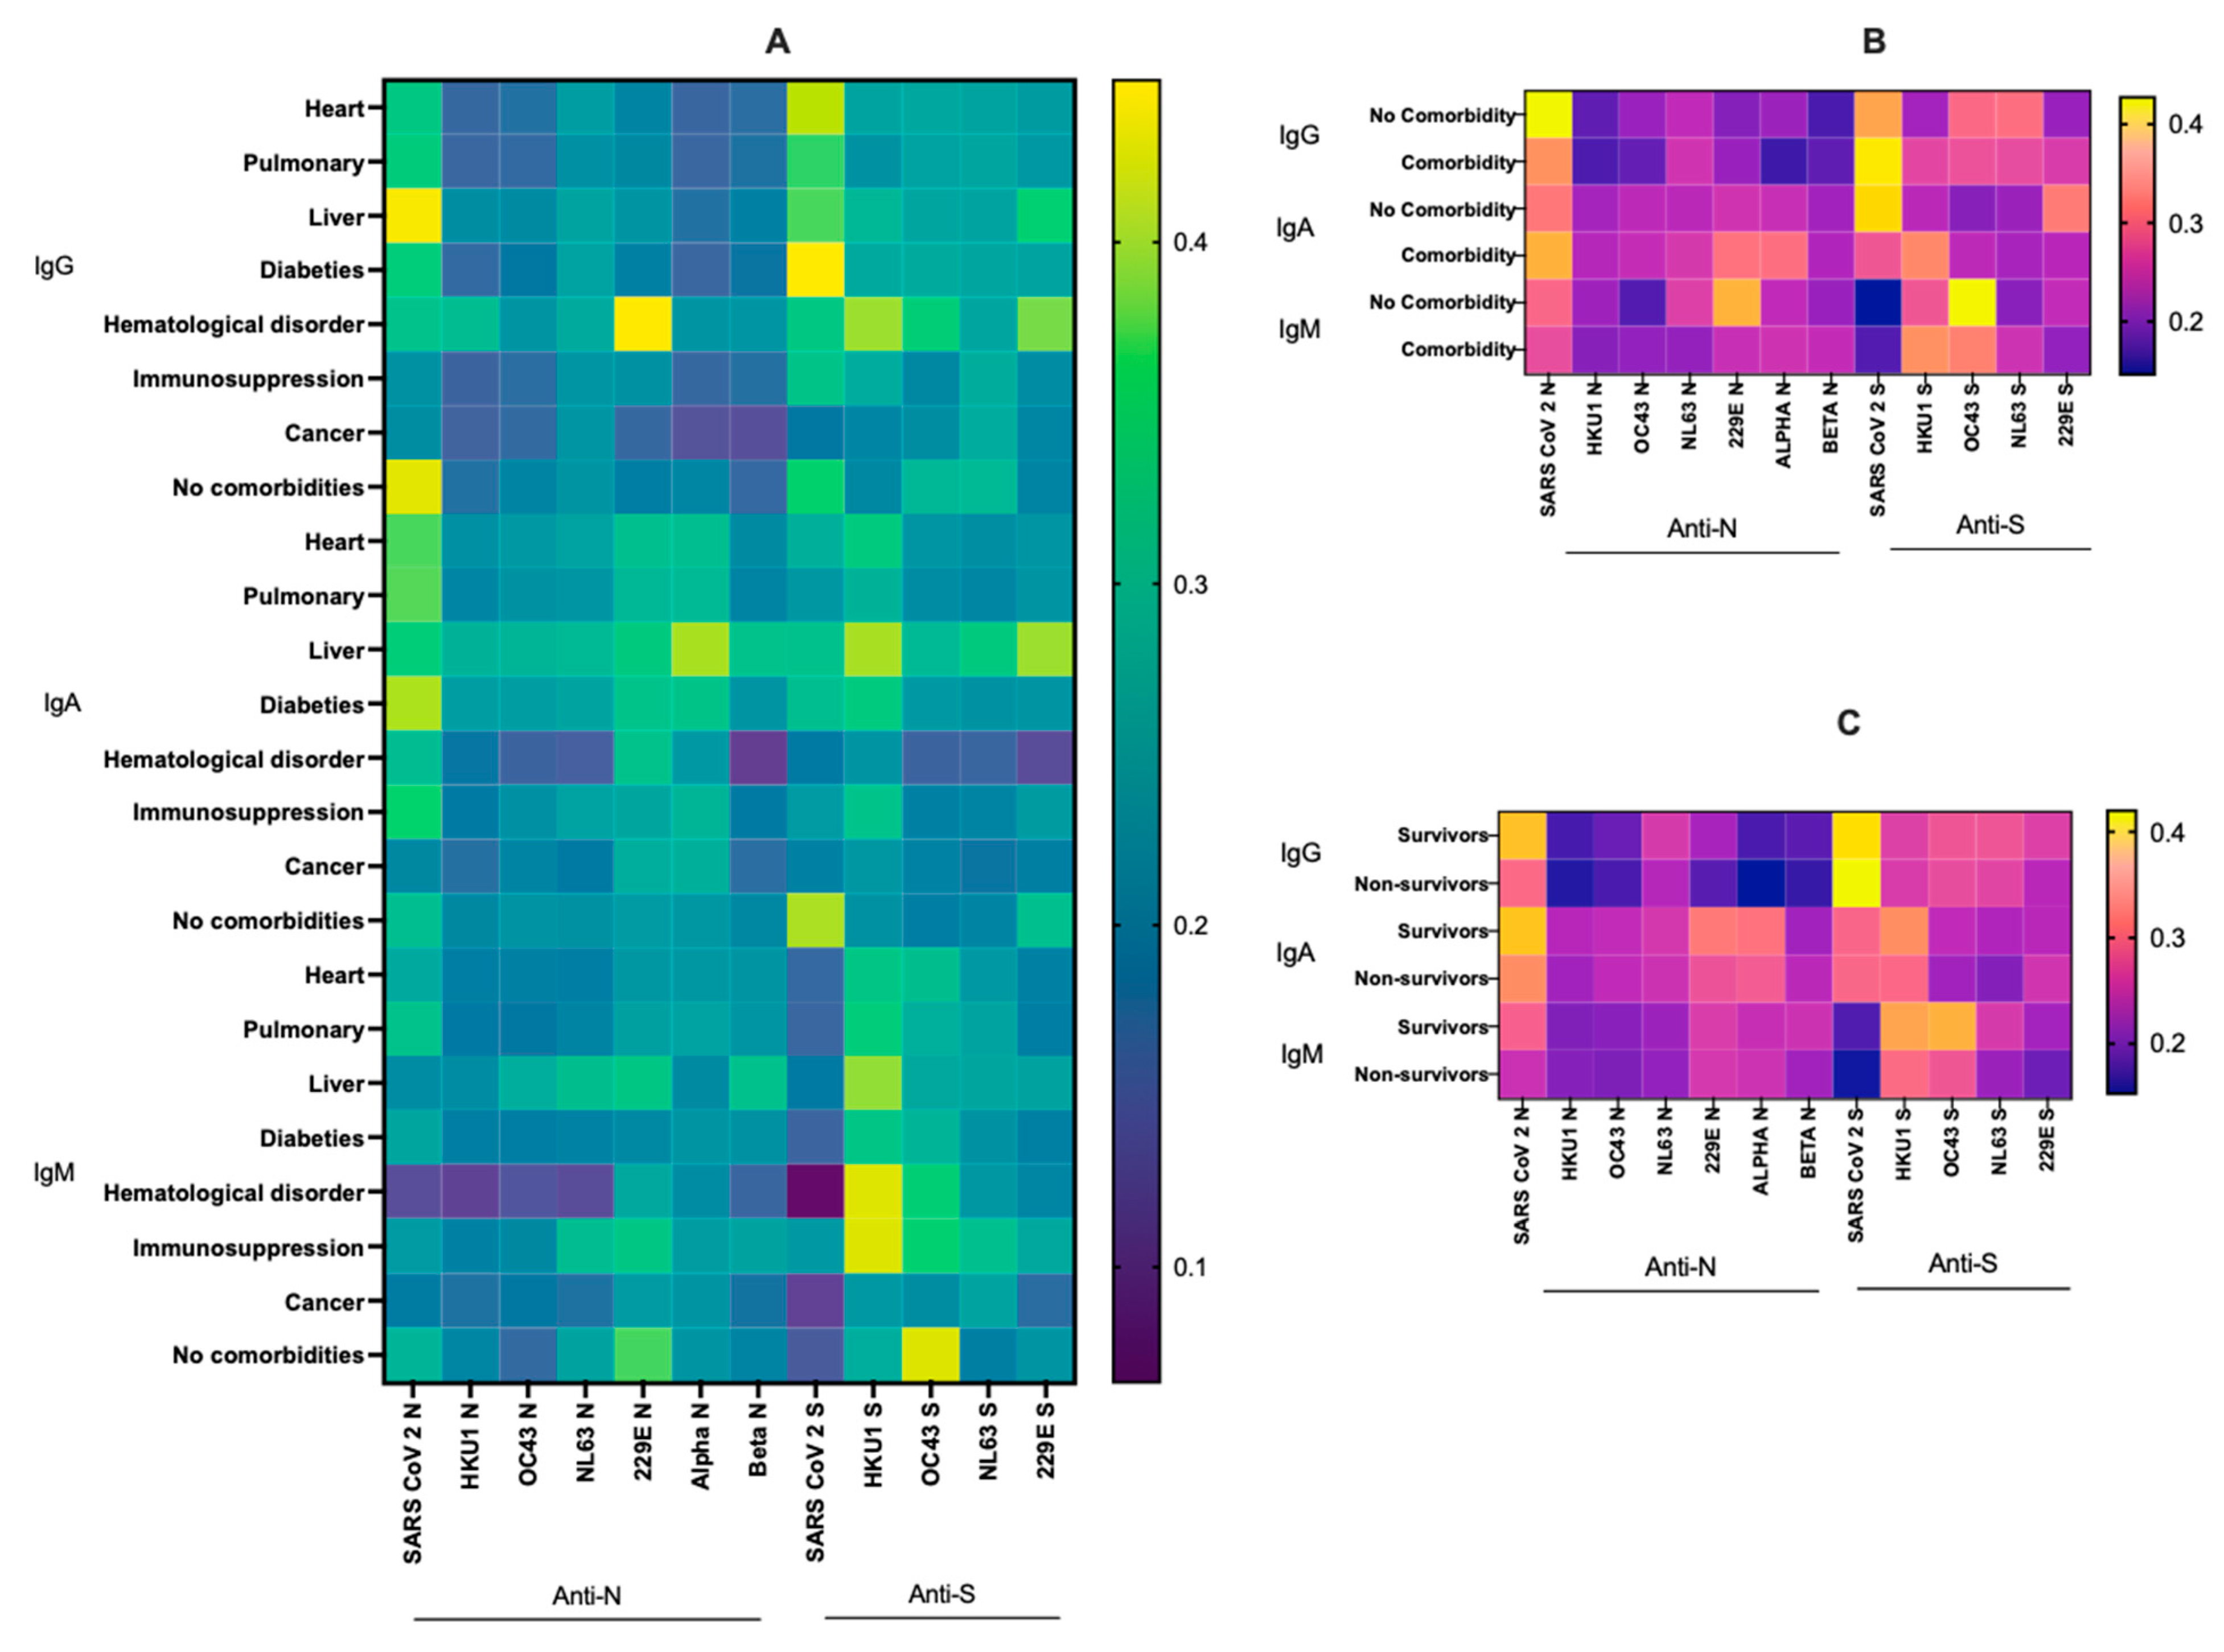
3.4. Relationship between Virus-Specific Ab Levels, Survival and Various Comorbidities

A comparison of SARS-CoV-2- and CCCoV-specific Ab levels for patients with and without comorbidities yielded inconsistent results, with inversely correlated N and S Ab titers noted in some cases (Figure 5B and Figure S4). Further analysis of the data based on individual comorbidities demonstrated that samples from patients with hematological diseases, cancer and/or immunosuppression generally resulted in the lowest levels of SARS-CoV-2 and CCCoV N/S protein-specific IgG/IgA/IgM Abs (Figure 5A and Figure S3). However, other comorbidities (liver disease and diabetes) were generally associated with increased Ab responses.
Further, generally, survivors had higher SARS-CoV-2 N (but not S) protein-specific Ab levels than those who died (Figure 5C and Figure S5). Similarly, CCCoV Ab levels were slightly higher in survivors vs. non-survivors (Figure 5C). These findings suggest that efficient Ab responses to SARS-CoV-2 N protein may have significant prognostic value of patient survival in this cohort or could be reflective of differences in the underlying population.

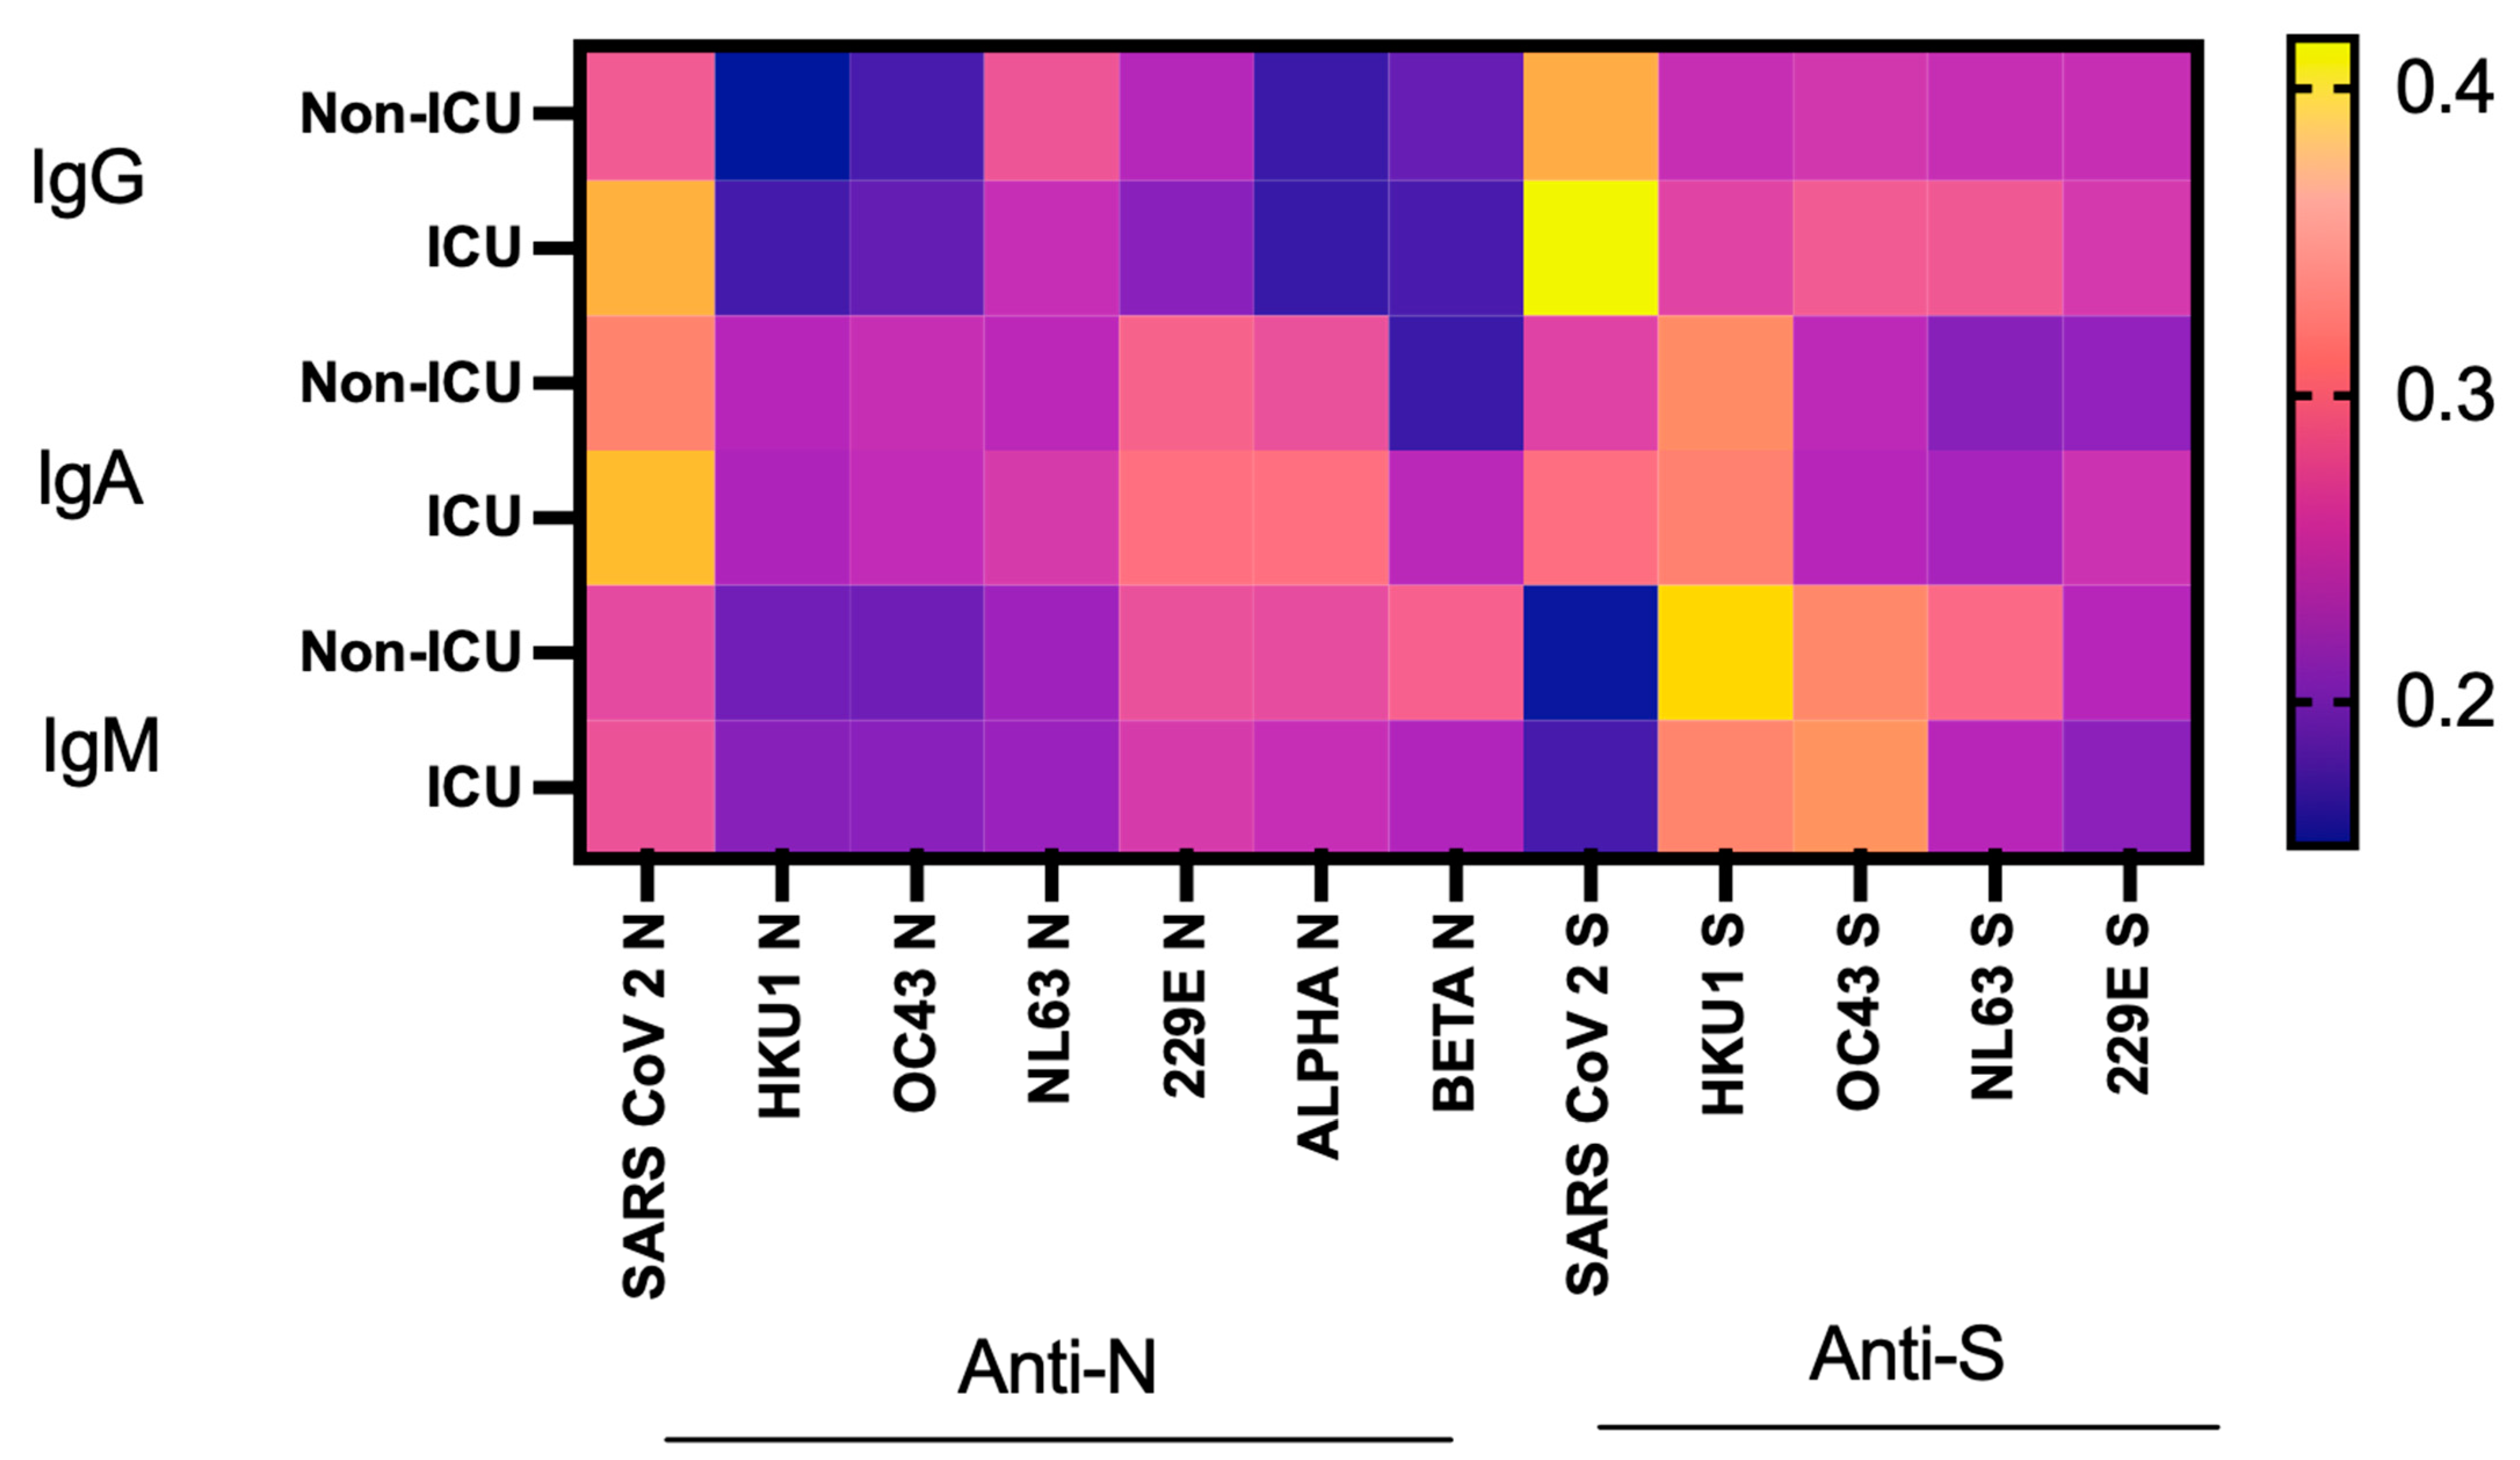
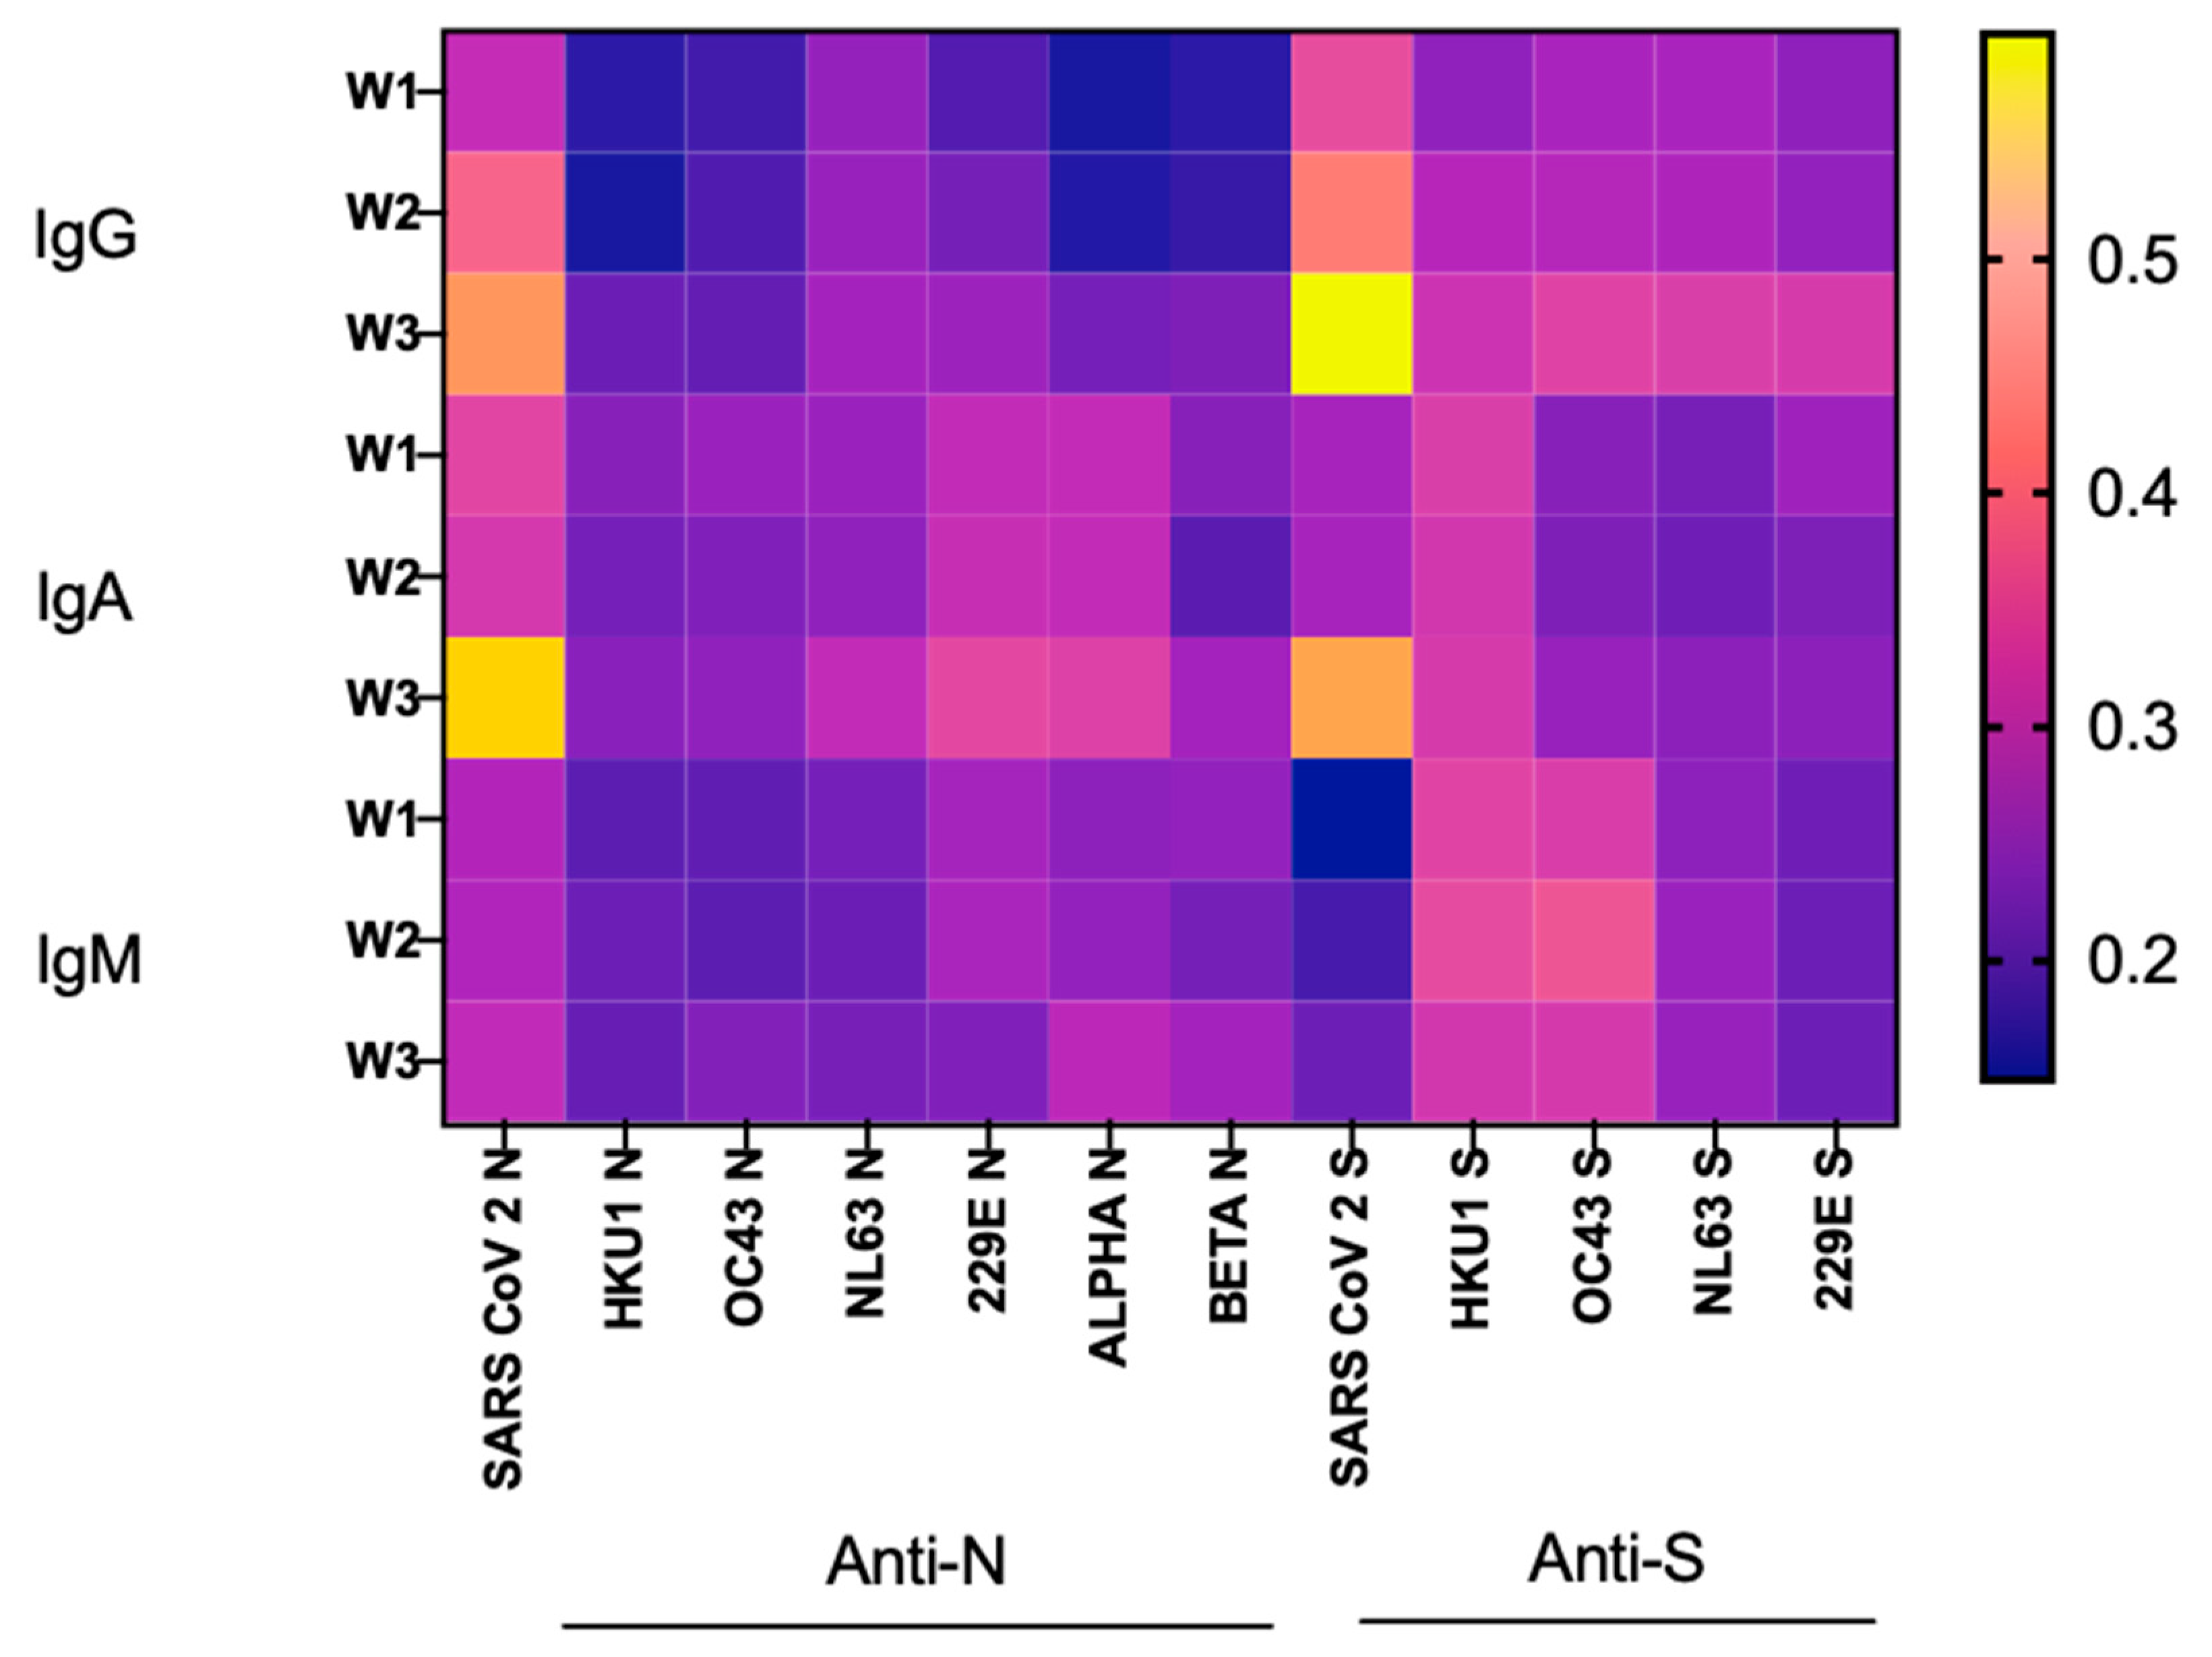
3.5. SARS-CoV-2 Ab Levels, Dynamics and the Risk of ICU Admission

We observed that increased levels of SARS-CoV-2 N/S protein-specific IgG/IgA/IgM Abs among COVID-19 positive patients were associated with an increased risk of ICU admission (Figure 6 and Figure S6). This suggests that increased Ab levels in the patients may be due to higher levels of SARS-CoV-2 replication and COVID-19 severity. Variable levels of CCCoV-specific Ab levels were observed among ICU-admitted and non-ICU patients.
We also compared the dynamics of SARS-CoV-2 N/S protein-specific IgG/IgA/IgM Ab responses and observed that the Ab levels increased gradually from week 1 (W1) to week 3 (W3) (Figure 7 and Figure S7). This was least pronounced for IgM Abs, which is consistent with the fact that this Ab isotype peaks earlier than IgG and IgA. Although the levels of CCCoV N/S protein-specific Abs remained low throughout the observation period, there was a slight increase in W3, mainly for IgG Abs (Figure 7). Of interest, we observed slightly increased levels of HKU1 and OC43 betaCoVs S protein-specific IgM Abs (Figure 4, Figure 5, Figure 6 and Figure 7) which is likely indicative of previous or concurrent (Beta CCCoVs, HKU1 and OC43) infections and widespread circulation of these CoVs.

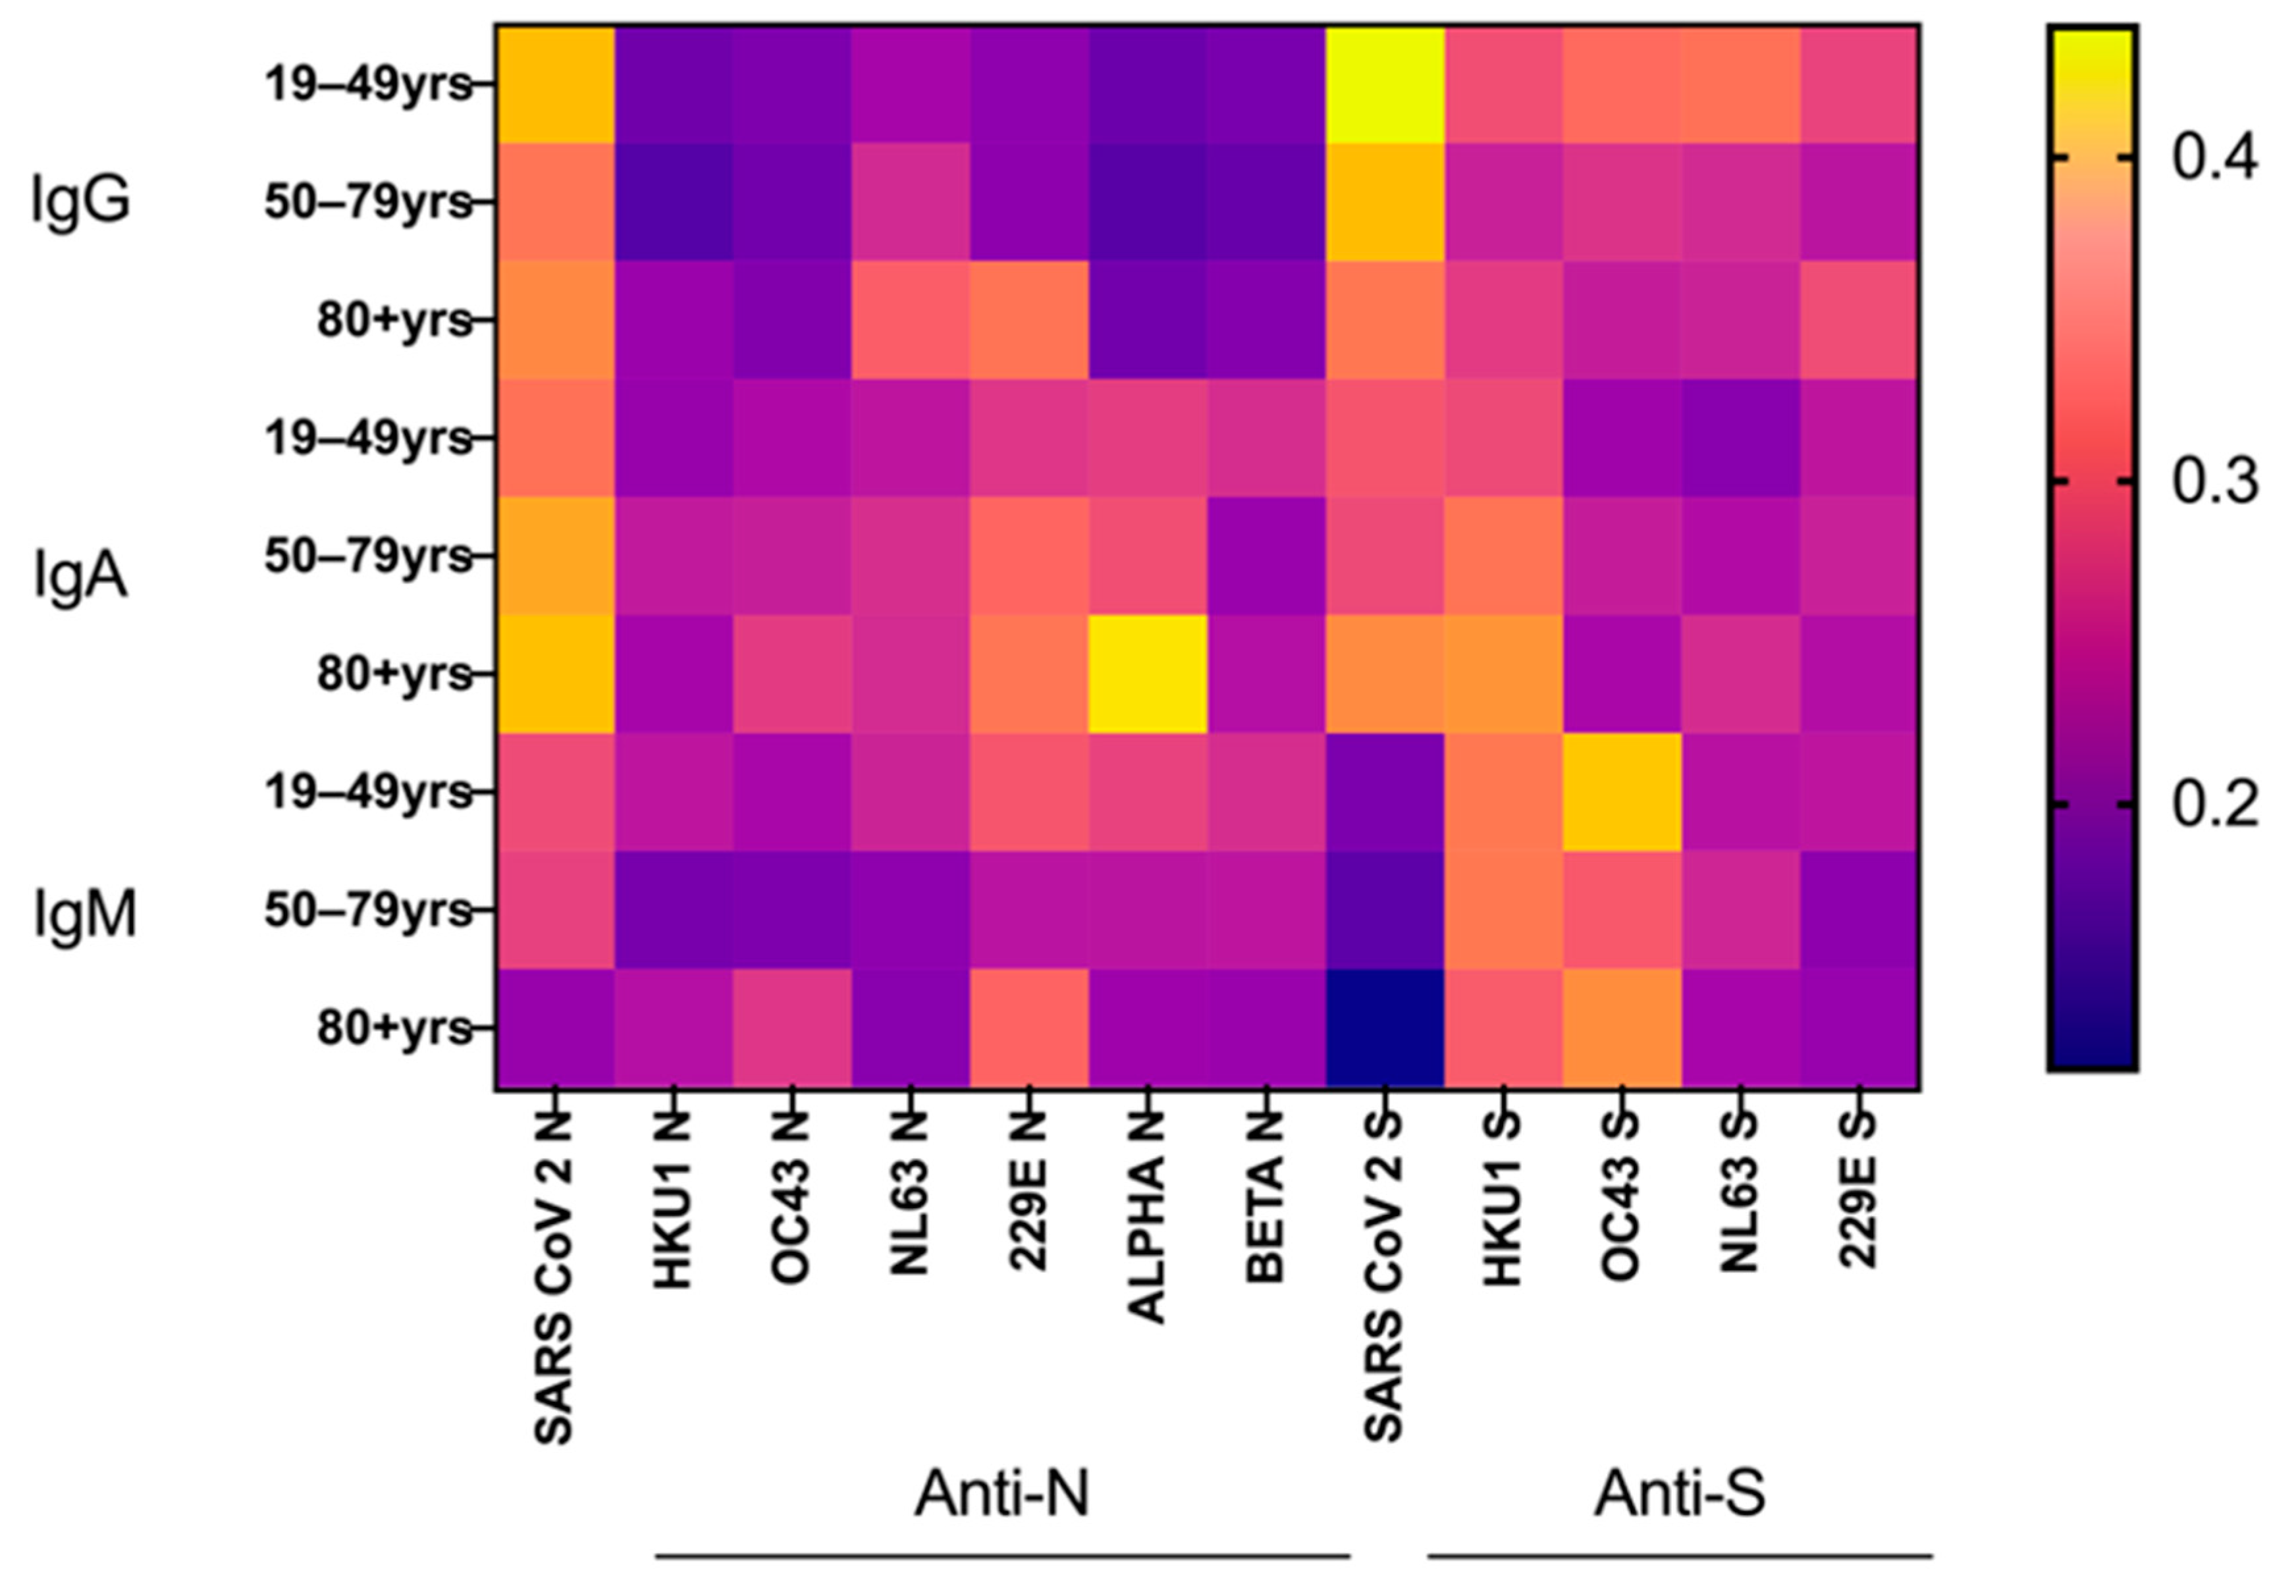
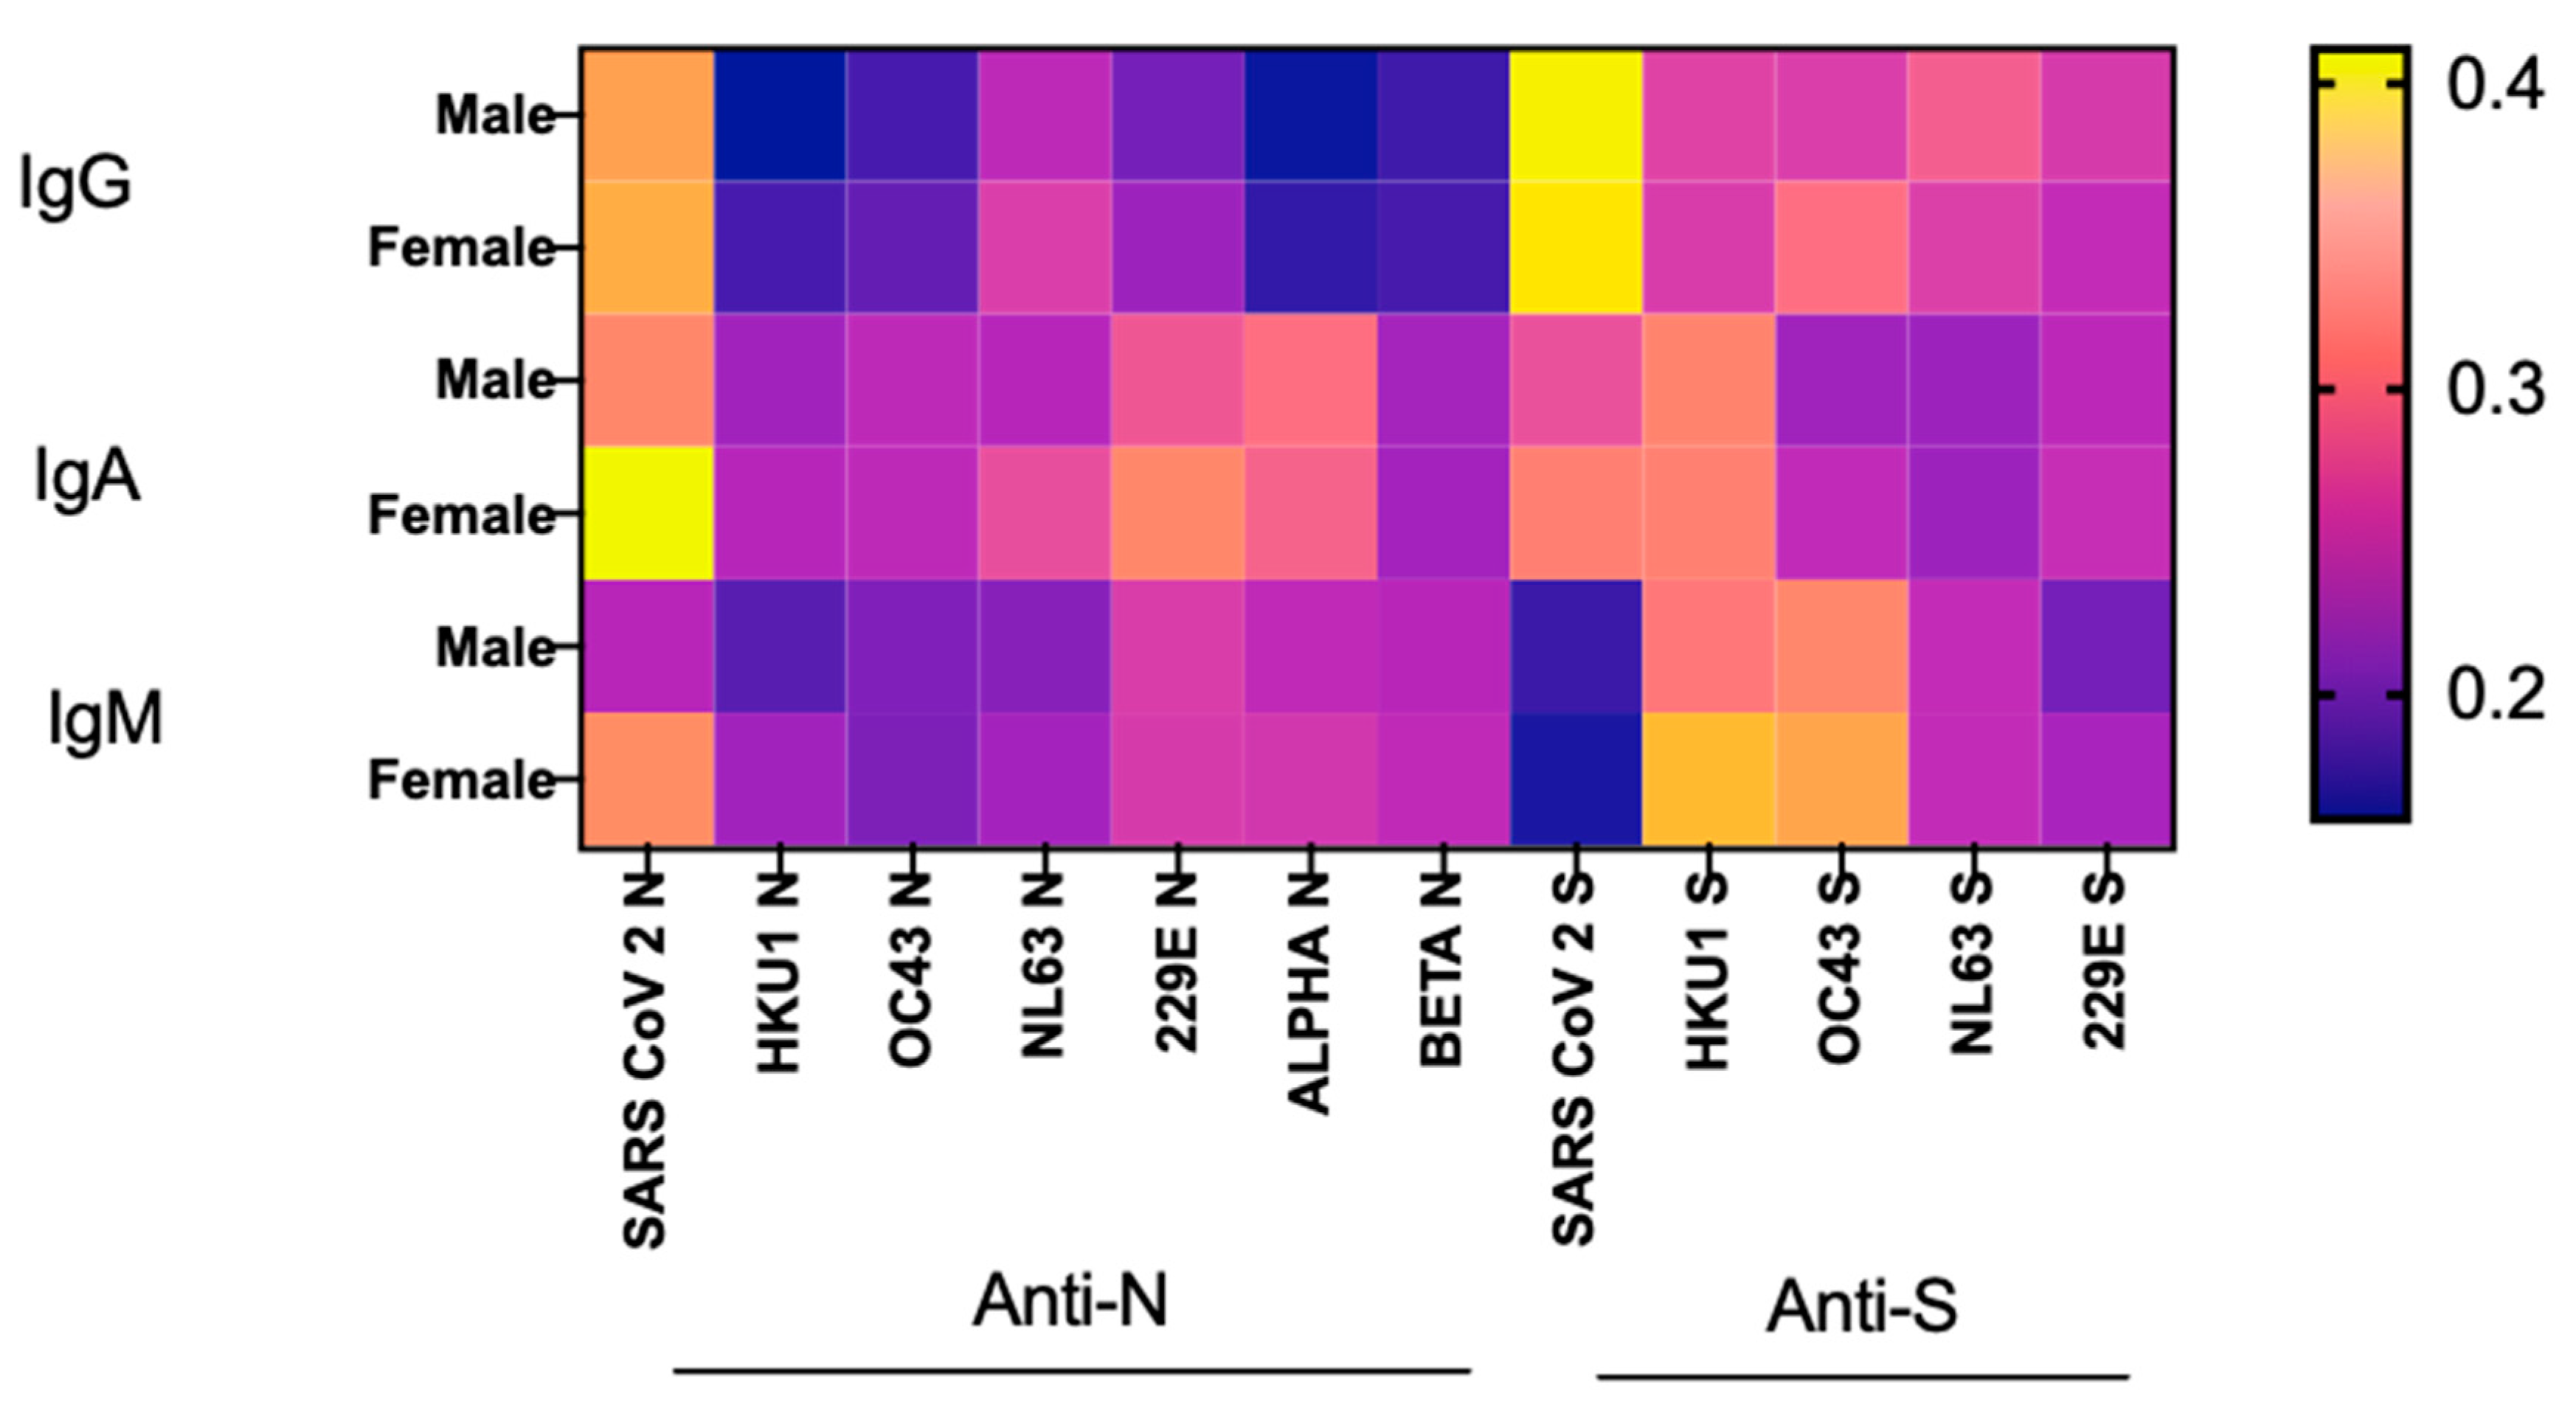
3.6. Age and Sex Effects on SARS-CoV-2 Ab Responses

Younger (19–49 years) patients had increased SARS-CoV-2 N/S protein-specific IgG Ab levels while older patients had higher IgA Ab levels (Figure 8 and Figure S8). Of interest, the oldest (80+ years) age group was associated with the lowest SARS-CoV-2 IgM and the highest IgA Ab levels suggesting that isotype specificity of Ab response may change with age. In contrast to the above, variable levels of CCCoV-specific Ab levels were observed among patients regardless of age. However, higher IgG/IgA Abs to 229E N and IgA Abs to HKU1 S were observed in the oldest patients. Finally, overall, females had higher SARS-CoV-2 S/N protein-specific IgG/IgA Ab levels compared to males (Figure 9 and Figure S9). There were no appreciable sex-related differences in CCCoV N/S protein-specific Abs levels. However, the levels of CCCoV S vs. N protein-specific Abs were generally higher likely due to the faster decay rates of N protein-specific Ab responses.

4. Discussion

This study generated the first comprehensive evidence regarding the interactions between pre-existing CCCoV Abs and SARS-CoV-2 clinical outcomes and Ab responses in hospitalized COVID-19 patients with respiratory failure. Another novel aspect of our study is the use of species-specific peptide-based ELISA to minimize/eliminate cross-reactivity observed for SARS-CoV-2 ELISA based on whole virus or full-length/truncated proteins.
Our findings demonstrated that, in this cohort, CCCoV Abs were present at variable but generally low levels that correlated positively with SARS-CoV-2 Ab responses, ruling out the inhibitory effects of CCCoV Abs on SARS-CoV-2 Ab development. Additionally, we did not find any evidence suggesting that increased COVID-19 severity was associated with higher CCCoV Ab levels as would be expected if CCCoV-driven Ab-dependent enhancement effects (as observed for some other CoVs) were present [14]. In contrast, the higher CCCoV Ab levels we observed in the NC patients compared to COVID-19 patients may be indicative of a protective role of CCCoV Abs. Thus, our data suggest that it is unlikely that the ‘original antigenic sin’ phenomenon plays a role in the development of severe COVID-19 in this cohort [12].
The youngest patients (19–49 years) had the highest SARS-CoV-2 S IgG and SARS-CoV-2 N IgM Ab levels, while the oldest patients had the lowest SARS-CoV-2 IgM/IgG but highest IgA Ab responses which is suggestive of age-specific Ab isotype prevalence. Consistent with previously published reports [15,16,17,18], advanced age and higher prevalence of various comorbidities (especially cancer and immunosuppression) were associated with decreased CCCoV/SARS-CoV-2-specific Ab levels and increased mortality among hospitalized patients. Thus, advanced age combined with deficient Ab response can serve as a reliable prognostic factor of increased mortality among severe COVID-19 patients. However, our analysis did not identify strong predictors of increased risk for ICU admission. This is likely because higher SARS-CoV-2 replication may result in an increased antigenic stimulation of Ig production masking suboptimal Ab responses in the ICU-admitted vs. non-ICU patients.
The influence of sex on SARS-CoV-2 immune responses was confirmed by our findings of higher SARS-CoV-2 Ab responses in females vs. males. This is consistent with previous findings demonstrating that females mount a more robust Ab response against SARS-CoV-2 and other pathogens [19,20,21,22] and aligns with prior evidence for an immunosuppressive role of testosterone [23].
Because CCCoVs are endemic and most humans encounter them early in childhood, it was not possible to include a randomized control group without pre-existing CCCoV Abs which is a limitation of our study. Nevertheless, our findings improve our understanding of SARS-CoV-2 Ab responses and clinical outcomes in severe COVID-19 patients as well as the role of CCCoV-induced Ab responses in these interactions.
To our knowledge, this is the first study to comprehensively evaluate the levels of SARS-CoV-2 and CCCoV N/S protein-specific IgG/IgA/IgM Abs in patients with severe COVID-19. We generated conclusive evidence that insufficient (rather than excessive) Ab response against SARS-CoV-2 is associated with increased mortality among severe COVID-19 patients. Furthermore, our findings confirm that while CCCoV-specific Ab responses are generally present at low levels in this group of patients, their increased levels may mediate partial cross-protection. Experimental studies are needed to mechanistically evaluate the observed interactions in appropriate preclinical models of immunological senescence and defined comorbidities.

Supplementary Materials

The following supporting information can be downloaded at https://www.mdpi.com/article/10.3390/immuno3030020/s1: Figure S1: SARS-CoV-2 S and N protein-specific IgG, IgA and IgM Ab titers in NC (non-COVID)- and SARS-CoV-2-infected patients with variable COVID-19 severity (S1, S2, S3). Differences were considered significant at a p-value < 0.05 (*), <0.01 (**), <0.001 (***), <0.0001 (****); Figure S2: A correlation analysis of IgG, IgA and IgM Ab responses to the spike and N proteins of SARS-CoV-2 and CCCoVs; Figure S3: SARS-CoV-2 S and N protein-specific IgG, IgA and IgM Ab titers in SARS-CoV-2-infected patients with and without comorbidities; Figure S4: SARS-CoV-2 S and N peptide-specific IgG, IgA and IgM Ab titers in SARS-CoV-2-infected patients with different comorbidities; Figure S5: SARS-CoV-2 S and N protein-specific IgG, IgA and IgM Ab titers in surviving and deceased SARS-CoV-2-infected patients. Differences were considered significant at a p-value < 0.05 (*), <0.01 (**), <0.001 (***); Figure S6: SARS-CoV-2 S and N protein-specific IgG, IgA and IgM Ab titers in ICU-admitted and non-ICU SARS-CoV-2-infected patients. Differences were considered significant at a p-value < 0.05 (*), <0.01 (**); Figure S7: Dynamics of SARS-CoV-2 S and N peptide-specific IgG, IgA and IgM Ab titers in SARS-CoV-2-infected patients. Differences were considered significant at a p-value < 0.05 (*), <0.01 (**), <0.001 (***), <0.0001 (****) (W1, week 1; W2, week 2; W3, week 3); Figure S8: SARS-CoV-2 S and N peptide-specific IgG, IgA and IgM Ab titers in SARS-CoV-2-infected patients of different age groups. Differences were considered significant at a p-value < 0.05 (*), <0.01 (**), <0.001 (***), <0.001 (***); Figure S9: SARS-CoV-2 S and N peptide-specific IgG, IgA and IgM Ab titers in SARS-CoV-2-infected male and female patients. Differences were considered significant at a p-value < 0.05 (*), <0.01 (**), <0.001 (***). Table S1: Virus-specific polyclonal rabbit antisera and normal rabbit serum; Table S2: HRP-conjugated Anti-Human IgG, IgA or IgM; Table S3: Death cause.

Author Contributions

Funding acquisition and conceptualization: E.M.O., L.J.S. and A.N.V. Project supervision: A.N.V. Methodology: A.N.V., B.A. and S.A.R. Investigation: B.A. Data analysis: B.A., A.N.V., M.A. and S.F. Patient recruitment and biorepository establishment: J.S.B. and J.C.H. First draft—writing and editing: B.A. and A.N.V. Manuscript critical review: E.M.O., L.J.S., J.S.B., J.O.A., S.A.R., S.F., M.A., M.P.R., D.M.J. and S.-L.L. All authors have read and agreed to the published version of the manuscript.

Funding

This research was supported by the National Cancer Institute of the NIH (award No U54CA260582).

Institutional Review Board Statement

All methods were carried out in accordance with relevant guidelines and regulations. This study was approved by the Institutional Review Board (IRB # 2020H0198) of the Ohio State University. Samples were obtained from the Ohio State University Intensive Care Unit Registry (BuckICU, IRB approval #2020H0175) biorepository. This biorepository collects longitudinal biospecimens and associated clinical data from hospitalized patients with respiratory failure.

Informed Consent Statement

Informed consent was obtained from all subjects involved in the study. Written informed consent has been obtained from the patient(s) to publish this paper.

Data Availability Statement

The data that support the findings of this study are available from the corresponding author upon reasonable request.

Acknowledgments

We are grateful to the BUCK-ICU cohort study participants and to the clinical and technical staff who provided support with sample collection, processing and distribution. We also thank Maryssa Kick and Maria Chellis for technical support.

Conflicts of Interest

The authors declare no conflict of interest. The funders had no role in the design of the study; in the collection, analyses or interpretation of data; in the writing of the manuscript; or in the decision to publish the results.

References

  1. Walker, P.J.; Siddell, S.G.; Lefkowitz, E.J.; Mushegian, A.R.; Dempsey, D.M.; Dutilh, B.E.; Harrach, B.; Harrison, R.L.; Hendrickson, R.C.; Junglen, S.; et al. Changes to virus taxonomy and the International Code of Virus Classification and Nomenclature ratified by the International Committee on Taxonomy of Viruses (2019). Arch. Virol. 2019, 164, 2417–2429. [Google Scholar] [CrossRef]
  2. Chan, J.F.; To, K.K.; Tse, H.; Jin, D.Y.; Yuen, K.Y. Interspecies transmission and emergence of novel viruses: Lessons from bats and birds. Trends Microbiol. 2013, 21, 544–555. [Google Scholar] [CrossRef]
  3. Chen, Y.; Liu, Q.; Guo, D. Emerging coronaviruses: Genome structure, replication, and pathogenesis. J. Med. Virol. 2020, 92, 418–423. [Google Scholar] [CrossRef]
  4. Lin, C.-Y.; Wolf, J.; Brice, D.C.; Sun, Y.; Locke, M.; Cherry, S.; Castellaw, A.H.; Wehenkel, M.; Crawford, J.C.; Zarnitsyna, V.I.; et al. Pre-existing humoral immunity to human common cold coronaviruses negatively impacts the protective SARS-CoV-2 antibody response. Cell Host Microbe 2022, 30, 83–96.e84. [Google Scholar] [CrossRef]
  5. Miyara, M.; Saichi, M.; Sterlin, D.; Anna, F.; Marot, S.; Mathian, A.; Atif, M.; Quentric, P.; Mohr, A.; Claër, L.; et al. Pre-COVID-19 Immunity to Common Cold Human Coronaviruses Induces a Recall-Type IgG Response to SARS-CoV-2 Antigens Without Cross-Neutralisation. Front. Immunol. 2022, 13, 790334. [Google Scholar] [CrossRef] [PubMed]
  6. Monroe, I.; Dale, M.; Schwabe, M.; Schenkel, R.; Schenarts, P.J. The COVID-19 Patient in the Surgical Intensive Care Unit. Surg. Clin. North Am. 2022, 102, 1–21. [Google Scholar] [CrossRef] [PubMed]
  7. Wang, J.; Li, D.; Cameron, A.; Zhou, Q.; Wiltse, A.; Nayak, J.; Pecora, N.D.; Zand, M.S. IgG Against Human Betacoronavirus Spike Proteins Correlates With SARS-CoV-2 Anti-Spike IgG Responses and COVID-19 Disease Severity. J. Infect. Dis. 2022, 226, 474–484. [Google Scholar] [CrossRef] [PubMed]
  8. Wells, D.A.; Cantoni, D.; Mayora-Neto, M.; Genova, C.D.; Sampson, A.; Ferrari, M.; Carnell, G.; Nadesalingam, A.; Smith, P.; Chan, A.; et al. Human seasonal coronavirus neutralization and COVID-19 severity. J. Med. Virol. 2022, 94, 4820–4829. [Google Scholar] [CrossRef]
  9. Sagar, M.; Reifler, K.; Rossi, M.; Miller, N.S.; Sinha, P.; White, L.F.; Mizgerd, J.P. Recent endemic coronavirus infection is associated with less-severe COVID-19. J. Clin. Investig. 2021, 131, e143380. [Google Scholar] [CrossRef]
  10. Wratil, P.R.; Schmacke, N.A.; Karakoc, B.; Dulovic, A.; Junker, D.; Becker, M.; Rothbauer, U.; Osterman, A.; Spaeth, P.M.; Ruhle, A.; et al. Evidence for increased SARS-CoV-2 susceptibility and COVID-19 severity related to pre-existing immunity to seasonal coronaviruses. Cell Rep. 2021, 37, 110169. [Google Scholar] [CrossRef]
  11. Waterlow, N.R.; Leeuwen, E.V.; Davies, N.G. CMMID COVID-19 Working Group; Flasche, S.; Eggo, R.M. How immunity from and interaction with seasonal coronaviruses can shape SARS-CoV-2 epidemiology. medRxiv 2021. [Google Scholar] [CrossRef]
  12. Lista, F.; Peragallo, M.S.; Biselli, R.; De Santis, R.; Mariotti, S.; Nisini, R.; D’Amelio, R. Have Diagnostics, Therapies, and Vaccines Made the Difference in the Pandemic Evolution of COVID-19 in Comparison with “Spanish Flu”? Pathogens 2023, 12, 868. [Google Scholar] [PubMed]
  13. Vlasova, A.N.; Zhang, X.; Hasoksuz, M.; Nagesha, H.S.; Haynes, L.M.; Fang, Y.; Lu, S.; Saif, L.J. Two-way antigenic cross-reactivity between severe acute respiratory syndrome coronavirus (SARS-CoV) and group 1 animal CoVs is mediated through an antigenic site in the N-terminal region of the SARS-CoV nucleoprotein. J. Virol. 2007, 81, 13365–13377. [Google Scholar] [CrossRef] [PubMed]
  14. Hohdatsu, T.; Yamada, M.; Tominaga, R.; Makino, K.; Kida, K.; Koyama, H. Antibody-dependent enhancement of feline infectious peritonitis virus infection in feline alveolar macrophages and human monocyte cell line U937 by serum of cats experimentally or naturally infected with feline coronavirus. J. Vet. Med. Sci. 1998, 60, 49–55. [Google Scholar] [CrossRef]
  15. Biswas, M.; Rahaman, S.; Biswas, T.K.; Haque, Z.; Ibrahim, B. Association of Sex, Age, and Comorbidities with Mortality in COVID-19 Patients: A Systematic Review and Meta-Analysis. Intervirology 2021, 64, 36–47. [Google Scholar] [CrossRef]
  16. Djaharuddin, I.; Munawwarah, S.; Nurulita, A.; Ilyas, M.; Tabri, N.A.; Lihawa, N. Comorbidities and mortality in COVID-19 patients. Gac. Sanit. 2021, 35 (Suppl. 2), S530–S532. [Google Scholar] [CrossRef]
  17. Henkens, M.; Raafs, A.G.; Verdonschot, J.A.J.; Linschoten, M.; van Smeden, M.; Wang, P.; van der Hooft, B.H.M.; Tieleman, R.; Janssen, M.L.F.; Ter Bekke, R.M.A.; et al. Age is the main determinant of COVID-19 related in-hospital mortality with minimal impact of pre-existing comorbidities, a retrospective cohort study. BMC Geriatr. 2022, 22, 184. [Google Scholar] [CrossRef]
  18. Mahmoud, M.; Carmisciano, L.; Tagliafico, L.; Muzyka, M.; Rosa, G.; Signori, A.; Bassetti, M.; Nencioni, A.; Monacelli, F. Patterns of Comorbidity and In-Hospital Mortality in Older Patients With COVID-19 Infection. Front. Med. 2021, 8, 726837. [Google Scholar] [CrossRef]
  19. Arnold, C.G.; Libby, A.; Vest, A.; Hopkinson, A.; Monte, A.A. Immune mechanisms associated with sex-based differences in severe COVID-19 clinical outcomes. Biol. Sex Differ. 2022, 13, 7. [Google Scholar] [CrossRef]
  20. Kwon, H.; Schafer, J.M.; Song, N.J.; Kaneko, S.; Li, A.; Xiao, T.; Ma, A.; Allen, C.; Das, K.; Zhou, L.; et al. Androgen conspires with the CD8(+) T cell exhaustion program and contributes to sex bias in cancer. Sci. Immunol. 2022, 7, eabq2630. [Google Scholar] [CrossRef]
  21. Qi, S.; Ngwa, C.; Morales Scheihing, D.A.; Al Mamun, A.; Ahnstedt, H.W.; Finger, C.E.; Colpo, G.D.; Sharmeen, R.; Kim, Y.; Choi, H.A.; et al. Sex differences in the immune response to acute COVID-19 respiratory tract infection. Biol. Sex Differ. 2021, 12, 66. [Google Scholar] [CrossRef] [PubMed]
  22. Schurz, H.; Salie, M.; Tromp, G.; Hoal, E.G.; Kinnear, C.J.; Möller, M. The X chromosome and sex-specific effects in infectious disease susceptibility. Hum. Genom. 2019, 13, 2. [Google Scholar] [CrossRef] [PubMed]
  23. Furman, D.; Hejblum, B.P.; Simon, N.; Jojic, V.; Dekker, C.L.; Thiébaut, R.; Tibshirani, R.J.; Davis, M.M. Systems analysis of sex differences reveals an immunosuppressive role for testosterone in the response to influenza vaccination. Proc. Natl. Acad. Sci. USA 2014, 111, 869–874. [Google Scholar] [CrossRef] [PubMed]
Figure 1. Characteristics of the study cohort. (A) No. of patients enrolled between May 2020 and December 2021. Vertical green lines indicate the timing when primary and booster vaccine doses became available for high-risk populations (65+ years). (B) Patient SARS-CoV-2 infection status and mortality rates among positive and negative subjects. (C) SARS-CoV-2 infection status, mortality and ICU admission rates and sex distribution among SARS-CoV-2-positive patients. (D) Demographic and clinical variables among SARS-CoV-2-positive patients.
Immuno 03 00020 g001
Figure 2. SARS-CoV-2 and CCCoV S and N protein peptide antigenicity, localization and specificity. (A) SARS-CoV-2 and CCCoV S and N protein peptide antigenicity was evaluated using indirect ELISA. All peptides were screened with a panel of human pre-pandemic (Negative) and SARS-CoV-2 serum samples from SARS-CoV-2-positive cases (Positive) for SARS-CoV-2 peptide validation or with commercial (Sino Biologicals/Native antigen) OC43-, HKU1-, 229E- and NL63-specific rabbit antisera (Positive) and normal rabbit serum (Negative) for CCCoV peptides. A heatmap shows raw OD650 values generated with the positive and negative sera. The peptides for which optimal positive/negative ratio values were selected for ELISA development are highlighted in green color (B). Percent (%) identity between SARS-CoV-2 and CCCoV spike (C) and nucleoprotein (D). Domain abbreviations: NTD, N-terminal domain; RBD, receptor-binding domain; S1/S2, furin cleavage site; FP, fusion peptide; HR1/HR2, heptad repeat regions. N, nucleocapsid; S, spike. Peptide abbreviations: HKU1 RBD, OC43 RBD, NL63 RBD, 229E RBD, SARS-CoV-2 spike, HKU1 nucleocapsid, OC43 nucleocapsid, NL63 nucleocapsid, 229E nucleocapsid and SARS-CoV-2 nucleocapsid (E). Cross-reactivity testing for the selected SARS-CoV-2/CCCoV S and N peptides with a panel of virus-/protein-specific positive and negative sera using indirect ELISA. Each plot represents data (OD650 values) for individual peptide reactivity with virus-/protein-specific positive and negative sera.
Immuno 03 00020 g002
Figure 3. Survival analysis among SARS-CoV-2-infected patients from three different age groups (19–49 years, 50–79 years and 80+ years). The dotted lines represent the median survival time. Shaded area represents a 95% confidence interval.
Immuno 03 00020 g003
Figure 4. CCCoV and SARS-CoV-2 S and N peptide-specific IgG, IgA and IgM Ab levels (presented as mean OD650 values) in NC (non-COVID) and SARS-CoV-2-infected patients with variable COVID-19 severity (S1, S2 and S3).
Immuno 03 00020 g004
Figure 5. CCCoV and SARS-CoV-2 S and N protein-specific IgG, IgA and IgM Ab levels (presented as OD650 values) in SARS-CoV-2-infected patients with different comorbidities (A), with and without comorbidities (B), in surviving and dying SARS-CoV-2 infected patients (C).
Immuno 03 00020 g005
Figure 6. CCCoV and SARS-CoV-2 S and N peptide-specific IgG, IgA and IgM Ab levels (presented as OD650 values) in ICU-admitted and non-ICU SARS-CoV-2-infected patients.
Immuno 03 00020 g006
Figure 7. Dynamics of CCCoV and SARS-CoV-2 S and N peptide-specific IgG, IgA and IgM Ab levels (presented as OD650 values) in SARS-CoV-2-infected patients. W1, week 1; W2, week 2; W3, week 3.
Immuno 03 00020 g007
Figure 8. CCCoV and SARS-CoV-2 S and N peptide-specific IgG, IgA and IgM Ab levels (presented as OD650 values) in SARS-CoV-2-infected patients of different age groups.
Immuno 03 00020 g008
Figure 9. CCCoV and SARS-CoV-2 S and N peptide-specific IgG, IgA and IgM Ab levels (presented as OD650 values) in SARS-CoV-2-infected male and female patients.
Immuno 03 00020 g009
Table 1. Peptides targeting highly antigenic nucleoprotein (N) and spike (S) protein epitopes of SARS-CoV-2 and CCCoVs.
Coronavirus Species, Peptide LocationSequenceAntigenicity ScorePeptide PositionHydrophobicity (%)Source
HKU1 NGSKLELVKRESEADSPVKDV21.2324–34335Biomatik
OC43 NAEDISLLKKMDEPYTEDTSE26428–44730Biomatik
NL63 NPRADKPSQLKKPRWKRVPTR21.6223–24240Biomatik
229E NSSETKEQKHEMQKPRWKRQP22.2234–25320Biomatik
SARS-CoV-2 NHIDAYKTFPPTEPKKDKKKK 21.8356–37530Biomatik
ALPHA NVANGVKAKGYPQFAELVPST NA286–32250Biomatik
BETA N MLKLGTSDPQFPILAELAPT NA303–32260Biomatik
HKU1 SSSRNESWHFDKSEPLCLFKK12.4168–18730Biomatik
OC43 SLNCPLDPRLKGSFNDRDTGP15.819–3835Biomatik
NL63 SIYNRVKSGSPGDSSWHIYLK9.4527–54630Biomatik
229E SSWSDGDVITGVPKPVEGVSS10415–43440Biomatik
SARS-CoV-2 SYDPLQPELDSFKEELDKYFK19.61120–113935Biomatik
Table 2. Reference sera used for peptide characterization and ELISA validation.
SARS-CoV-2 seronegative serum samplesNegative serum samples (n = 7) from healthy individuals prior to 2019 (provided by Shan-Lu Liu)—SARS-CoV-2 N and S protein ELISA development and validation.
Commercial pre-pandemic normal human serum (SARS-CoV-2 Neutralizing Antibody-Negative Pre-pandemic Human Serum, Cayman chemicals, Item No. 31569)—ELISA validation and as a negative control sample to determine cutoff values for each SARS-CoV-2 Ab test.
Seventy-eight SARS-CoV-2 seronegative samples—SeroNet Blinded Panel.
SARS-CoV-2 seropositive serum samplesThirty samples from 10 COVID-19 patients from BUCK-ICU biorepository (3 longitudinal samples per patient) with variable disease severity—SARS-CoV-2 N and S protein ELISA development and validation.
Thirty-one SARS-CoV-2 seropositive samples—SeroNet Blinded Panel.
Virus/antigen-specific and negative rabbit serum samplesCommercial CCCoV-specific and negative rabbit antisera (Table S1) were used for CCCoV N and S protein ELISA development and validation.
Table 3. Sensitivity and specificity of SARS-CoV-2 S- and N-protein ELISA.
TestSARS-CoV-2
(N)
SARS-CoV-2
(S)
Sensitivity95.08%96.77%
Specificity97.65%100%
Accuracy96.58%98.63%
Table 4. Median age of SARS-CoV-2 positive patients associated with different clinical and demographic variables.
Clinical and Demographic VariablesPatient Median Agep Value
Survivors (n = 46)610.32
Non-survivors (n = 28)62
Male (n = 42)610.44
Female (n = 32)63
No comorbidity (n = 8)360.001
Comorbidity (n = 66)63
Table 5. Mortality rates among patients with and without comorbidities.
ComorbidityPatients
Non-survivors, %Survivors, %
Heart disease (n = 76)3961
Pulmonary disease (n = 37)4159
Liver disease (n = 5)8020
Diabetes (n = 39)4159
Hematological disorder (n = 3)0100
Immunosuppression (n = 12)4258
Cancer (n = 11)5545
No comorbidities (n = 8)2575
Disclaimer/Publisher’s Note: The statements, opinions and data contained in all publications are solely those of the individual author(s) and contributor(s) and not of MDPI and/or the editor(s). MDPI and/or the editor(s) disclaim responsibility for any injury to people or property resulting from any ideas, methods, instructions or products referred to in the content.

